Article

Origin Traceability and Genetic Structure Analysis of Picea abies Based on Nuclear Microsatellite Markers


by
Ilona Kavaliauskienė
1,*,
Darius Danusevičius
2,
Rūta Kembrytė-Ilčiukienė
2 and
Virgilijus Baliuckas
1
1
Department of Forest Genetics and Tree Breeding, Institute of Forestry, Lithuanian Research Centre for Agriculture and Forestry, Liepų St. 1, LT-53101 Kaunas, Lithuania
2
Agriculture Academy, Vytautas Magnus University, Studentų Str. 11, LT-53361 Akademija, Lithuania
*
Author to whom correspondence should be addressed.
Diversity 2026, 18(6), 322; https://doi.org/10.3390/d18060322
Submission received: 15 April 2026 / Revised: 25 May 2026 / Accepted: 26 May 2026 / Published: 28 May 2026
(This article belongs to the Special Issue Population Genetics of Animals and Plants—2nd Edition)

Abstract

As pressures from climate change and global trade increase, developing cost-effective tools for origin tracking becomes essential to ensure the traceability and adaptability of forest reproductive material (FRM). Our objectives were (a) to test the efficiency of a set of nuclear microsatellite loci (nSSR) for revealing the genetic structures identified by high-input sequencing studies and (b) to verify this set of nSSR loci for genetic assignment of commercial seed lots into reference regions. We used 12 nSSR markers to genotype 220 trees from 11 populations representing the eastern Baltic, Scandinavian and southern European ranges of Norway spruce. The results showed that the populations from the eastern Baltic range had relatively higher allelic diversity parameters. The Bayesian clustering revealed a geographically consistent genetic structuring of Norway spruce populations by distinguishing the eastern Baltic from southern European and Scandinavian populations. GENECLASS analysis correctly assigned Lithuanian commercial seed lots into the Lithuanian reference region with markedly higher probability than to any other reference regions. Our study demonstrates promising results for origin identification of Norway spruce, particularly in contexts where high-resolution genomic approaches remain financially or logistically inaccessible.

1. Introduction

As a climax species, Norway spruce (Picea abies (L.) H. Karst.) is one of the most sensitive northerly tree species to global warming stressors. For that reason, most of the northern European countries are conducting long-term breeding programmes [1,2,3,4,5] to enhance the adaptation of Norway spruce populations [6]. However, over the past decade, the concerted pressure of global warming stressors on Norway spruce forests has markedly intensified, as shown by Marini et al. [7]. This called for new solutions to strengthen the resilience of Norway spruce forests. Assisted migration was suggested as a novel solution [8]. The assisted migration strategy leads to initiatives of moving the forest reproductive material of Norway spruce, raising the need for verifying the origin of FRM. The unguided transfer of FRM may markedly reduce the adaptedness of Norway spruce forests.
Norway spruce is a widespread and wind-pollinated conifer [9,10] with extensive gene flow, contributing to high within-population genetic diversity and low population differentiation [11,12,13,14]. Norway spruce populations at the range margins experience relatively lower gene flow, stronger effects of genetic drift and natural selection raising the genetic differentiation [15,16,17]. While gene flow complicates fine-scale origin traceability of forest reproductive material (FRM) in Norway spruce, this challenge can be addressed by identifying zones of shared gene pools using DNA markers. Clinal variation in phenology traits plays a key role in flowering synchrony and, in this way, the formation of zones of shared gene pools in Norway spruce [18].
In regions with unfavourable climatic conditions, such as high latitudes and altitudes, seed production is often sporadic or unreliable. As a result, FRM has historically been translocated across regions to meet forestry demands [19,20,21]. For centuries, FRM was regularly traded among European countries [22,23]. Up to now, comprehensive FRM trade statistics at the European level have been largely unavailable. Ensuring the quality and appropriate use of FRM is a fundamental aspect of European forest policy [24,25,26]. Despite this, detailed information on trade volumes, production chains, and trading routes remains scarce [23]. Thus, FRM translocations, while addressing short-term regeneration needs, can have long-term genetic consequences by altering local population structures and potentially introducing maladaptive alleles [27,28]. Previous studies often overlooked translocations, assuming samples were of local origin [29,30].
To mitigate global warming threats, assisted migration—strategically relocating FRM to more suitable climatic zones—has been proposed as an adaptation measure [31,32,33]. However, misguided FRM transfers can result in poor adaptation [27,28,34]. In contrast, guided FRM transfers can support adaptation and genetically enrich the gene pools of small and fragmented populations that are particularly prone to genetic load and inbreeding depression. For long-lived species such as forest trees, however, evaluating the long-term impacts of translocations remains a significant challenge [28,35,36,37,38,39,40].
Norway spruce across the Baltic–Nordic distribution range displays a pronounced latitudinal gradient in adaptive traits, whereby northward transfers of provenances delay bud growth onset and cessation, leading to relatively lower spring frost damage and taller trees [13,41,42,43]. For example, Belarusian and Lithuanian seed sources transferred northwards to Sweden and Estonia have demonstrated superior height growth over local provenances, whereas the frequent import of Swedish provenances into Germany contradicts transfer guidelines due to the generally reduced growth performance associated with early budburst and spring frost damage [44,45,46].
Despite rapid advances in genome-wide SNP-based approaches, their routine application in operational forestry remains limited due to cost, technical requirements, and data processing complexity, particularly in large-scale or routine applications. Several recent genomically explicit studies using chloroplast DNA, mitochondrial DNA, nuclear markers, and genome-wide association study (GWAS) approaches, together with geographically wide-range genotyping studies [30,47,48,49], have revealed the current genetic structuring of Norway spruce populations in Europe. These studies concluded that geographically consistent genetic structures are distorted by local demography and strong gene flow, leading to admixture, especially at the edges of three large genetic groups [30]. In contrast, highly variable co-dominant DNA markers, such as microsatellites (SSRs), have been widely used to study genetic structure, gene flow, hybridization, paternity analysis, and the traceability of FRM [50,51,52,53]. However, despite their extensive use, their effectiveness in reproducing large-scale genomic patterns and supporting practical applications such as origin traceability requires further evaluation. For example, studies on Norway spruce using genotyping-by-sequencing (GBS)-derived single-nucleotide polymorphisms (SNPs) have shown that the artificial transfer of forest reproductive material should be considered with caution, especially in sites with harsh climatic conditions [54].
Our ultimate goal is to develop a practical alternative for the origin certification of Norway spruce seed lots, as discussed by Finkeldey et al. [55] and Rungis et al. [56]. Considering the high cost of genome-wide genotyping, we aimed to test a more affordable approach for origin traceability using nuclear microsatellite markers (nSSRs), which are efficient for identifying zones of shared gene pools. To achieve this goal, two specific objectives were set: (a) to test the efficiency of a preselected subset of nSSR loci in revealing the genetic structures previously identified by genome-wide genotyping studies in Norway spruce [30,48,49]; and (b) to validate this set of nSSR loci by performing a genetic assignment test of a randomly selected seed lot to reference populations from geographically distant origins.

2. Materials and Methods

2.1. Study Material

We sampled wood for DNA extraction from 220 Norway spruce trees representing 11 populations (20 trees per population) tested in two adjacent field trials established in central Lithuania (Table 1, Figure A1). The sampled individuals are documented by population seed-lot identity in the field-test records, allowing them to be re-identified and resampled for future origin-traceability studies. We selected populations from distinct parts of the species range: (a) the southern range of Norway spruce distribution, including southern Poland, Germany, and Ukraine; (b) the eastern Baltic Sea area, including two western Russian populations (Kaliningrad and Pskov regions), north-eastern Poland, two Lithuanian, and one Estonian population; and (c) northern Europe—one Swedish and one Finnish population (Table 1). Each population seed lot was a commercial seed mixture collected from natural stands of Norway spruce within a forest district. Such seed lots are composed of seeds from at least several forest stands and, in this way, better represent the local gene pools than single-stand collections.
To test the efficiency of the loci in assigning seed lots to the regions of origin, we used commercial seed lots from four seed orchards in Lithuania. These seed orchards contained clones from southern Lithuania (coded as SOUTH), north-eastern Lithuania (NEAST), and south-eastern Lithuania (SEAST). The initial aim was to germinate 20 seeds per seed lot for genotyping. However, germination success allowed us to genotype 10 to 18 seeds per seed lot (SOUTH—18, NEAST—10, SEAST—12 and 15).
Table 1. Sampled Norway spruce populations, m. a. s. l.—metres above sea level.
Population ID.Country of OriginPart of the CountryName of PopulationCoordinates *m. a. s. l.
Lat (N)Long (E)
PL-1-120PolandNorth-eastWigry54.06034 23.03991170
LT-RS6LithuaniaNorth-eastIgnalina54.6799821.94027190
LT-RS14LithuaniaNorth-westTelšiai51.3500120.48028200
EE-EST8EstoniaSouth-eastVoru50.9300311.20001250
FI-FIN1FinlandSouthJuva49.0401524.07033100
RU-3-116Russia (Kaliningrad region)WestChernichovsk55.4002126.3860350
PL-6-124PolandCentralBlyźin57.7285926.99658260
DE-7-118GermanyCentralErfurt59.1800217.23012440
SE-SW7SwedenCentralSelebo57.7612829.6400250
RU-RUS6RussiaWestPorchov55.9301522.7935870
UA-8-115UkraineWestCarpathians, Rovno61.9300127.97012420
* Coordinates are given in decimal degrees as latitude N and longitude E. They indicate the original stand location or, where exact stand coordinates were unavailable, the approximate centre of the forest district/provenance area from which the seed material was collected, based on seed origin documentation.

2.2. DNA Analysis

DNA was extracted from wood material using a modified method based on Lefort and Douglas [57], adapted for dried woody tissue. Briefly, freeze-dried wood material was homogenized, lysed with Lefort-based extraction buffer supplemented with SDS, Proteinase K, and DTT, incubated at 60 °C, precipitated with isopropanol, washed with 70% ethanol, and treated with RNase before DNA quantification. The sources of twelve SSR markers used in the study are: loci WS00716.F13, WS0092.M15, WS0022.B15, WS0073.H08, WS00111.K13, WS0046.M11, WS0032.M17, and WS0092.A19. They were developed by Rungis et al. [58] from spruce EST sequences, primarily based on white spruce (Picea glauca), Sitka spruce (P. sitchensis), and interior spruce (P. glauca × P. engelmannii), and tested across several Picea species, including Norway spruce. The loci UAPgGT8 and UAPsTG25 were developed by Hodgetts et al. [59] for white spruce (Picea glauca) and related Picea species, including Norway spruce. The loci Pa_44 and Pa_51 were developed by Fluch et al. [60] specifically for Norway spruce (Picea abies). We aimed to include predominantly EST_SSR loci to better discriminate between populations of Norway spruce than could be expected from purely neutral SSRs [61].
DNA amplification was performed in two multiplex PCR reactions: Multiplex A (WS0022.B15, WS0073.H08, WS0092.M15, WS00111.K13, WS00716.F13) and Multiplex B (UAPsTG25, WS0032.M17, UAPgGT8, WS0092.A19, Pa_44, Pa_51, WS0046.M11). Each 15 µL PCR mixture contained 5 µL of RNase-free water, 7.5 µL of Qiagen Multiplex PCR Master Mix (2×), 1.5 µL of 10× primer mix, and 1 µL of DNA. PCR was performed using a TProfessional Standard Thermocycler (Biometra/Analytik Jena GmbH+Co. KG, Jena, Germany) under the following conditions: For Multiplex A, an initial denaturation at 95 °C for 15 min was followed by 32 cycles of 30 s at 94 °C, 90 s at 57 °C, and 30 s at 72 °C, with a final extension at 60 °C for 30 min. For Multiplex B, the same protocol was used except the annealing temperature was adjusted to 58 °C. Genotyping was conducted by capillary electrophoresis using a SeqStudio™ Genetic Analyzer (Applied Biosystems™, Thermo Fisher Scientific, Waltham, MA, USA).

2.3. Data Analysis

The frequency of null alleles at each locus across all samples was estimated using the software Micro-Checker version 2.2.3 [62]. Standard genetic diversity parameters—such as the number of different alleles (Na), effective alleles (Ne), private alleles (Np), and observed (Ho) and expected (He) heterozygosity—were estimated per locus and for each provenance using GenAlEx version 6.5 [63]. Rarefied allelic richness (Ar), based on the lowest population sample size (19 individuals), was calculated using Fstat version 2.9.3 [64]. The inbreeding coefficient (Fis) was assessed per locus and per sample using the same software.
Genetic differentiation among Norway spruce populations was estimated using several approaches: (a) Analysis of Molecular Variance (AMOVA) was performed in GenAlEx version 6.5 [63] using 9999 random permutations to test for significance; (b) the frequency-based differentiation index Dest [65] was calculated to assess pairwise genetic differentiation between all population pairs, also using 9999 random permutations in GenAlEx 6.5; (c) Bayesian clustering analysis was conducted using the model-based algorithm implemented in STRUCTURE version 2.3.3 [66] to investigate population genetic structure. For STRUCTURE analysis, the burn-in period was set to 105 iterations, followed by 105 MCMC iterations, testing K values from 1 to 20 with 20 replicates for each K. We used the correlated allele frequency model without admixture and applied the LOCPRIOR option based on provenance information (Table 1). The no-admixture model was selected to maximize assignment power under the assumption of relatively distinct gene pools, while acknowledging that some degree of admixture is expected in natural populations. The most likely number of genetic clusters (K) was identified using the deltaK method and visualized with the online software CLUMPAK [67] (https://clumpak.evolseq.net/ (accessed 10 January 2025)). We also assessed population clustering using Principal Coordinate Analysis based on Nei’s genetic distances among populations [68] in GenAlEx version 6.5.
To test the efficiency of the loci in assigning commercial seed lots from several seed orchards in Lithuania into the reference regions investigated in our study, we used GENECLASS version 4.0 software [69], with the following settings: the Bayesian assignment method by Rannala and Mountain [70], with a rejection threshold of 0.05 (individuals with probabilities below 0.05 were considered not belonging to the population), and the individual-level probability computation based on the Monte Carlo resampling algorithm by Paetkau et al. [71] using 10,000 simulated individuals. To calculate the seed-lot assignment probability, we averaged the individual tree assignment probabilities. The number of microsatellite markers and the PCR protocol used were the same as described above. We pooled the reference provenances into geographical regions as follows: the two Lithuanian provenances were grouped into the region coded as LT; the Estonian and western Russian populations were combined into a single region, EE_RU. For the remaining populations, each was assigned its own region code as follows: the Finnish population as FI_SOUTH, the Swedish as SE_SOUTH, the north-eastern Polish as PL_NEAST, the Kaliningrad region of Russia as RU_KALIN, the southern Polish as PL_SOUTH, the Ukrainian as UA_CARP (Carpathian Mountains), and the German population from Erfurt as DE_ERFURT.
In addition, we did the self-assignment tests to estimate how accurately individuals of known origin are reassigned to their reference regions by using the GENECLASS version 4.0 software settings as described above.

3. Results

3.1. Summary Statistics of Microsatellite Loci

Altogether, the 12 microsatellite loci yielded 220 multilocus genotypes and a total of 132 alleles, averaging 11.5 alleles per locus. The expected heterozygosity (He) values varied among loci, with an average of approximately 0.53, indicating a polymorphic set of markers. The observed heterozygosity (Ho) ranged from 0.01 to 0.93 (Table 2). The loci WS0032_M17, Pa_51, and WS0046_M11 were the least informative markers, showing the lowest mean number of alleles per population (Na = 1.09, 1.73, and 1.55, respectively). WS0032_M17 was monomorphic in most populations except in population RU-RUS6, while Pa_51 and WS0046_M11 showed slightly higher polymorphism across populations. The frequency of null alleles was below 0.1 for all loci except UAPgGT8 (null allele frequency = 0.117, Table 1). The inbreeding coefficient (Fis) varied considerably among loci, ranging from −0.620 at the locus UAPsTG25 to 0.211 at locus UAPgGT8, with a mean value of Fis = −0.126 (Table 2). The locus WS0032_M17, being monomorphic, was excluded from subsequent analyses.

3.2. Within-Population Genetic Diversity

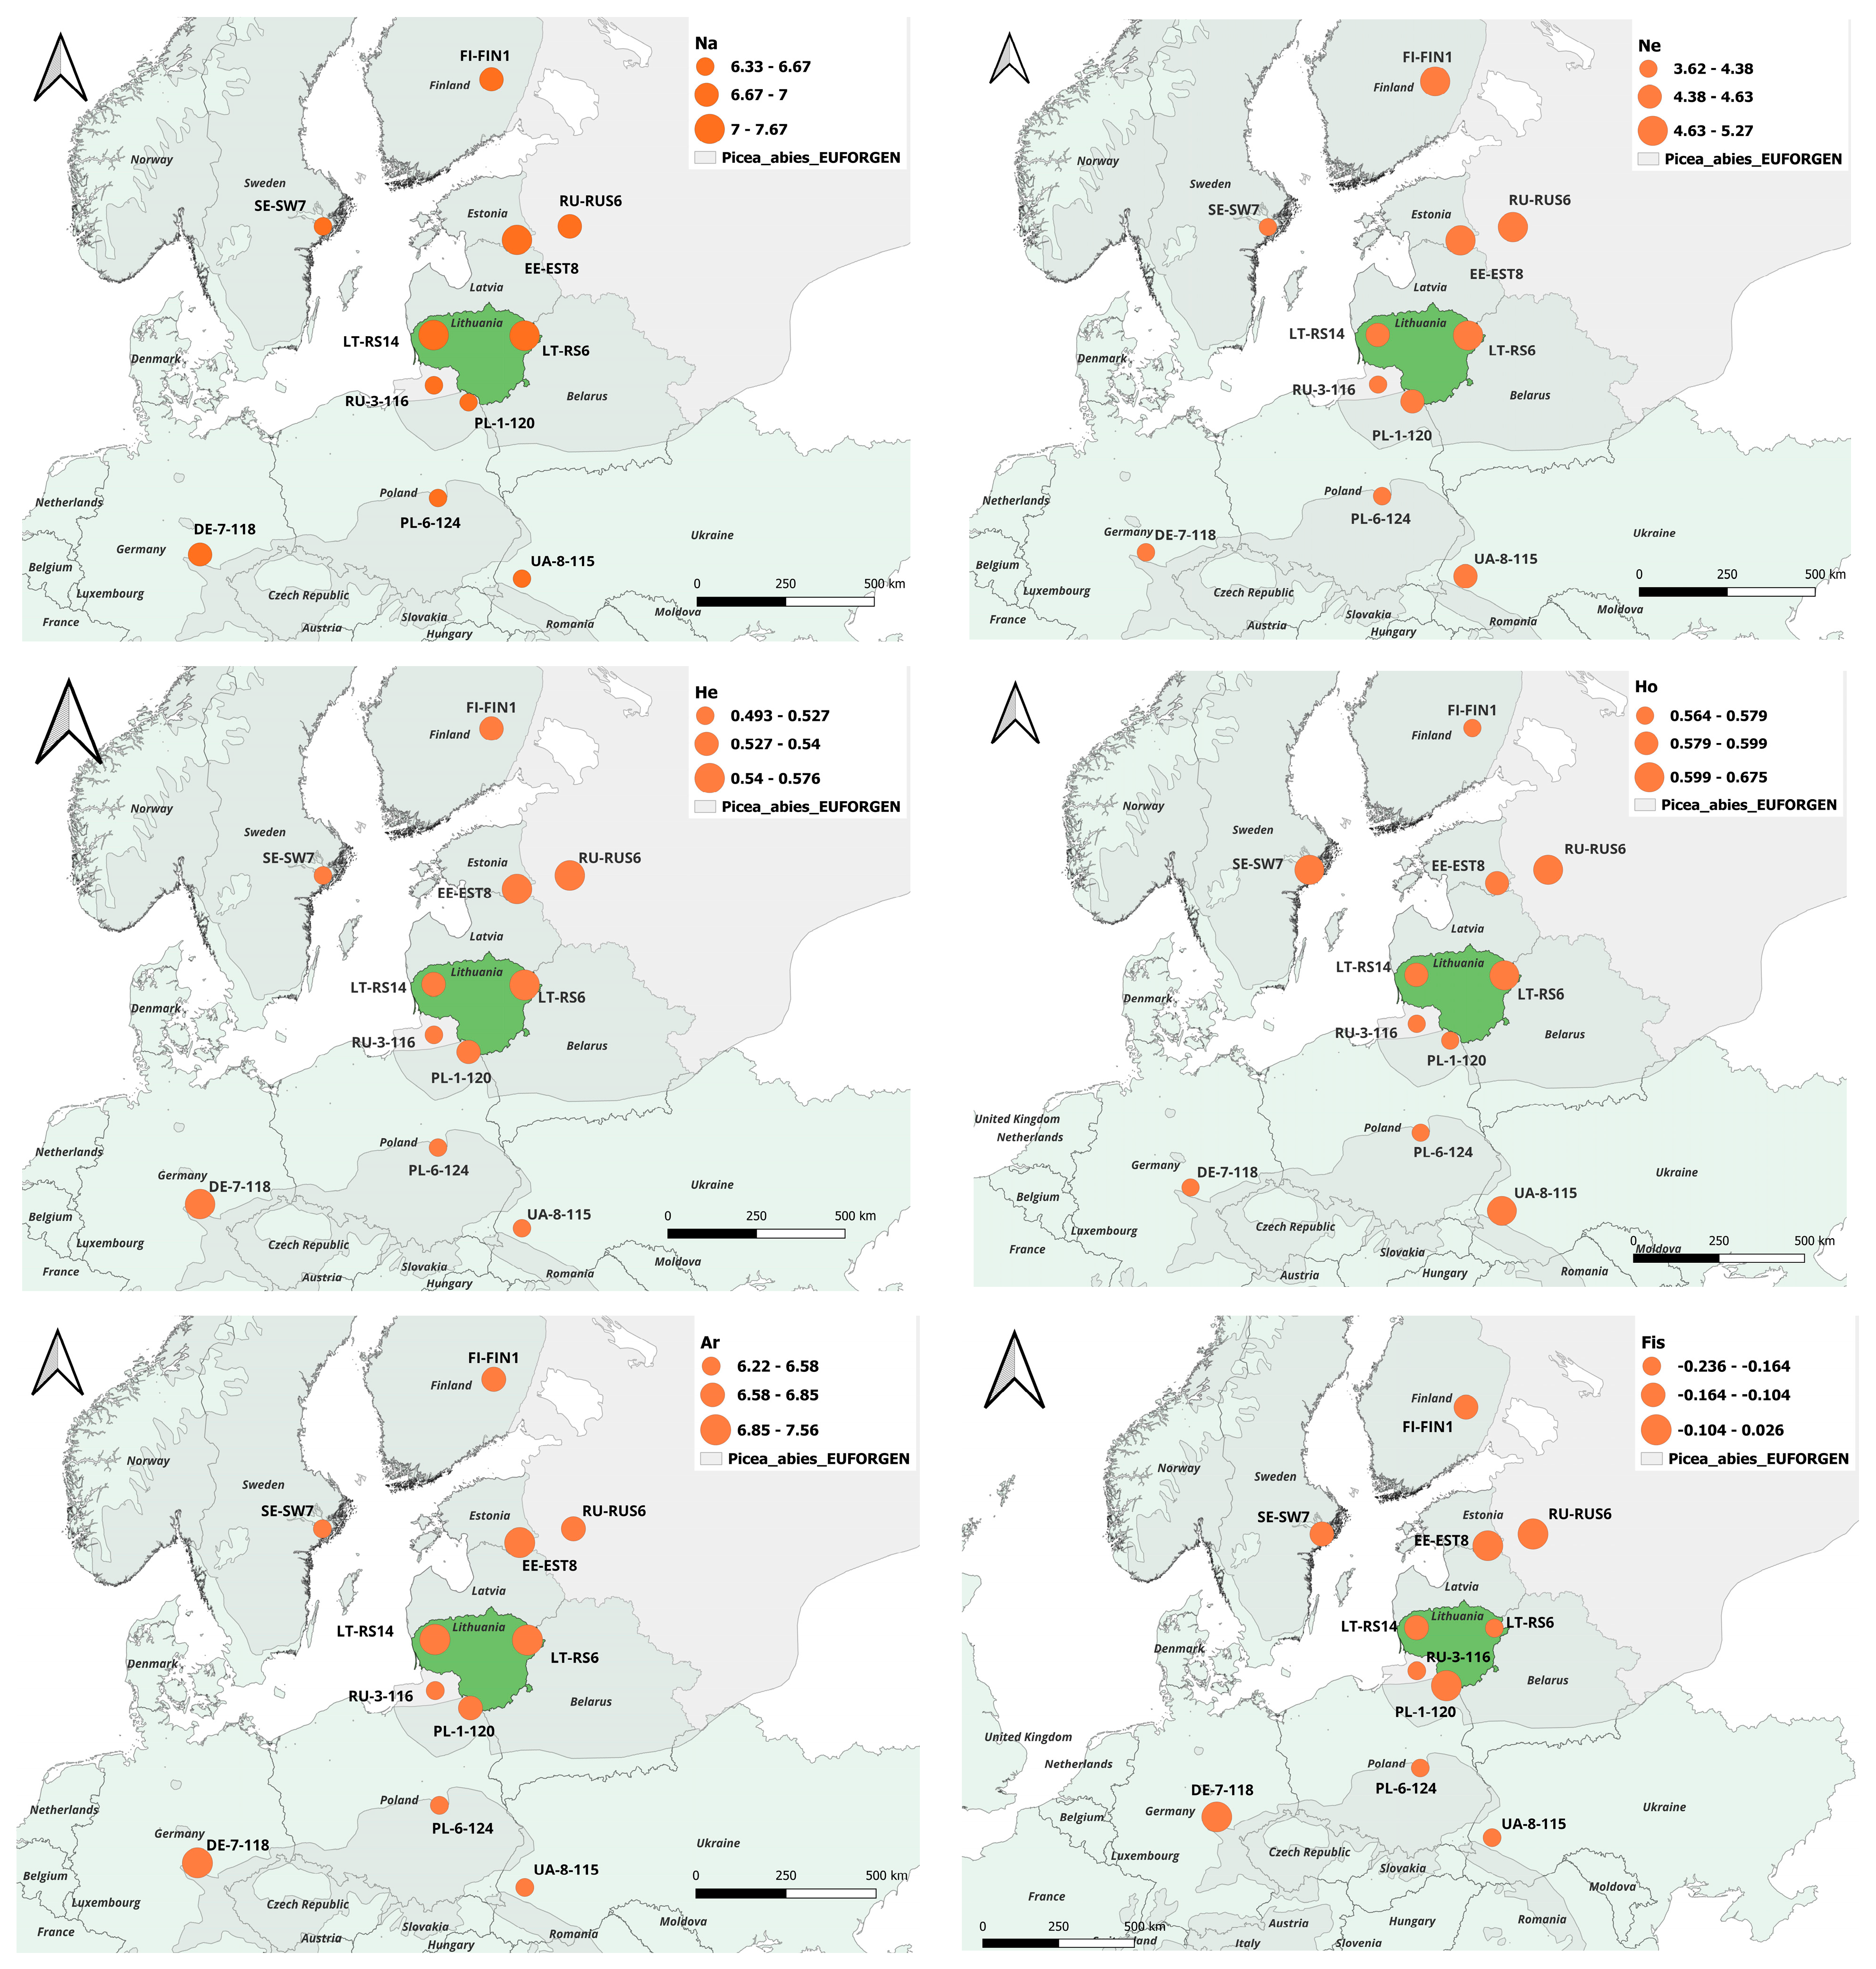
The allelic diversity (Na, Ne, Ar and He) was relatively lower in the southern European and central Swedish populations (Figure 1, Table 3). The mean number of alleles (Na) ranged from 6.33 (populations SE-SW7 and PL-6-124) to 7.67 (population LT-RS6), with an overall average of Na = 6.86. The mean number of effective alleles (Ne) ranged from 3.62 (population SE-SW7) to 5.27 (population EE-EST8), with an overall average of Ne = 4.49. The expected heterozygosity (He) was moderately high across all investigated populations, and allelic richness (Ar) ranged from 6.22 (population SE-SW7) to 7.56 (population LT-RS6), with an overall average of Ar = 6.77. Inbreeding coefficients (Fis) varied from –0.236 (population UA-8-115 (Ukraine)) to 0.026 (population DE-7-118 (Germany)) (Table 3, Figure 1).
Table 3. Within-population genetic diversity parameters.
Pop. IDCountryPart of the CountryNNaNeArNpHoHeFis
FI-FIN1FinlandSouth217.004.716.813.00.5790.536−0.115
LT-RS14LithuaniaNorth-west197.174.597.174.00.5880.537−0.105
LT-RS6LithuaniaNorth-east207.675.197.564.00.6750.576−0.165
RU-RUS6RussiaWest206.754.756.683.00.6040.546−0.102
SE-SW7SwedenCentral206.333.626.221.00.6040.509−0.164
PL-1-120PolandNorth-east206.674.566.593.00.5790.528−0.090
RU-3-116RussiaWest206.673.766.5500.5640.493−0.195
PL-6-124PolandCentral206.334.256.241.00.5790.512−0.168
EE-EST8EstoniaSouth-east207.425.277.333.00.5870.561−0.076
UA-8-115UkraineWest206.504.396.4100.6210.524−0.236
DE-7-118GermanyCentral207.004.356.9300.5720.5550.026
Mean 6.864.496.7720.5960.534−0.126
N is sample size; Na is number of different alleles; Ne is effective allele number; Ho and He are observed and expected heterozygosity; Ar is rarified allelic richness with a base of 19 individuals; Np is a number of private alleles; Fis is FSTAT inbreeding coefficient.
Figure 1. Geographical distribution of within-population genetic diversity parameters. Top left map: mean number of alleles (Na); top right map: mean number of effective alleles (Ne); middle left map: expected heterozygosity (He); middle right map: observed heterozygosity (Ho); bottom left map: allelic richness (Ar); bottom right map: inbreeding coefficient (Fis).
Diversity 18 00322 g001

3.3. Genetic Differentiation and Genetic Structure

The frequency-based differentiation tests revealed low, but significant, genetic differentiation between populations (multilocus Dest = 0.017, p = 0.001; Gst = 0.013, p = 0.001). Among the microsatellite loci, the strongest Dest-based differentiation was observed at WS00111_K13 (Dest = 0.176) and UAPgGT8 (Dest = 0.271). These two loci were also among the most polymorphic, exhibiting the highest Na and He values, together with WS00716_F13 and WS0022_B15 (Table 2). AMOVA revealed weak but significant population differentiation (1.37%, p = 0.01), with the remaining 98.63% of variation found within individuals. Pairwise Dest genetic distances [64] varied among populations, with the highest observed between Germany (DE-7-118) and Sweden (SE-SW7) (0.049) (Table A1).
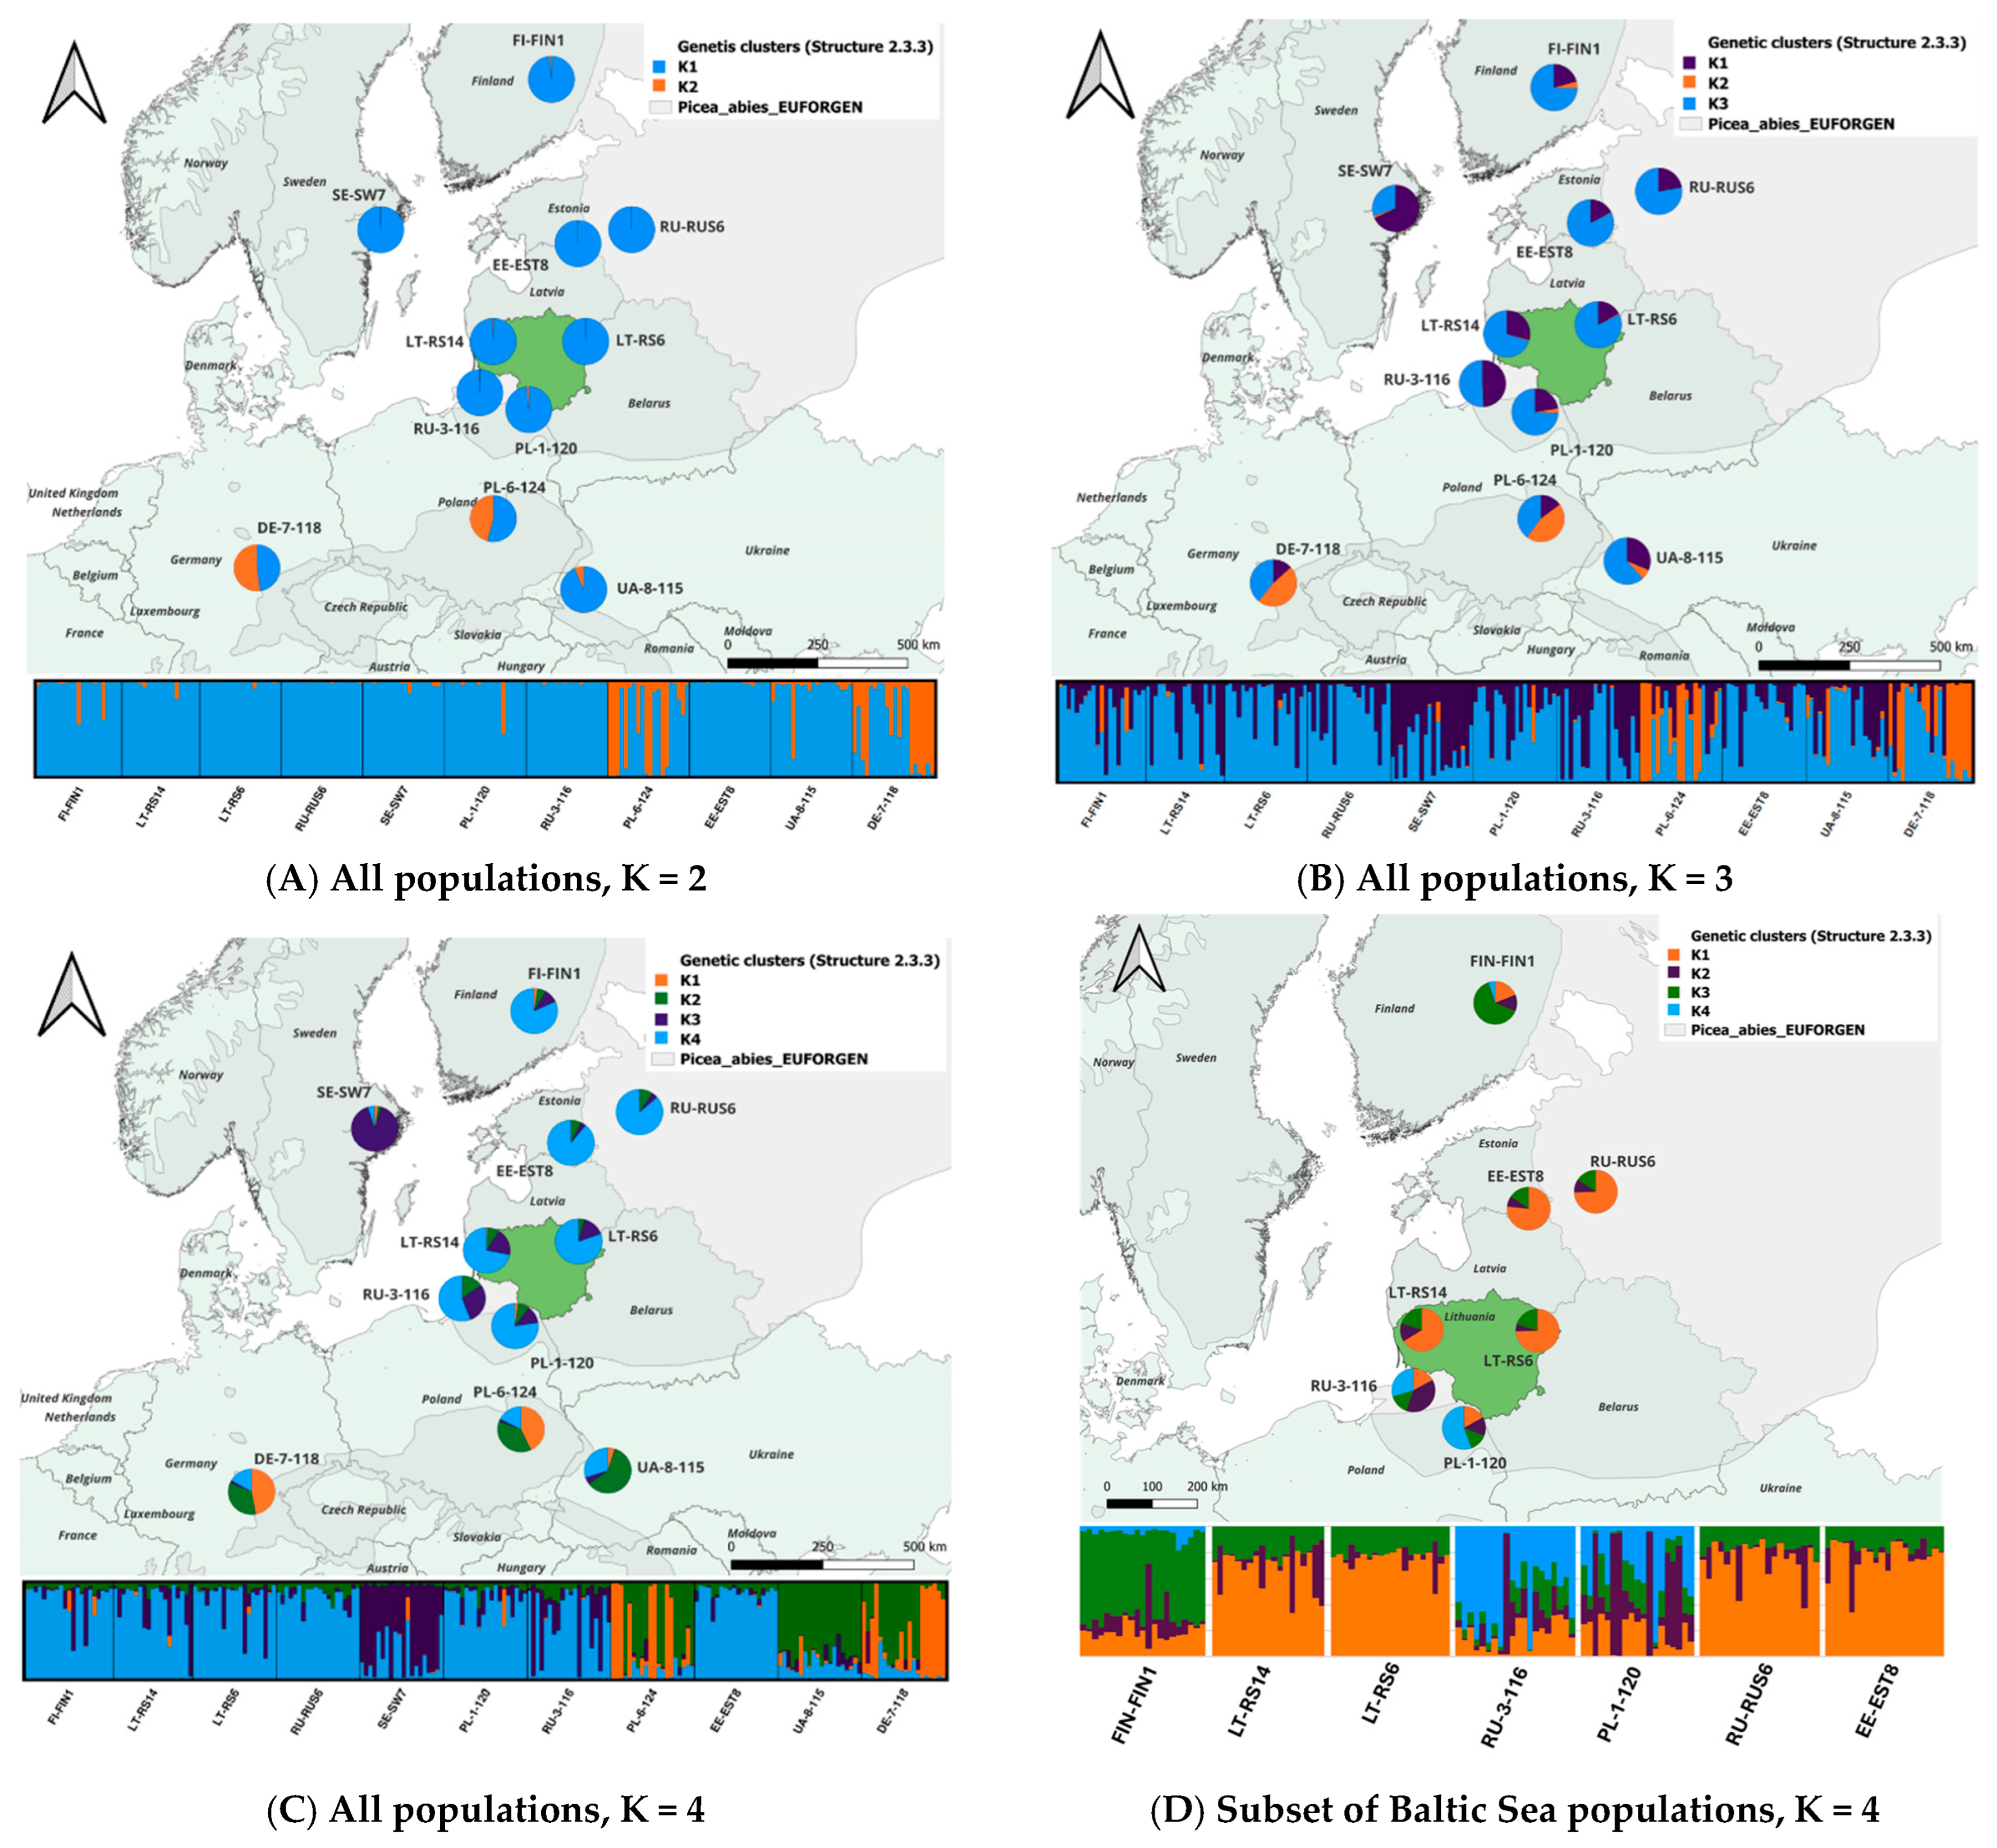
Bayesian clustering revealed a clear geographical trend in the genetic structure of Norway spruce populations, grouping them into four major clusters (Figure 2): (a) central Sweden, (b) western Ukraine, (c) southern Poland and eastern Germany, and (d) a large Baltic–Russian–southern Finnish cluster (Figure 2C). Further Bayesian clustering within this large Baltic–Russian–southern Finnish cluster revealed three subclusters (Figure 2D): (1) the southern Finnish population FI-FIN1, (2) the northeastern Polish population PL-1-120 together with the Kaliningrad region population RU-3-116, and (3) all remaining populations within this cluster. This indicates additional genetic structuring within the broader Baltic–Russian–southern Finnish group, with differentiation between the southern and northern margins as well as the remaining central part of the cluster.
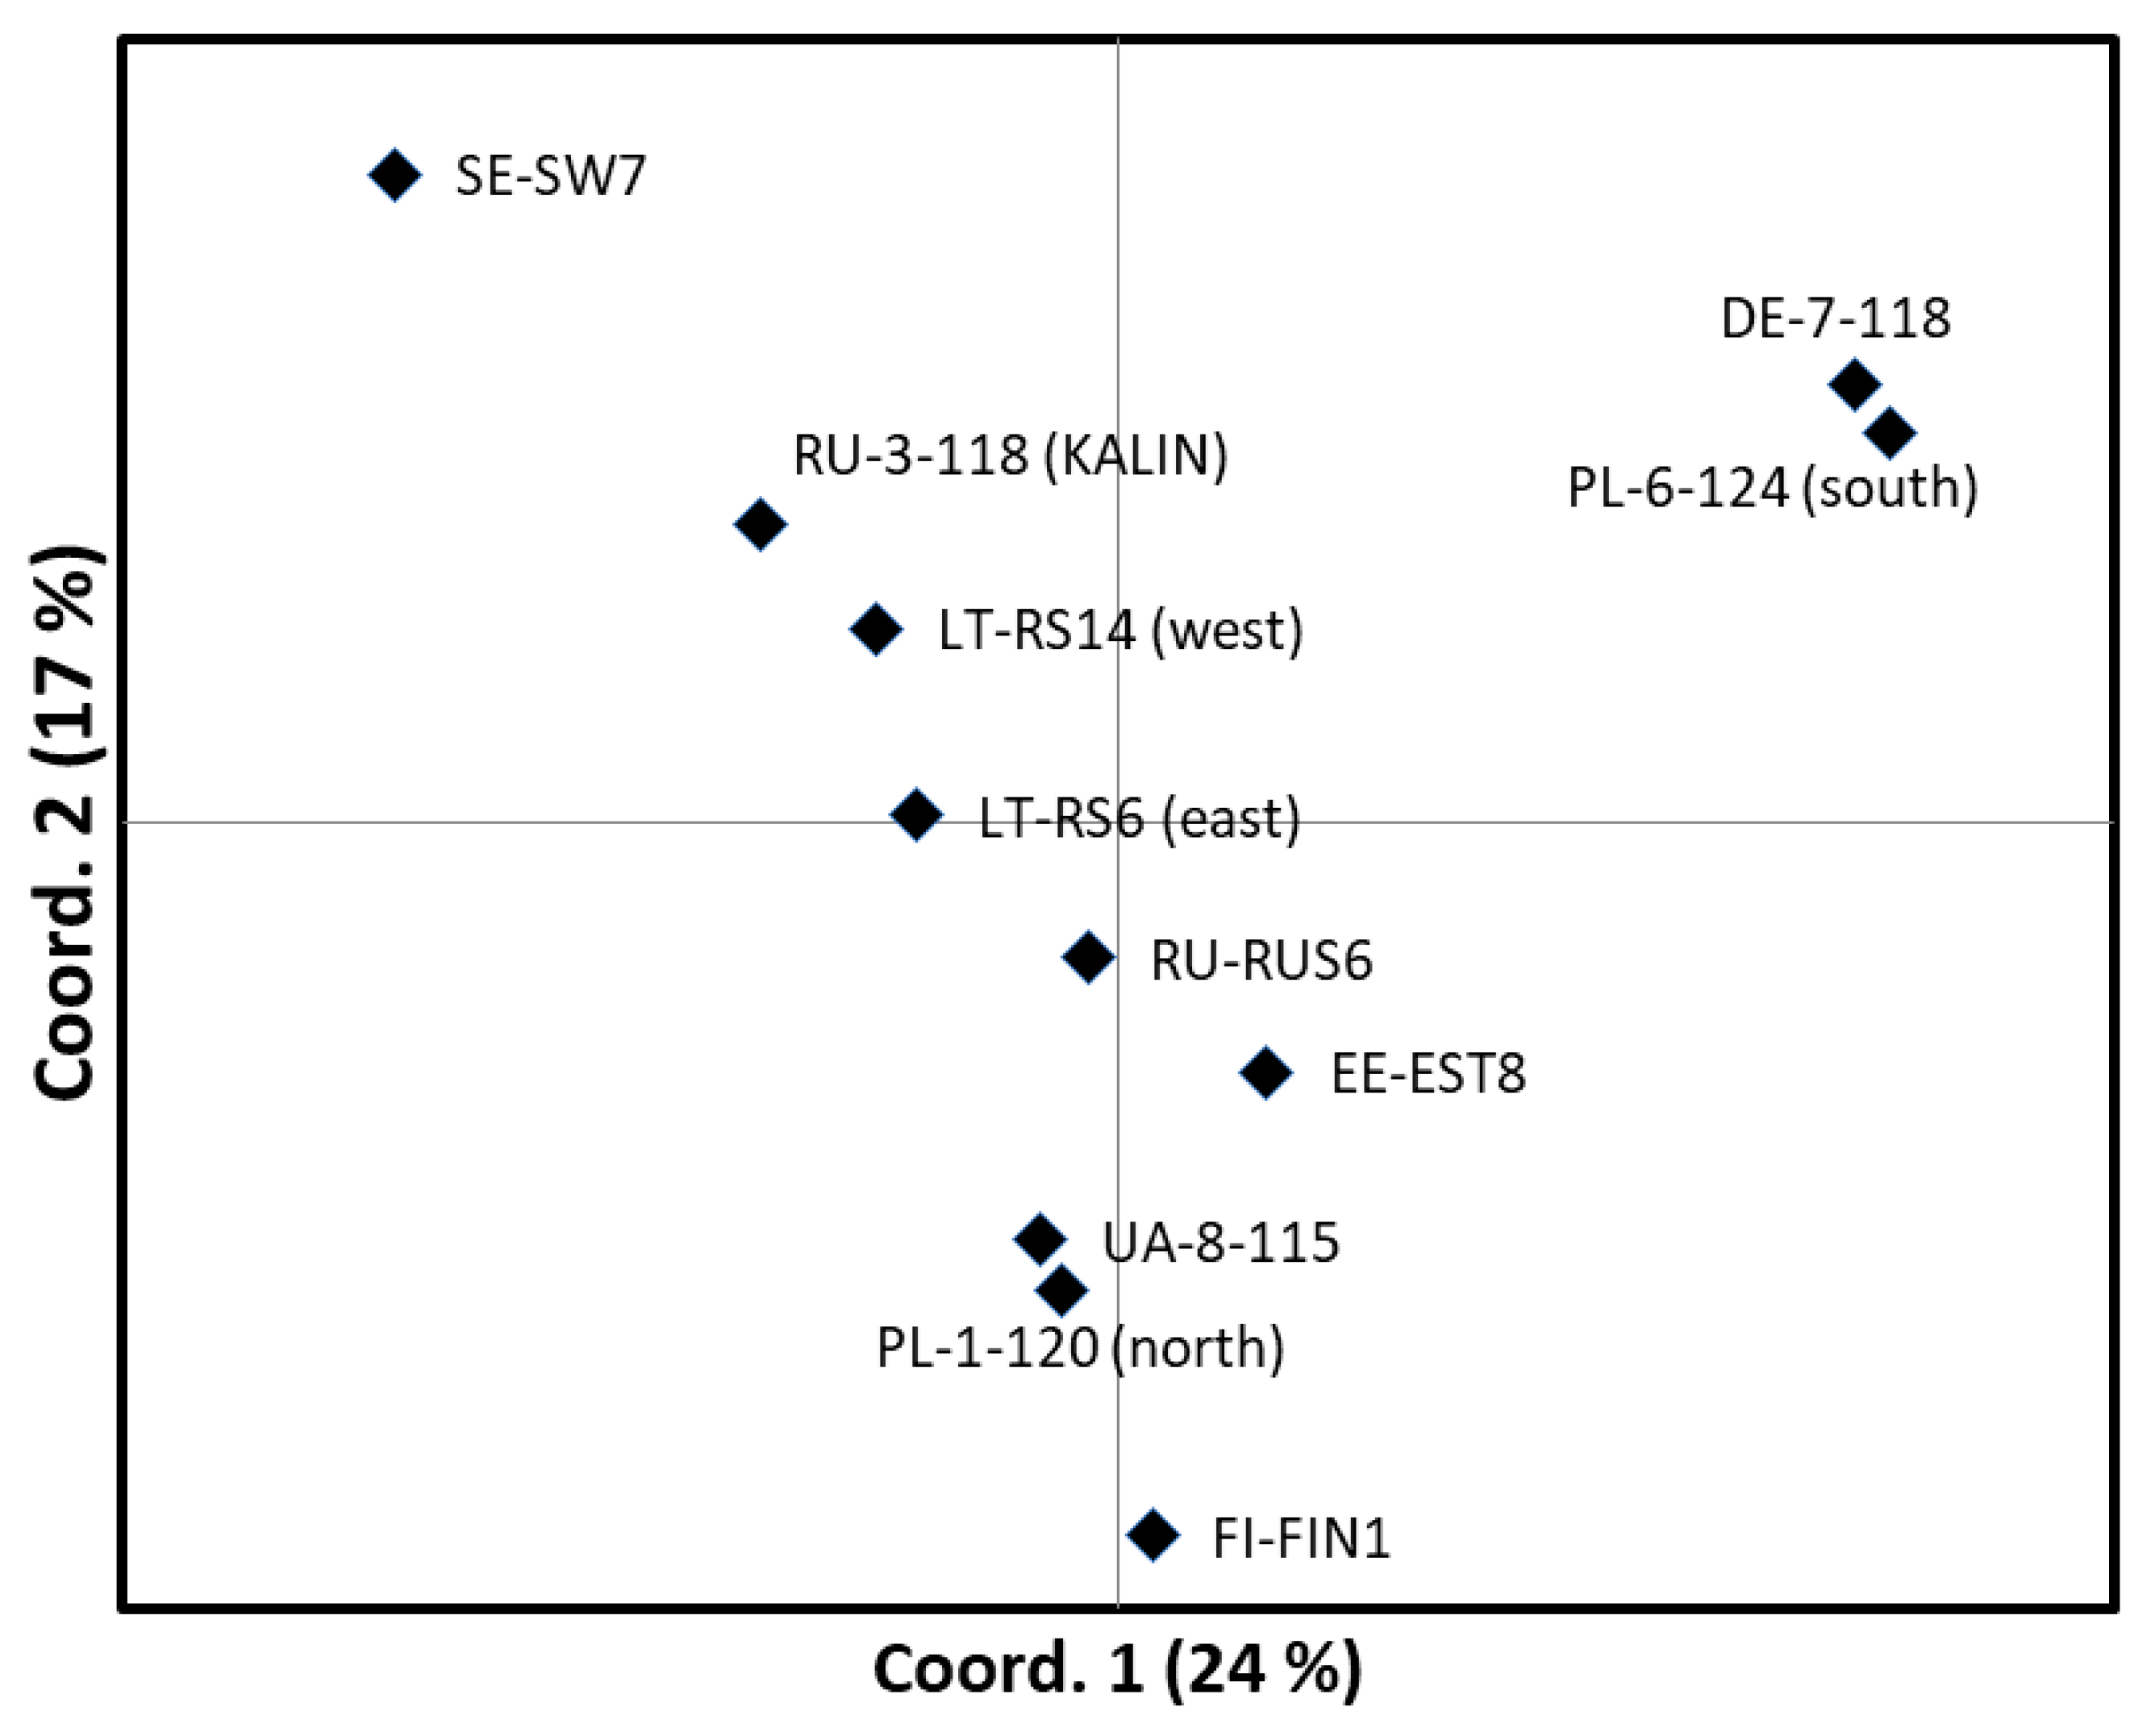
The results of the Principal Coordinate Analysis (PCoA) revealed geographically consistent clustering of populations, with the exception that the Ukrainian and north-eastern Polish populations were positioned close to the group of northern populations (Figure 3). The German and southern Polish population group was separated from the main geographical cline, along which populations were arranged in a clear north-to-south pattern (Figure 3).

3.4. The Genetic Assignment of Populations

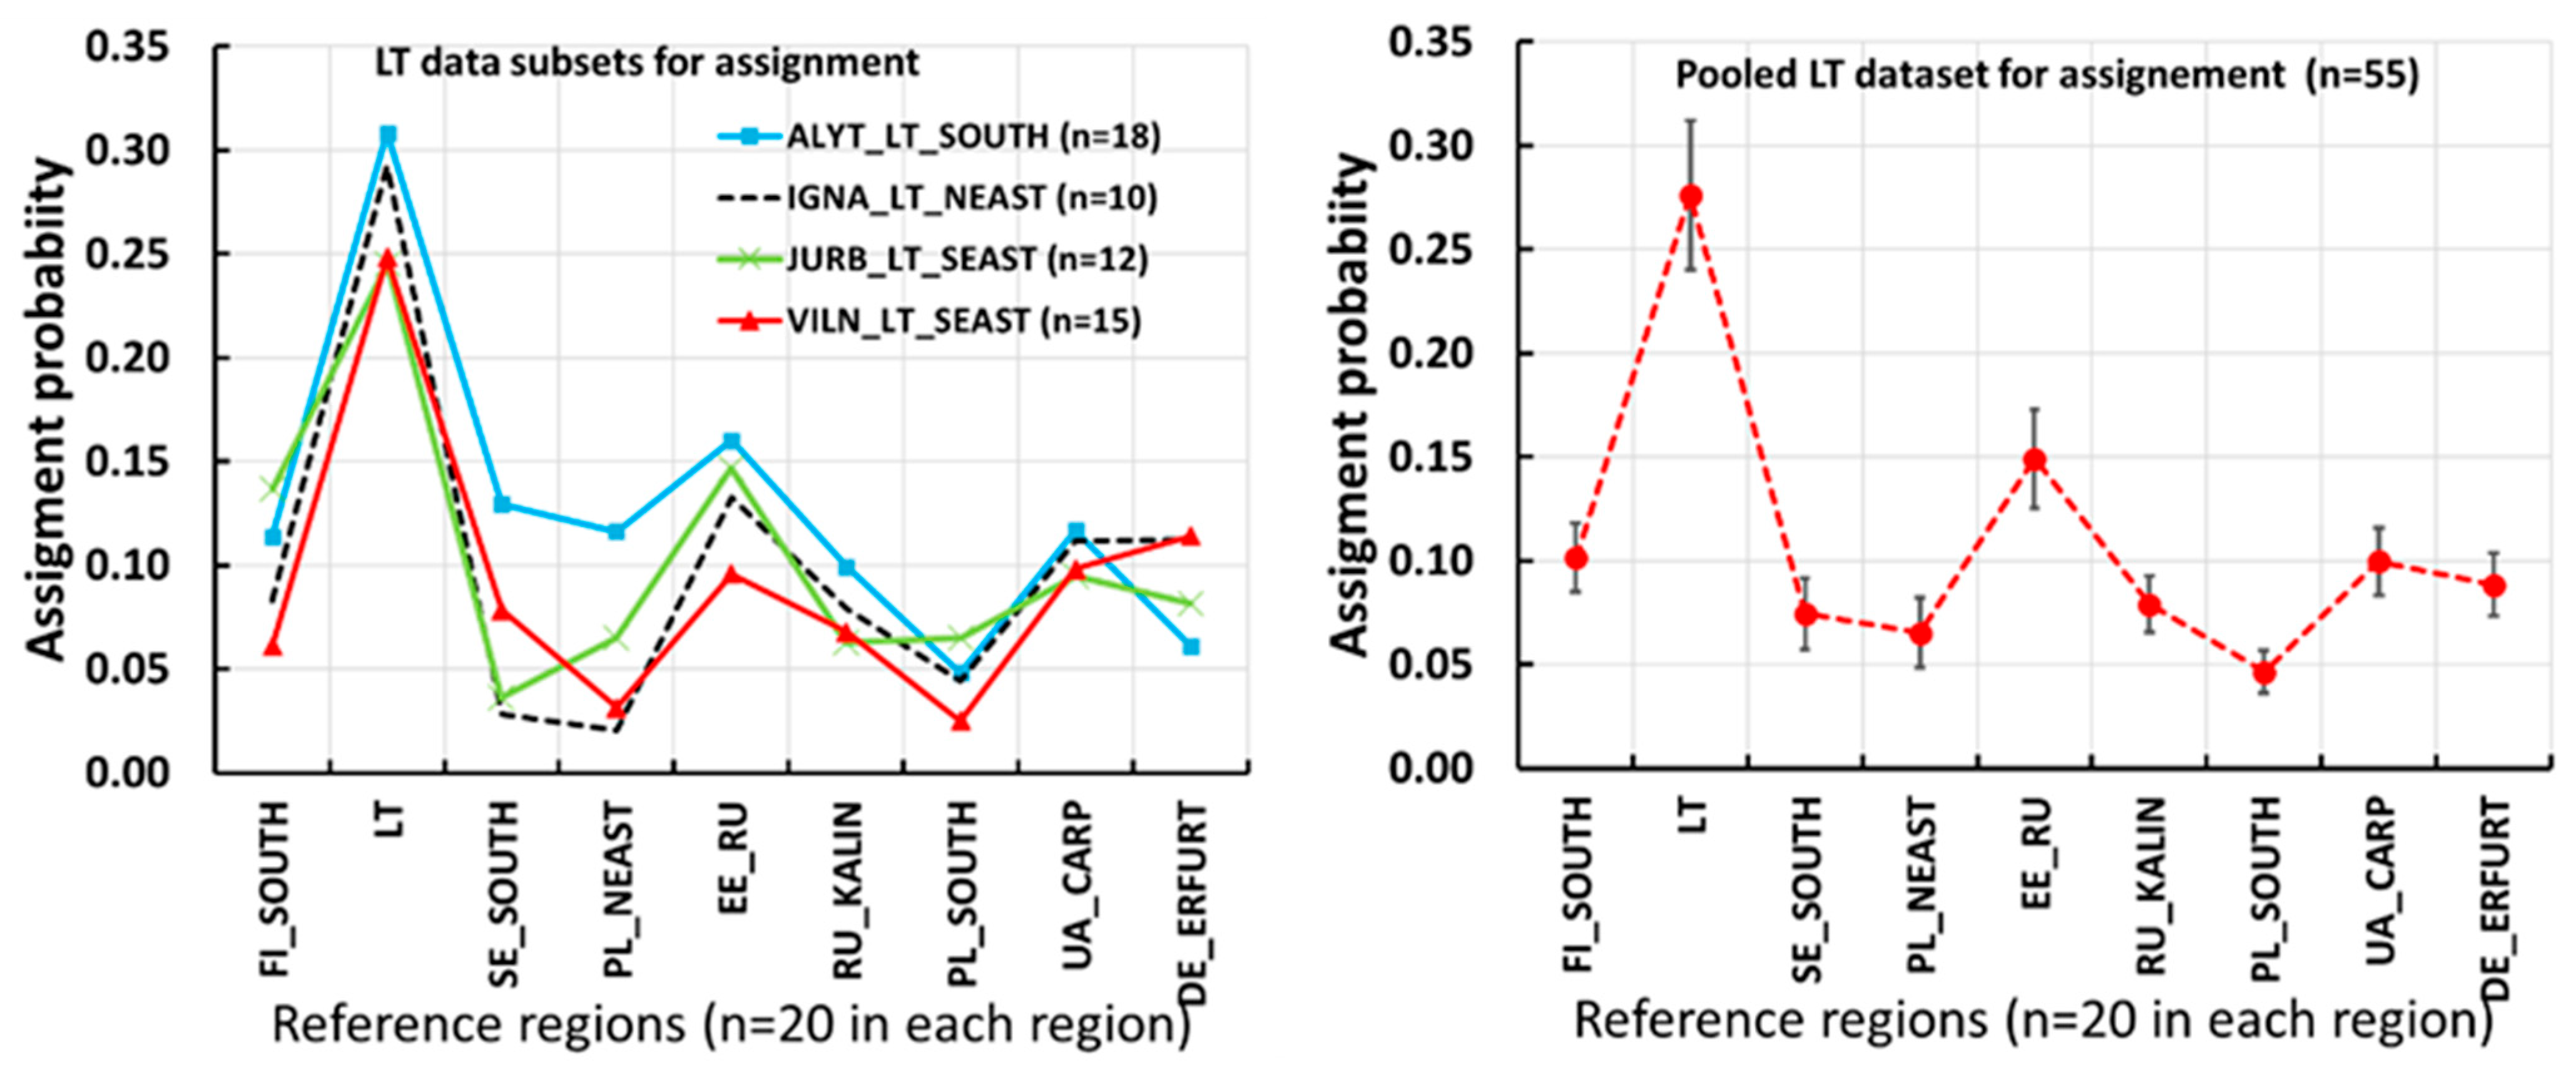
The GENECLASS analysis assigned the pooled Lithuanian seed lot to the Lithuanian reference region (LT) with a markedly higher probability than to any other reference regions (Figure 4, right). Pairwise t-tests for the differences in the assignment probabilities of the Lithuanian seed lot into the Lithuanian reference region and all other populations were significant at the p < 0.001 level. The assignment probabilities of the Lithuanian seed lot into the remaining reference regions were low, generally ranging from below 0.05 to 0.15. The highest non-Lithuanian assignment probability was observed for the Russian–Estonian reference region (EE-RU; 0.15). The lowest assignment probability was observed for PL-South, which was below 0.05 (Figure 4, right). This overall pattern supports the clear assignment of the pooled Lithuanian seed lot to the Lithuanian reference population and indicates limited affinity with the other reference regions.
The assignment probabilities of the individual Lithuanian seed lots ranged from 0.25 to 0.31 for the Lithuanian reference population and remained below 0.15 for all other populations (Figure 4, left). The assignment probabilities were relatively uniform across the seed lots, except for the one from southern Lithuania (ALYT), which showed relatively stronger associations with the northeastern Polish and Swedish reference populations (Figure 4, left).
Figure 4. Results of the genetic assignment analysis of the Lithuanian seed lots into the nine reference regions based on the 11 nSSR loci (GENECLASS soft.). The Y axis shows the assignment probabilities following the Bayesian assignment approach and probability computations by Monte Carlo resampling. The Lithuanian (LT) seed lots to be assigned are described in legend with the assignment probabilities given separately in the leftmost plot (by indicating a region in LT). The assignment probabilities of the pooled seed lots from Lithuania are given in the rightmost plot. The error bars show the standard error calculated from the individual tree assignment probabilities (FI-SOUTH—southern Finland, LT—Lithuania, SE-SOUTH—southern Sweden, PL-NEAST—north-eastern Poland, EE-RU—Estonia and Russia, RU-KALIN—Kaliningrad region of Russia, PL-SOUTH—southern Poland, UA-CARP—Ukrainian Carpathians, and DE-ERFURT—Erfurt, Germany).
Diversity 18 00322 g004
The self-assignment tests correctly assigned of individuals to their original reference regions, with the mean assignment probabilities exceeding 70% (Table 4). The mean assignment probabilities to the other reference regions ranged between 13 and 41% (Table 4). Notably, the individuals of Lithuanian region (LT) had a relatively higher mean assignment probability of 63% into the neighbouring reference region of RU_KALIN (Table 4).

4. Discussion

4.1. Loci Polymorphism

Of the 12 loci, 8 were highly polymorphic (WS0073_H08, Pa_44, WS0092_A19, WS00716_F13, WS0022_B15, UAPsTG25, WS00111_K13 and UAPgGT8), amplifying a total of 132 alleles with He values exceeding 0.6, making the dataset suitable for genetic structure analysis. Loci with higher He values tended to yield higher Dest values (Table 2), indicating that such loci are particularly suitable for forest reproductive material (FRM) origin tracking.
A highly debated topic in population genetic studies is whether to include loci with low polymorphism in genetic structure analyses. In our study, three loci showed He values below 0.1 (WS0032_M17, Pa_51, WS0046_M11; Table 2). These loci may be considered uninformative and may unnecessarily reduce the statistical power of the analysis (as noted by Cvjetković et al. [72]). On the other hand, they may harbour rare allelic variants that can provide valuable information, such as signals of gene flow from neighbouring gene pools [73,74]. To address this, we examined three loci that showed very low polymorphism in greater detail because rare alleles may still be informative for origin tracking when they show geographically structured occurrence. In our dataset, all low-frequency alleles detected at these loci occurred at frequencies below 5%, thus qualifying as rare alleles. Their relevance was assessed by comparing our results with previous studies and by examining whether their occurrence showed a population-specific or regional pattern. The loci WS0032_M17 and WS0046_M11 are EST-SSRs developed by Rungis et al. [58] for Sitka spruce. In the case of Norway spruce, we found only one study that used two of the three above-mentioned loci [72]. That study detected two alleles in both Pa_51 and WS0046_M11, which corresponds well with our results. For Sitka spruce, Cvjetković et al. [75] reported three and one alleles for WS0032_M17 and WS0046_M11, respectively. Thus, the allele frequencies reported for these three loci in other studies are consistent with our findings, suggesting that these rare alleles are unlikely to be scoring artefacts and should be considered in population structure analyses.
In our study, WS0032_M17 was nearly monomorphic, with only one individual from RU_RUS6 carrying a rare 264 bp allele; therefore, this locus was removed from further analysis. At Pa_51 and WS0046_M11, rare alleles were detected in heterozygous form in 11 and 15 individuals, respectively, mainly from northern and eastern populations, including Estonia, Lithuania, Sweden, Finland, Russia and northeastern Poland. Although these loci showed low polymorphism, the geographic pattern of rare alleles suggests that they may still provide useful information for origin tracking of forest reproductive material. Therefore, we suggest that such loci should not be automatically excluded, but their allele frequencies should be further monitored across broader geographical ranges in Norway spruce.

4.2. Geographical Structuring of Genetic Diversity

The Fst-based among-population differentiation reported in our study is consistent with that observed using nuclear microsatellite markers among Norway spruce populations across similar geographical ranges in Europe. Using a comparable set of SSR loci, Cvjetković et al. [75] reported Fst values of 2–5%, similar to ours, among Norway spruce populations in Bosnia and Herzegovina. Similar nSSR-based Fst values were also observed in Poland and other parts of Europe: Tollefsrud et al. [47] reported FST = 0.029 across 37 populations in northern Europe; Nowakowska [76] found FST = 0.039 in Poland; and Máchová et al. [77] reported Fst = 0.011 across 10 populations throughout the Czech Republic. Since the loci examined here are likely neutral, the moderate but significant levels of among-population differentiation indicate the presence of at least several zones of shared gene pools within the geographical range covered by our study.
As shown by the Bayesian analysis of genetic structure in our material, the following zones of shared gene pools can be outlined (Figure 2C): (a) central Sweden; (b) the Baltic region together with southern Finland; and (c) southern populations, including southern Poland and eastern Germany. The western Ukrainian population also showed similarity with the southern group, but its allele composition was more distinct, with a stronger contribution of the second genetic component (green colour in the pie chart). Therefore, it may represent a more differentiated Carpathian/western Ukrainian gene pool or a transition zone rather than a fully separate large-scale cluster. The PCoA analysis showed genetic proximity of Ukrainian and north-eastern Polish population. Therefore, this interpretation should be treated cautiously because only one Ukrainian population was included in the study. The populations in the southern part of the range originate from post-glacial refugial lineages, where not only mating patterns but also distinct genetic backgrounds may contribute to the observed genetic differentiation, as also suggested by Tollefsrud et al. [47,78].
Our study supports two large-scale genetic clusters of Norway spruce populations in northern Europe, as suggested by Tollefsrud et al. [47] based on SSR markers, and by the latest GWAS-based studies of Chen et al. [30] and Wang et al. [49]: (A) northern Scandinavia and (B) southern Scandinavia together with the Baltic States and western Russia. However, we delved one step deeper than Tollefsrud et al. [47] into the genetic structure within the Baltic region and Russia. Interestingly, our Bayesian clustering within the Baltic region and western Russia revealed geographically consistent genetic structures following a pattern of isolation by distance: (a) southern Finland; (b) Lithuania, Estonia, and western Russia; and (c) north-eastern Poland (Figure 2D). This genetic structuring closely resembled the genetic groups of Norway spruce revealed by large SNP marker sets in the studies of Chen et al. [30] and Wang et al. [49]. Thus, the SSR marker set used in our study provides a practical and operationally feasible method for detecting genetic structure in Norway spruce. While genome-wide SNP approaches provide higher resolution, their cost and technical requirements limit their routine use in operational forestry, where SSR markers remain a practical and scalable alternative. Similarly, the cost-efficiency of SSRs compared to SNPs was reported for Quercus suber by Sousa et al. [79]. Such geographically consistent genetic structuring suggests that phenology-based mating and gene flow are the main evolutionary forces shaping the neutral genetic structure in Norway spruce. By phenology-based, we refer to the more efficient sharing of gene pools within zones of flowering synchrony (e.g., as in Meger et al. [80]). The geographical pattern of these zones primarily depends on variation in effective temperature sums. Based on flowering timing observations in Scots pine seed orchards, Sarvas [18] cautioned against mixing clones originating from areas with more than a 130-day degree difference in annual effective temperature sum. Climatic maps of Lithuania indicate that such a 130-day degree difference roughly occurs every 300 km (approximately the latitudinal extent of Lithuania in Figure 2). However, the homogenizing effect of gene flow is likely to expand common genetic structures beyond effective mating zones, as also noted by Chen et al. [30].
Although we used presumably neutral genetic markers in this study, the observed coherence between the genetic structures and adaptive landscapes does not exclude the possibility of natural selection influencing the genetic patterns reported here [81]. Natural selection may act pervasively across the plant genome via so-called “genomic hitchhiking” or linkage disequilibrium with adaptively favourable alleles [82]. Recent exome capture and GWAS-based genotyping studies of Norway spruce populations have reported exceptionally low levels of nucleotide diversity, despite the species’ vast geographic range and large census size—commonly referred to as ‘Lewontin’s paradox’ (e.g., Chen et al. [30], Wang et al. [49]). These studies primarily attribute this phenomenon to severe bottlenecks in both northern and southern Norway spruce ranges, coinciding with the Last Glacial Maximum (LGM) [30,49]. Such bottlenecked populations tend to retain extensive ancestral polymorphisms, resulting in low genetic differentiation among contemporary populations, even across large geographic distances. This may explain the genetic structuring observed in the Baltic range in our study (e.g., Tsuda et al. [48], Chen et al. [30,83]).
The allelic diversity parameters in the Baltic and Finnish populations were higher than in the central Swedish and southern European populations. Recent genome-wide genotyping studies in Norway spruce indicate a relatively more recent bottleneck effect in the southern and Swedish populations than in the Baltic and further eastern parts of the species range [30,49]. Lower genetic diversity in the southern compared to the Baltic and Russian population clusters has also been observed in SSR-based investigations (e.g., Tollefsrud et al. [47]). In addition, observed heterozygosity (Ho) was generally higher than expected heterozygosity (He), and most populations showed negative Fis values, indicating an excess of heterozygotes and no clear signal of inbreeding (Table 3). This pattern is consistent with the predominantly outcrossing, wind-pollinated reproductive biology of Norway spruce, which promotes gene flow and helps maintain high within-population genetic diversity [16]. Interestingly, our relatively small-scale genomic marker set reflects these genome-wide patterns of genetic diversity across Norway spruce populations in Europe. In our study, the populations were sampled in a provenance test, where each seed lot represents a commercial mixture from several stands within a forest district. The size of forest districts in the Baltic states, Ukraine, and Russia was relatively similar (around 1000 ha, based on former Soviet Union forest management regulations). However, Sweden, Finland, and Poland may use forest districts of different sizes. Therefore, the genetic diversity parameters observed in our study should be interpreted in the context of such possible variation in the geographical range represented by each population.

4.3. Implications for DNA-Based Genetic Assignment

In our study, we successfully assigned the commercial Lithuanian seed lots to the Lithuanian reference region. The second-highest assignment probabilities for the Lithuanian seed lots were observed for the reference region of western Russia and Estonia. These assignment results closely correspond to the STRUCTURE clustering patterns in the Baltic region (Figure 2D). Since both the seed lots and the reference regions were genotyped using the same equipment and the same set of 11 nSSR loci, we likely avoided potential technical discrepancies in allele scoring, which is crucial for accurate genetic assignment based on allele identity. The commercial seed lots originated from seed orchard progeny representing natural stands of Norway spruce from various regions of Lithuania. Therefore, the assigned material had neither genetic nor technical overlap with the provenance tests from which the reference populations were derived. All these factors support the reliability and accuracy of the assignment results, reinforcing the effectiveness of using nSSR markers for identifying the provenance of Norway spruce seed lots in the Baltic region.
The correct assignment of all individual groups to their respective reference regions with probabilities exceeding 70% suggests that the locus set used in this study provided sufficient discriminatory power. Nevertheless, the relatively high assignment probabilities of the Lithuanian (LT) individuals to the RU_KAL reference region indicate that discriminatory power could be further improved by incorporating additional loci and/or increasing sample sizes. For Lithuania, this pattern may reflect the geographic proximity of Kaliningrad as a southern neighbouring region, where populations may share gene flow or may have been influenced by historical seed exchange.
Below, we discuss the key factors affecting the precision of genetic assignment in forest tree populations. First, we consider the geographical limits of the genetic structures to be identified. One way to delineate these limits is by identifying zones of shared gene pools, as discussed in the previous section. A potential criterion for defining such well-synchronized mating zones within a geographical landscape could be an area where the variation in effective temperature sum is less than 130-day degrees, as proposed by Sarvas [18]. In such a case, the territory into which a population is assigned may approximately correspond to a geographical area the size of Lithuania. This geographical criterion is important when accounting for key genetic variation (i.e., common allele frequencies) that reliably represents the reference population. Clearly, samples from a restricted territory will contain fewer genetic variants than samples from broader regions. In our case, even after pooling reference populations into regions, the sample size remained below 50 individuals. Such a sample size may not be sufficient to capture representative allele frequencies for a local shared mating zone, especially considering the high within-population genetic diversity typical of Norway spruce [84,85,86]. Therefore, as regards the wider application for the traceability system, our findings need to be verified with larger sample sizes and broader geographical material.
Secondly, the statistical approach for testing the genetic associations by using the genetic assignment methods is convenient for origin traceability (e.g., Wójkiewicz et al. [87]) because: (a) when the analysis is run on an individual tree basis, it allows for statistical testing of differences in the assignment probability values among the candidate seed lots; (b) it effectively explores the genetic signatures within the population to be assigned, since assignment probabilities are calculated for each individual.
Thirdly, the number and polymorphism of the SSR loci used for assignment should be sufficient to represent the genetic diversity within the reference populations (e.g., Zhiqiang Xiao et al. [88]). In our study, the moderate assignment probabilities of the Lithuanian seed lots to the Lithuanian reference population suggest that including more SSR loci or genotyping larger sample sizes could improve the accuracy of genetic assignment, especially when considering the levels of genetic diversity and the geographical patterns of genetic structure in Norway spruce.

5. Conclusions

Our results demonstrate that a relatively small set of informative nSSR markers can reliably capture major patterns of genetic structure in Norway spruce and support origin traceability of forest reproductive material. This approach provides an alternative to more complex genotyping-by-sequencing methods. Although genome-wide approaches offer higher resolution, the technical simplicity of SSR markers make them particularly suitable for routine operational applications in forestry. While we obtained promising results for origin identification in Norway spruce using SSR markers, we recommend including more informative loci or using larger sample sizes than those applied in our study to ensure more reliable population assignment probabilities. A reliable tool for tracking the origin of forest reproductive material (FRM) could discourage the use of seed sources of unknown origin and thereby help maintain the adaptive potential of Norway spruce populations.

Supplementary Materials

The following supporting information can be downloaded at: https://www.mdpi.com/article/10.3390/d18060322/s1.

Author Contributions

Conceptualization, D.D., I.K. and V.B.; Methodology, D.D., I.K. and R.K.-I.; Laboratory Work, I.K. and R.K.-I.; Data Analysis, I.K. and D.D.; Writing—Original Draft Preparation, I.K. and D.D.; Writing—Review and Editing, D.D.; Visualization, I.K. and D.D.; Supervision, D.D. and V.B. All authors have read and agreed to the published version of the manuscript.

Funding

The study was partly supported by internal funding from Vytautas Magnus University.

Data Availability Statement

Raw nSSR data are provided as Supplementary Material. In addition, representative capillary electrophoresis fragment profiles are provided for each SSR locus.

Acknowledgments

We wish to thank Vytautas Magnus University, Agriculture Academy, Faculty of Forest Sciences and Ecology Paulius Stonkus for his help with sampling and laboratory work.

Conflicts of Interest

The authors declare no conflicts of interest.

Abbreviations

The following abbreviations are used in this manuscript:
FRMForest Reproductive Material
SSRSimple Sequence Repeats

Appendix A

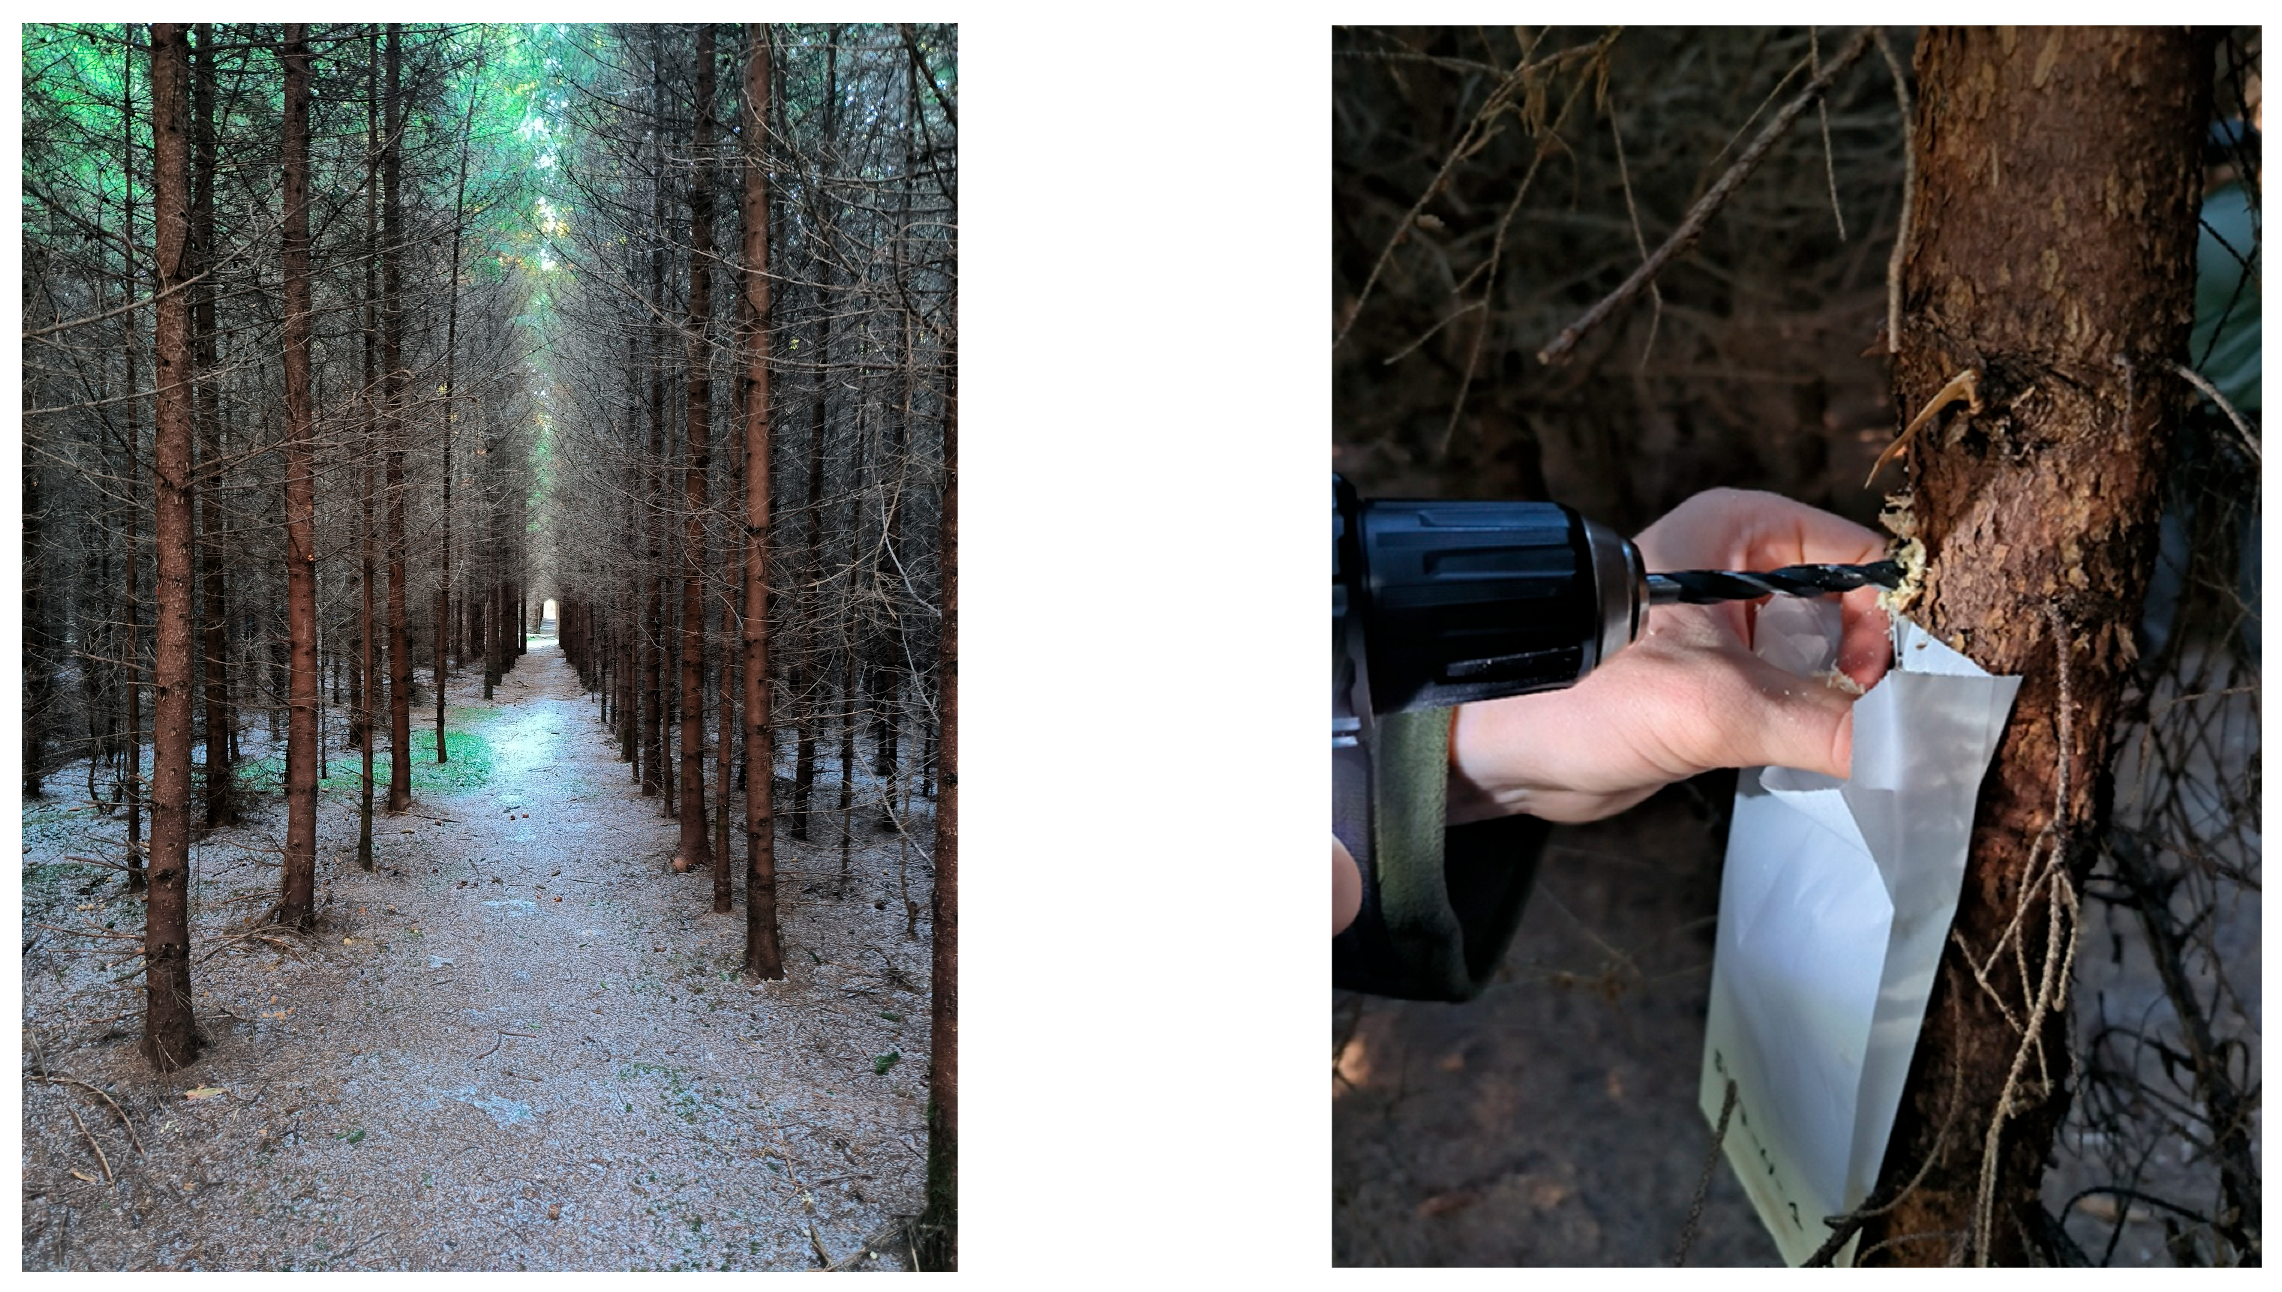
Figure A1. Sampled and analyzed provenance trial of Norway spruce in Lithuania (left); wood sampling (right).
Diversity 18 00322 g0a1
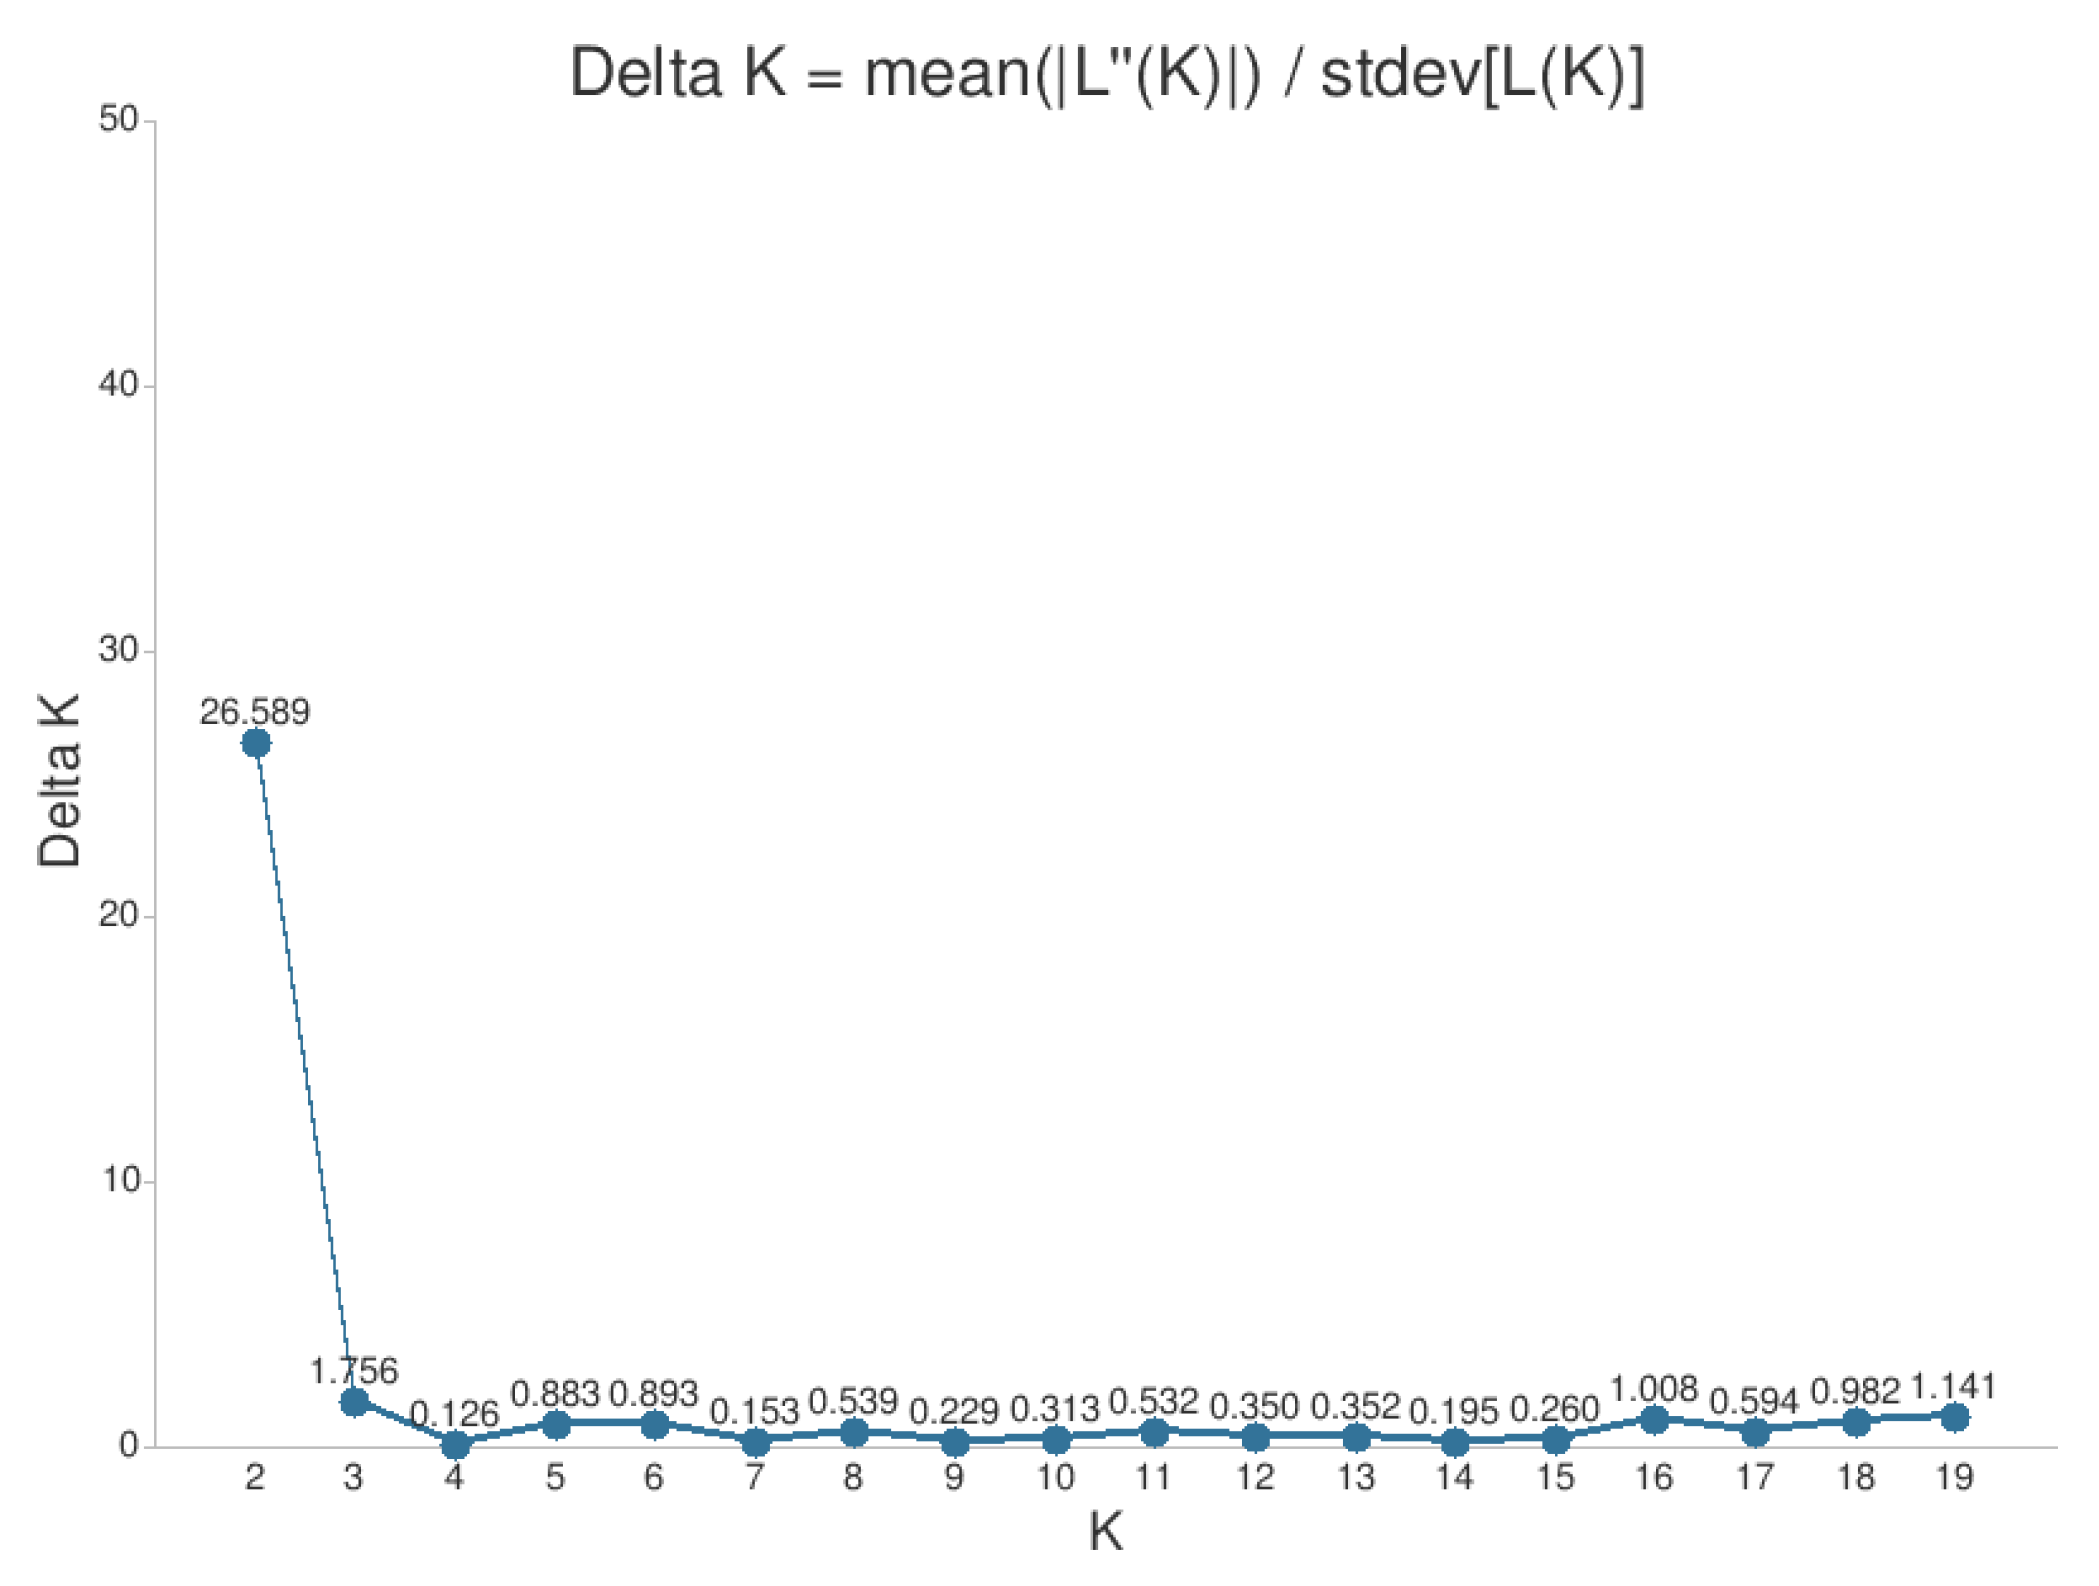
Figure A2. Most likely number of genetic clusters within the studied Norway spruce populations based on Bayesian clustering indicated by the highest delta K value at K = 2 (DeltaK = 26.589) (soft. CLUMPAK ([67])) (https://clumpak.evolseq.net/ (accessed 10 January 2025)).
Diversity 18 00322 g0a2
Table A1. Pairwise population matrix of Dest values between 11 Norway spruce provenances (below the diagonal). Probability, p (rand ≥ data), based on 9999 permutations is shown above the diagonal.
FI-FIN1LT-RS14LT-RS6RU-3-116SE-SW7PL-1-120RU-3-116PL-6-124EE-EST8UA-8-115DE-7-118
0.0000.0160.0060.0470.0010.0200.0010.0010.0780.1020.001FI-FIN1
0.0150.0000.0800.6800.0220.0370.1840.0010.1340.0130.008LT-RS14
0.0170.0080.0000.2180.0160.0080.0020.0010.1910.0580.002LT-RS6
0.010−0.0030.0040.0000.0010.1840.1330.0030.8270.2910.024RU-3-116
0.0380.0120.0120.0220.0000.0010.0220.0010.0010.0010.001SE-SW7
0.0120.0120.0170.0050.0270.0000.0040.0030.1630.1320.001PL-1-120
0.0200.0040.0240.0050.0110.0170.0000.0010.0080.0300.003RU-3-116
0.0300.0270.0340.0210.0440.0250.0310.0000.0010.0010.161PL-6-124
0.0080.0060.005−0.0050.0290.0070.0160.0190.0000.0550.020EE-EST8
0.0070.0130.0090.0020.0260.0060.0110.0250.0090.0000.001UA-8-115
0.0310.0210.0240.0150.0490.0310.0280.0060.0140.0270.000DE-7-118

References

  1. Danusevičius, D.; Gabrilavičius, G.; Danusevičius, D. Gene conservation and breeding programmes for Picea abies in Lithuania: Present day achievements. Dendrobiology 2009, 61, 83–87. [Google Scholar]
  2. Jansson, G.; Danusevičius, D.; Grotehusman, H.; Kowalczyk, J.; Krajmerova, D.; Skrøppa, T.; Wolf, H. Norway spruce (Picea abies (L.) H. Karst.). In Forest Tree Breeding in Europe: Current State-of-the-Art and Perspectives; Pâques, L.E., Ed.; Springer: Dordrecht, The Netherlands, 2013; pp. 123–176. [Google Scholar] [CrossRef]
  3. Westin, J.; Haapanen, M. Norway spruce—Picea abies (L.) Karst. Best Practice for Tree Breeding in Europe; Skogforsk: Uppsala, Sweden, 2013; pp. 29–49. [Google Scholar]
  4. Jansons, A.; Donis, J.; Danusevičius, D.; Baumanis, I. Differential analysis for next breeding cycle for Norway spruce in Latvia. Balt. For. 2015, 21, 285–297. [Google Scholar]
  5. Rosvall, O. Using Norway spruce clones in Swedish forestry: Swedish forest conditions, tree breeding program and experiences with clones in field trials. Scand. J. For. Res. 2019, 34, 342–351. [Google Scholar] [CrossRef]
  6. Hannrup, B.; Cahalan, C.; Chantre, G.; Grabner, M.; Karlsson, B.; Bayon, I.L.; Wimmer, R. Genetic parameters of growth and wood quality traits in Picea abies. Scand. J. For. Res. 2004, 19, 14–29. [Google Scholar] [CrossRef]
  7. Marini, L.; Økland, B.; Jönsson, A.M.; Bentz, B.; Carroll, A.; Forster, B.; Schroeder, M. Climate drivers of bark beetle outbreak dynamics in Norway spruce forests. Ecography 2017, 40, 1426–1435. [Google Scholar] [CrossRef]
  8. Gustafson, E.J.; Kern, C.C.; Kabrick, J.M. Can assisted tree migration today sustain forest ecosystem goods and services for the future? For. Ecol. Manag. 2023, 529, 120723. [Google Scholar] [CrossRef]
  9. Skrøppa, T. EUFORGEN Technical Guidelines for Genetic Conservation and Use for Norway Spruce (Picea abies); Bioversity International: Rome, Italy, 2003. [Google Scholar]
  10. Caudullo, G.; Tinner, W.; De Rigo, D. Picea abies in Europe: Distribution, habitat, usage and threats. In European Atlas of Forest Tree Species; San-Miguel-Ayanz, J., De Rigo, D., Caudullo, G., Houston Durrant, T., Mauri, A., Eds.; Publications Office of the European Union: Luxembourg, 2016. [Google Scholar]
  11. Müller-Starck, G.; Baradat, P.; Bergmann, F. Genetic variation within European tree species. New For. 1992, 6, 23–47. [Google Scholar] [CrossRef]
  12. Bucci, G.; Vendramin, G.G. Delineation of genetic zones in the European Norway spruce natural range: Preliminary evidence. Mol. Ecol. 2000, 9, 923–934. [Google Scholar] [CrossRef]
  13. Danusevičius, D.; Gabrilavičius, R. Variation in juvenile growth rhythm among Picea abies provenances from the Baltic States and the adjacent regions. Scand. J. For. Res. 2001, 16, 379–386. [Google Scholar] [CrossRef]
  14. Neale, D.B.; Wheeler, N.C. The conifers. In The Conifers: Genomics, Variation and Evolution; Neale, D.B., Wheeler, N.C., Eds.; Springer International Publishing: Cham, Switzerland, 2019; pp. 1–21. [Google Scholar] [CrossRef]
  15. Mallet, J. Gene flow. In Insect Movement: Mechanisms and Consequences; Woiwood, I.P., Reynolds, D.R., Thomas, C.D., Eds.; CAB International: Wallingford, UK, 2001; pp. 337–360. [Google Scholar]
  16. Conner, J.K.; Hartl, D.L. A Primer of Ecological Genetics; Sinauer Associates: Sunderland, MA, USA, 2004. [Google Scholar]
  17. Brunet, J.; Larson-Rabin, Z.; Stewart, C.M. The distribution of genetic diversity within and among populations of the Rocky Mountain columbine: The impact of gene flow, pollinators, and mating system. Int. J. Plant Sci. 2012, 173, 484–494. [Google Scholar] [CrossRef]
  18. Sarvas, R. Establishment and registration of seed orchards. Folia For. 1970, 89, 1–24. [Google Scholar]
  19. Koskela, J.; Vinceti, B.; Dvorak, W.; Bush, D.; Dawson, I.K.; Loo, J.; Ramamonjisoa, L. Utilization and transfer of forest genetic resources: A global review. For. Ecol. Manag. 2014, 333, 22–34. [Google Scholar] [CrossRef]
  20. Jansen, S.; Geburek, T. Historic translocations of European larch (Larix decidua Mill.) genetic resources across Europe—A review from the 17th until the mid-20th century. For. Ecol. Manag. 2016, 379, 114–123. [Google Scholar] [CrossRef]
  21. Geburek, T.; Myking, T. Evolutionary consequences of historic anthropogenic impacts on forest trees in Europe. For. Ecol. Manag. 2018, 422, 23–32. [Google Scholar] [CrossRef]
  22. Myking, T.; Rusanen, M.; Steffenrem, A.; Kjær, E.D.; Jansson, G. Historic transfer of forest reproductive material in the Nordic region: Drivers, scale and implications. Forestry 2016, 89, 325–337. [Google Scholar] [CrossRef]
  23. Jansen, S.; Konrad, H.; Geburek, T. Crossing borders—European forest reproductive material moving in trade. J. Environ. Manag. 2019, 233, 308–320. [Google Scholar] [CrossRef]
  24. European Union. Council Directive 1999/105/EC of 22 December 1999 on the marketing of forest reproductive material. Off. J. Eur. Communities 1999, L11, 17–40. Available online: https://eur-lex.europa.eu/eli/dir/1999/105/oj/eng (accessed on 22 February 2025).
  25. European Commission. EU Forest Strategy for 2030; Communication COM (2021) 572 Final; European Commission: Brussels, Belgium, 2021; Available online: https://environment.ec.europa.eu/strategy/forest-strategy_en (accessed on 22 December 2024).
  26. European Forest Institute. Forest Genetic Resources Strategy for Europe; European Forest Institute: Joensuu, Finland, 2021; Available online: https://www.euforgen.org/fileadmin/templates/euforgen.org/upload/Publications/Thematic_publications/FGR_Strategy4Europe.pdf (accessed on 22 December 2024).
  27. Finkeldey, R.; Ziehe, M. Genetic implications of silvicultural regimes. For. Ecol. Manag. 2004, 197, 231–244. [Google Scholar] [CrossRef]
  28. Stanturf, J.A.; Ivetić, V.; Dumroese, R.K. Framing recent advances in assisted migration of trees: A Special Issue. For. Ecol. Manag. 2024, 551, 121552. [Google Scholar] [CrossRef]
  29. Konnert, M.; Fady, B.; Gömöry, D.; A’Hara, S.; Wolter, F.; Ducci, F.; Koskela, J.; Bozzano, M.; Maaten, T.; Kowalczyk, J. Use and Transfer of Forest Reproductive Material in Europe in the Context of Climate Change; European Forest Genetic Resources Programme (EUFORGEN), Bioversity International: Rome, Italy, 2015. [Google Scholar]
  30. Chen, J.; Li, L.; Milesi, P.; Jansson, G.; Berlin, M.; Karlsson, B.; Lascoux, M. Genomic data provide new insights on the demographic history and the extent of recent material transfers in Norway spruce. Evol. Appl. 2019, 12, 1539–1551. [Google Scholar] [CrossRef]
  31. Aitken, S.N.; Yeaman, S.; Holliday, J.A.; Wang, T.; Curtis-McLane, S. Adaptation, migration or extirpation: Climate change outcomes for tree populations. Evol. Appl. 2008, 1, 95–111. [Google Scholar] [CrossRef]
  32. De Groot, M.; Diaci, J.; Ogris, N. Forest management history is an important factor in bark beetle outbreaks: Lessons for the future. For. Ecol. Manag. 2019, 433, 467–474. [Google Scholar] [CrossRef]
  33. Kremer, A. Evolutionary responses of European oaks to climate change. Ir. For. 2010, 67, 53–65. [Google Scholar]
  34. Ivetić, V.; Devetaković, J.; Nonić, M.; Stanković, D.; Šijačić-Nikolić, M. Genetic diversity and forest reproductive material—From seed source selection to planting. iForest 2016, 9, 801–812. [Google Scholar] [CrossRef]
  35. Cremer, E.; Liepelt, S.; Ziegenhagen, B.; Hussendorfer, E. Microsatellite and isozyme markers for seed source identification in silver fir. For. Genet. 2003, 10, 165–170. [Google Scholar]
  36. St Clair, J.B.; Howe, G.T. Genetic maladaptation of coastal Douglas-fir seedlings to future climates. Glob. Change Biol. 2007, 13, 1441–1454. [Google Scholar] [CrossRef]
  37. Salehi, S.P.; Vendramin, G.G.; Kalagari, M. Microsatellite analysis for differentiation and identification of the source tree of Fagus orientalis Lipsky. Iran. J. Biotechnol. 2008, 6, 85–91. [Google Scholar]
  38. Weeks, A.R.; Sgro, C.M.; Young, A.G.; Frankham, R.; Mitchell, N.J.; Miller, K.A.; Byrne, M.; Coates, D.J.; Eldridge, M.D.B.; Sunnucks, P.; et al. Assessing the benefits and risks of translocations in changing environments: A genetic perspective. Evol. Appl. 2011, 4, 709–725. [Google Scholar] [CrossRef] [PubMed]
  39. Hasenkamp, N.; Ziegenhagen, B.; Mengel, C.; Schulze, L.; Schmitt, H.P.; Liepelt, S. Towards a DNA marker assisted seed source identification: A pilot study in European beech (Fagus sylvatica L.). Eur. J. For. Res. 2011, 130, 513–519. [Google Scholar] [CrossRef]
  40. Kavaliauskas, D.; Danusevičius, D.; Fussi, B.; Žalkauskas, R. DNA markers reveal genetic association between the sea-side Lithuanian and Bavarian Scots pine populations. Balt. For. 2022, 28. [Google Scholar] [CrossRef]
  41. Hannerz, U. Other transnationals: Perspectives gained from studying sideways. Paideuma 1998, 44, 109–123. [Google Scholar]
  42. Matisons, R.; Zeltins, P.; Danusevičius, D.; Dzerina, B.; Desaine, I.; Jansons, A. Genetic control of intra-annual height growth in 6-year-old Norway spruce progenies in Latvia. iForest 2019, 12, 214–219. [Google Scholar] [CrossRef]
  43. Lundströmer, J. Adaptation of Norway Spruce (Picea abies (L.) Karst.) to Current and Future Climatic Conditions. Doctoral Thesis, Swedish University of Agricultural Sciences, Uppsala, Sweden, 2021. [Google Scholar]
  44. Danusevičius, D.; Persson, B. Phenology of natural Swedish populations of Picea abies as compared with introduced seed sources. For. Genet. 1998, 5, 211–220. [Google Scholar]
  45. Metslaid, M.; Maaten, T.; Kurm, M.; Seemen, H.; Kiviste, A. Comparison of height growth of two Picea abies provenances from Estonia and Belarus. Balt. For. 2015, 21, 253–258. [Google Scholar]
  46. Jansen, S.; Konrad, H.; Geburek, T. The extent of historic translocation of Norway spruce forest reproductive material in Europe. Ann. For. Sci. 2017, 74, 17. [Google Scholar] [CrossRef]
  47. Tollefsrud, M.M.; Sønstebø, J.H.; Brochmann, C.; Johnsen, Ø.; Skrøppa, T.; Vendramin, G.G. Combined analysis of nuclear and mitochondrial markers provide new insight into the genetic structure of North European Picea abies. Hered. 2009, 102, 549–562. [Google Scholar] [CrossRef]
  48. Tsuda, Y.; Chen, J.; Stocks, M.; Källman, T.; Sønstebø, J.H.; Parducci, L.; Lascoux, M. The extent and meaning of hybridization and introgression between Siberian spruce (Picea obovata) and Norway spruce (Picea abies): Cryptic refugia as stepping stones to the west? Mol. Ecol. 2016, 25, 2773–2789. [Google Scholar] [CrossRef]
  49. Wang, X.; Bernhardsson, C.; Ingvarsson, P.K. Demography and natural selection have shaped genetic variation in the widely distributed conifer Norway spruce (Picea abies). Genome Biol. Evol. 2020, 12, 3803–3817. [Google Scholar] [CrossRef] [PubMed]
  50. Li, Y.C.; Korol, A.B.; Fahima, T.; Beiles, A.; Nevo, E. Microsatellites: Genomic distribution, putative functions and mutational mechanisms—A review. Mol. Ecol. 2002, 11, 2453–2465. [Google Scholar] [CrossRef]
  51. Oliveira, E.J.; Pádua, J.G.; Zucchi, M.I.; Vencovsky, R.; Vieira, M.L.C. Origin, evolution and genome distribution of microsatellites. Genet. Mol. Biol. 2006, 29, 294–307. [Google Scholar] [CrossRef]
  52. Ellis, J.R.; Burke, J.M. EST-SSRs as a resource for population genetic analyses. Heredity 2007, 99, 125–132. [Google Scholar] [CrossRef] [PubMed]
  53. Putman, A.I.; Carbone, I. Challenges in analysis and interpretation of microsatellite data for population genetic studies. Ecol. Evol. 2014, 4, 4399–4428. [Google Scholar] [CrossRef]
  54. Korecký, J.; Čepl, J.; Stejskal, J.; Faltinová, Z.; Dvořák, J.; Lstibůrek, M.; El-Kassaby, Y.A. Genetic diversity of Norway spruce ecotypes assessed by GBS-derived SNPs. Sci. Rep. 2021, 11, 23119. [Google Scholar] [CrossRef]
  55. Finkeldey, R.; Leinemann, L.; Gailing, O. Molecular genetic tools to infer the origin of forest plants and wood. Appl. Microbiol. Biotechnol. 2010, 85, 1251–1258. [Google Scholar] [CrossRef] [PubMed][Green Version]
  56. Rungis, D.E.; Danusevičius, D.; Kembrytė-Ilčiukienė, R.; Jansone, L.; Kempf, M.; Jansons, Ā. Natural regeneration, genetic diversity, and provenance of introduced Fagus sylvatica L. stands in Latvia. Forests 2025, 16, 178. [Google Scholar] [CrossRef]
  57. Lefort, F.; Douglas, G.C. An efficient micro-method of DNA isolation from mature leaves of four hardwood tree species Acer, Fraxinus, Prunus and Quercus. Ann. For. Sci. 1999, 56, 259–263. [Google Scholar] [CrossRef]
  58. Rungis, D.; Bérubé, Y.; Zhang, J.; Ralph, S.; Ritland, C.E.; Ellis, B.E.; Ritland, K. Robust simple sequence repeat markers for spruce (Picea spp.) from expressed sequence tags. Theor. Appl. Genet. 2004, 109, 1283–1294. [Google Scholar] [CrossRef]
  59. Hodgetts, R.B.; Aleksiuk, M.A.; Brown, A.; Clarke, C.; Macdonald, E.; Nadeem, S.; Macdonald, E. Development of microsatellite markers for white spruce (Picea glauca) and related species. Theor. Appl. Genet. 2001, 102, 1252–1258. [Google Scholar] [CrossRef]
  60. Fluch, S.; Burg, A.; Kopecky, D.; Homolka, A.; Spiess, N.; Vendramin, G.G. Characterization of variable EST SSR markers for Norway spruce (Picea abies L.). BMC Res. Notes 2011, 4, 401. [Google Scholar] [CrossRef]
  61. Scotti, I.; Paglia, M.; Magni, F.; Morgante, M. Population genetics of Norway spruce (Picea abies Karst.) at regional scale: Sensitivity of different microsatellite motif classes in detecting differentiation. Ann. For. Sci. 2006, 63, 485–491. [Google Scholar] [CrossRef]
  62. Van Oosterhout, C.; Van Heuven, M.K.; Brakefield, P.M. On the neutrality of molecular genetic markers: Pedigree analysis of genetic variation in fragmented populations. Mol. Ecol. 2004, 13, 1025–1034. [Google Scholar] [CrossRef]
  63. Peakall, R.; Smouse, P.E. GenAlEx 6.5: Genetic analysis in Excel. Population genetic software for teaching and research—An update. Bioinformatics 2012, 28, 2537–2539. [Google Scholar] [CrossRef]
  64. Goudet, J. FSTAT, a Program to Estimate and Test Gene Diversities and Fixation Indices (Version 2.9.3); University of Lausanne: Lausanne, Switzerland, 2001. [Google Scholar]
  65. Jost, L. GST and its relatives do not measure differentiation. Mol. Ecol. 2008, 17, 4015–4026. [Google Scholar] [CrossRef]
  66. Pritchard, J.K.; Stephens, M.; Donnelly, P. Inference of population structure using multilocus genotype data. Genetics 2000, 155, 945–959. [Google Scholar] [CrossRef]
  67. Kopelman, N.M.; Mayzel, J.; Jakobsson, M.; Rosenberg, N.A.; Mayrose, I. Clumpak: A program for identifying clustering modes and packaging population structure inferences across K. Mol. Ecol. Resour. 2015, 15, 1179–1191. [Google Scholar] [CrossRef]
  68. Nei, M. Genetic distance between populations. Am. Nat. 1972, 106, 283–292. [Google Scholar] [CrossRef]
  69. Piry, S.; Alapetite, A.; Cornuet, J.M.; Paetkau, D.; Baudouin, L.; Estoup, A. GENECLASS2: A software for genetic assignment and first-generation migrant detection. J. Hered. 2004, 95, 536–539. [Google Scholar] [CrossRef]
  70. Rannala, B.; Mountain, J.L. Detecting immigration by using multilocus genotypes. Proc. Natl. Acad. Sci. USA 1997, 94, 9197–9201. [Google Scholar] [CrossRef]
  71. Paetkau, D.; Slade, R.; Burden, M.; Estoup, A. Genetic assignment methods for the direct, real-time estimation of migration rate: A simulation-based exploration of accuracy and power. Mol. Ecol. 2004, 13, 55–65. [Google Scholar] [CrossRef]
  72. Cvjetković, B.; Konnert, M.; Fussi, B.; Mataruga, M.; Šijačić-Nikolić, M.; Daničić, V.; Lučić, A. Norway spruce (Picea abies Karst.) variability in progeny tests in Bosnia and Herzegovina. Genetika 2017, 49, 259–272. [Google Scholar] [CrossRef]
  73. Conkle, M.T. Genetic diversity—Seeing the forest through the trees. New For. 1992, 6, 5–23. [Google Scholar] [CrossRef]
  74. Danusevičius, D.; Rajora, O.P.; Kavaliauskas, D.; Baliuckas, V.; Augustaitis, A. Genetic diversity and fine-scale spatial genetic structure of unmanaged old-growth versus managed second-growth populations of Scots pine (Pinus sylvestris L.) in Lithuania. Eur. J. For. Res. 2023, 142, 773–793. [Google Scholar] [CrossRef]
  75. Cvjetković, B.; Holliday, J.; Konnert, M.; Szasz-Len, A.M. Molecular markers used for genetic studies in Sitka spruce (Picea sitchensis (Bong.) Carr.). In Technical Guidelines for Molecular Genetic Analysis in Non-Native Forest Tree Species of Europe; Studia Forestalia Slovenica; Silva Slovenica Publishing Centre: Ljubljana, Slovenia, 2018; Volume 160. [Google Scholar]
  76. Nowakowska, J.A. Mitochondrial and nuclear DNA differentiation of Picea abies populations in Poland. Dendrobiology 2009, 61, 67–74. [Google Scholar]
  77. Máchová, P.; Trčková, O.; Cvrčková, H. Use of nuclear microsatellite loci for evaluating genetic diversity of selected populations of Picea abies (L.) Karsten in the Czech Republic. Forests 2018, 9, 92. [Google Scholar] [CrossRef]
  78. Tollefsrud, M.M.; Kissling, R.; Gugerli, F.; Johnsen, Ø.; Skrøppa, T.; Cheddadi, R.; Sperisen, C. Genetic consequences of glacial survival and postglacial colonization in Norway spruce: Combined analysis of mitochondrial DNA and fossil pollen. Mol. Ecol. 2008, 17, 4134–4150. [Google Scholar] [CrossRef]
  79. Sousa, F.; Costa, J.; Ribeiro, C.; Varandas, M.; Pina-Martins, F.; Simões, F.; Matos, J.; Glushkova, M.; Miguel, C.; Veloso, M.; et al. Population structure in Quercus suber L. revealed by nuclear microsatellite markers. PeerJ 2022, 10, e13565. [Google Scholar] [CrossRef]
  80. Meger, J.; Ulaszewski, B.; Burczyk, J. Genomic signatures of natural selection at phenology-related genes in a widely distributed tree species Fagus sylvatica L. BMC Genom. 2021, 22, 583. [Google Scholar] [CrossRef]
  81. Wang, J.; Street, N.R.; Scofield, D.G.; Ingvarsson, P.K. Natural selection and recombination rate variation shape nucleotide polymorphism across the genomes of three related Populus species. Genetics 2016, 202, 1185–1200. [Google Scholar] [CrossRef]
  82. Corbett-Detig, R.B.; Hartl, D.L.; Sackton, T.B. Natural selection constrains neutral diversity across a wide range of species. PLoS Biol. 2015, 13, e1002112. [Google Scholar] [CrossRef]
  83. Chen, J.; Källman, T.; Ma, X.F.; Zaina, G.; Morgante, M.; Lascoux, M. Identifying genetic signatures of natural selection using pooled population sequencing in Picea abies. G3 Genes Genomes Genet. 2016, 6, 1979–1989. [Google Scholar] [CrossRef]
  84. Gömöry, D. Effect of stand origin on the genetic diversity of Norway spruce (Picea abies Karst.) populations. For. Ecol. Manag. 1992, 54, 215–223. [Google Scholar] [CrossRef]
  85. Radu, R.G.; Curtu, L.A.; Spârchez, G.; Şofletea, N. Genetic diversity of Norway spruce [Picea abies (L.) Karst.] in Romanian Carpathians. Ann. For. Res. 2014, 57, 19–29. [Google Scholar] [CrossRef]
  86. Stojnić, S.; Avramidou, E.; Fussi, B.; Westergren, M.; Orlović, S.; Matović, B.; Konnert, M. Assessment of genetic diversity and population genetic structure of Norway spruce (Picea abies (L.) Karsten) at its southern lineage in Europe: Implications for conservation of forest genetic resources. Forests 2019, 10, 258. [Google Scholar] [CrossRef]
  87. Wójkiewicz, B.; Lewandowski, A.; Żukowska, W.B.; Litkowiec, M.; Wachowiak, W. Low effective population size and high spatial genetic structure of black poplar populations from the Oder valley in Poland. Ann. For. Sci. 2021, 78, 37. [Google Scholar] [CrossRef]
  88. Xiao, Z.; Yang, T.; Wang, S.; Wei, X.; Jiang, M. Exploring the origin and genetic representation of ex situ living collections of five endangered tree species established for 20–35 years. Glob. Ecol. Conserv. 2021, 32, e01928. [Google Scholar] [CrossRef]
Figure 2. Geographical distribution of the membership proportions of Norway spruce populations inferred by the Bayesian clustering analysis with the STRUCTURE version 2.3.3 software. Membership proportions of Norway spruce splits individuals into K = 2 to 4 clusters inferred by the STRUCTURE Bayesian clustering analysis.
Diversity 18 00322 g002
Figure 3. Results of Principal Coordinate Analysis based on Nei’s genetic distances [68] among populations. For Lithuanian, Polish and Russian populations, the geographical location within the country is specified in the brackets.
Diversity 18 00322 g003
Table 2. Characteristics of the microsatellite loci based on the full data set of 220 individuals. Frequency of the most frequent allele is given in the brackets.
LocusMost Frequent Allele (Freq.)NaNeHoHeFisNullFstDest
WS0073_H08 *212 (0.66)52.860.7340.643−0.115−0.0680.0230.005
WS0032_M17 *267 (0.99)21.000.0050.0040.0000.0000.0230.000
Pa_44 *287 (0.65)42.030.8080.506−0.588−0.3470.0270.021 ***
WS0092_A19 *222 (0.42)115.220.9090.805−0.107−0.0570.0290.045
Pa_51 *142 (0.97)21.050.0500.048−0.010−0.0250.0190.000
WS00716_F13 *224 (0.21)2210.730.8710.9050.0630.0310.0270.043
WS0092_M15 *213 (0.97)41.380.3250.264−0.171−0.1770.0340.007
WS0022_B15 *180 (0.37)206.740.9270.841−0.082−0.0390.0320.079
WS0046_M11 *231 (0.96)21.080.0640.0660.1230.0330.0590.003
UAPsTG25101 (0.64)82.280.8910.552−0.620−0.3610.0290.028 ***
WS00111_K13 *224 (0.30)3111.400.8590.9070.0790.0430.0360.176 ***
UAPgGT8208 (0.37)278.150.7050.8700.2110.1170.0540.271 ***
Total mean 11.54.490.5960.534−0.126−0.0710.0330.017
Na is number of different alleles, Ne is effective allele number, Ho and He are observed and expected heterozygosity, Fis is FSTAT inbreeding coefficient, null allele frequency is estimated by the Oosterhout method, Fst and Dest are frequency-based differentiation indexes among the 11 populations (*** indicates t 0.001 level significance with 9999 GeneAlEx permutations). * EST-SSR.
Table 4. Results of genetic self-assignment tests of individuals into their original reference regions (GENECLASS soft.). The assignment probabilities following the Bayesian assignment approach and probability computations by Monte Carlo resampling are given. The self-assignment probabilities are at the diagonal (shown in bold).
POPFI_SOUTHLTSE_SOUTHPL_NEASTEE_RURU_KALINPL_SOUTHUA_CARPDE_ERFURT
FI_SOUTH0.700.420.160.220.450.230.090.240.12
LT0.170.710.130.120.320.180.050.130.14
SE_SOUTH0.290.380.700.160.400.310.140.210.24
PL_NEAST0.240.320.130.710.230.210.090.140.09
EE_RU0.320.350.140.200.710.220.110.210.13
RU_KALIN0.370.630.320.390.470.710.170.400.25
PL_SOUTH0.210.390.080.200.230.150.700.240.44
UA_CARP0.360.480.200.260.390.310.190.740.11
DE_ERFURT0.150.310.080.150.210.160.230.130.72
Disclaimer/Publisher’s Note: The statements, opinions and data contained in all publications are solely those of the individual author(s) and contributor(s) and not of MDPI and/or the editor(s). MDPI and/or the editor(s) disclaim responsibility for any injury to people or property resulting from any ideas, methods, instructions or products referred to in the content.