Article

Ant–Plant Interaction Networks in Preserved and Disturbed Brazilian Savannas: Comparing Interactions Between Plants with and Without Extrafloral Nectaries


by
André Silva de Oliveira
1,*,
Luana Teixeira Silveira
2,
Tatianne Marques
3 and
Walter Santos de Araújo
4,*
1
Graduate Program in Biodiversity and Natural Resource Use, State University of Montes Claros (UNIMONTES), Montes Claros 39401-089, Minas Gerais, Brazil
2
Graduate Program in Animal Biodiversity, Federal University of Goiás (UFG), Goiânia 74690-900, Goiás, Brazil
3
Applied Ecology and Cytogenetics Laboratory (LEAC), Federal Institute of Education, Science and Technology of Northern Minas Gerais (IFNMG), Salinas Campus, Salinas 39560-000, Minas Gerais, Brazil
4
Department of General Biology, State University of Montes Claros (UNIMONTES), Montes Claros 39401-089, Minas Gerais, Brazil
*
Authors to whom correspondence should be addressed.
Diversity 2026, 18(6), 314; https://doi.org/10.3390/d18060314
Submission received: 15 April 2026 / Revised: 21 May 2026 / Accepted: 21 May 2026 / Published: 24 May 2026
(This article belongs to the Special Issue Impacts of Human Disturbance on Plant–Insect Interactions)

Abstract

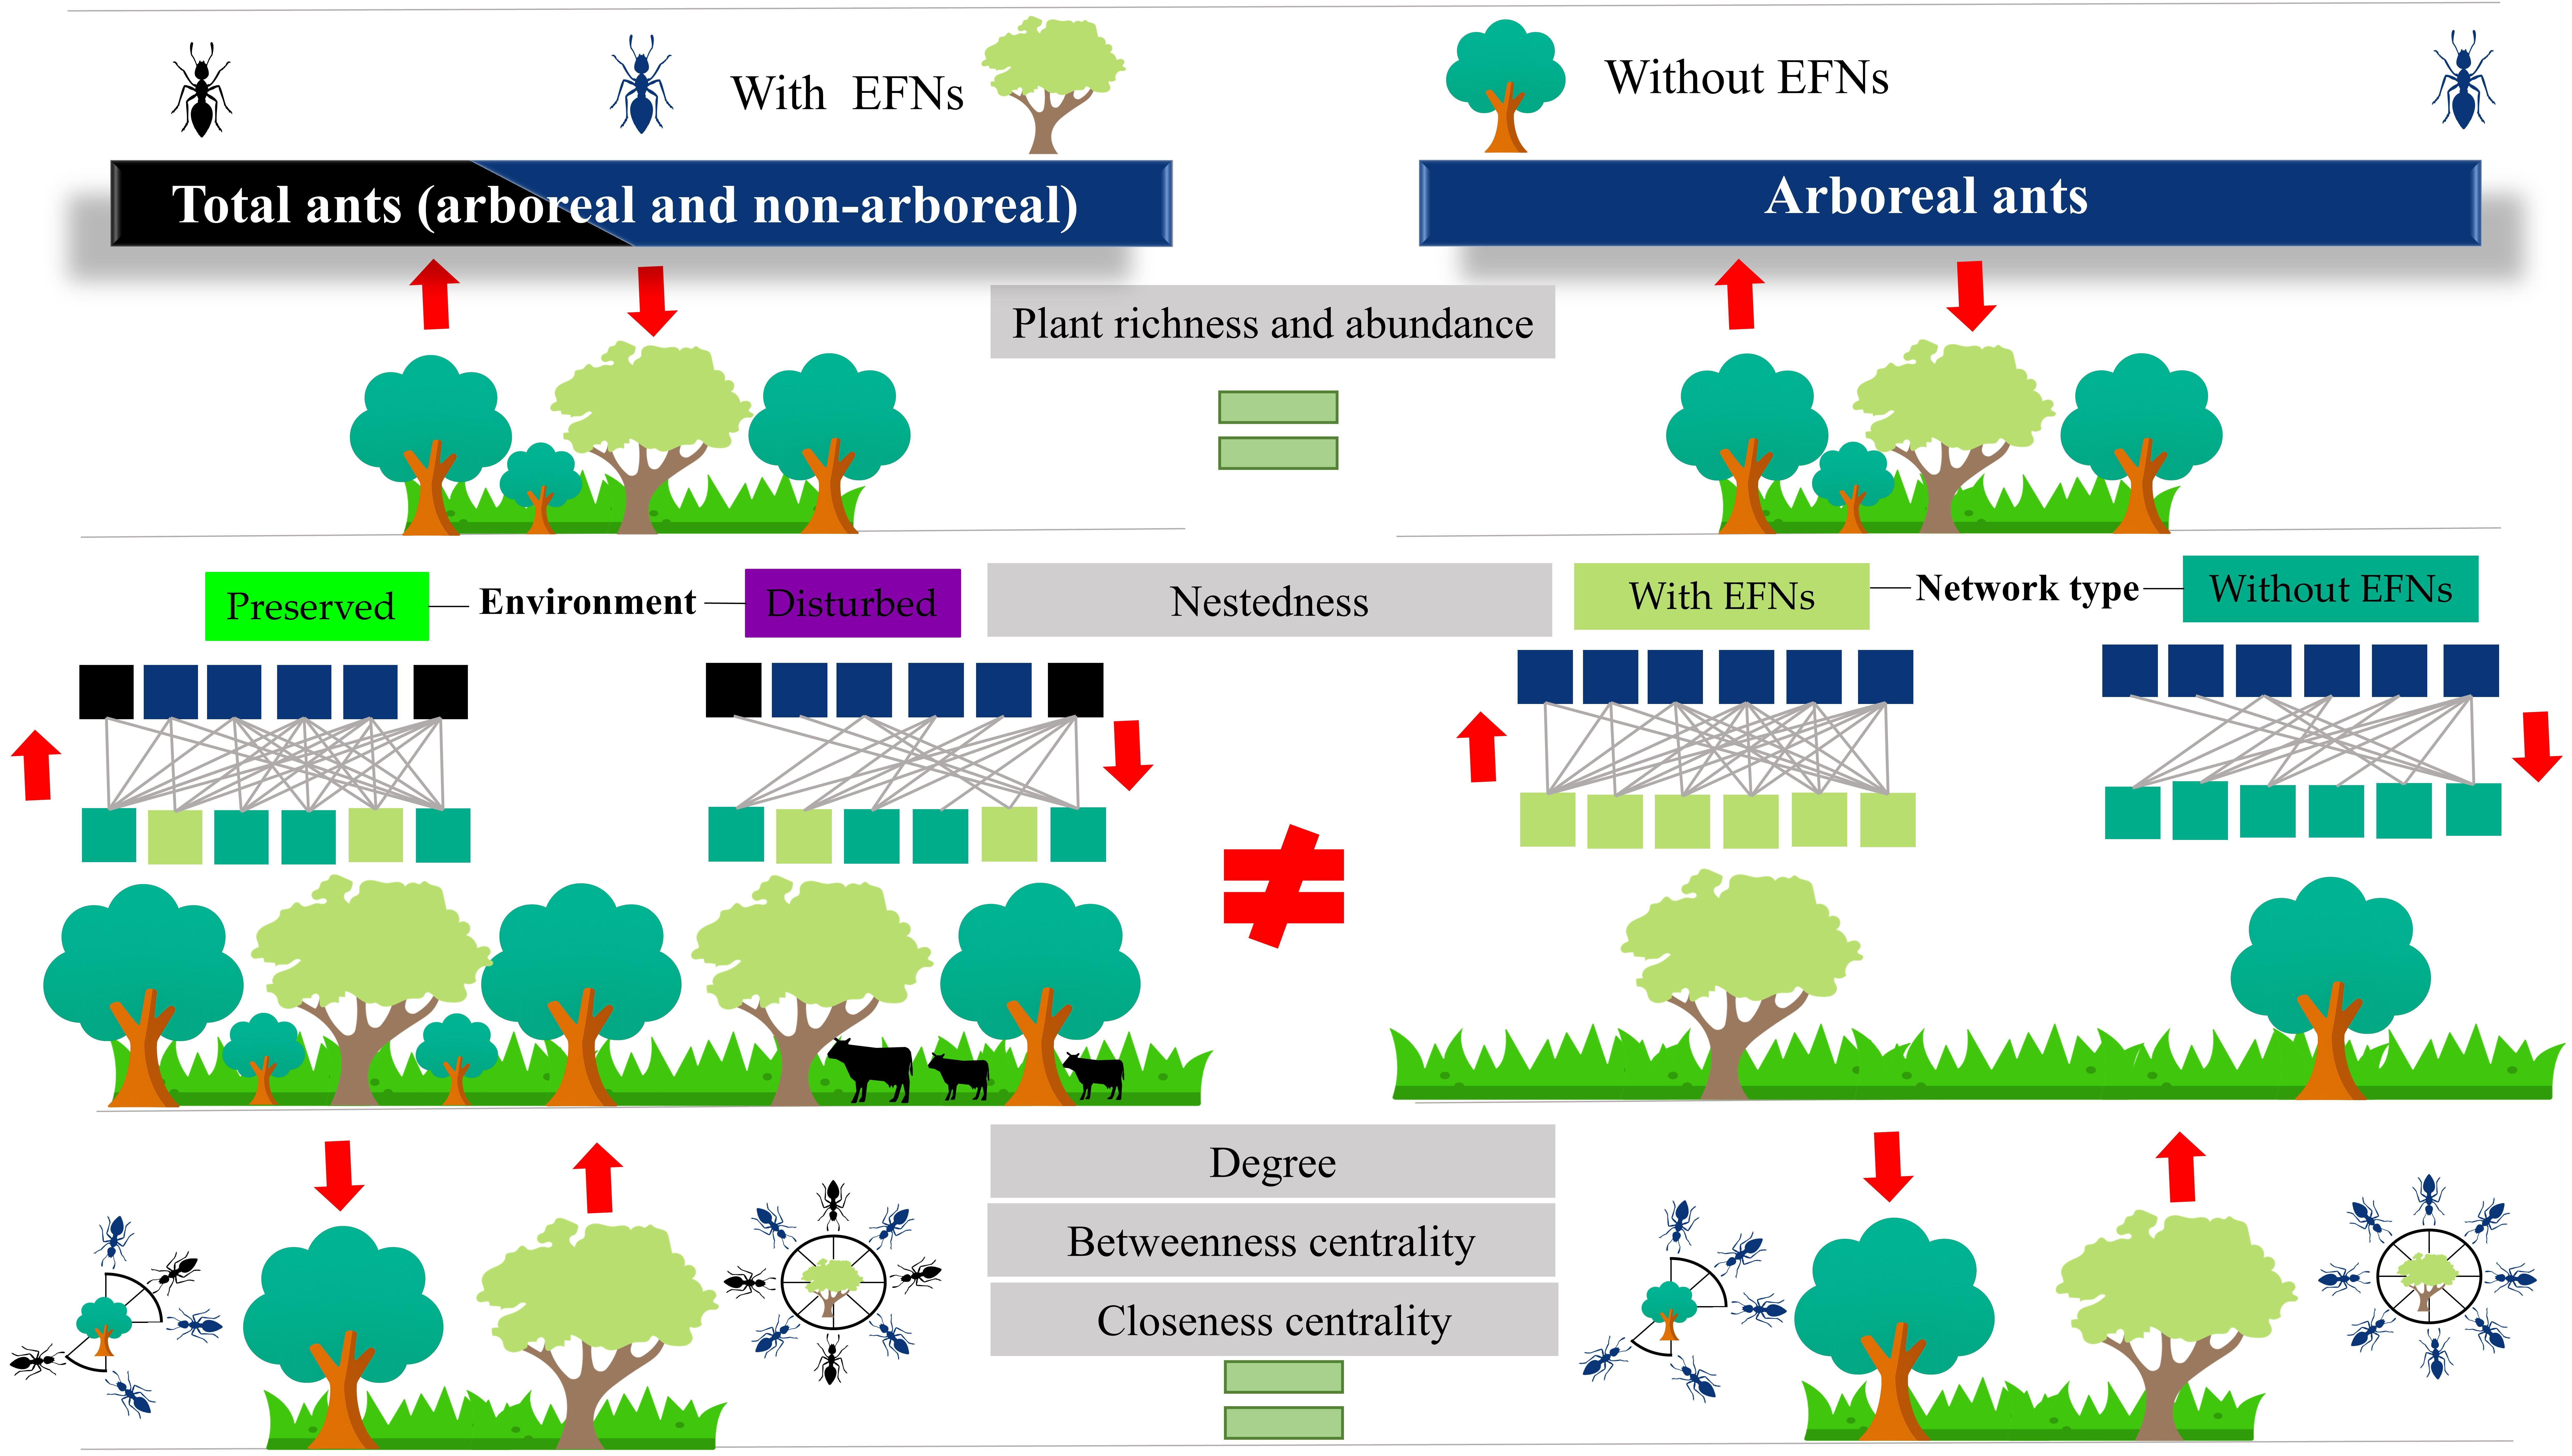
Ecological interactions are complex and influenced by historical, ecological, and anthropogenic factors. In mutualistic networks, extrafloral nectaries (EFNs) drive ant–plant interactions, and network structure depends on the ecological flexibility and degree of generalization of the species involved. We evaluated whether plant and ant diversity and topological descriptors, at both network and plant-species levels, differ between networks with and without EFNs and between conservation levels of Neotropical savannas, considering total ants (arboreal and non-arboreal) and only arboreal ants. We sampled six remnants of Neotropical savannas (cerrado sensu stricto) in the Brazilian Cerrado, three preserved and three disturbed. In total, we analyzed 24 interaction networks, involving 45 plant species, 51 ant species, and 358 distinct interactions. Plants without EFNs were richer and more abundant, and nestedness was the only descriptor that varied, being higher in preserved areas (for total ants) and in networks with EFNs (for arboreal ants). In addition, EFN-bearing species showed higher degree, betweenness centrality and closeness centrality. EFN-mediated interactions play a stabilizing role in ant–plant networks, particularly in preserved areas, and maintaining EFN-bearing plant species may promote interaction redundancy and functional resilience in human-impacted savannas.

Graphical Abstract

1. Introduction

The interactions between insects and plants are diverse in terms of the ecological functions they provide (herbivory, pollination, protection, and seed dispersal), the number and taxonomic diversity of species involved, and the types of relationship structures, ranging from highly specialized to broadly generalized and asymmetrical [1,2]. These multiple interactions among species shape biological communities by forming complex networks, which can vary substantially in structure depending on the type of ecological interaction and the degree of dependence of species on these interactions [3,4].
A highly diverse type of complex interaction network is that of ant–plant networks, which may be formed through species co-occurrence or by different resources offered by plants, such as extrafloral nectaries (EFNs) and nesting or foraging sites [5,6]. Most studies show that plants offering resources to ants, such as those with EFNs, tend to exhibit greater richness and abundance of associated ants. However, this relationship is not exclusive, as many ants foraging on these nectaries are opportunistic and may use other food sources [7,8]. Despite the increasing number of studies on ant–plant networks, few have simultaneously evaluated the interaction structure of ants with plants both bearing and lacking EFNs [7,9].
The mutualistic relationship between ants and plants that offer predictable and renewable resources provides benefits to both partners, as ant foraging activity and their presence on plants confer protection against herbivores [10,11,12]. Plants bearing EFNs reward ants with sugary nectar [12]. Extrafloral nectar is one of the most common resources offered by plants to ants [13] and is composed of amino acids, carbohydrates, lipids, and other organic compounds [14,15]. Mutualistic ant–plant networks involving plants with EFNs tend to exhibit a nested pattern [16]. This occurs because ants forage on EFN-bearing plants according to the quantity and composition of the extrafloral nectar secreted [17], but also due to the dominance hierarchy among ants on these plants [18]. In general, plants with EFNs tend to be more frequently visited by arboreal ant species (i.e., species that nest in tree canopies) [19], although ground-dwelling ants may also opportunistically exploit EFNs resources [20,21].
In plants that do not offer predictable and renewable resources, such as plants without EFNs, ants tend to use the vegetation in a more sporadic manner, for example, as a substrate for foraging [22]. In addition, some ants may opportunistically shelter and nest in cavities in tree trunks that were created and later abandoned by beetles [23]. Many ants can also act as predators of different groups of insects, especially herbivores found on leaves [24,25]. Since most ants are omnivorous, they may encounter a variety of food resources of both animal and plant origin while foraging on plants [26,27]. Because these interactions are more sporadic, networks formed by plants without EFNs generally exhibit a lower degree of nestedness compared to those involving plants with EFNs [7].
Moreover, evidence indicates that the intensification of human land use leads to habitat loss and fragmentation of remaining habitats [28], which can affect the structure of ecological interactions [29]. Anthropogenic disturbances may result in changes in plant communities [30] and in ant occurrence and distribution [31,32,33]. Consequently, the degree of specialization in mutualistic networks can be altered by different forms of disturbance [34]. Studies have shown that gradients of chronic anthropogenic disturbance, along with precipitation, can modify the stability and specialization of ant–plant networks mediated by EFNs [34,35]. In addition, aridity and chronic anthropogenic disturbances can lead to taxonomic, functional, and phylogenetic homogenization of ant communities [36]. In this way, the combination of factors such as environmental pressures, the presence of generalist species, climate change, and the dynamics of ecological interactions between ants and other species (e.g., plants and herbivores) tends to make ant communities more homogeneous and less resilient to environmental change [36].
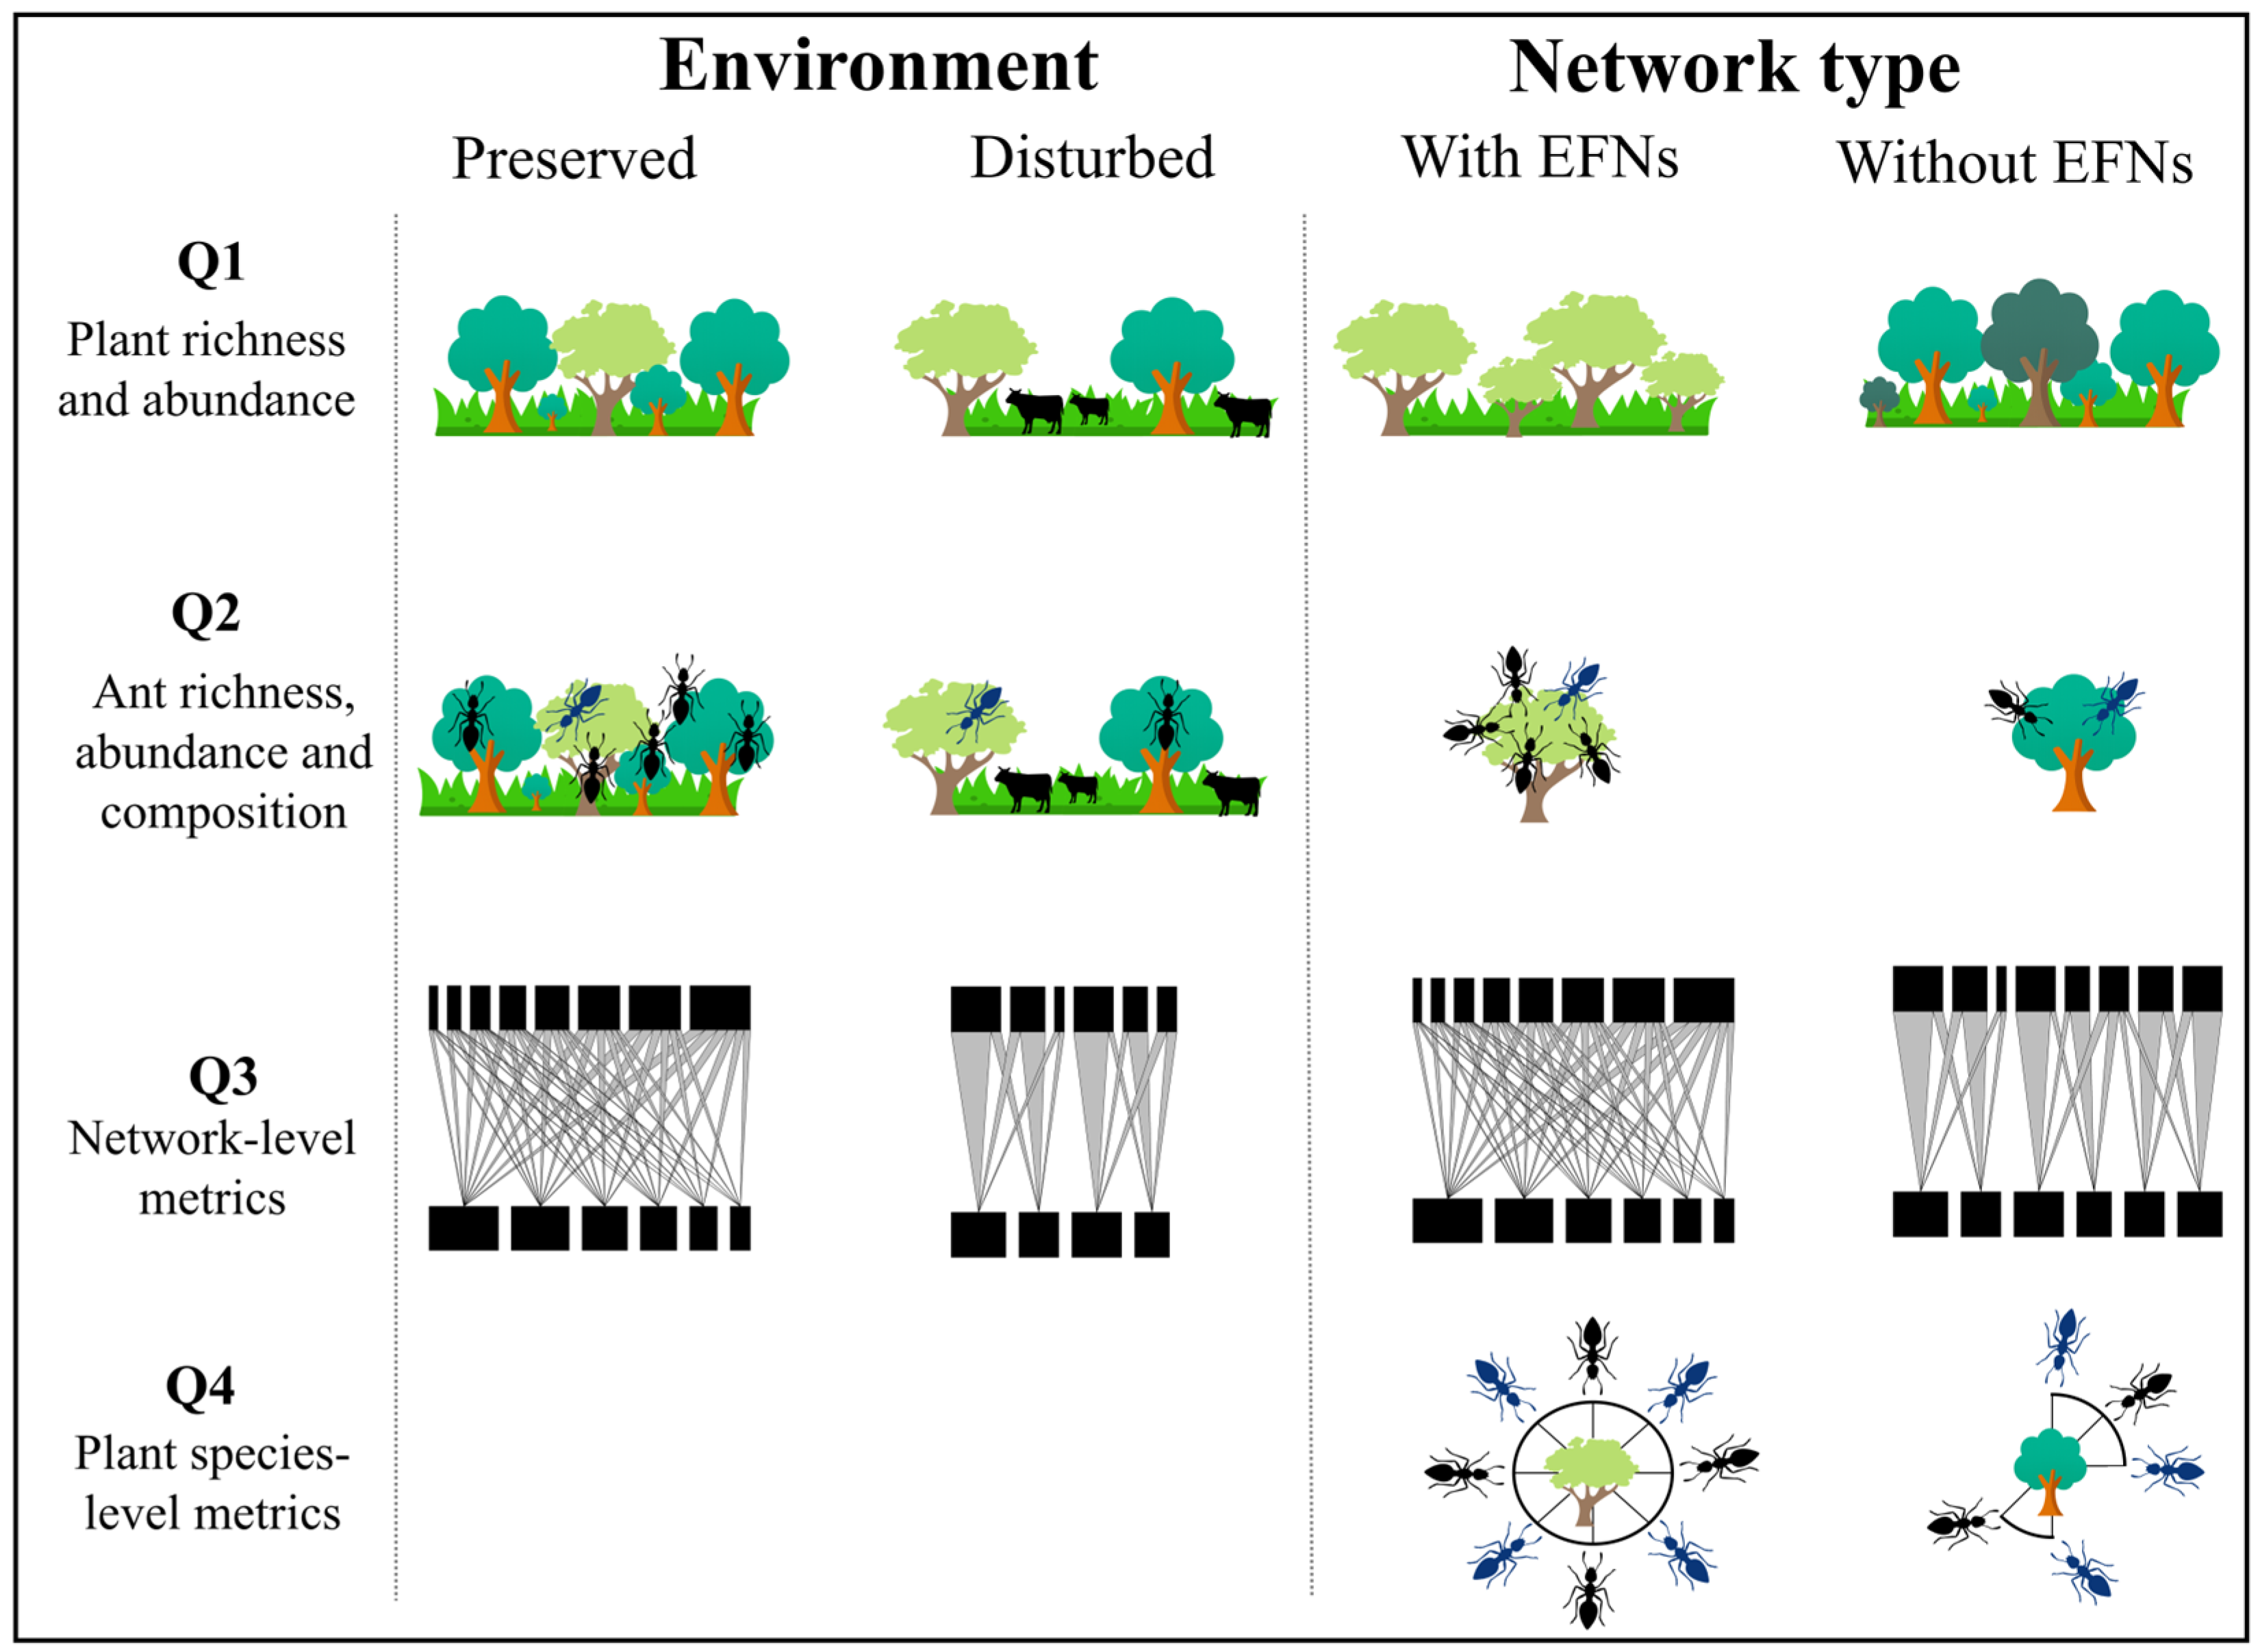
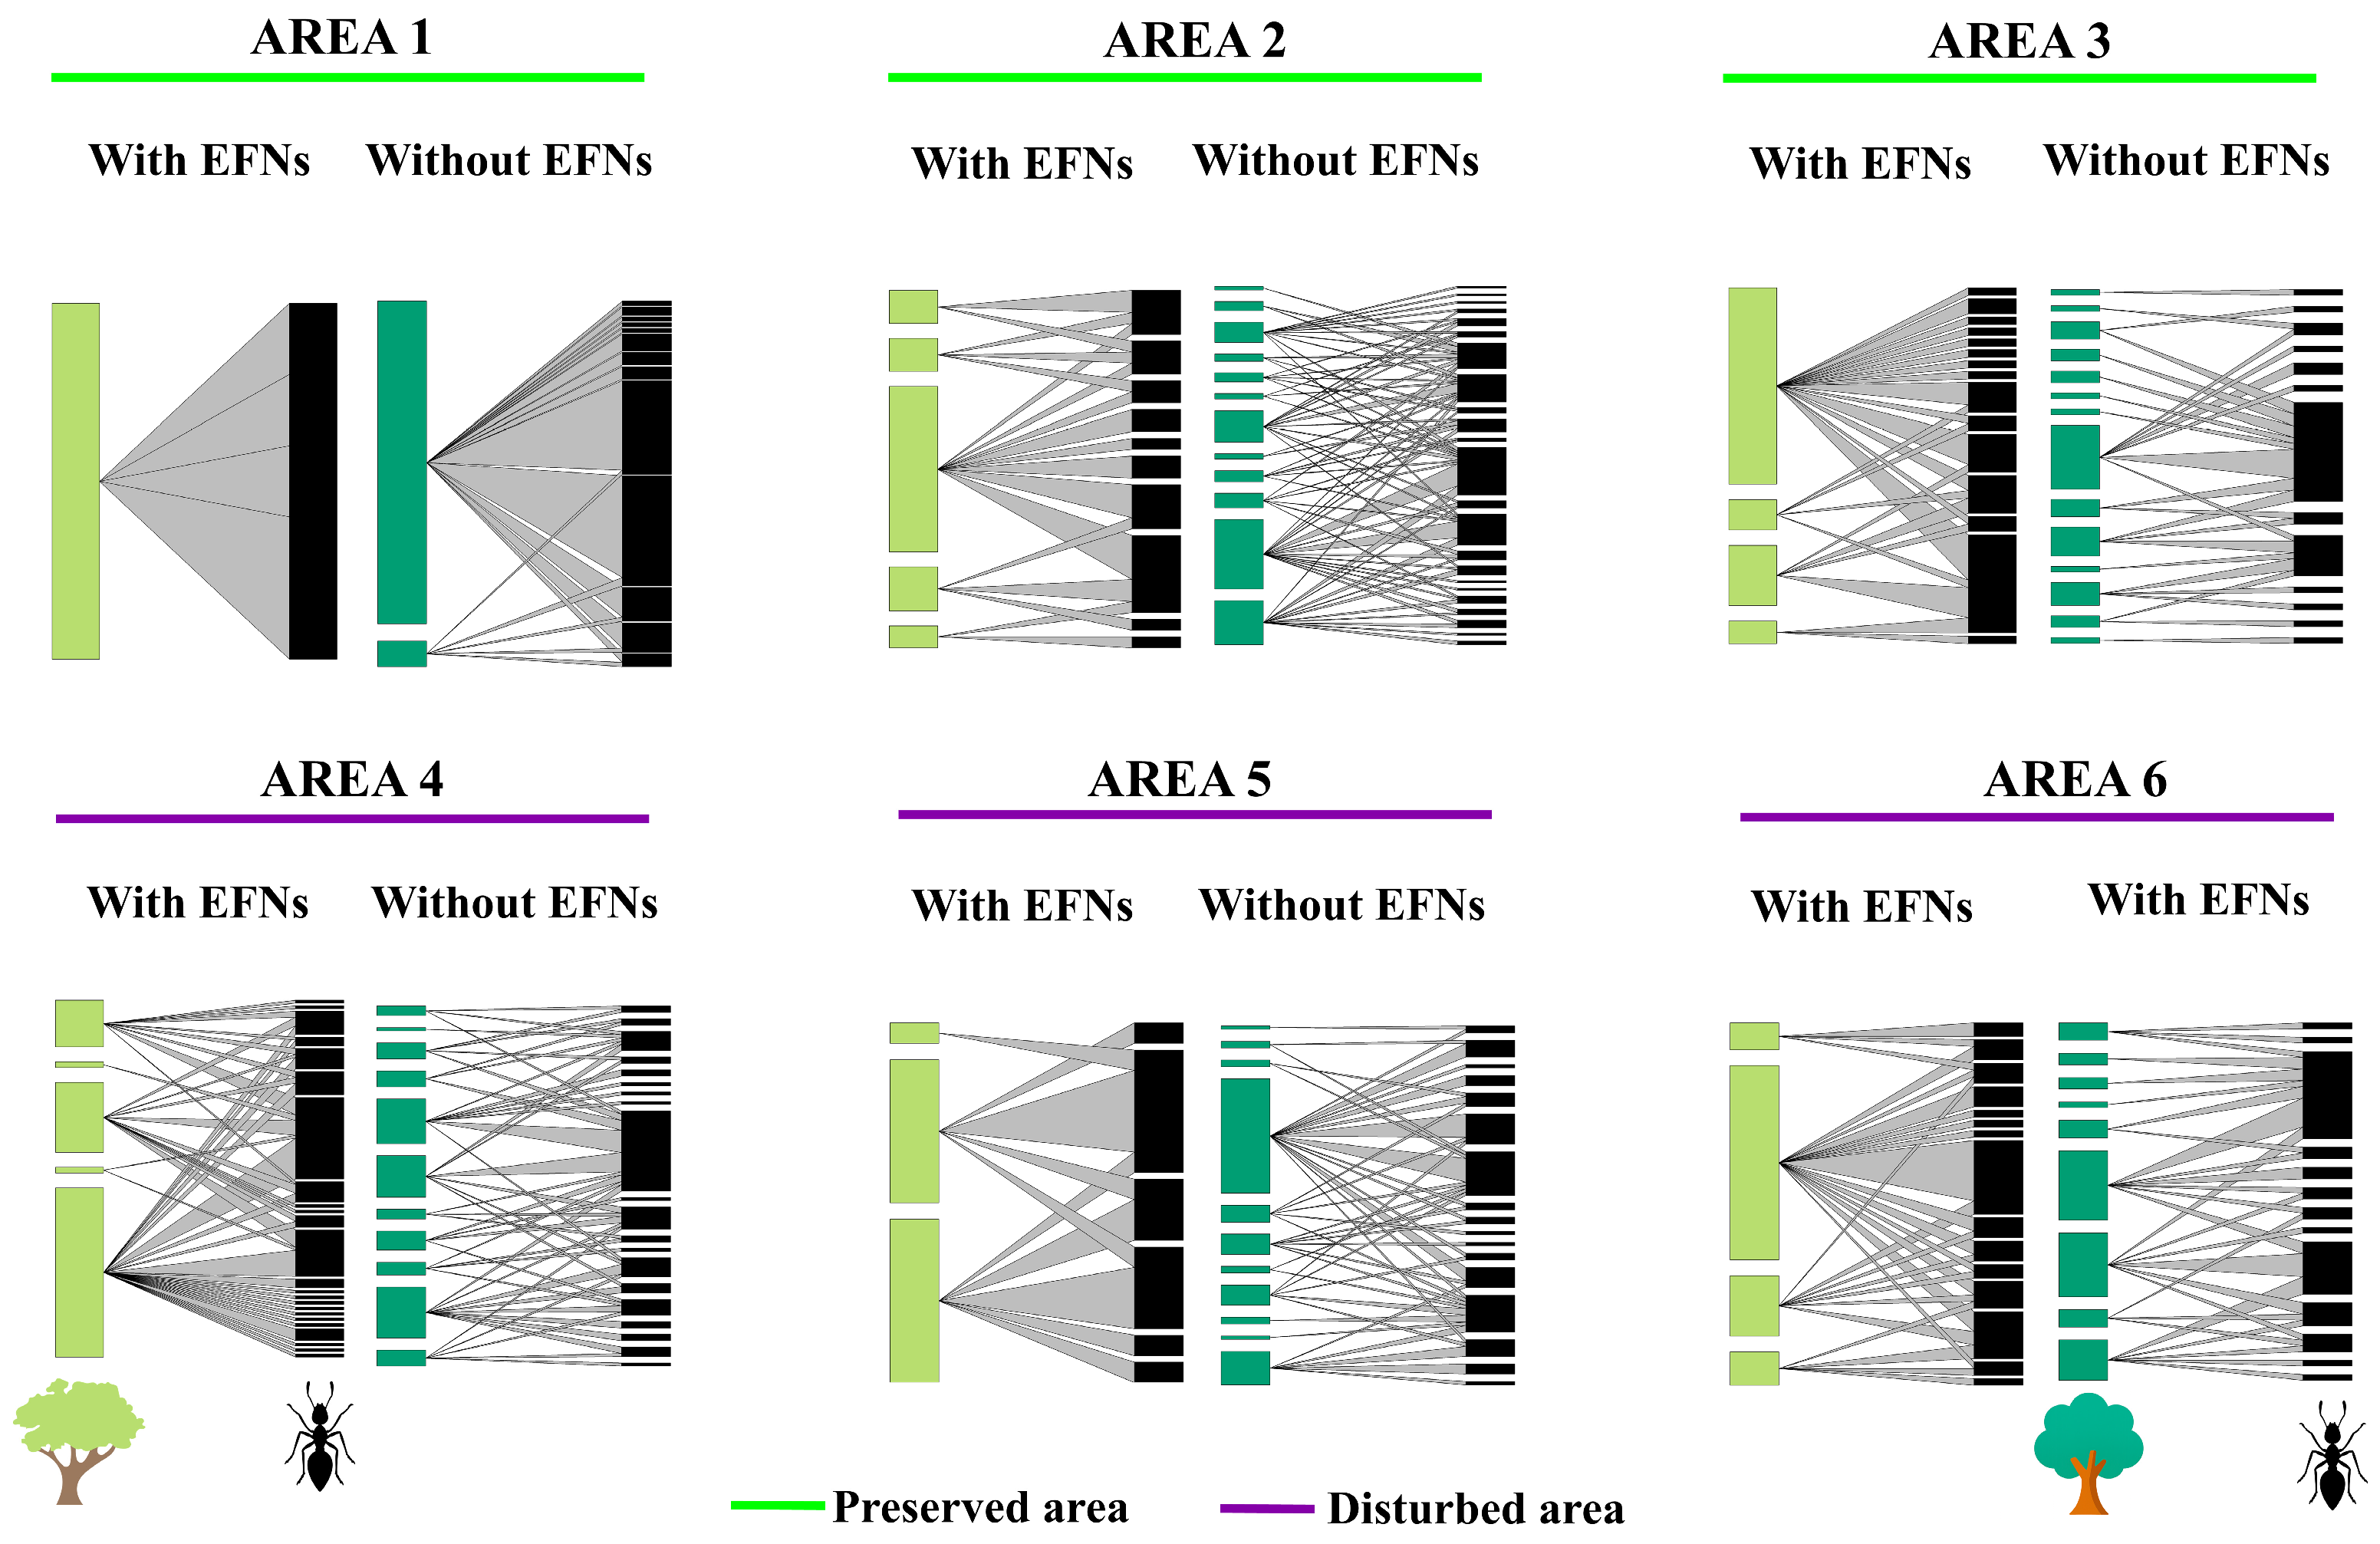
In this context, the present study aims to evaluate species diversity and the structure of ant–plant interaction networks involving plants with and without EFNs in Neotropical savannas with different levels of conservation in Brazil. Our questions are: (Q1) How do plant richness and abundance differ between network types (with and without extrafloral nectaries, EFNs) and between savanna environments with contrasting levels of conservation (preserved and degraded)? (Q2) How do ant richness and abundance vary as a function of network type, environment, and plant richness, and how does species composition vary as a function of network type and environment? (Q3) To what extent do the structural parameters of ant–plant interaction networks differ between network type and environment? (Q4) What differences are observed in topological descriptors at the plant species level as a function of network type? We hypothesize that both species diversity and the structural parameters of ant–plant interaction networks differ between savanna areas with contrasting levels of conservation and between plant communities with and without EFNs (Figure 1).
Specifically, for Q1, aligned with evidence that habitat loss is the greatest threat to biodiversity, we expect to find higher plant richness and abundance in preserved areas than in anthropogenic matrices with reduced habitat [37]; habitat integrity promotes higher plant diversity, as primary vegetation supports the highest concentrations of species, and its preservation is essential to prevent biodiversity decline resulting from fragmentation and loss of original habitat area [38]. Additionally, plants bearing extrafloral nectaries (EFNs) are expected to be more abundant, as they exhibit increased reproductive success and biomass, since these structures mediate effective biotic defenses through the attraction of ants [12]. We also expected that plant species richness would be higher in communities without EFNs than in those with EFNs, given that EFN-bearing plants represent a taxonomically restricted subset of the local flora, concentrated in few families such as Fabaceae, Bignoniaceae, and Euphorbiaceae [39,40], whereas plants lacking EFNs encompass a broader taxonomic diversity reflecting the overall species pool. For Q2, likewise, richness, abundance, and community composition of ants are predicted to vary across habitats, with preserved sites harboring more specialized species, whereas disturbed areas are dominated by generalists and opportunists. Plants with EFNs are expected to attract a greater number and diversity of ants, given the predictable and readily available resource provided by extrafloral nectar. For Q3, at the network level, interactions involving EFN-bearing plants are expected to be more connected, more nested, and less modular than networks involving plants without EFN-patterns consistent with generalist networks, which may also be less sensitive to species or interaction loss in disturbed environments. Finally, for Q4, EFN-bearing plants are predicted to occupy more central and structurally important positions within the networks (i.e., higher degree, specialization d’, and centrality), highlighting their key role in sustaining ant–plant interactions in the Cerrado.

2. Materials and Methods

2.1. Study Area

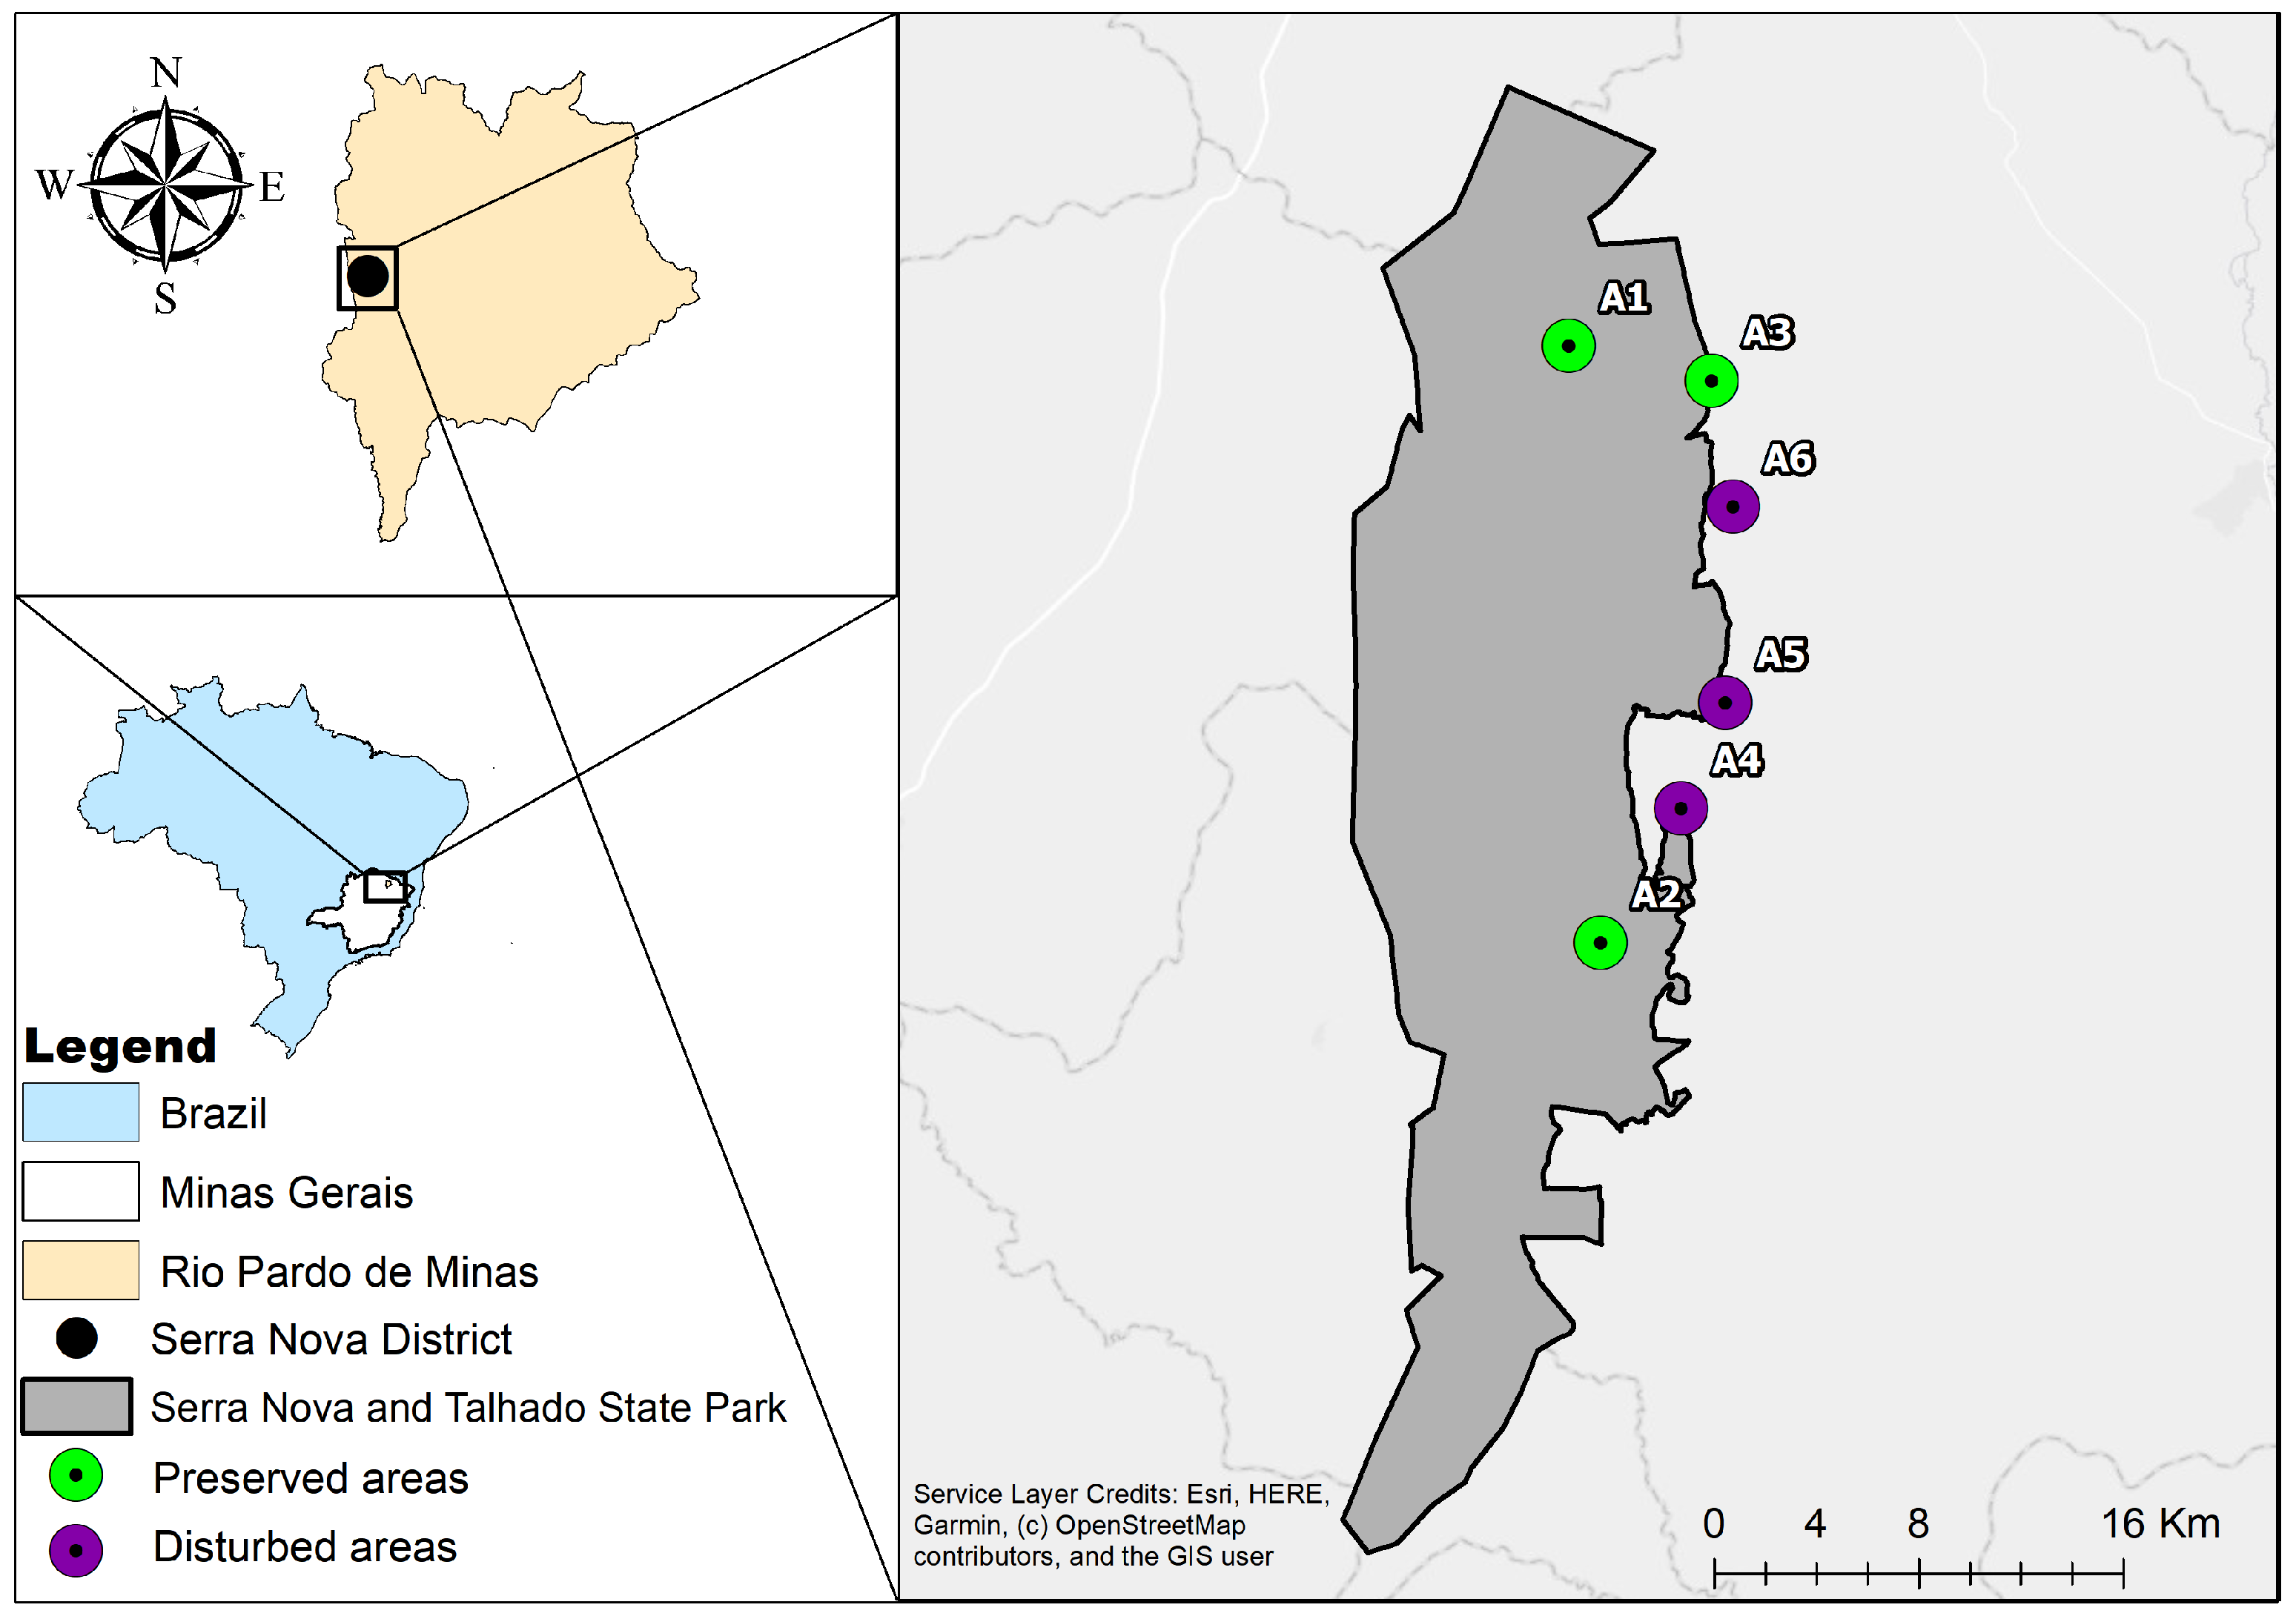
The present study was conducted in Neotropical savanna (cerrado sensu stricto) areas located within and in the buffer zone of the Serra Nova and Talhado State Park (PESNT), situated in the district of Serra Nova, in the municipality of Rio Pardo de Minas, northern Minas Gerais, Brazil (Figure 2). The region’s climate is classified as humid subtropical (Cwa) according to the Köppen classification system [41]. It exhibits marked seasonality, with well-defined dry and rainy seasons, and mean annual precipitation and temperature of 903 mm and 31.6 °C, respectively [41]. The park is characterized by mountainous formations, undulating terrain, and elevations composed of sedimentary and quartzitic rocks [42]. The relief ranges from low-altitude areas (valleys and plains) to elevations reaching up to 1200 m above sea level, forming diverse landscapes with distinct habitats that shape its biodiversity [43].
The preserved areas exhibit a vegetation mosaic composed of grasses, shrubs, and trees, which increases environmental heterogeneity and creates niches for biological refuge [43,44]. At higher elevations (1254–1225 m; x = 1.234), the vegetation consists of shrubs and widely spaced trees. At lower elevations (979–830 m; x = 908), near watercourses, there is a transition to riparian forests with higher vegetation density. Some species are particularly abundant, such as Eremanthus sp. (Asteraceae), Qualea parviflora (Vochysiaceae), and Vochysia thyrsoidea (Vochysiaceae), playing an important role in local ecological dynamics and in the diversity of insect–plant interactions [7,45]. Monitoring of the conservation unit helps control human activities, reducing disturbances and supporting the maintenance of ecological processes and local biodiversity.
The disturbed areas are located in rural environments outside the PESNT and are subjected to anthropogenic pressures that modify the landscape and reduce its structural complexity. The vegetation consists of widely spaced trees, fewer grasses, exposed soil, and a predominance of species such as Caryocar brasiliense (Caryocaraceae), which has economic and extractive importance. However, deforestation and cattle trampling hinder natural regeneration and alter the ecosystem’s conditions. Native vegetation is fragmented into pastures and agricultural areas, while settlements and unpaved roads facilitate waste disposal along the edges.

2.2. Sampling of Plants and Ants

Data collection was carried out in April (dry season) and November (rainy season) of 2023. For the sampling of plants and ants, five 100 m2 (10 × 10 m) plots were established in each of the six study areas, spaced 20 m apart from each other and from the edge, totaling 30 plots. Plot size and number followed standardized sampling designs widely used in studies of plant-associated interactions in the Brazilian Cerrado [30,46,47], and were selected to adequately capture local variation in species composition while maintaining spatial independence among samples. Similar approaches have been successfully applied in studies of plant–herbivore [47,48] and ant–plant [49] interactions, supporting the suitability of this design for interaction-based ecological studies. The plots were demarcated using a measuring tape to define the quadrants, along with string and flagging tape, and each sampling site was georeferenced. Within these plots, a phytosociological survey was conducted, in which all woody plants with a circumference at breast height (CBH), measured at 1.30 m above the ground, equal to or greater than 15 cm were selected. Each plant was tagged with numbered labels corresponding to its registry. CBH was measured with a measuring tape, and plant height was visually estimated. These data were used solely as criteria for selecting the trees and were not included in the statistical analyses.
Species identifications were carried out in situ, while specimens that could not be identified on-site were collected for later identification and processed following conventional herbarium techniques (exsiccates). Botanical families were defined according to the Angiosperm Phylogeny Group IV system [50], and species identification was based on consultation of the specific literature [51,52] and, when necessary, with the assistance of specialists. Species names and author abbreviations followed the criteria established in the Flora e Funga do Brasil database (http://floradobrasil.jbrj.gov.br (accessed on 1 March 2026)) and The Plant List (http://www.theplantlist.org/). In addition, through field observation and consultation of the literature [19,39,53,54,55], the plant community was assessed for the presence or absence of EFNs.
Ant collections were carried out on all plants marked within the plots using the beating method with an entomological umbrella [7,56,57]. For sampling, three branches were selected from each plant and subjected to ten beats per branch, totaling 30 beats per branch [49]. The beating sampling method is an effective technique for surveying ant assemblages associated with vegetation, as it captures both strictly arboreal species and ground-dwelling generalists that use plants as foraging sites, showing high efficiency in collecting both abundance and species richness [58]. Consistent with this, most studies on ants associated with plants rely on direct sampling methods, such as beating or manual collection, whereas ground-based methods are rarely used for this purpose [5]. Although this approach primarily targets vegetation-dwelling ants, it also records non-arboreal species when they are actively visiting plants. To account for their potential influence, analyses were conducted using both the complete dataset and a subset including only arboreal species. Ants that fell onto the surface of the entomological umbrella were collected using entomological forceps, preserved, and killed in Eppendorf tubes containing 70% ethanol. All ant samples were cataloged by plant, plot, and study area. Then, they were sent to the Laboratory of Ecological Interactions and Biodiversity (LIEB) at the Department of General Biology, State University of Montes Claros (UNIMONTES), for sorting, mounting, and identification to the lowest possible taxonomic level. Identification followed Baccaro et al. [59] and Feitosa and Dias [60], primarily at the genus level and as morphospecies. Species determination was based on the specific taxonomic literature (Table S1) and complemented by comparison with images and information available in the AntWeb database (https://www.antweb.org). All identifications were additionally confirmed by ant specialists.
In addition, the collected ants were classified as arboreal and non-arboreal according to Baccaro et al. [59] at the genus level, and based on the specific literature for most species (Table S1). The non-arboreal category includes ant species that build their nests and forage mainly on the ground or in the leaf litter, such as representatives of the genera Brachymyrmex, Dorymyrmex, and Pheidole, among others [59]. The arboreal category corresponds to species that nest and forage in trees, including genera such as Azteca, Cephalotes, Crematogaster, and Pseudomyrmex [59]. For the genus Camponotus, which exhibits considerable variation in nesting habits, some species may nest both in trees and in the soil [61]. Using a conservative criterion, we classified as arboreal only those Camponotus species that predominantly nest in trees. All individuals were initially sorted into morphospecies based on morphological characteristics. Subsequently, morphospecies were identified to species level whenever possible. When species-level identification was not possible, morphospecies were retained and treated as distinct operational taxonomic units in the analyses. No species were combined due to identification uncertainty. The collected specimens were deposited in the Biological Collections Center of Northern Minas Gerais (CCB/NMG) at UNIMONTES.

2.3. Metrics for Ant–Plant Interaction Networks

Weighted ant–plant interaction matrices were constructed for plant communities with and without EFNs across all areas, totaling 24 matrices, of which 12 referred to total ants (arboreal and non-arboreal) and 12 to arboreal ants. Analyses were based on the frequency of ant–plant interactions, defined as the number of times each ant species was recorded interacting with each plant species. This approach, following Dáttilo et al. [62], reduces bias caused by highly recruited species, which could otherwise inflate interaction values if based solely on individual abundance. Interactions were recorded as the presence of ants on plant individuals during beating samples, following the broad ecological network framework in which ant–plant associations encompass not only mutualistic exchanges but also foraging, prey searching, and substrate use [7,22]. This inclusive definition is standard in studies of ant–plant networks involving plants with and without EFNs [7,63], and reflects the biological reality that ants interact with plants through multiple functional pathways regardless of nectar availability. From these matrices, bipartite networks were constructed and analyzed using different topological descriptors at the network level, such as specialization (H2′), connectance (C), modularity (M), and nestedness (wNODF). These descriptors are among the most widely used for characterizing mutualistic interactions between plants and ants [5]. The specialization index (H2′) evaluates the distribution of interactions between ants and plants based on partner availability across the entire community, ranging from 0 (extreme generalization) to 1 (extreme specialization) [64].
Connectance (C) represents the proportion of realized interactions within the set of all possible interactions between species in a network [5]. Thus, it is considered an inverse measure of specialization, since networks with lower connectance tend to be more specialized [65]. Modularity (M) expresses the degree to which the network is divided into modules, that is, subgroups of species at one trophic level that interact more frequently with a specific group of species at another trophic level [66]. The modularity index was estimated using the DIRTLPAwb+ algorithm [67], which accounts for interaction frequency and yields values between 0 (no modularity) and 1 (maximum modularity). The computeModules function was used for this calculation [68]. Finally, nestedness was evaluated using the wNODF metric, which estimates the degree of nestedness in weighted matrices by considering not only the presence of interactions but also their intensity [69].
All network-level metrics were standardized using z-scores due to differences in network size. In the case of nestedness, this standardization is particularly important because the metric can be influenced by species richness, connectance, and interaction heterogeneity [7]. This procedure ensures that the observed differences reflect biological patterns rather than merely the structural configuration of the matrices. To assess whether the observed metrics (specialization, connectance, modularity, and nestedness) were greater than expected, we used 500 random networks generated using the r2dtable null model (method = 1) from the bipartite package (version 2.21) in R [68]. The null networks were used to calculate z-scores by comparing the values of the real (observed) networks with the distribution obtained from the null networks (see details in [7]).
In addition to the network-level descriptors, we also calculated plant species-level descriptors, such as degree (K), specialization (d’), betweenness centrality (BC), and closeness centrality (CC). Degree refers to the number of links between two species [5]. The specialization index d’ compares the distribution of interaction frequencies of a species in relation to the availability of interaction partners [64].
This index varies between specialized species (1) and generalist species (0) [64]. Betweenness centrality measures how often a species (node) appears in the shortest paths within the network; thus, higher values indicate that the removal of this species would influence several other network connections [70]. Closeness centrality measures how close a species (node) is to all others; therefore, higher values indicate a greater influence of that species on the network if it were removed [70]. The networks and the descriptors mentioned above were calculated in R software version 4.5.0 [71].

2.4. Data Analyses

To evaluate the sampling sufficiency of ant–plant interactions, rarefaction curves were constructed for each of the six study areas. Interaction records were organized into abundance matrices, in which each column corresponded to a unique interaction between a plant species and an ant species. Within each area, the frequency of each interaction was quantified separately for each plot, so that each row of the matrix represented the frequency of occurrence of a given plant–ant pair within a sampling plot. Rarefaction and extrapolation curves were estimated using the iNEXT package (version 3.0.2) [72], using Hill numbers of order zero (q = 0), corresponding to interaction richness. Analyses were performed using abundance data (datatype = abundance), and confidence intervals were obtained from 1000 bootstrap resamplings. For graphical representation, sample-size-based rarefaction/extrapolation curves (type = 1) were used. Curves were constructed separately for interactions involving plants with extrafloral nectaries (EFNs), plants without EFNs, and for the total set of interactions. The rarefaction and extrapolation curves suggest that the sampling effort was sufficient to capture most of the interaction richness recorded in each study area (Figure S1).
The analyses described below were conducted considering both the total ant dataset (arboreal and non-arboreal) and the arboreal ant dataset. Generalized linear models (GLMs) were constructed to evaluate differences in network structure as a function of network type and environment. Network type was treated as a categorical variable with two levels, representing networks including plant species with EFNs and networks excluding these species. Environment (preserved vs. disturbed) and the interaction between these factors were included as explanatory variables. In these models, plant and ant species richness and abundance were used to answer research questions Q1 and Q2, respectively. We quantified ant richness and abundance for both the total assemblage and for arboreal ants. This dual approach allowed us to assess whether non-arboreal species that sporadically forage on vegetation could affect the observed patterns across network types. Each dataset was analyzed independently using the same statistical procedure. Additionally, to answer question Q2, ant species composition was analyzed considering network type and environment. Samples were ordinated using NMDS based on the Bray–Curtis similarity index, and the significance of groupings was assessed by ANOSIM with 1000 permutations, performed using the vegan package (version 2.6-10) [73].
We used the network-level descriptors (specialization H2′, connectance C, modularity M, and nestedness wNODF) as response variables to answer research question Q3. For count variables (plant and ant richness and abundance), the models were fitted using the Negative Binomial distribution family. For Negative Binomial models, effects were tested using deviance ANOVA with a chi-square test (Chisq). For models in which the variables corresponded to z-score standardized descriptors (H2, C, M, and wNODF), the Gaussian distribution family was used and significance tests were performed using ANOVA with the F-test.
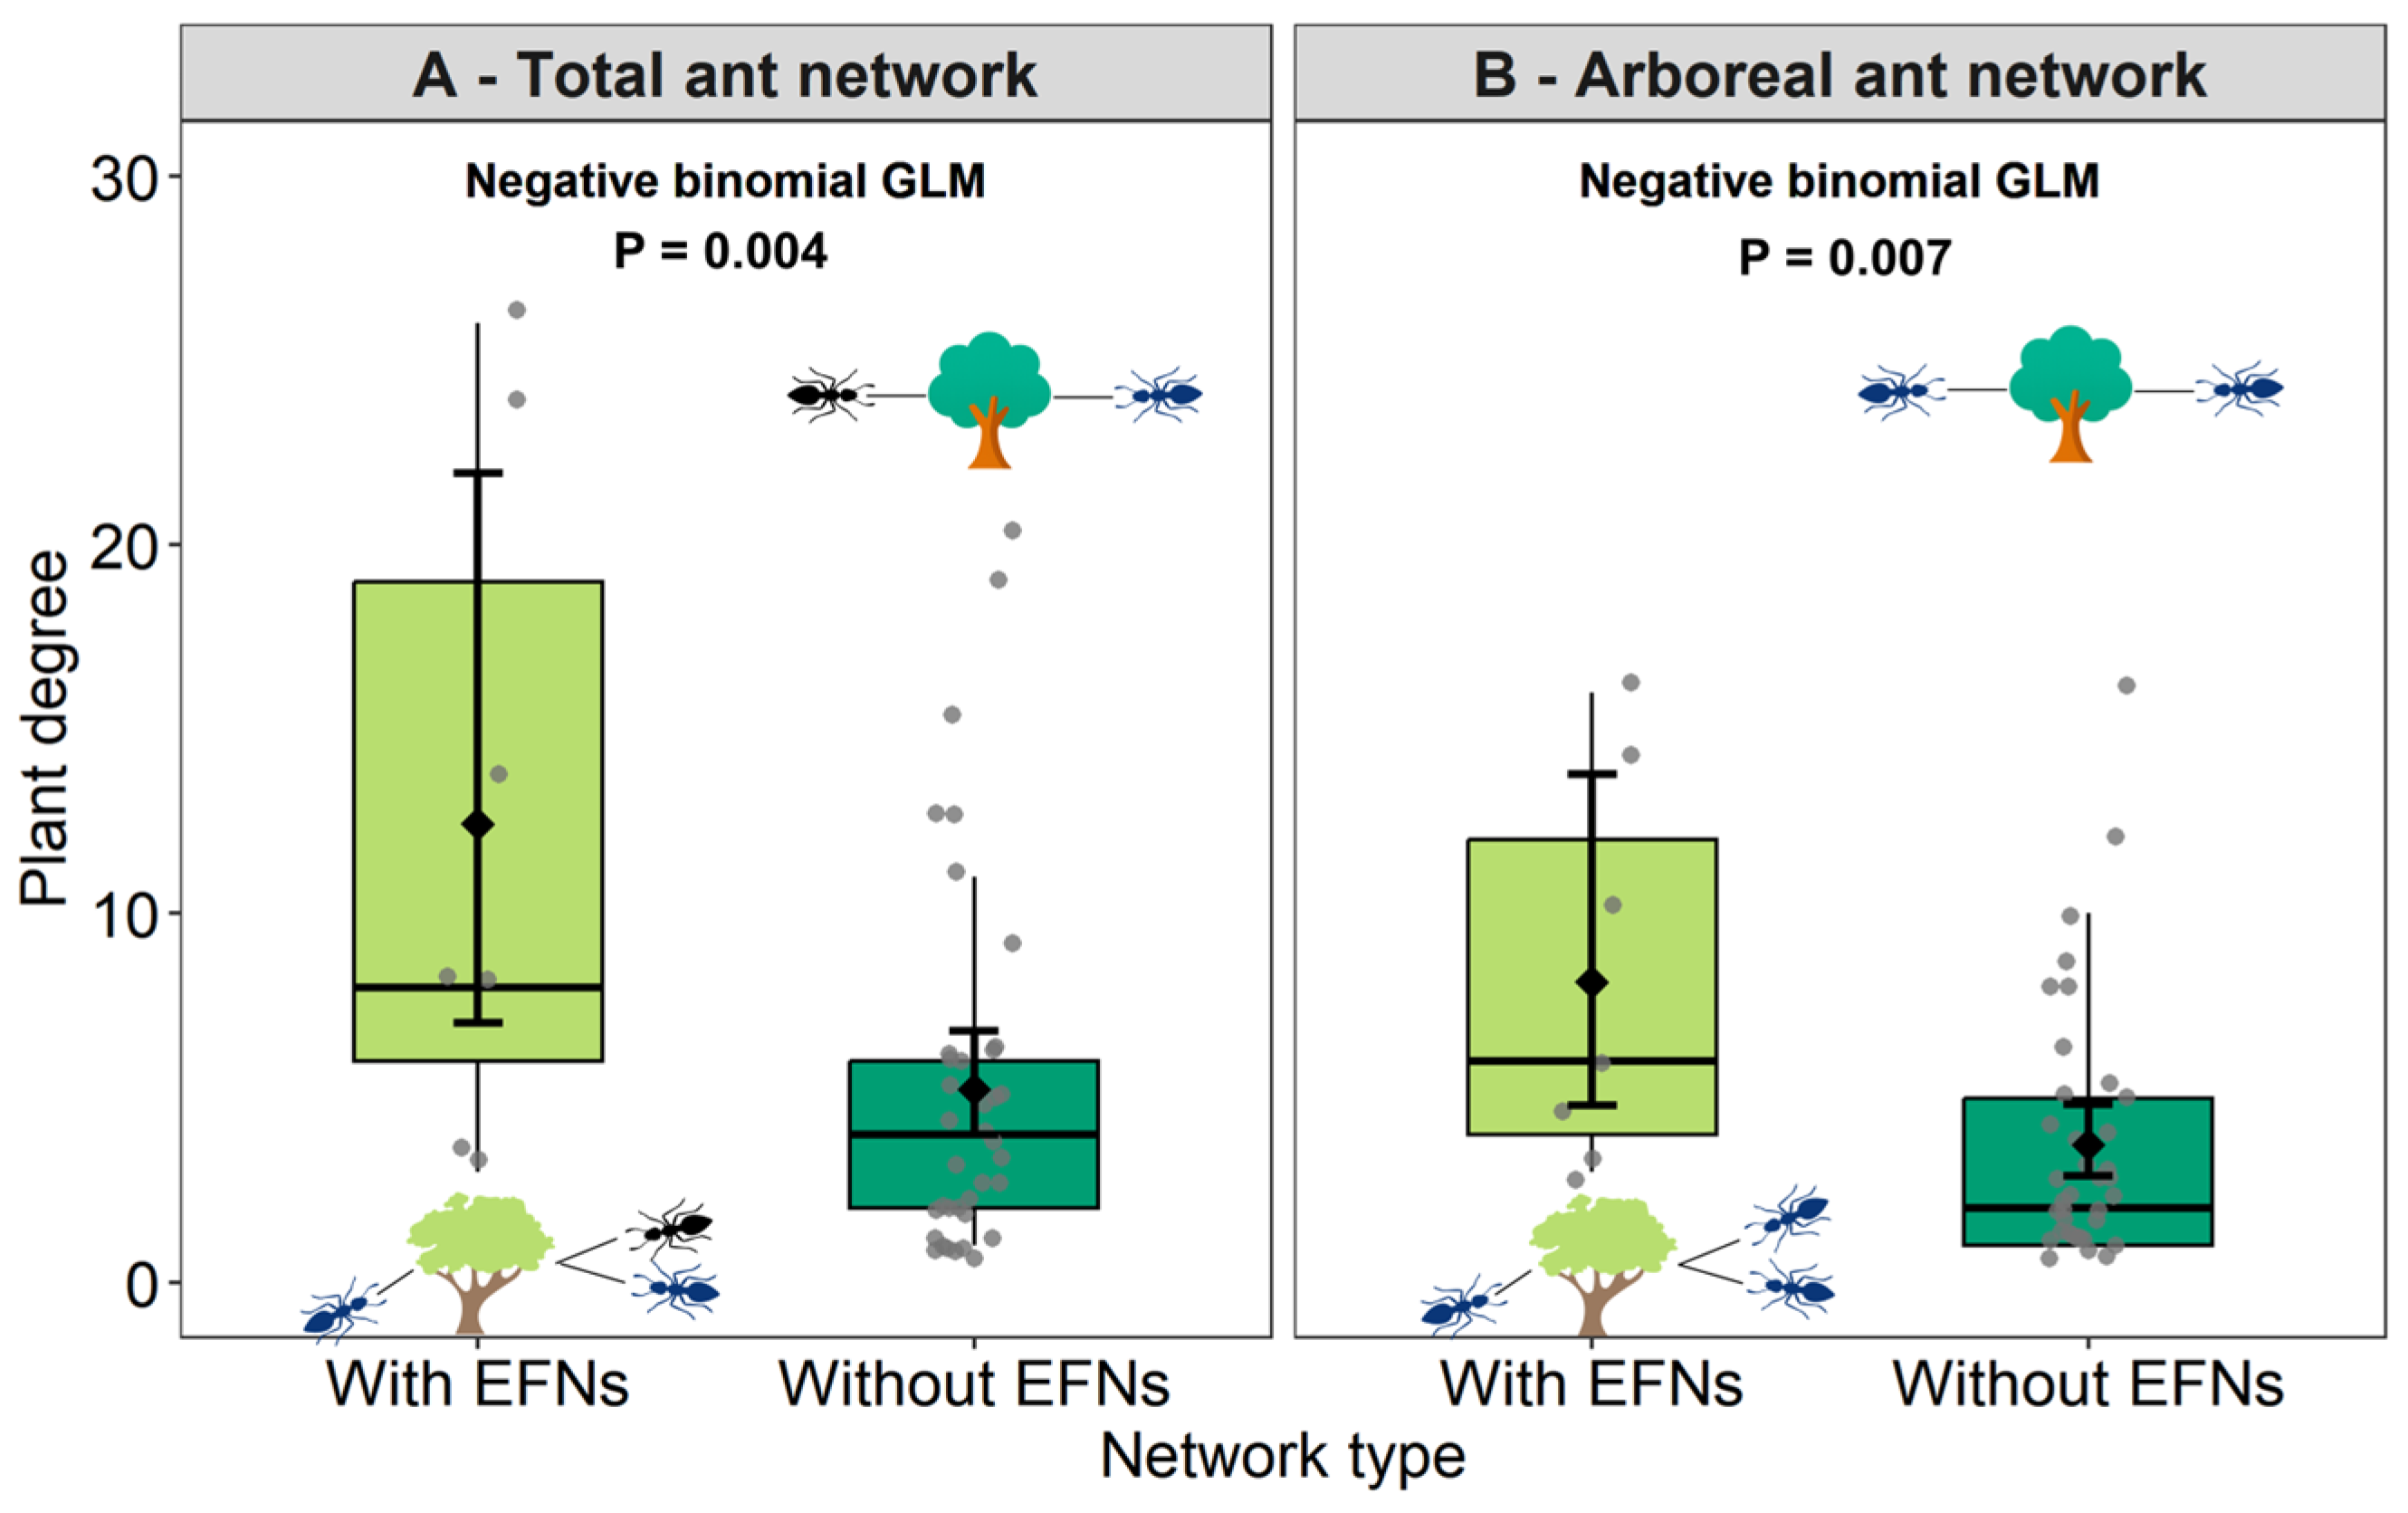
To address research question Q4, plant species-level topological descriptors (degree, specialization d, betweenness centrality, and closeness centrality) were analyzed using two overall ant–plant interaction matrices, constructed separately for networks with and without extrafloral nectaries (EFNs). In all analyses, the explanatory variable was network type (with and without EFNs), whereas the response variables corresponded to plant species-level topological descriptors. The analyses were performed using generalized linear models (GLMs), adopting for each metric the distribution that best matched the nature of the data. Degree was analyzed using a negative binomial distribution, the specialization index d was analyzed using a Gaussian distribution, betweenness centrality was analyzed using a Tweedie distribution with a log link function, and closeness centrality was analyzed using a Gamma distribution with a log link function. The degree and specialization d models were fitted using the glm.nb and glm functions, respectively.
The centrality models were fitted using the glmmTMB package (version 1.1.14), given its ability to accommodate a wide range of distribution families [74], and it was particularly suitable for modeling betweenness centrality using a Tweedie distribution. In addition, for the closeness centrality model, the dispersion structure was also modeled as a function of network type (dispformula = ~Tipo), a feature not available in the standard glm framework. The significance of the effect of network type was assessed using analysis of deviance with chi-square tests for degree, betweenness centrality, and closeness centrality. For the specialization index d’, significance was assessed using type II ANOVA with an F-test, implemented in the car package (version 3.1-3) [75].
For all models, residual diagnostics were assessed using the simulateResiduals function from the DHARMa package (version 0.4.7) [76]. The dispersion parameter was calculated as the ratio (deviance per df residual), with values close to 1 indicating an adequate fit, while values above 1.5 confirmed overdispersion. The residuals did not show significant deviations from normality or homoscedasticity (see Figures S2–S5 for details of the total ant dataset and Figures S6–S9 for the arboreal ant dataset). All analyses were conducted in R software version 4.2.3 [71].

3. Results

3.1. General Characteristics of Ant–Plant Interaction Networks

The ant–plant interaction networks (Figure 3), considering all ant species (arboreal and non-arboreal), were composed of 272 plants from 45 species, 2128 ants from 51 species, and 358 distinct interactions. Specifically, the networks of plants with EFNs included 84 individuals (30.9%), distributed across seven species and four botanical families (Table S2). The most abundant families were Vochysiaceae, with 42 individuals (50.0%) and two species, Caryocaraceae with 21 individuals (25.0%) and one species, and Fabaceae with 20 individuals (23.8%) and three species. In contrast, the networks of plants without EFNs included 188 individuals (69.1%), distributed across 38 species and 23 families (Table S2). The most abundant families in this category were Fabaceae, with 50 individuals (26.6%) and six species, Vochysiaceae with 48 individuals (25.5%) and two species, and Asteraceae with 24 individuals (12.8%) and three species.
The diversity of ants associated with plants with EFNs consisted of 892 individuals (41.9%), distributed across five subfamilies, 16 genera, 38 species, and 123 interactions (Table S3). The most representative ant genera were Pseudomyrmex with eight species, and Camponotus and Cephalotes, each with six species. However, one of the most abundant species belonged to the genus Crematogaster, specifically Crematogaster chodati, with 398 individuals (44.6%). In addition, Cephalotes pusillus with 109 individuals (12.2%) and Camponotus crassus with 53 individuals (5.94%) were also abundant. In contrast, the diversity of ants associated with plants without EFNs was higher, totaling 1236 individuals (58.1%), distributed across five subfamilies, 16 genera, 45 species, and 235 interactions (Table S3). The most representative ant genera in these networks were Camponotus with 11 species, Cephalotes with eight species, and Pseudomyrmex with seven species. For these networks, one of the most abundant species also belonged to the genus Crematogaster, specifically Crematogaster chodati with 376 individuals (30.4%). Additionally, Cephalotes pusillus with 141 individuals (11.4%) and Camponotus crassus with 107 individuals (8.66%) were also abundant in plants without EFNs.
Similar patterns were observed in the arboreal ant dataset. In summary, the ant–plant interaction networks (Figure S10) were composed of 251 plants from 44 species, 1739 ants from 29 species, and 260 distinct interactions. As in the total dataset, plants without EFNs were more abundant (69.3%) and exhibited higher richness (37 species across 22 families, Table S4) than plants with EFNs, which were less abundant (30.7%) and less diverse (7 species across 4 families, Table S4). In the networks of plants with EFNs, nine ant genera were recorded (Table S5); Cephalotes and Pseudomyrmex remained representative, while Crematogaster gained prominence, with four species, surpassing Camponotus. These networks comprised a total of 87 interactions. In the networks of plants without EFNs, nine ant genera were also recorded (Table S5), again with a strong presence of Crematogaster, totaling 173 interactions. In both network types, Crematogaster chodati, Cephalotes pusillus, and Camponotus crassus remained the dominant species.

3.2. (Q1) and (Q2) Effects of Network Type and Environment on Plant and Ant Richness, Abundance, and Composition

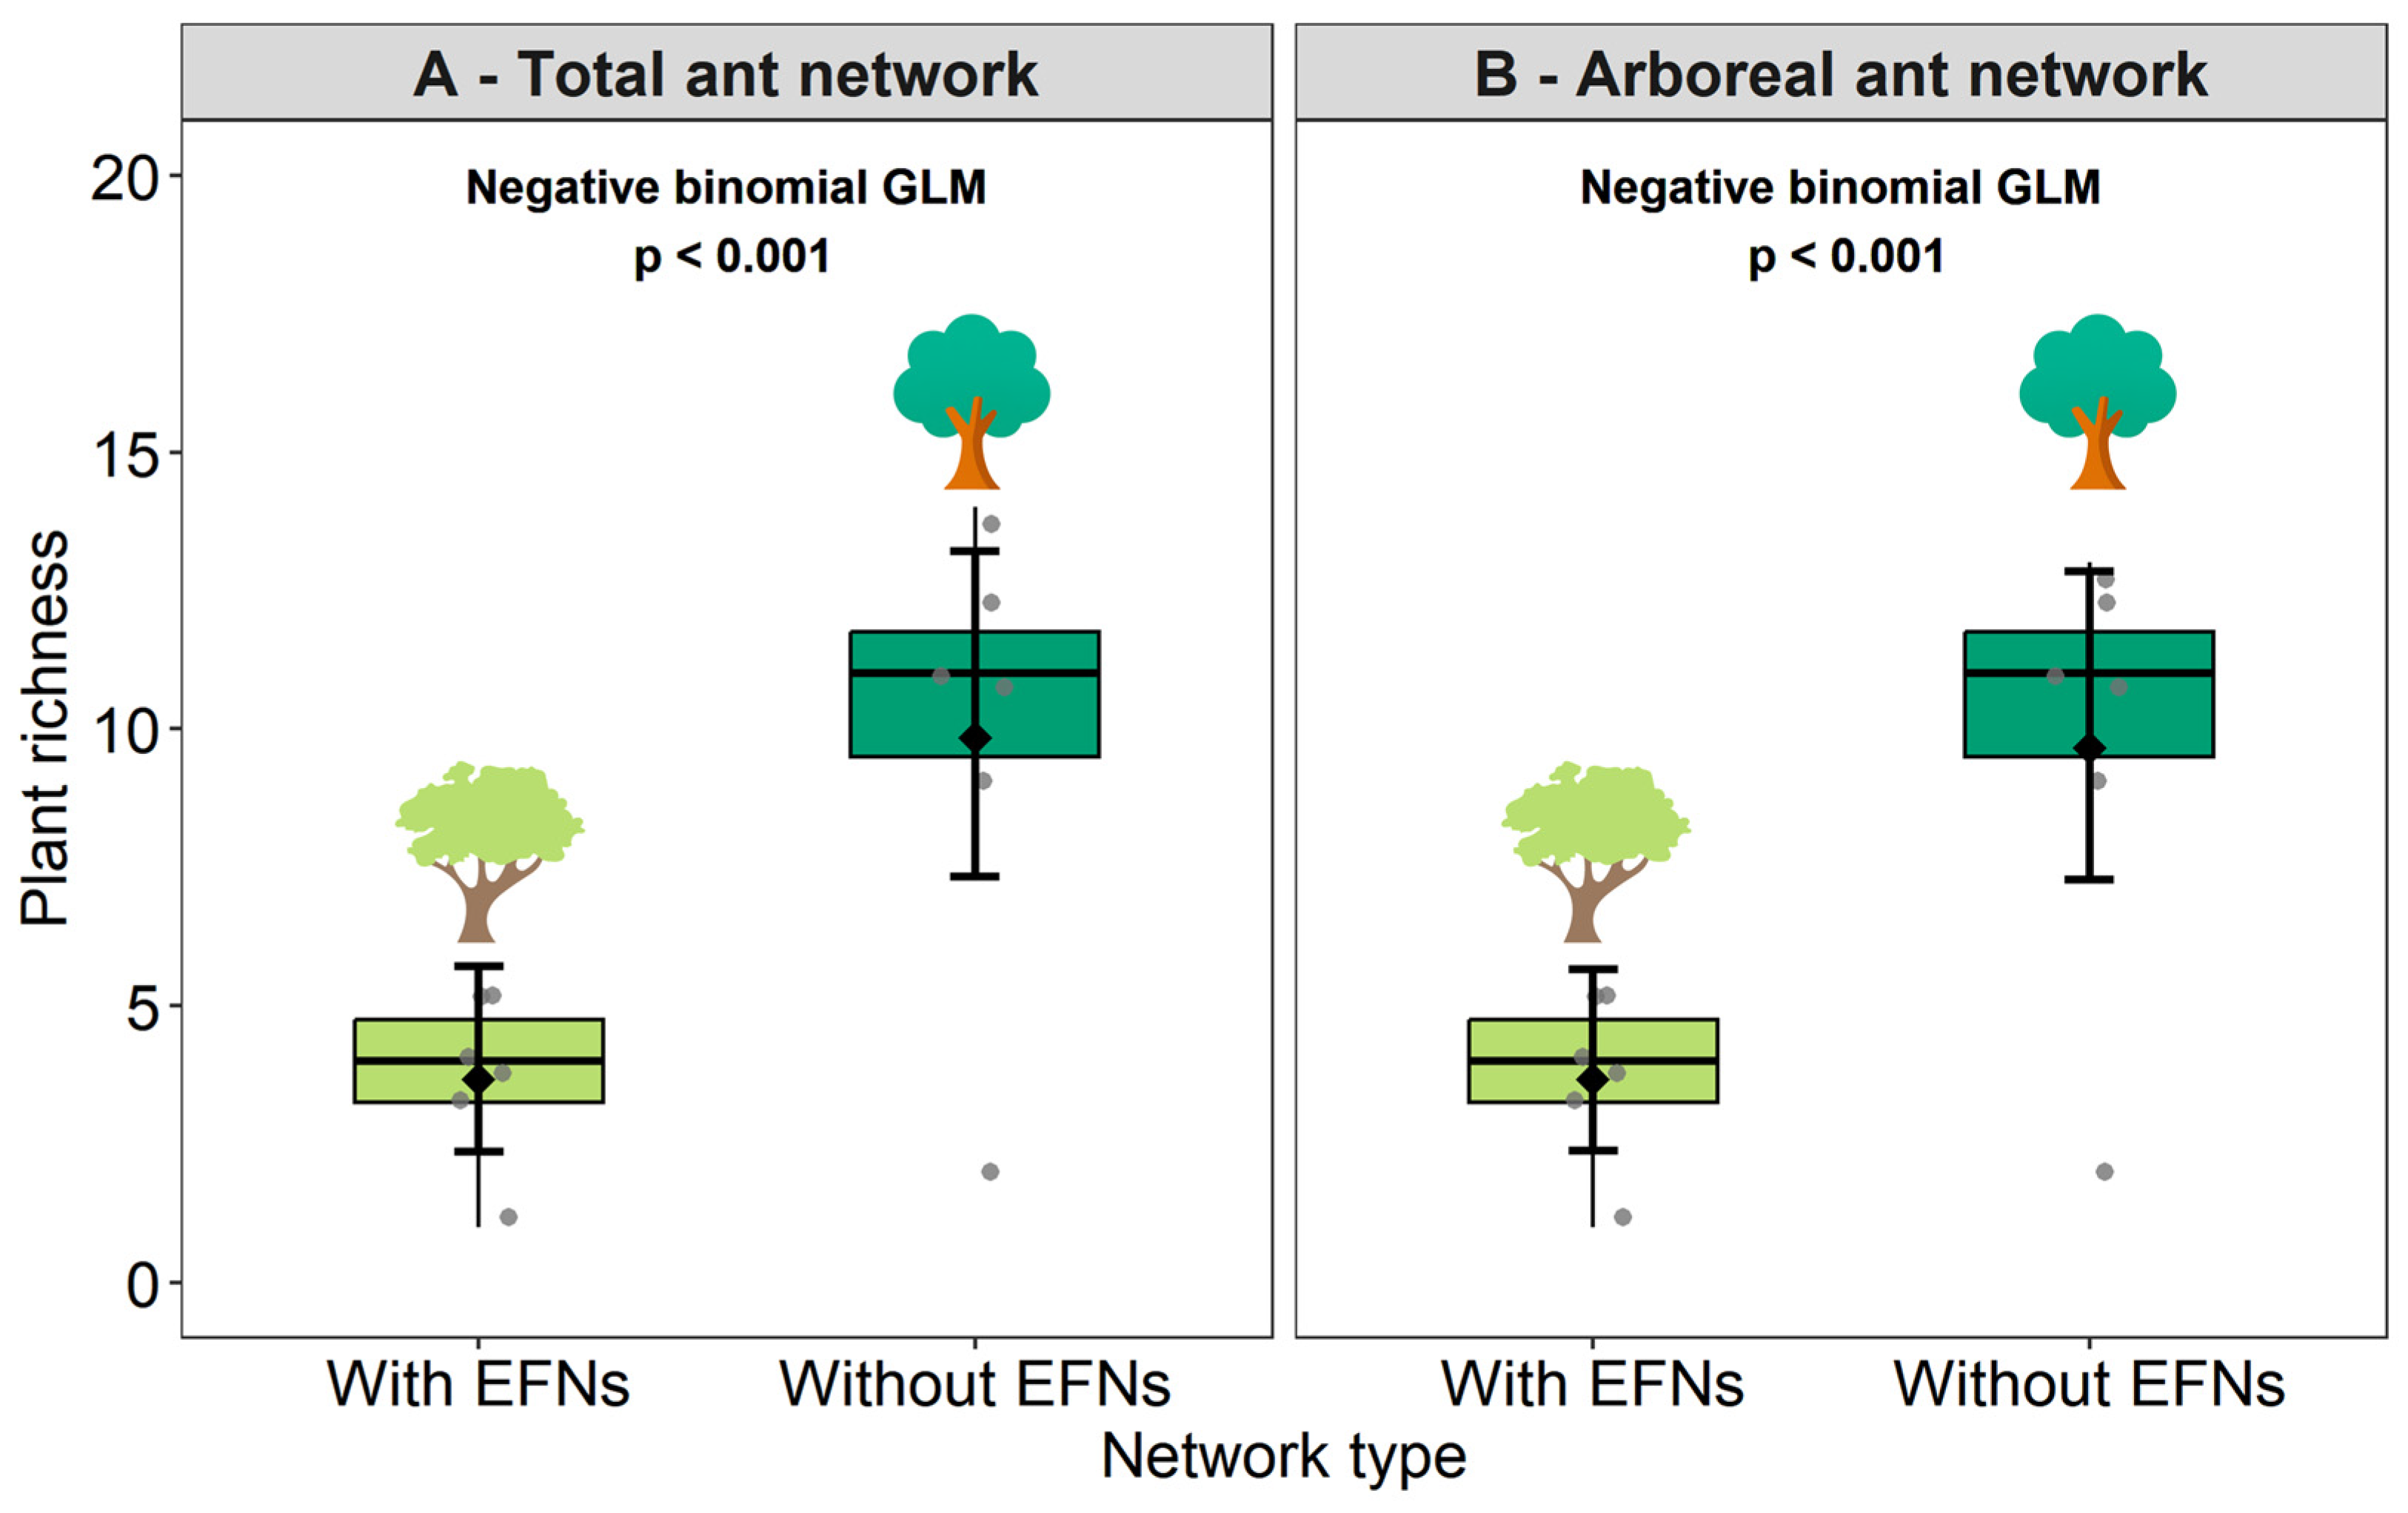
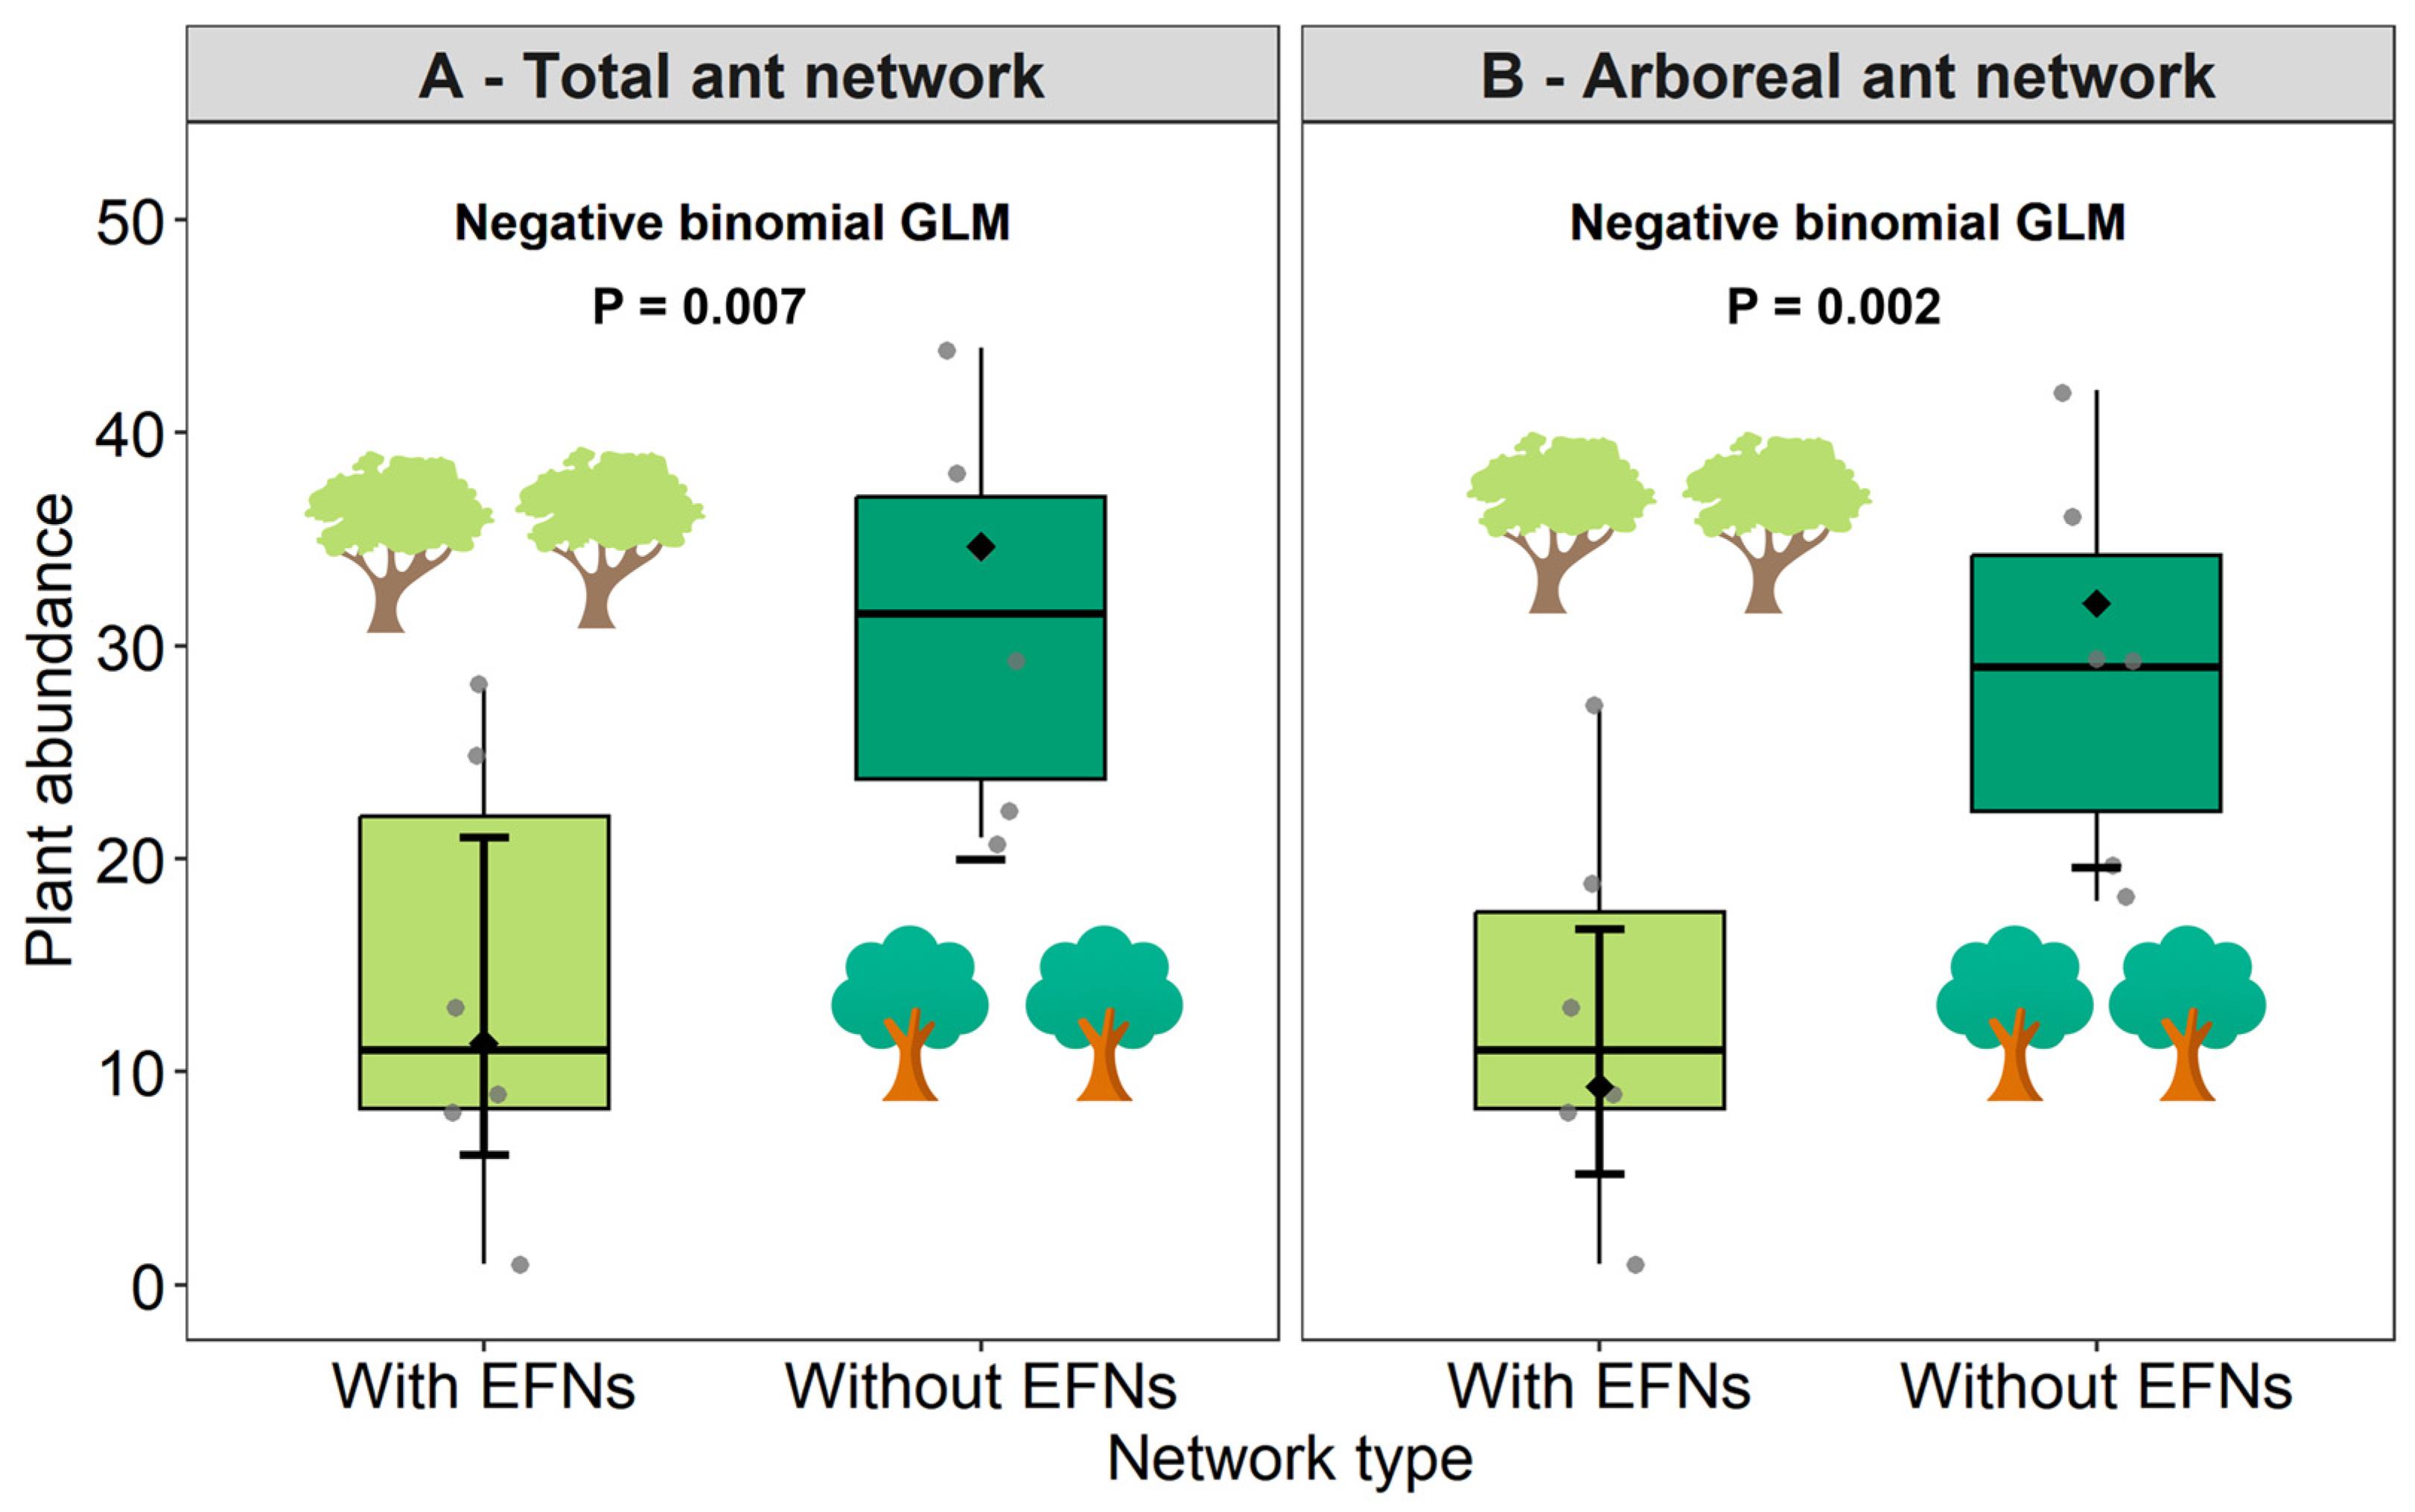
When considering ant–plant interaction networks composed of all recorded ant species (arboreal and non-arboreal), plant species richness and abundance differed significantly between network types (Table 1). Networks formed by plants without EFNs exhibited higher richness (mean 9.83 ± SD 4.17; Figure 4A) and abundance (31.3 ± 9.07; Figure 5A) compared to networks with EFNs (3.69 ± 1.51; Figure 4A, and 14.0 ± 10.5; Figure 5A). However, no significant differences were observed between environments or in their interaction with network type (Table 1). Similarly, ant richness and abundance did not differ between preserved and disturbed environments, nor between networks of plants with and without EFNs, or their interaction (Table 1).
Similar patterns were observed when the analyses considered only arboreal ant species (Table S6, Figure 4B and Figure 5B). Ant species composition did not show significant variation in relation to network type (ANOSIM: Stress = 0.10; R = −0.07, p = 0.78) or environment (ANOSIM: Stress = 0.10; R = −0.11, p = 0.92) when considering all ants. Likewise, arboreal ant species composition did not differ significantly according to network type (ANOSIM: Stress = 0.10; R = −0.07, p = 0.80) or environment (ANOSIM: Stress = 0.10; R = −0.10, p = 0.89).

3.3. (Q3) Effects of Network Type and Environment on Network-Level Topological Parameters

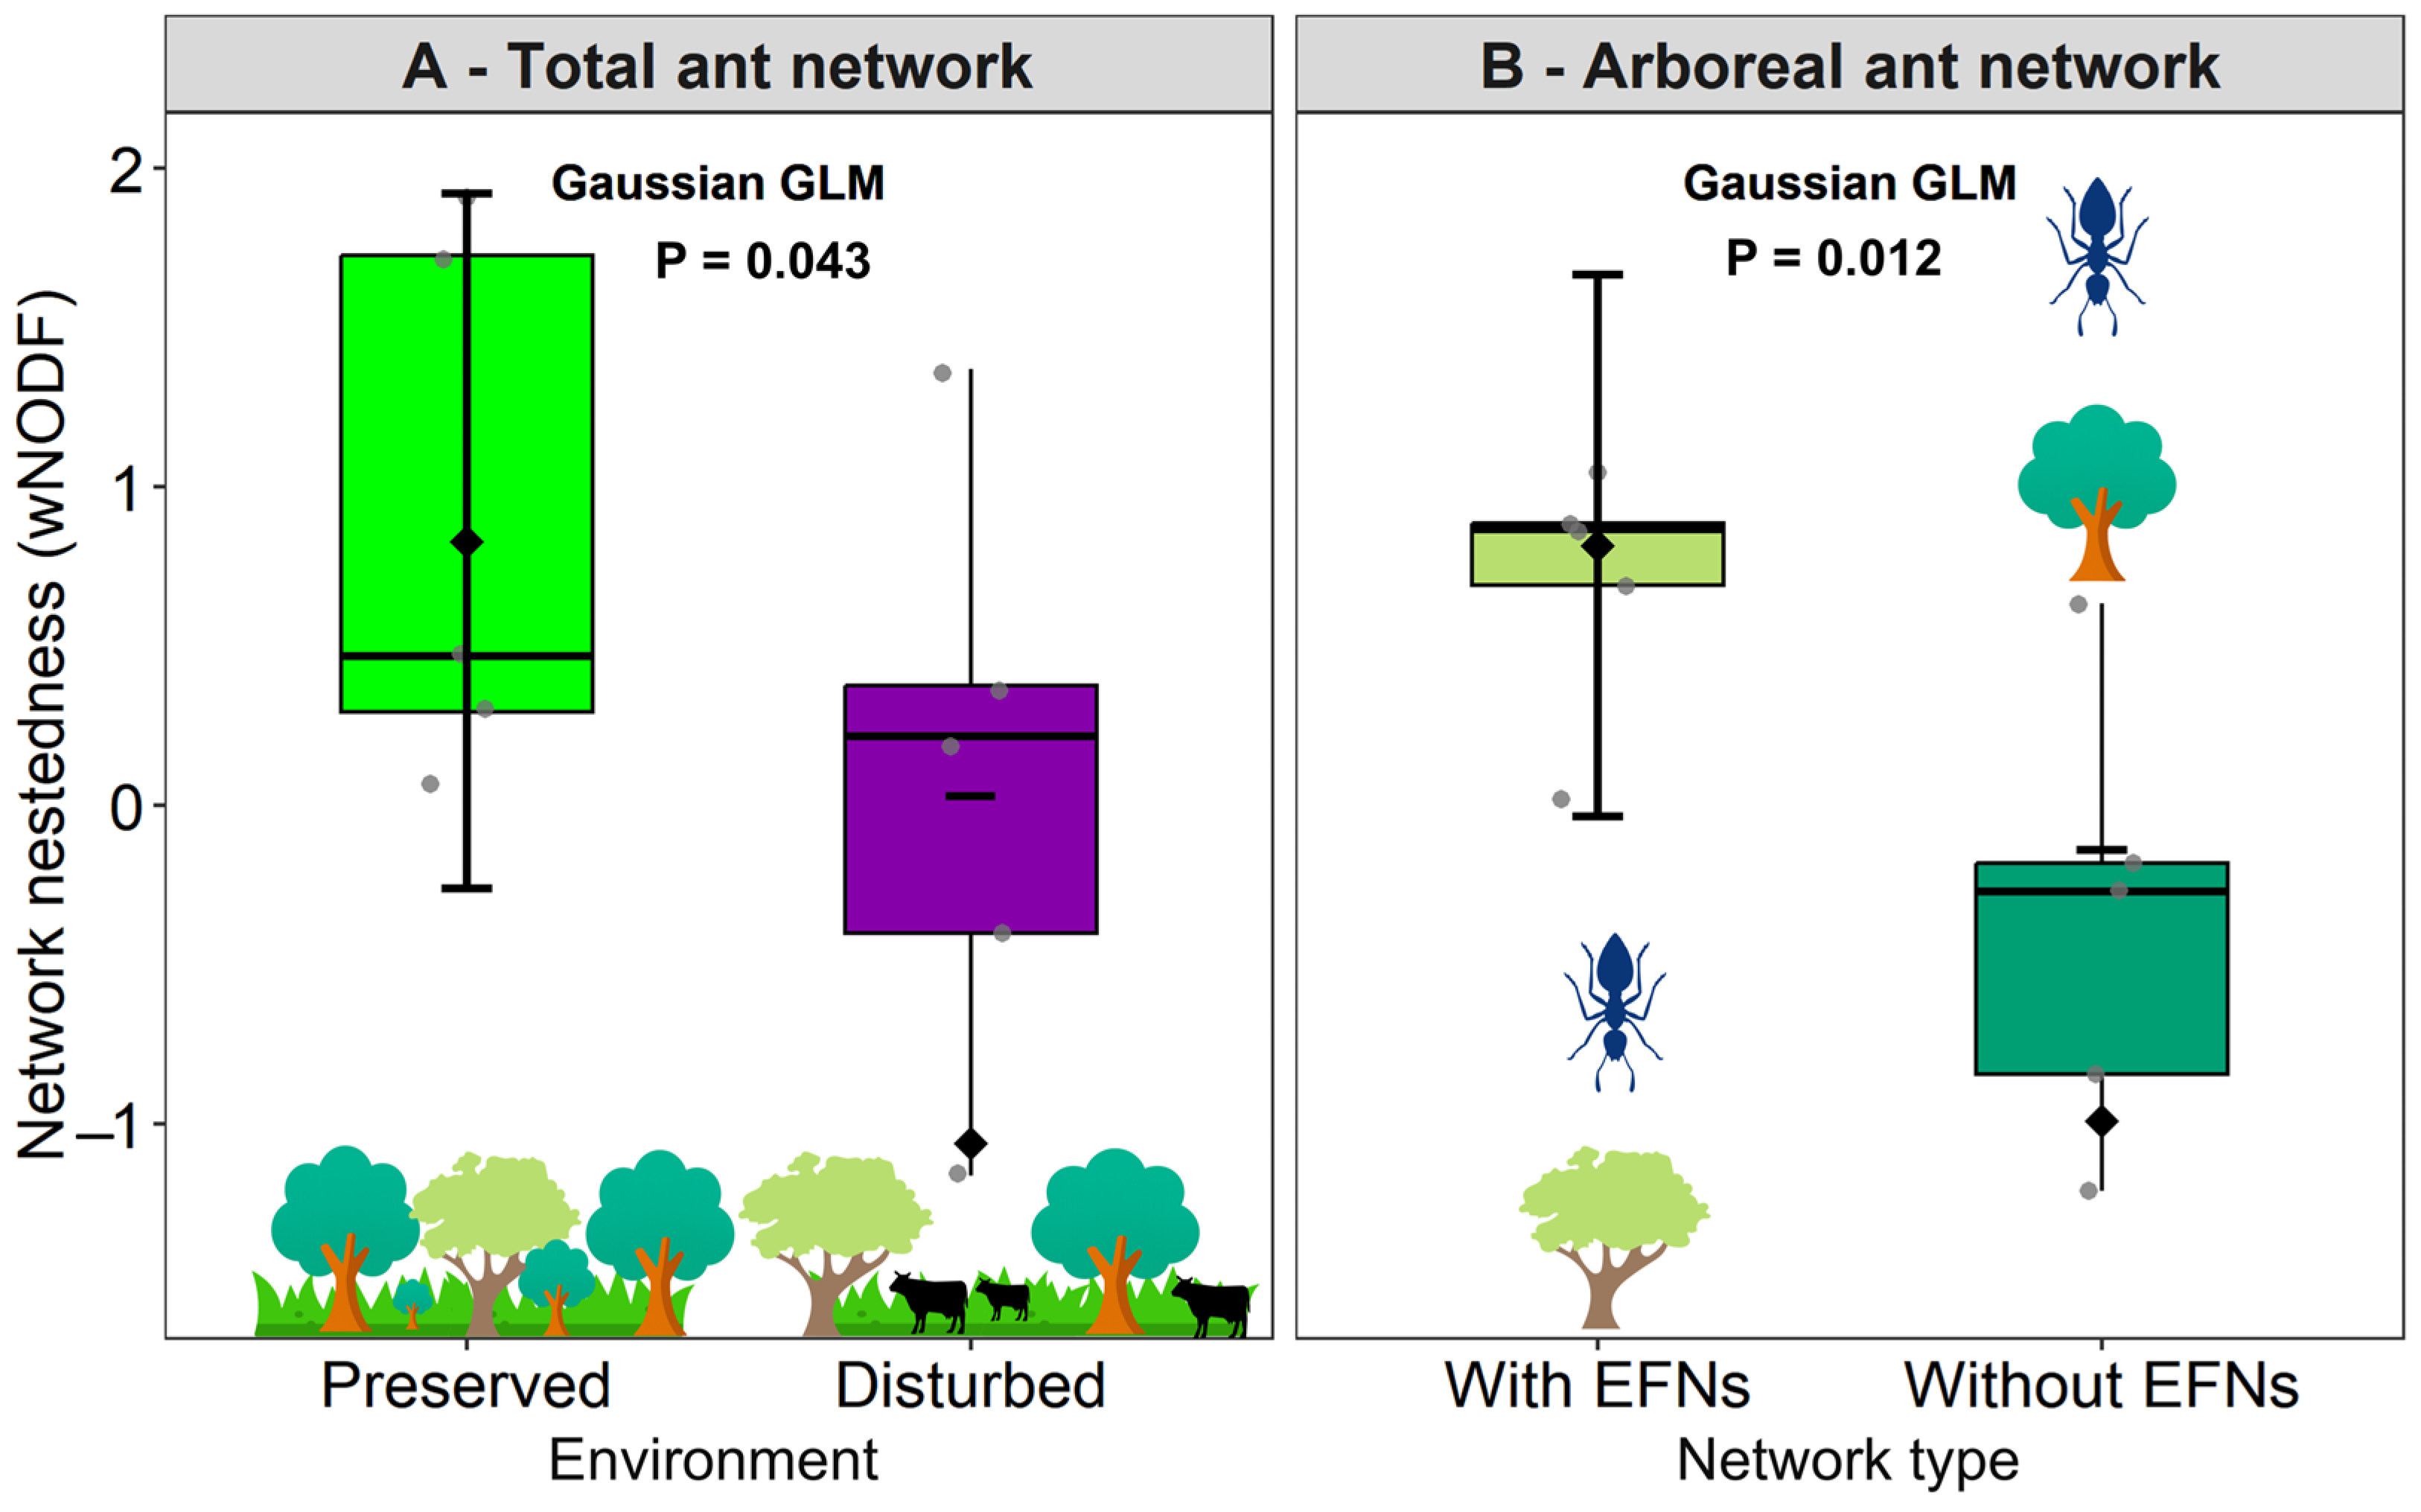
Considering network-level descriptors for all ants (arboreal and non-arboreal), nestedness was significantly higher in preserved areas (0.89 ± 0.86; Figure 6A; Table S7) than in disturbed areas (−0.21 ± 1.09; Figure 6A; Table S7). On the other hand, nestedness did not differ between networks of plants with and without EFNs, nor for their interaction (Table 2). Other network topological parameters (connectance, specialization, and modularity) also did not differ among environments (preserved vs. disturbed), network types (plants with vs. without EFNs), or their interaction (Table 2). In contrast, when analyzing ant–plant networks composed exclusively of arboreal ant species, nestedness was significantly higher for networks of plants with EFNs (0.70 ± 0. 40; Figure 6B; Table S8) than for networks without EFNs (–0.58 ± 0.80; Figure 6B; Table S8). Nestedness did not differ between environments, nor in interaction with network type (Table S9). For the other network metrics, the same patterns were observed when considering only arboreal ant species (Tables S8 and S9).

3.4. (Q4) Plant Species-Level Topological Descriptors Across Network Types

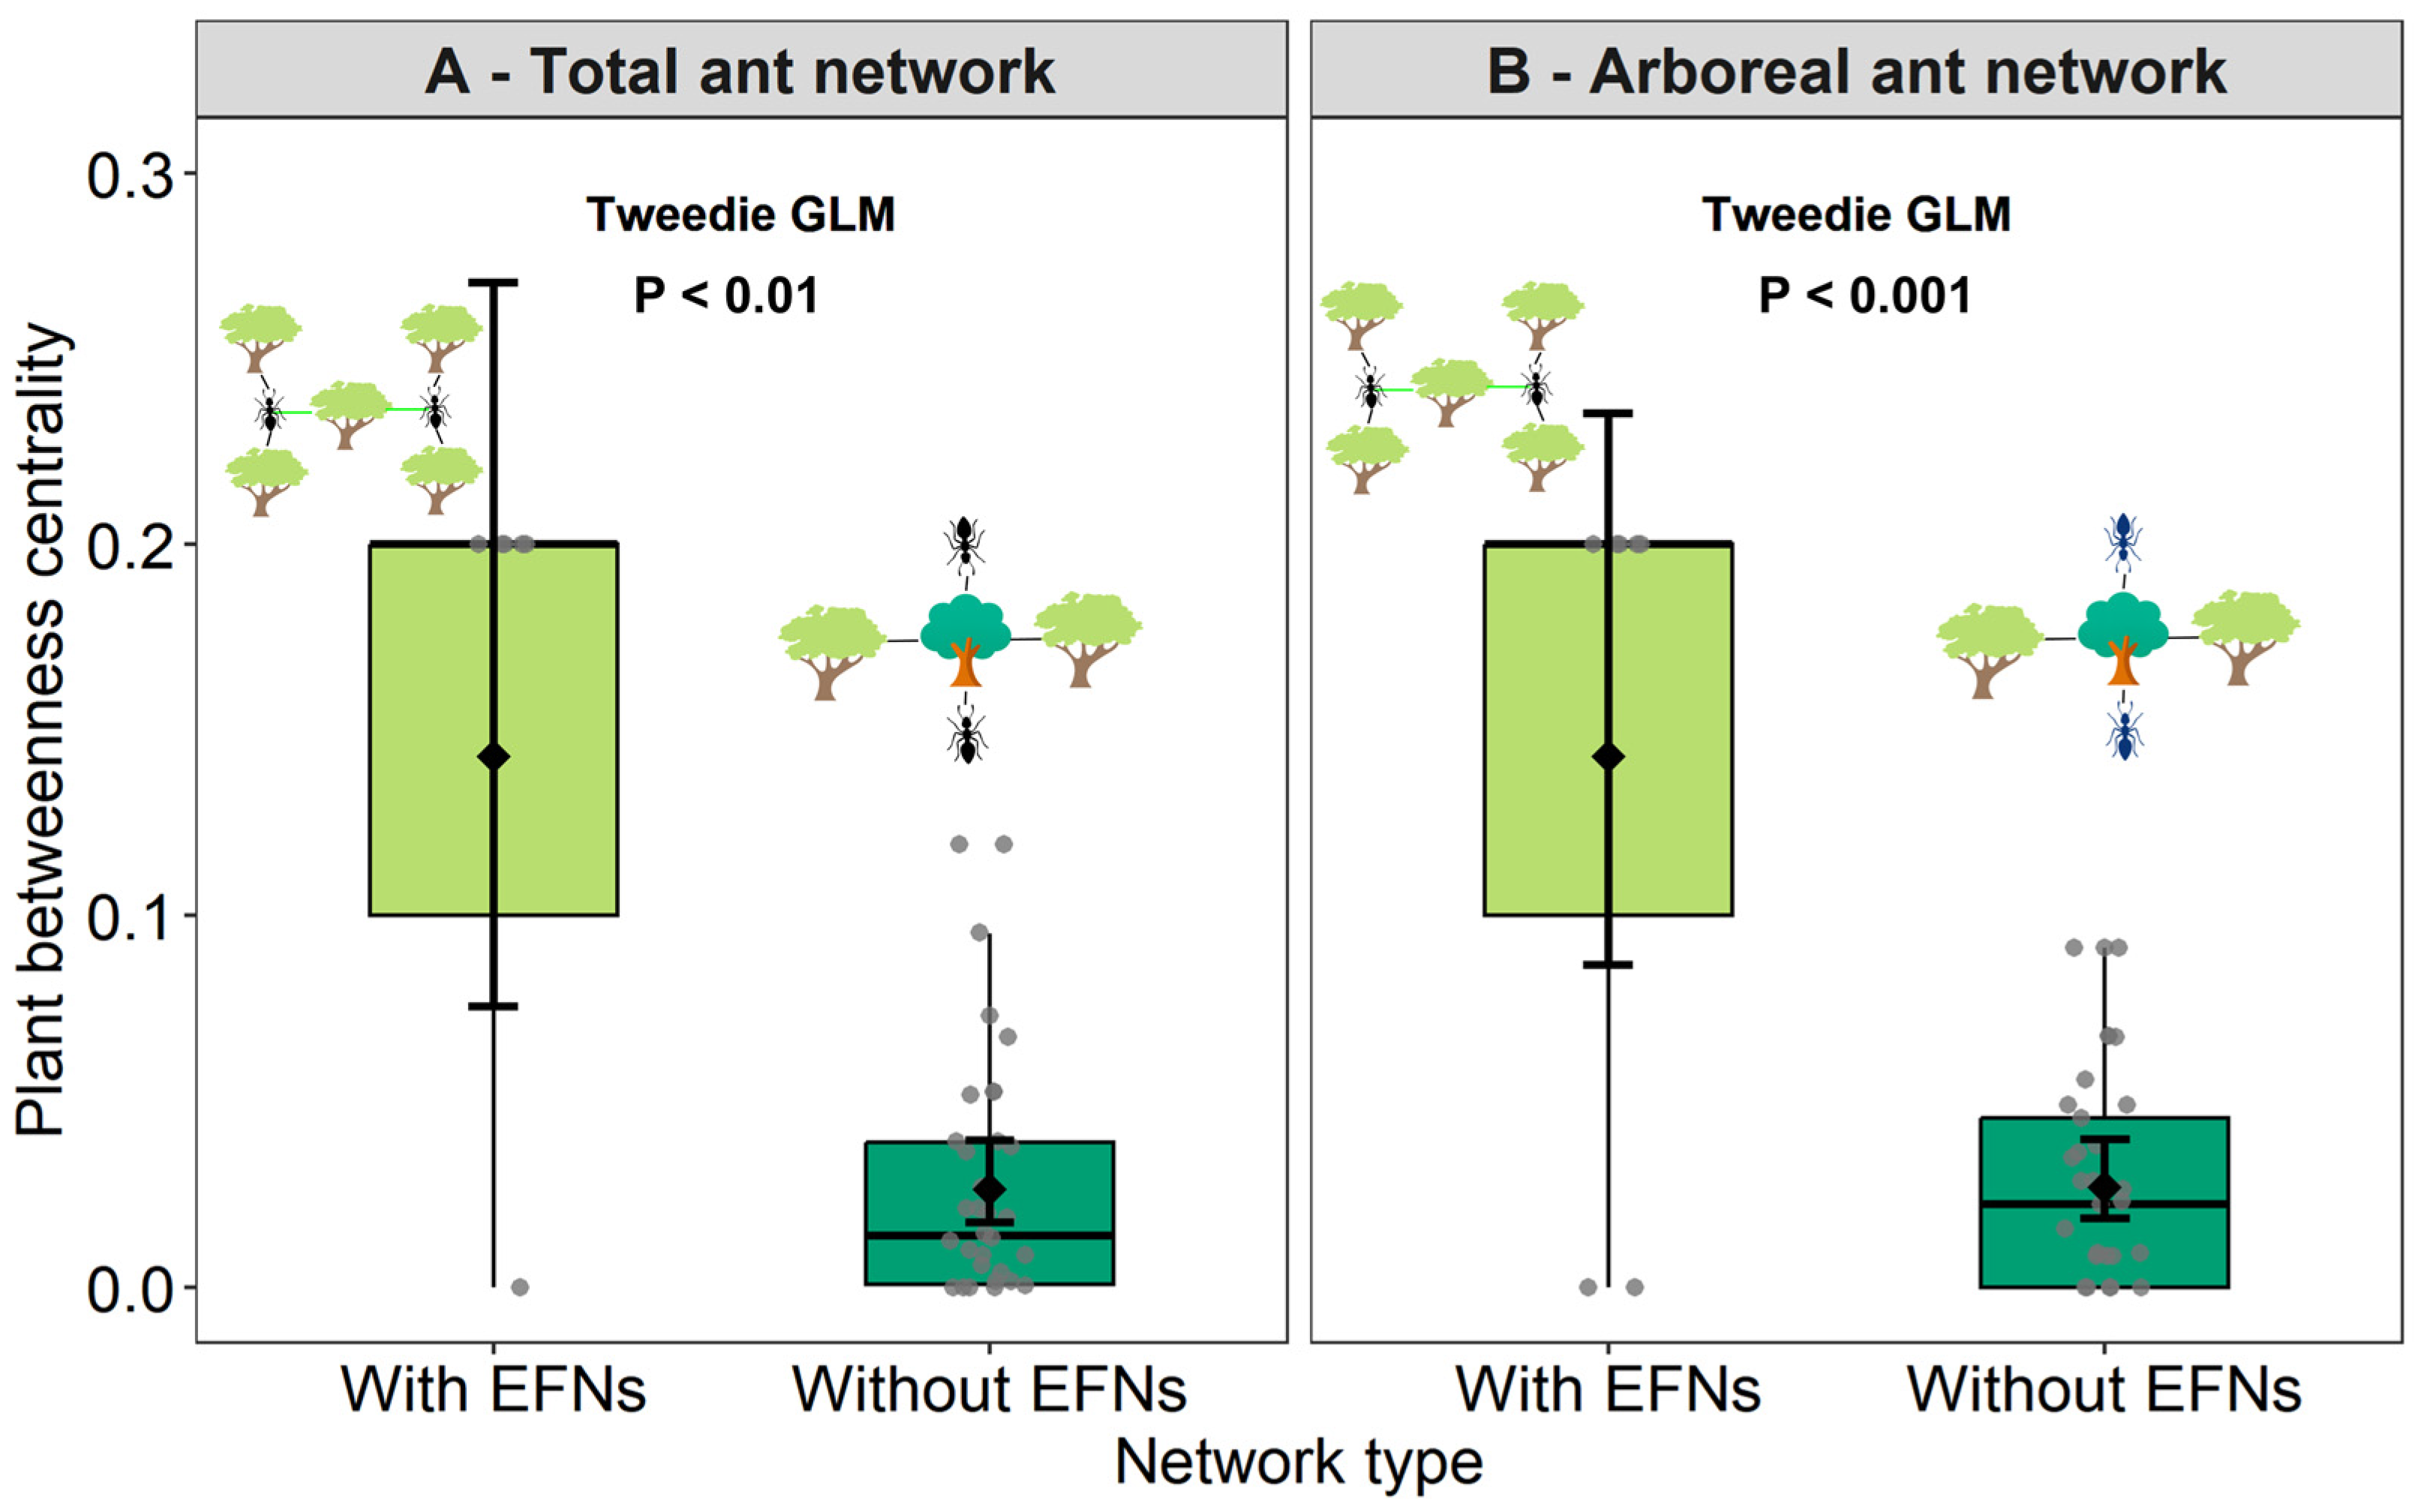
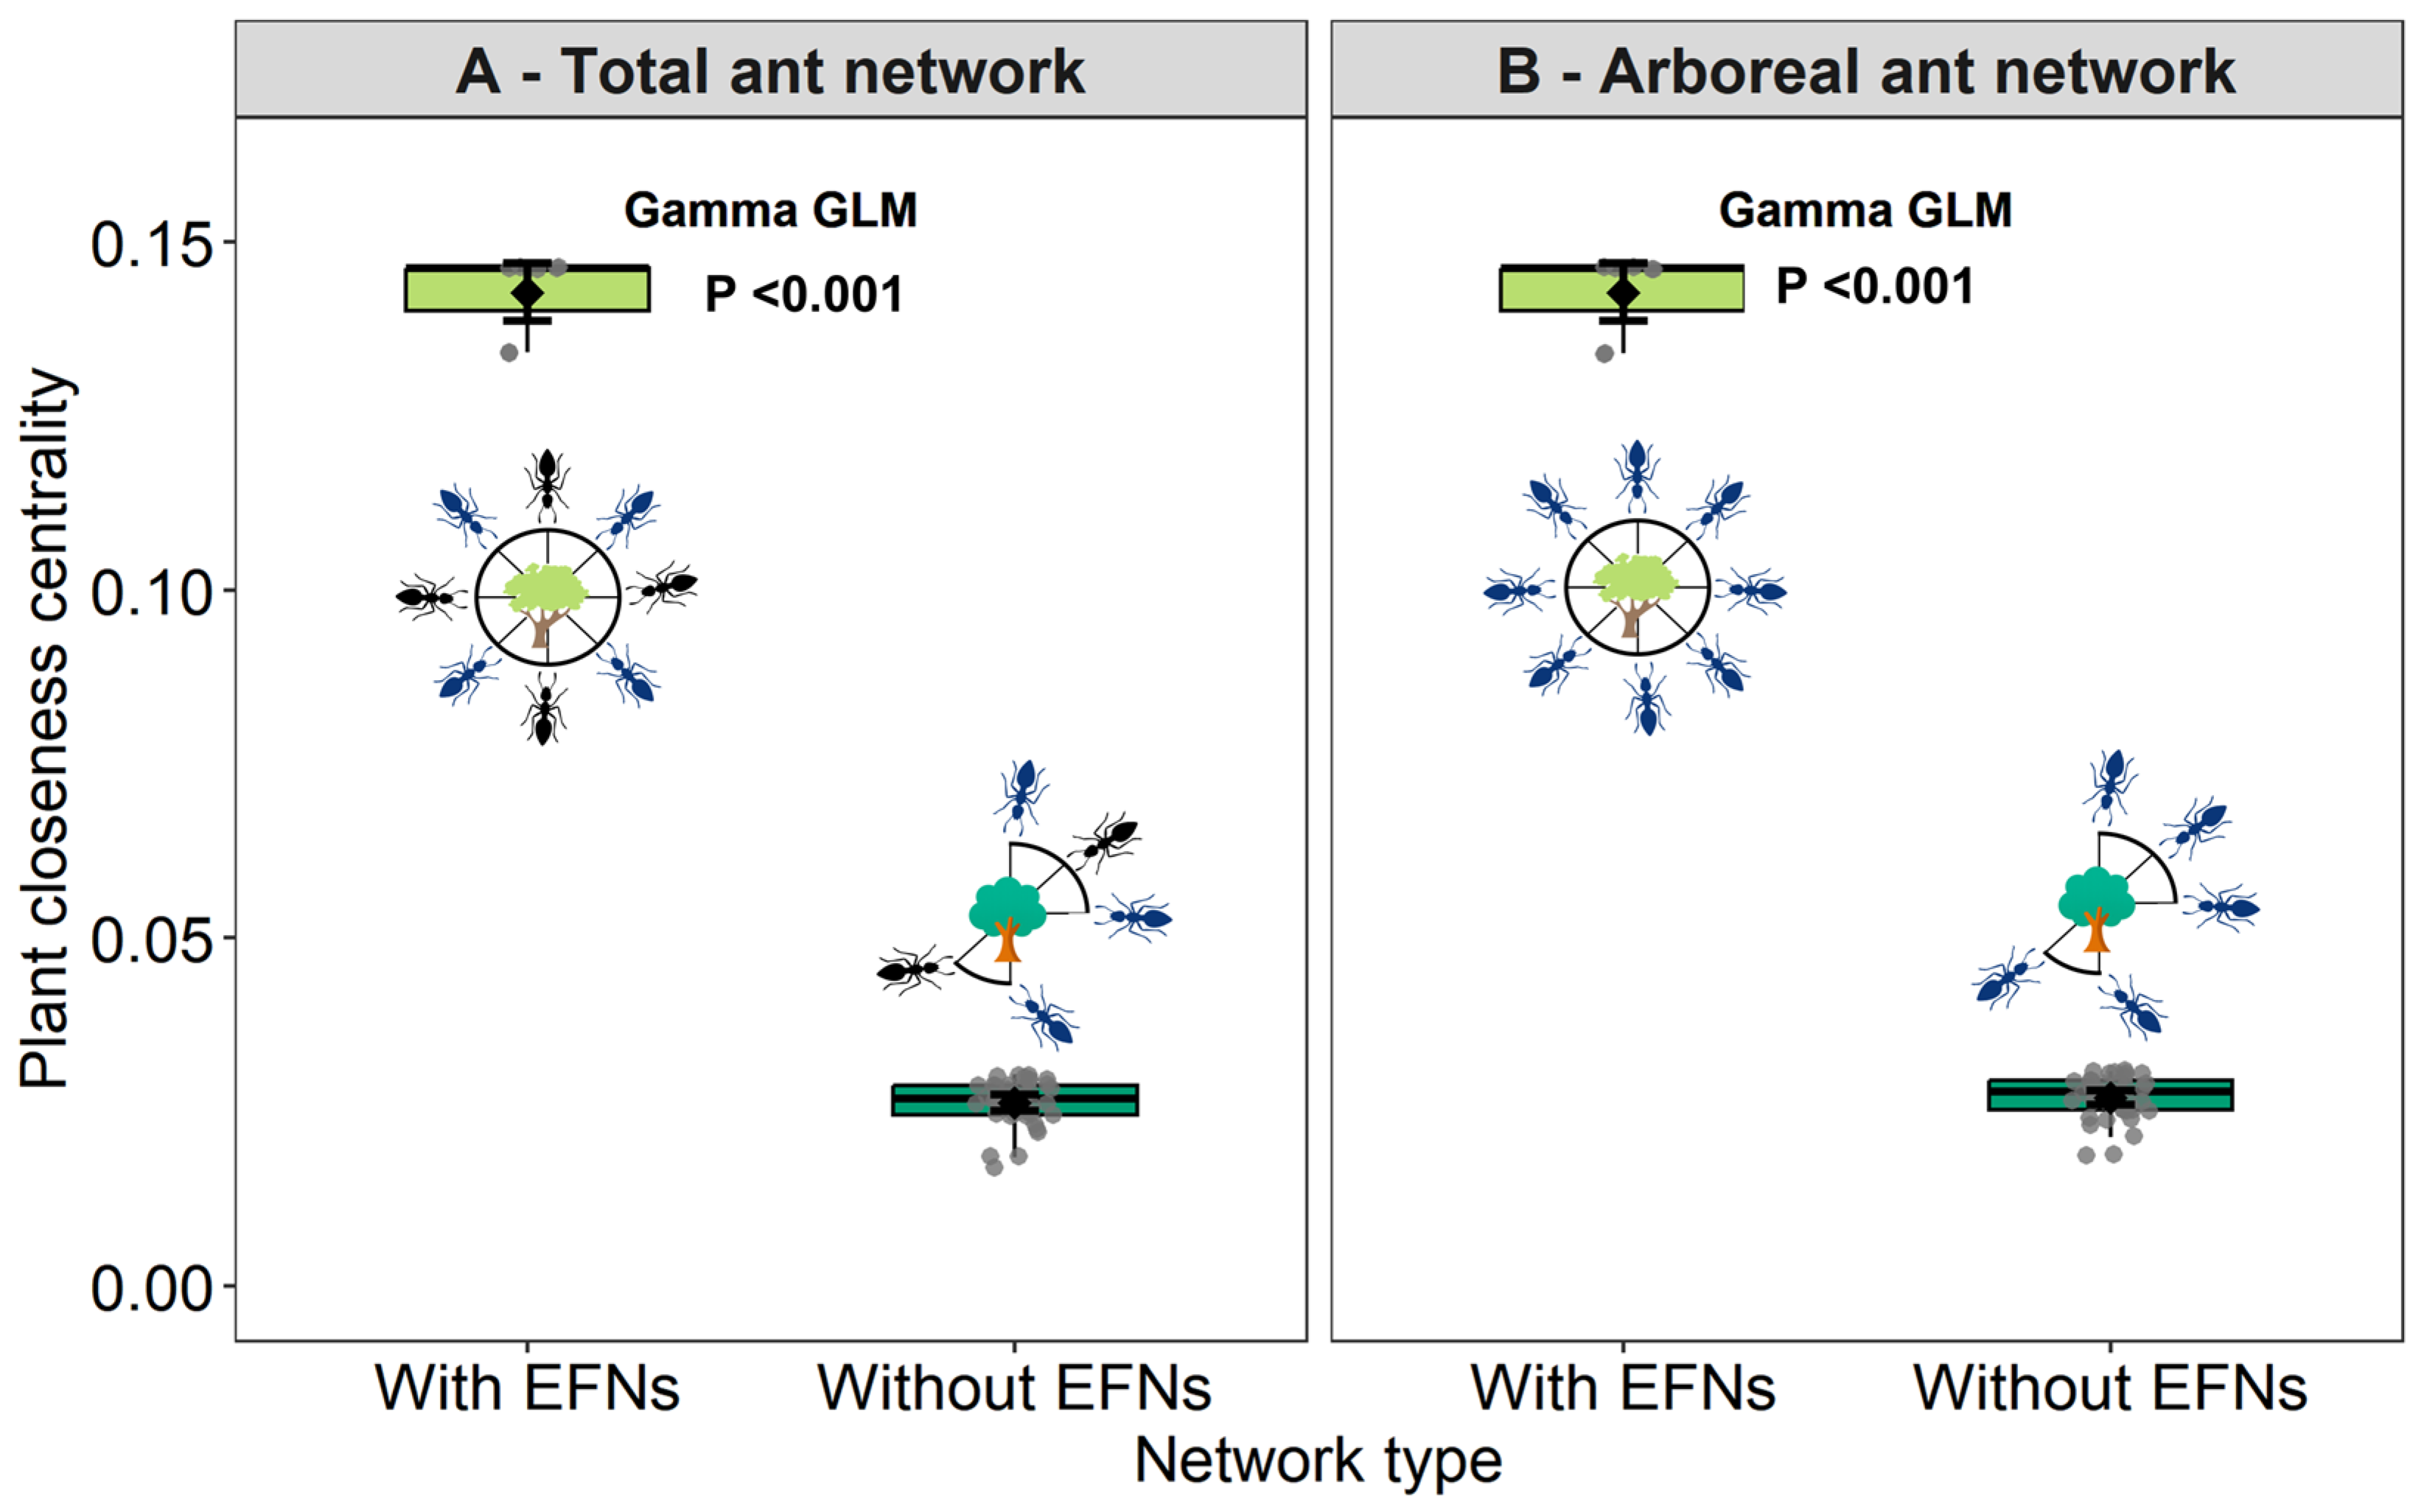
For plant species-level descriptors, considering all sampled ants, degree was higher in plant species with EFNs (12.4 ± 9.31; Figure 7A; Table S10) than in plant species without EFNs (5.24 ± 4.95; Figure 7A; Table S10). Betweenness centrality was also higher in plant species with EFNs (0.14 ± 0.10; Figure 8A; Table S10) compared with plant species without EFNs (0.03 ± 0.03; Figure 8A; Table S10). Likewise, closeness centrality was higher in plant species with EFNs (0.24 ± 0.05; Figure 9A; Table S10) than in plant species without EFNs (0.11 ± 0.08; Figure 9A; Table S10). In addition, the degree, betweenness centrality and closeness centrality were also significantly higher in plant species with EFNs than in plant species without EFNs (Table 3). In contrast, the specialization (d’) did not differ between plant species with or without EFNs (Table 3). The same pattern was observed when analyzing only the arboreal ant species dataset, with plant species bearing EFNs showing greater centrality and degree values in the interaction networks with EFNs (Tables S11 and S12, Figure 7B, Figure 8B and Figure 9B).

4. Discussion

In this study, we evaluated how species richness and abundance, as well as the topology of ant–plant networks, vary between networks of plants with and without EFNs in preserved and disturbed Neotropical savannas. Our results show that networks exhibited higher richness and abundance of plants without EFNs, whereas ant species richness, abundance, and composition did not differ between networks of plants with and without EFNs, nor between preserved and degraded environments. Regarding network topology, nestedness was higher in preserved areas and in networks of plants with EFNs, supporting our expectations. In contrast, network connectance, specialization, and modularity did not vary with environment or network type. At the species level, plant species with EFNs played a central role in the interactions, showing higher degree, betweenness centrality, and closeness within the ant–plant networks. Interestingly, patterns of diversity and network structure were similar when analyzing all ant species and only arboreal ant species, with the exception of network nestedness, which was higher in preserved areas (for total ants) and in networks with EFNs (for arboreal ants). These findings indicate that both natural and anthropogenic factors play important roles in shaping ant–plant interactions in Neotropical savannas.

4.1. Drivers of Plant Richness and Abundance in Networks with and Without EFNs

We found higher plant richness and abundance in networks without EFNs compared to those with these structures. This result can be explained by the diversity of plants without EFNs, as the plots were established without pre-categorizing plant types, allowing a natural assessment of local diversity across the different plant communities (with and without EFNs). Plants bearing EFNs occur in a wide variety of habitats, climatic conditions, and latitudes worldwide, ranging from tropical forests to desert regions [40]. Studies have demonstrated high diversity of woody plant species with EFNs [77,78]. In the Cerrado, the presence of these secretory glands is common across several plant families, with Fabaceae, Bignoniaceae, and Euphorbiaceae being the most species-rich [39].
Moreover, environmental and ecological factors can influence the distribution of plants with EFNs. Among environmental factors, altitude [79] and latitudinal gradients [80] are notable. Ecological factors are shaped by interactions between plants with EFNs and ants, which, during foraging, provide protection against herbivorous insects, conferring advantages to the plants [81]. In addition, nectar production in plants with EFNs is modulated by climatic seasonality [11,82], representing an important ecological factor. Peak nectar production typically occurs at the beginning of the rainy season, coinciding with the emergence of young leaves, when ant activity is highest and protection against herbivores is crucial [82]. However, the higher richness and abundance observed in plant communities within networks without EFNs suggest that other factors may also influence local diversity. For instance, the absence of EFNs in certain environments may be compensated by other direct and indirect defensive strategies [83], as the production of EFNs imposes energetic costs on plants that may be disadvantageous under specific ecological conditions [84]. Furthermore, one study showed that trees with EFNs generally exhibit higher growth and mortality rates than those without EFNs, probably due to the concentration of these traits in particular taxonomic groups, such as Fabaceae and Euphorbiaceae; however, when phylogenetic effects were considered, this relationship was no longer significant [85]. We did not find any relationship between plant richness and abundance across environments (preserved and disturbed), nor in the interaction between network type (with and without EFNs) and environment. In this context, the human impacts on the natural ecosystems may be mitigated by the ecological resilience of certain plant species and their capacity for adaptation [86]. Although urbanization is a driver of global biotic homogenization, it can simultaneously maintain or even increase local species richness in disturbed areas [87]. This occurs because the loss of sensitive native species is often offset by the establishment of generalist, adaptable, and exotic species that thrive in urbanized environment [87,88].

4.2. Ant Community Structure (Richness, Abundance, and Composition) Across Network Types and Environments

The absence of significant differences in ant species richness and abundance across network type, environment, and their interaction suggests that these communities are composed mainly of generalist and functionally redundant species. In this context, resilience is expected because multiple ant species share similar interaction roles, buffering the network against species loss. In our dataset, this is reflected by the presence of several ant species interacting with multiple plant partners, indicating overlap in functional roles within the community. Thus, the core of the network is composed of generalist species that establish numerous interactions both among themselves and with species that have fewer interactions (i.e., specialists) [89]. We did not explicitly test network stability; however, the observed interaction redundancy and high connectivity suggest potential robustness to species loss. Plants with and without EFNs may share the same ant species [19], although differences in species composition may also occur [63], since differences in composition occur mainly due to the tree’s physical characteristics (size/connectivity) and temporal dynamics driven by the intermittent availability of nectar, which attracts different ant groups in a transient manner without altering the long-term structure of the community [63]. Our results further indicate that ant richness and abundance was not affected by plant species richness, even though this variable can affect interactions in ecological networks [56]. Some ant genera, due to their generalist nature, exploit a wide range of resources and habitats, maintaining trophic structure across different land-use categories [90]. However, studies report that the intensification of land use (e.g., Eucalyptus plantations and pastures) in different types of Cerrado vegetation can negatively affect ant biodiversity [91].
For both datasets, ant species composition did not differ between network type or environment. Regarding network types, we found no variation in the ant community associated with plants with and without EFNs, corroborating patterns previously reported in the literature [63,92]. This high similarity can be explained by characteristics of Cerrado vegetation; for example, connectivity among tree canopies allows ants to move between plants [92]. As a result, high canopy connectivity promotes the coexistence of multiple arboreal ant species on the same plant [93]. In this context, studies conducted in Tropical Dry Forests have shown that connectivity among tree crowns does not necessarily affect ant species richness [94]. Moreover, we also did not detect variation in ant community composition between preserved and degraded environments. In our study, three genera, Crematogaster, Cephalotes and Camponotus, stood out in terms of abundance across both environments, all of which are predominantly omnivorous [59]. This feeding behavior allows them exploit a wide range of food resources, promoting adaptability and persistence across different habitats. However, greater dissimilarity among ant communities across urban, rural, and wild areas representing distinct levels of disturbance has already been reported [49]. Additionally, there is evidence that the composition of ant species associated with plants with EFNs responds to chronic anthropogenic disturbance [31].

4.3. Contrasting Responses of Nestedness to Environment and Network Type Across Ant Datasets

Regarding network-level metrics, nestedness responded differently across datasets. For the data including all ants, nestedness was higher in preserved areas, indicating that environmental preservation plays an important role in maintaining the complex and organized structure of ant–plant interaction networks [6]. Preserved areas likely harbor more complete communities, including both a core of generalist species and a peripheral set of specialists, which together create a robust nested pattern [89]. In contrast, non-preserved areas, subjected to anthropogenic disturbances such as habitat loss driven by land-use change [95,96], may experience the loss of specialist species, which disrupts the network structure and reduces its degree of nestedness.
For the dataset corresponding to arboreal ants, nestedness was higher in networks of plants with EFNs. In tropical regions, ants exhibit high diversity, which is consequently reflected in their interactions with plants [6]. Plants bearing EFNs form mutualistic interaction networks that typically display a nested pattern [16]. Similarly, Del-Claro et al. [6] describe both nested and modular pattern in ant–plant interaction networks. In Mexican tropical forests, despite variations in plant and ant species composition, these networks have remained consistently nested over a period of 20 years [97]. Similar patterns have also been reported in Neotropical savannas [98]. In this context, subgroups of ants maintain more frequent and consistent interactions with particular groups of plants [5]. Moreover, Dáttilo et al. [18] identified higher levels of nestedness in networks involving plants with EFNs in a humid tropical forest in the southern Brazilian Amazon. Therefore, highly connected species tend to establish interactions with a greater number of partners than would be expected if individuals were distributed randomly according to their relative abundance [7].
Moreover, the phenology of nectaries also shapes interactions, as an increase in the number of plants with active EFNs is associated with more nested and less specialized networks [99]. Similarly, soil characteristics, such as pH, can influence the nestedness of ant–plant networks [9]. In plants with EFNs, variation in soil pH can directly affect the composition of extrafloral nectar, thereby altering resource attractiveness and, consequently, ant visitation and the nested pattern of these mutualistic networks. On the other hand, in plants without EFNs, soil pH appears to have no detectable influence, as ants primarily use these plants as substrate for foraging and prey searching [9]. Likewise, temperature and precipitation influence temporal variation in nestedness within mutualistic networks between ants and plants bearing EFNs [100].
In contrast, for both datasets, network-level metrics such as specialization (H2′ index), connectance, and modularity did not differ among network types, environments, or their interaction. This result suggests the resilience of Cerrado ant–plant networks to anthropogenic degradation, corroborating previous studies [49]. Specifically, non-symbiotic networks, such as those formed with plants without EFNs, have been shown to be more robust to the extinction of plant and ant species [101]. However, studies on ant–plant co-occurrence networks in human-modified tropical forests have demonstrated that network specialization is related to the amount of vegetation cover in the landscape [57]. Moreover, it is important to consider that the structure of ant–plant interaction networks, which involve a wide variety of biotic interactions, is influenced by different processes operating across multiple spatial scales [102].
Overall, the networks studied were nested, highly connected, non-specialized, and weakly modular. Ants that feed on extrafloral nectar can interact with multiple plant species, thereby forming a dense network with many connected nodes and, consequently, exhibiting low specialization [27]. The structure of ant–plant interaction networks involving EFNs is mainly shaped by the competitive dominance hierarchy among ant species, which determines the nested pattern of the network [7]. Similarly, ant body size has been shown to be related to species degree within the network [103]. The non-modular pattern reflects a distribution of interactions in which distinct subgroups are not clearly formed, likely due to the relatively small size of studied networks. High connectivity and the generality behavior of ant species indicate that interactions are not clustered into discrete modules, but instead form a nested and low-specialization network. Therefore, this network pattern provides structural stability against environmental disturbances [104].

4.4. Higher Centrality of EFN-Bearing Plants in Ant–Plant Interaction Networks

Plant species-level descriptors showed similar patterns in both datasets. We found higher degree, betweenness centrality, and closeness centrality in networks involving plants with EFNs compared to those without EFNs, highlighting their importance in ant–plant interactions. Regarding degree, a study comparing the structure of ant–plant networks with EFNs over time showed that this metric varies among plant species [98], as temporality and phenology directly influence extrafloral nectar production [99]. The closeness centrality corresponds to the shortest number of interactions (direct and indirect) along the shortest paths in the network (one or more nodes) [105]. Node centrality relates to its proximity to other nodes in the network, allowing interactions with few or no intermediaries [106]. Increased network centrality may make EFN-bearing plants more attractive to mutualistic ants, as nectar is a reward for ants that protect the plants [107]. The higher closeness centrality observed in EFN plants supports previous studies showing that these plants are visited more frequently by ants and occupy more central positions in mutualistic networks [108]. This centrality reflects the ecological importance of these species in maintaining the flow of resources and interactions within the network, enhancing its stability and resilience [109]. Furthermore, studies on plant–pollinator mutualistic networks indicate that a plant’s central position in a network is associated with its fitness, with more central plants exhibiting higher fitness compared to those occupying more peripheral positions [110]. However, specialization (d’ index) did not differ among plant species with and without EFNs, since it is common for ants to forage regardless of resource availability, such as nectar [111].
It is important to acknowledge that ant presence detected by beating does not exclusively reflect mutualistic interactions. For plants without EFNs, associations are better interpreted as ecological co-occurrences involving foraging, predation of herbivores, and substrate use [9,22], rather than reward-based mutualisms. This distinction aligns with the broader definition of ant–plant interaction networks adopted in the literature [5,7], and does not undermine the topological comparisons presented here, since all networks were constructed and standardized under the same sampling protocol and analytical framework.

5. Conclusions

In conclusion, our findings indicate that ant–plant interaction networks in Neotropical savannas differ in structure depending on the presence of EFNs. Although networks composed of plants without EFNs exhibited higher local richness and abundance, EFN-bearing plants showed higher degree, occupied more central positions and formed more nested networks, underscoring their disproportionate influence on network cohesion and interaction flow. Nestedness responded differently across datasets: it increased in preserved areas when all ants were considered and was higher in networks with EFNs when only arboreal ants were analyzed. These patterns highlight the ecological relevance of EFNs as structuring elements that enhance robustness to species loss and environmental changes, given that nested topology tend to reduce the risk of cascading collapses. Despite the lack of environmental effects on plant and ant richness, the topology of networks formed by plants with EFNs demonstrated greater connectivity, nestedness, and stability, suggesting that predictable rewards such as extrafloral nectar promote cohesive and resilient mutualistic structures. Moreover, it is important to investigate how seasonality, as well as the functional and phylogenetic traits of plants, influence the configurations of interactions among different types of ant–plant networks, considering the presence or absence of predictable and available resources such as extrafloral nectar. Overall, the low specialization and high generalization in these networks indicate adaptive flexibility in the interactions between ants and plants with EFNs, enabling these interactions to persist even under environmental change.

Supplementary Materials

The following supporting information can be downloaded at: https://www.mdpi.com/article/10.3390/d18060314/s1, Figure S1. Sample-size-based rarefaction and extrapolation curves (type = 1) of ant–plant interaction richness (q = 0) for the six study areas, with Areas A1 to A3 (green bars) corresponding to preserved environments and Areas A4 to A6 (purple bars) corresponding to disturbed environments. Curves were constructed separately for the frequency of interactions involving plant species with extrafloral nectaries (EFNs), plant species without EFNs, and for the total set of interactions recorded in each area. The x-axis represents the observed Number of interactions in each area, whereas the y-axis represents interaction richness. Solid lines represent rarefaction, dashed lines represent extrapolation, shaded areas indicate 95% confidence intervals based on 1000 bootstrap resamplings, and vertical dashed lines indicate the observed sampling effort; Figure S2. Residual diagnostics generated with the DHARMa package for the negative binomial generalized linear models used to address research question (Q1), evaluating the effects of network type (with and without extrafloral nectaries—EFNs), environment (preserved and degraded), and their interaction on plant richness (A) and plant abundance (B) in ant–plant networks. The analyses correspond to the ant–plant networks constructed using the total set of sampled ants (arboreal and non-arboreal); Figure S3. Residual diagnostics generated with the DHARMa package for the negative binomial generalized linear models used to address research question (Q2), evaluating the effects of network type (with and without extrafloral nectaries—EFNs), environment (preserved and degraded), and their interaction on ant richness (A) and ant abundance (B) in ant–plant networks. The analyses correspond to the ant–plant networks constructed using the total set of sampled ants (arboreal and non-arboreal); Figure S4. Residual diagnostics generated with the DHARMa package for the Gaussian generalized linear models used to address research question (Q3), evaluating the effects of network type (with and without extrafloral nectaries—EFNs), environment (preserved and degraded), and their interaction on network metrics, including specialization (A), connectance (B), modularity (C), and nestedness (D) in ant–plant networks. The analyses correspond to the ant–plant networks constructed using the total set of sampled ants (arboreal and non-arboreal); Figure S5. Residual diagnostics generated with the DHARMa package for the generalized linear models used to address research question (Q4), evaluating the effects of network type (with and without extrafloral nectaries—EFNs) on plant species-level. Plant species-level metrics included degree (A), fitted using a negative binomial model; specialization index d (B), fitted using a Gaussian model; betweenness centrality (C), fitted using a Tweedie model; and closeness centrality (D), fitted using a Gamma model. The analyses correspond to the ant–plant networks constructed using the total set of sampled ants (arboreal and non-arboreal); Figure S6. Residual diagnostics generated with the DHARMa package for the negative binomial generalized linear models used to address research question (Q1), evaluating the effects of network type (with and without extrafloral nectaries—EFNs), environment (preserved and degraded), and their interaction on plant richness (A) and plant abundance (B) in ant–plant networks. The analyses correspond to the ant–plant networks constructed with the set of sampled arboreal ants; Figure S7. Residual diagnostics generated with the DHARMa package for the negative binomial generalized linear models used to address research question (Q2), evaluating the effects of network type (with and without extrafloral nectaries—EFNs), environment (preserved and degraded), and their interaction on ant richness (A) and ant abundance (B) in ant–plant networks. The analyses correspond to the ant–plant networks constructed with the set of sampled arboreal ants; Figure S8. Residual diagnostics generated with the DHARMa package for the Gaussian generalized linear models used to address research question (Q3), evaluating the effects of network type (with and without extrafloral nectaries—EFNs), environment (preserved and degraded), and their interaction on network metrics, including specialization (A), connectance (B), modularity (C), and nestedness (D) in ant–plant networks. The analyses correspond to the ant–plant networks constructed with the set of sampled arboreal ants; Figure S9. Residual diagnostics generated with the DHARMa package for the generalized linear models used to address research question (Q4), evaluating the effects of network type (with and without extrafloral nectaries—EFNs) on plant species-level. Plant species-level metrics included degree (A), fitted using a negative binomial model; specialization index d (B), fitted using a Gaussian model; betweenness centrality (C), fitted using a Tweedie model; and closeness centrality (D), fitted using a Gamma model. The analyses correspond to the ant–plant networks constructed with the set of sampled arboreal ants; Figure S10. Quantitative ant–plant interaction networks in different plant communities in Neotropical savannas, covering preserved areas (A1, A2, and A3) and disturbed areas (A4, A5, and A6). Light green bars represent plant species with extrafloral nectaries (EFNs), dark green bars correspond to species without EFNs, dark blue bars represent arboreal ant species in the network, and gray lines have thickness proportional to the frequency of recorded interactions; Table S1. Taxonomic references used for ant identification (species or genus level) and literature sources used to classify species as arboreal or non-arboreal; Table S2. List of plant species richness and abundance with and without extrafloral nectaries (EFNs) in preserved and disturbed areas of Neotropical savannas located in the Serra Nova district, municipality of Rio Pardo de Minas, Minas Gerais, Brazil, corresponding to the ant–plant networks constructed using the total set of sampled ants (arboreal and non-arboreal); Table S3. List of total ant species richness and abundance (arboreal and non-arboreal) sampled on 272 plants distributed across preserved and disturbed areas of Neotropical savannas located in the Serra Nova district, municipality of Rio Pardo de Minas, Minas Gerais, Brazil; Table S4. List of plant species richness and abundance, with and without extrafloral nectaries (EFNs), in preserved and disturbed areas of Neotropical savannas located in the Serra Nova district, municipality of Rio Pardo de Minas, Minas Gerais, Brazil, referring to the ant–plant networks constructed with the set of sampled arboreal ants; Table S5. List of richness and abundance of arboreal ant species sampled on 251 plants distributed across preserved and disturbed areas of Neotropical savannas located in the Serra Nova district, municipality of Rio Pardo de Minas, Minas Gerais, Brazil; Table S6. Generalized linear models (GLMs) showing the effect of network type (with and without extrafloral nectaries—EFNs), plant richness, environment (preserved and disturbed), and the interaction between network type and environment on the richness and abundance of plants and ants, considering the set of arboreal ant species recorded in the ant–plant networks. Bolded values indicate significant results; Table S7. Results of the topological descriptors at the network level (specialization—H2′, connectance, modularity, and weighted nestedness—wNODF) of the ant–plant interaction networks, considering network type (with and without extrafloral nectaries—EFNs) and environment (preserved and disturbed). All values were standardized using z-scores to control for differences in network size. The data correspond to the total networks, considering all sampled ant species (arboreal and non-arboreal); Table S8. Results of the topological descriptors at the network level (specialization—H2′, connectance, modularity, and weighted nestedness—wNODF) of the ant–plant interaction networks, considering network type (with and without extrafloral nectaries—EFNs) and environment (preserved and disturbed). All values were standardized using z-scores to control for differences in network size. The data correspond to the networks constructed with arboreal ant species; Table S9. Results of the generalized linear models (GLMs) evaluating the effect of network type (with and without extrafloral nectaries—EFNs), environment (preserved and disturbed), and the interaction between these factors on the network-level topological descriptors (specialization—H2′, connectance, modularity, and nestedness—wNODF) in the ant–plant interaction networks. The analyses consider only the arboreal ant species recorded in the ant–plant networks. Bolded values indicate significant results; Table S10. Results of the plant-level topological descriptors (degree, specialization—d’, betweenness centrality, and closeness centrality) in the ant–plant interaction networks, considering network type (with and without extrafloral nectaries—EFNs). The data refer to the ant–plant networks constructed using the total set of sampled ants (arboreal and non-arboreal); Table S11. Results of the plant-level topological descriptors (degree, specialization—d’, betweenness centrality, and closeness centrality) in the ant–plant interaction networks, considering network type (with and without extrafloral nectaries—EFNs). The data refer to the ant–plant networks constructed using the set of sampled arboreal ants; Table S12. Results of generalized linear models (GLMs) evaluating if plant species with and without extrafloral nectaries (EFNs) differ in the topological descriptors at the species level (degree, specialization d’, betweenness centrality, and closeness centrality), considering the set of arboreal ant species recorded in the ant–plant networks. Bolded values indicate significant results. References [112,113,114,115,116,117,118,119,120,121,122,123,124,125,126,127,128,129,130,131,132,133] are cited in the Supplementary Materials.

Author Contributions

Conceptualization, A.S.d.O., T.M. and W.S.d.A.; methodology, A.S.d.O., T.M., L.T.S. and W.S.d.A.; software, A.S.d.O. and W.S.d.A.; validation, A.S.d.O., T.M., L.T.S. and W.S.d.A.; formal analysis, A.S.d.O. and W.S.d.A.; investigation, A.S.d.O., L.T.S. and T.M.; resources, A.S.d.O., T.M., L.T.S. and W.S.d.A.; data curation, A.S.d.O. and W.S.d.A.; writing—original draft preparation, A.S.d.O.; writing—review and editing, T.M., L.T.S. and W.S.d.A.; visualization, A.S.d.O. and W.S.d.A.; supervision, A.S.d.O., T.M. and W.S.d.A.; project administration, W.S.d.A.; funding acquisition, W.S.d.A. All authors have read and agreed to the published version of the manuscript.

Funding

This research was funded by Fundação de Amparo à Pesquisa do Estado de Minas Gerais (FAPEMIG), grant number APQ-03236-22 (REDES ANTRÓPICAS) and Conselho Nacional de Desenvolvimento Científico e Tecnológico (CNPq), grant number 308928/2022-9 (Productivity Grant).

Institutional Review Board Statement

Not applicable.

Data Availability Statement

The original contributions presented in this study are included in the article/Supplementary Material. Further inquiries can be directed to the corresponding authors.

Acknowledgments

To the colleagues of the Laboratory of Applied Ecology and Cytogenetics (LEAC) at the Federal Institute of Northern Minas Gerais (IFNMG)—Salinas Campus, and of the Laboratory of Ecological Interactions and Biodiversity (LIEB) at the State University of Montes Claros (UNIMONTES), for assistance with the collection, sorting, and identification of plant and insect specimens; to the specialist Rodrigo Feitosa for confirming ant species identifications; to Maurício Lopes de Faria, Wesley Dattilo and Flávio de Carvalho Camarota for the valuable contributions and comments provided during the qualification and defense committees, which contributed to the improvement of this work; to the team of the State Forestry Institute (IEF) for collection permits and field support; and to the Fundação de Amparo à Pesquisa do Estado de Minas Gerais (FAPEMIG) and the Conselho Nacional de Desenvolvimento Científico e Tecnológico (CNPq) for financial support.

Conflicts of Interest

The authors declare no conflicts of interest.

References

  1. Bronstein, J.L.; Alarcón, R.; Geber, M. The evolution of plant–insect mutualisms. New Phytol. 2006, 172, 412–428. [Google Scholar] [CrossRef]
  2. Jones, L.C.; Rafter, M.A.; Walter, G.H. Host interaction mechanisms in herbivorous insects—Life cycles, host specialization and speciation. Biol. J. Linn. Soc. 2022, 137, 1–14. [Google Scholar] [CrossRef]
  3. Thébault, E.; Fontaine, C. Stability of ecological communities and the architecture of mutualistic and trophic networks. Science 2010, 329, 853–856. [Google Scholar] [CrossRef]
  4. Domínguez-García, V.; Kéfi, S. The structure and robustness of ecological networks with two interaction types. PLoS Comput. Biol. 2024, 20, e1011770. [Google Scholar] [CrossRef] [PubMed]
  5. Juárez-Juárez, B.; Dáttilo, W.; Moreno, C.E. Synthesis and perspectives on the study of ant–plant interaction networks: A global overview. Ecol. Entomol. 2023, 48, 269–283. [Google Scholar] [CrossRef]
  6. Del-Claro, K.; Lange, D.; Torezan-Silingardi, H.M.; Anjos, D.V.; Calixto, E.S.; Dáttilo, W.; Rico-Gray, V. The complex ant–plant relationship within tropical ecological networks. In Ecological Networks in the Tropics: An Integrative Overview of Species Interactions from Some of the Most Species-Rich Habitats on Earth; Dáttilo, W., Rico-Gray, V., Eds.; Springer: Cham, Switzerland, 2018; pp. 59–71. [Google Scholar] [CrossRef]
  7. Dáttilo, W.; Marquitti, F.M.; Guimarães, P.R., Jr.; Izzo, T.J. The structure of ant–plant ecological networks: Is abundance enough? Ecology 2014, 95, 475–485. [Google Scholar] [CrossRef]
  8. Lange, D.; Calixto, E.S.; Del-Claro, K. Variation in extrafloral nectary productivity influences ant foraging. PLoS ONE 2017, 12, e0169492. [Google Scholar] [CrossRef] [PubMed]
  9. Dáttilo, W.; Rico-Gray, V.; Rodrigues, D.J.; Izzo, T.J. Soil and vegetation features determine the nested pattern of ant–plant networks in a tropical rainforest. Ecol. Entomol. 2013, 38, 374–380. [Google Scholar] [CrossRef]
  10. Chamberlain, S.A.; Holland, J.N. Quantitative synthesis of context dependency in ant–plant protection mutualisms. Ecology 2009, 90, 2384–2392. [Google Scholar] [CrossRef]
  11. Oliveira Sá, E.C.; Camarota, F.; Morais, P.N.; de Freitas, É.V.D.; Neves, F.; Silva, T.G.M.; de Araújo, W.S. The role of habitat simplification and seasonality in shaping interactions between ants, plants and herbivores in a neotropical savanna. Ecol. Entomol. 2026, 51, 381–394. [Google Scholar] [CrossRef]
  12. Rosumek, F.B.; Silveira, F.A.; Neves, F.S.; Barbosa, N.P.U.; Diniz, L.; Oki, Y.; Cornelissen, T. Ants on plants: A meta-analysis of the role of ants as plant biotic defenses. Oecologia 2009, 160, 537–549. [Google Scholar] [CrossRef]
  13. Blüthgen, N.; Verhaagh, M.; Goitía, W.; Jaffé, K.; Morawetz, W.; Barthlott, W. How plants shape the ant community in the Amazonian rainforest canopy: The key role of extrafloral nectaries and homopteran honeydew. Oecologia 2000, 125, 229–240. [Google Scholar] [CrossRef]
  14. Blüthgen, N.; Gottsberger, G.; Fiedler, K. Sugar and amino acid composition of ant-attended nectar and honeydew sources from an Australian rainforest. Austral Ecol. 2004, 29, 418–429. [Google Scholar] [CrossRef]
  15. González-Teuber, M.; Heil, M. Nectar chemistry is tailored for both attraction of mutualists and protection from exploiters. Plant Signal. Behav. 2009, 4, 809–813. [Google Scholar] [CrossRef]
  16. Guimarães, P.R., Jr.; Rico-Gray, V.; Furtado dos Reis, S.; Thompson, J.N. Asymmetries in specialization in ant–plant mutualistic networks. Proc. R. Soc. B 2006, 273, 2041–2047. [Google Scholar] [CrossRef]
  17. Bixenmann, R.J.; Coley, P.D.; Kursar, T.A. Is extrafloral nectar production induced by herbivores or ants in a tropical facultative ant–plant mutualism? Oecologia 2011, 165, 417–425. [Google Scholar] [CrossRef]
  18. Dáttilo, W.; Díaz-Castelazo, C.; Rico-Gray, V. Ant dominance hierarchy determines the nested pattern in ant–plant networks. Biol. J. Linn. Soc. 2014, 113, 405–414. [Google Scholar] [CrossRef]
  19. Schoereder, J.H.; Sobrinho, T.G.; Madureira, M.S.; Ribas, C.R.; Oliveira, P.S. The arboreal ant community visiting extrafloral nectaries in the Neotropical cerrado savanna. Terr. Arthropod Rev. 2010, 3, 3–27. [Google Scholar] [CrossRef]
  20. Aranda-Rickert, A.; Diez, P.; Marazzi, B. Extrafloral nectar fuels ant life in deserts. AoB Plants 2014, 6, plu068. [Google Scholar] [CrossRef] [PubMed]
  21. Silva, C.H.F.; Arnan, X.; Andersen, A.N.; Leal, I.R. Extrafloral nectar as a driver of ant community spatial structure along disturbance and rainfall gradients in Brazilian dry forest. J. Trop. Ecol. 2019, 35, 280–287. [Google Scholar] [CrossRef]
  22. Dáttilo, W.; Dyer, L. Canopy openness enhances diversity of ant–plant interactions in the Brazilian Amazon rain forest. Biotropica 2014, 46, 712–719. [Google Scholar] [CrossRef]
  23. Priest, G.V.; Camarota, F.; Powell, S.; Vasconcelos, H.L.; Marquis, R.J. Ecosystem engineering in the arboreal realm: Heterogeneity of wood-boring beetle cavities and their use by cavity-nesting ants. Oecologia 2021, 196, 427–439. [Google Scholar] [CrossRef]
  24. Rodríguez-Castañeda, G.; Brehm, G.; Fiedler, K.; Dyer, L.A. Ant predation on herbivores through a multitrophic lens: How effects of ants on plant herbivore defense and natural enemies vary along temperature gradients. Curr. Opin. Insect Sci. 2016, 14, 73–80. [Google Scholar] [CrossRef]
  25. Sendoya, S.F.; Oliveira, P.S. Ant–caterpillar antagonism at the community level: Inter-habitat variation of tritrophic interactions in a neotropical savanna. J. Anim. Ecol. 2015, 84, 442–452. [Google Scholar] [CrossRef]
  26. Blüthgen, N.; Feldhaar, H. Food and shelter: How resources influence ant ecology. In Ant Ecology; Lach, L., Parr, C., Abbott, K., Eds.; Oxford University Press: New York, NY, USA, 2010; pp. 115–136. [Google Scholar]
  27. Costa, F.V.; Mello, M.A.R.; Bronstein, J.L.; Guerra, T.J.; Muylaert, R.L.; Leite, A.C.; Neves, F.S. Few ant species play a central role linking different plant resources in a network in rupestrian grasslands. PLoS ONE 2016, 11, e0167161. [Google Scholar] [CrossRef]
  28. Mayer, V.E.; Frederickson, M.E.; McKey, D.; Blatrix, R. Current issues in the evolutionary ecology of ant–plant symbioses. New Phytol. 2014, 202, 749–764. [Google Scholar] [CrossRef] [PubMed]
  29. Tylianakis, J.M.; Laliberté, E.; Nielsen, A.; Bascompte, J. Conservation of species interaction networks. Biol. Conserv. 2010, 143, 2270–2279. [Google Scholar] [CrossRef]
  30. Freitas, E.V.; Veloso, M.D.M.; Araújo, W.S. Urbanization alters the composition, but not the diversity and structure, of Neotropical savanna woody plant communities. Folia Geobot. 2020, 55, 95–108. [Google Scholar] [CrossRef]
  31. Leal, L.C.; Andersen, A.N.; Leal, I.R. Disturbance winners or losers? Plants bearing extrafloral nectaries in Brazilian Caatinga. Biotropica 2015, 47, 468–474. [Google Scholar] [CrossRef]
  32. Oliveira, F.M.; Ribeiro-Neto, J.D.; Andersen, A.N.; Leal, I.R. Chronic anthropogenic disturbance as a secondary driver of ant community structure: Interactions with soil type in Brazilian Caatinga. Environ. Conserv. 2017, 44, 115–123. [Google Scholar] [CrossRef]
  33. Wilker, I.; Queiroz, A.C.; Ribas, C.R.; Morini, M.S.C.; Lasmar, C.J.; Schmidt, F.A.; Diehl-Fleig, E. A systematic review of the land use change effects on ant diversity in Neotropics. Biol. Conserv. 2024, 299, 110778. [Google Scholar] [CrossRef]
  34. Câmara, T.; Leal, I.R.; Blüthgen, N.; Oliveira, F.M.; Queiroz, R.T.; Arnan, X. Effects of chronic anthropogenic disturbance and rainfall on the specialization of ant–plant mutualistic networks in the Caatinga, a Brazilian dry forest. J. Anim. Ecol. 2018, 87, 1022–1033. [Google Scholar] [CrossRef]
  35. Câmara, T.; Leal, I.R.; Blüthgen, N.; Oliveira, F.M.; Arnan, X. Anthropogenic disturbance and rainfall variation threaten the stability of plant–ant interactions in the Brazilian Caatinga. Ecography 2019, 42, 1960–1972. [Google Scholar] [CrossRef]
  36. Ribeiro-Neto, J.D.; Oliveira, F.M.P.; Arcoverde, G.B.; Tabarelli, M.; Leal, I.R.; Arnan, X. Aridity and chronic anthropogenic disturbances cause a taxonomic, functional, and phylogenetic homogenization of ant communities in a Caatinga dry forest. Biol. Conserv. 2023, 284, 110151. [Google Scholar] [CrossRef]
  37. Fahrig, L. Effects of habitat fragmentation on biodiversity. Annu. Rev. Ecol. Evol. Syst. 2003, 34, 487–515. [Google Scholar] [CrossRef]
  38. Myers, N.; Mittermeier, R.A.; Mittermeier, C.G.; Fonseca, G.A.B.; Kent, J. Biodiversity hotspots for conservation priorities. Nature 2000, 403, 853–858. [Google Scholar] [CrossRef]
  39. Barbosa, V.D.; Bächtold, A.; Del-Claro, K.; Silva, E.A. Extrafloral nectary plants in Brazilian biomes: Dominance of Cerrado and Fabaceae. Flora 2025, 323, 152668. [Google Scholar] [CrossRef]
  40. Marazzi, B.; Bronstein, J.L.; Koptur, S. The diversity, ecology and evolution of extrafloral nectaries: Current perspectives and future challenges. Ann. Bot. 2013, 111, 1243–1250. [Google Scholar] [CrossRef] [PubMed]
  41. Alvares, C.A.; Stape, J.L.; Sentelhas, P.C.; Gonçalves, J.L.M.; Sparovek, G. Köppen’s climate classification map for Brazil. Meteorol. Z. 2013, 22, 711–728. [Google Scholar] [CrossRef]
  42. Chaves, M.L.S.C.; Benitez, L.; Andrade, K.W.; Sartori, M.A. Canyon do Talhado, região de Porteirinha, norte de Minas Gerais—Notável feição geomorfológica de travessia completa da Serra do Espinhaço. In Sítios Geológicos e Paleontológicos do Brasil, 2nd ed.; Winge, M., Schobbenhaus, C., Berbert-Born, M., Queiroz, E.T., Campos, D.A., Souza, C.R.G., Fernandes, A.C.S., Eds.; CPRM: Brasília, Brazil, 2009; pp. 111–120. [Google Scholar]
  43. Instituto Estadual de Florestas (IEF). Plano de Manejo do Parque Estadual Serra Nova e Talhado; Instituto Estadual de Florestas: Belo Horizonte, Brazil, 2020. Available online: https://www.ief.mg.gov.br (accessed on 15 January 2025).
  44. Pressi, L.F.; Castro, P.D.T.A. Geodiversity and abiotic ecosystem services in parks from the far north of Minas Gerais: Educational and geotourism potential. Rev. Cerrados 2023, 21, 226–257. [Google Scholar] [CrossRef]
  45. Vázquez, D.P.; Melián, C.J.; Williams, N.M.; Blüthgen, N.; Krasnov, B.R.; Poulin, R. Species abundance and asymmetric interaction strength in ecological networks. Oikos 2007, 116, 1120–1127. [Google Scholar] [CrossRef]
  46. Araújo, W.S.; Cuevas-Reyes, P.; Guilherme, F.A.G. Local and regional determinants of galling-insect richness in Neotropical savanna. J. Trop. Ecol. 2014, 30, 269–272. [Google Scholar] [CrossRef]
  47. Oliveira, J.B.B.S.; Faria, M.L.; Borges, M.A.Z.; Fagundes, M.; Araújo, W.S. Comparing the plant–herbivore network topology of different insect guilds in Neotropical savannas. Ecol. Entomol. 2020, 45, 406–415. [Google Scholar] [CrossRef]
  48. Silveira, L.T.; Araújo, W.S. Plant-herbivore networks composed by adult and immature insects have distinct responses to habitat modification in Brazilian savannas. J. Insect Conserv. 2021, 25, 747–758. [Google Scholar] [CrossRef]
  49. Lima, S.R.O.; Oliveira Sá, E.C.; Morais, P.N.; Silva, T.G.M.; Dáttilo, W.; Araújo, W.S. Ant–plant networks exhibit distinct species diversity but similar organization in urban and wild areas of Neotropical savannas. Urban Ecosyst. 2024, 27, 1807–1817. [Google Scholar] [CrossRef]
  50. Chase, M.W.; Christenhusz, M.J.M.; Fay, M.F.; Byng, J.W.; Judd, W.S.; Soltis, D.E.; Stevens, P.F. An update of the Angiosperm Phylogeny Group classification for the orders and families of flowering plants: APG IV. Bot. J. Linn. Soc. 2016, 181, 1–20. [Google Scholar] [CrossRef]
  51. Silva-Júnior, M.C. 100 Árvores do Cerrado Sentido Restrito: Guia de Campo; Rede de Sementes do Cerrado: Brasília, Brazil, 2012. [Google Scholar]
  52. Souza, V.C.; Flores, T.B.; Colletta, G.D.; Coelho, R.L.G. Guia das Plantas do Cerrado; Taxon Brasil: São Paulo, Brazil, 2018. [Google Scholar]
  53. Oliveira, P.S.; Pie, M.R. Interaction between ants and plants bearing extrafloral nectaries in cerrado vegetation. An. Soc. Entomol. Bras. 1998, 27, 161–176. [Google Scholar] [CrossRef]
  54. Paiva, É.A.S.; Machado, S.R. Ontogenesis, anatomy, and ultrastructure of Hymenaea stigonocarpa Mart. ex Hayne (Fabaceae–Caesalpinioideae) extrafloral nectaries. Acta Bot. Bras. 2006, 20, 471–482. [Google Scholar] [CrossRef]
  55. Santos, J.C.; Del-Claro, K. Interactions between ants, herbivores and extrafloral nectaries in Tocoyena formosa (Cham. & Schlechtd.) K. Schum. (Rubiaceae) in Cerrado vegetation. Rev. Bras. Zoociênc. 2001, 3, 77–92. [Google Scholar]
  56. Freitas, E.V.; Maracahipes, L.; Araújo, W.S. Plant richness and vegetation structure drive the topology of plant–herbivore networks in Neotropical savannas. Acta Oecol. 2023, 121, 103961. [Google Scholar] [CrossRef]
  57. Corro, E.J.; Ahuatzin, D.A.; Jaimes, A.A.; Favila, M.E.; Ribeiro, M.C.; Lopez-Acosta, J.C.; Dáttilo, W. Forest cover and landscape heterogeneity shape ant–plant co-occurrence networks in human-dominated tropical rainforests. Landsc. Ecol. 2019, 34, 93–104. [Google Scholar] [CrossRef]
  58. Yode, C.-V.D.; Dosso, K.; Kouakou, L.M.M.; Kolo, Y.; Dekoninck, W.; Konate, S.; Kouassi, K.P. Evaluating Efficiency of Different Sampling Methods for Arboreal Ants (Hymenoptera: Formicidae) in A West African Forest-Savanna Mosaic. Sociobiology 2020, 67, 492–500. [Google Scholar] [CrossRef]
  59. Baccaro, F.B.; Feitosa, R.M.; Fernández, F.; Fernandes, I.O.; Izzo, T.J.; Souza, J.L.P.; Solar, R. Guia para os Gêneros de Formigas do Brasil; INPA: Manaus, Brazil, 2015. [Google Scholar]
  60. Feitosa, R.M.; Dias, A.M. An illustrated guide for the identification of ant subfamilies and genera in Brazil. Insect Syst. Evol. 2024, 55, 451–571. [Google Scholar] [CrossRef]
  61. Rosa, T.F.; Camarota, F.; Zuanon, L.A.; Tito, R.; Maravalhas, J.B.; Powell, S.; Vasconcelos, H.L. The effects of high-severity fires on the arboreal ant community of a Neotropical savanna. Oecologia 2021, 196, 951–961. [Google Scholar] [CrossRef]
  62. Dáttilo, W.; Vizentin-Bugoni, J.; Debastiani, V.J.; Jordano, P.; Izzo, T.J. The influence of spatial sampling scales on ant–plant interaction network architecture. J. Anim. Ecol. 2019, 88, 903–914. [Google Scholar] [CrossRef]
  63. Camarota, F.; Powell, S.; Vasconcelos, H.L.; Priest, G.; Marquis, R.J. Extrafloral nectaries have a limited effect on the structure of arboreal ant communities in a Neotropical savanna. Ecology 2015, 96, 231–240. [Google Scholar] [CrossRef]
  64. Blüthgen, N.; Menzel, F.; Blüthgen, N. Measuring specialization in species interaction networks. BMC Ecol. 2006, 6, 9. [Google Scholar] [CrossRef] [PubMed]
  65. Araújo, W.S.; Tscharntke, T.; Almeida-Neto, M. Global effects of land use intensity on the impoverishment of insect herbivore assemblages. Biodivers. Conserv. 2015, 24, 271–285. [Google Scholar] [CrossRef]
  66. Olesen, J.M.; Bascompte, J.; Dupont, Y.L.; Jordano, P. The modularity of pollination networks. Proc. Natl. Acad. Sci. USA 2007, 104, 19891–19896. [Google Scholar] [CrossRef]
  67. Beckett, S.J. Improved community detection in weighted bipartite networks. R. Soc. Open Sci. 2016, 3, 140536. [Google Scholar] [CrossRef] [PubMed]
  68. Dormann, C.F.; Gruber, B.; Fründ, J. Introducing the bipartite package: Analysing ecological networks. R News 2008, 8, 8–11. [Google Scholar]
  69. Almeida-Neto, M.; Ulrich, W. A straightforward computational approach for measuring nestedness using quantitative matrices. Environ. Model. Softw. 2011, 26, 173–178. [Google Scholar] [CrossRef]
  70. Jordán, F.; Liu, W.C.; Davis, A.J. Topological keystone species: Measures of positional importance in food webs. Oikos 2006, 112, 535–546. [Google Scholar] [CrossRef]
  71. R Development Core Team. R: A Language and Environment for Statistical Computing; R Foundation for Statistical Computing: Vienna, Austria, 2024. [Google Scholar]
  72. Hsieh, T.C.; Ma, K.H.; Chao, A. iNEXT: iNEXT: An R package for rarefaction and extrapolation of species diversity (Hill numbers). Methods Ecol. Evol. 2016, 7, 1451–1456. [Google Scholar] [CrossRef]
  73. Oksanen, J.; Blanchet, F.G.; Friendly, M.; Kindt, R.; Legendre, P.; McGlinn, D.; Solymos, P.; Szoecs, E.; Wagner, H.; Barbour, M.; et al. Vegan: Community Ecology Package, R Package Version 2.4-4; 2017. Available online: https://cran.r-project.org/package=vegan (accessed on 1 March 2026).
  74. Brooks, M.E.; Kristensen, K.; van Benthem, K.J.; Magnusson, A.; Berg, C.W.; Nielsen, A.; Skaug, H.J.; Mächler, M.; Bolker, B.M. glmmTMB Balances Speed and Flexibility Among Packages for Zero-inflated Generalized Linear Mixed Modeling. R J. 2017, 9, 378–400. [Google Scholar] [CrossRef]
  75. Fox, J.; Weisberg, S. An R Companion to Applied Regression; Sage Publications: Thousand Oaks, CA, USA, 2018. [Google Scholar]
  76. Hartig, F.; Lohse, L. DHARMa: Residual Diagnostics for Hierarchical (Multi-Level/Mixed) Regression Models. 2022. Available online: https://cran.r-project.org/package=DHARMa (accessed on 1 March 2026).
  77. Morellato, L.P.C.; Oliveira, P.S. Distribution of extrafloral nectaries in different vegetation types of Amazonian Brazil. Flora 1991, 185, 33–38. [Google Scholar] [CrossRef]
  78. Oliveira, P.S.; Oliveira-Filho, A.T. Distribution of extrafloral nectaries in the woody flora of tropical communities in Western Brazil. In Plant–Animal Interactions: Evolutionary Ecology in Tropical and Temperate Regions; Price, P.W., Lewinsohn, T.M., Fernandes, G.W., Benson, W.W., Eds.; Wiley: New York, NY, USA, 1991; pp. 163–175. [Google Scholar]
  79. Keeler, K.H. Distribution of plants with extrafloral nectaries and ants at two elevations in Jamaica. Biotropica 1979, 11, 152–154. [Google Scholar] [CrossRef]
  80. Stott, P.; Pemberton, R.W. The occurrence and abundance of plants with extrafloral nectaries, the basis for antiherbivore defensive mutualisms, along a latitudinal gradient in East Asia. J. Biogeogr. 1998, 25, 661–668. [Google Scholar] [CrossRef]
  81. Moura, R.F.; Del-Claro, K. Plants with extrafloral nectaries share indirect defenses and shape the local arboreal ant community. Oecologia 2023, 201, 73–82. [Google Scholar] [CrossRef]
  82. Calixto, E.S.; Novaes, L.R.; dos Santos, D.F.B.; Lange, D.; Moreira, X.; Del-Claro, K. Climate seasonality drives ant–plant–herbivore interactions via plant phenology in an extrafloral nectary-bearing plant community. J. Ecol. 2021, 109, 639–651. [Google Scholar] [CrossRef]
  83. Singh, I.K.; Singh, A. Plant–Pest Interactions: From Molecular Mechanisms to Chemical Ecology; Springer: New York, NY, USA, 2021. [Google Scholar]
  84. Heil, M.; McKey, D. Protective ant–plant interactions as model systems in ecological and evolutionary research. Annu. Rev. Ecol. Evol. Syst. 2003, 34, 425–553. [Google Scholar] [CrossRef]
  85. Muehleisen, A.; Queenborough, S.A.; Alvia, P.; Valencia, R.; Fiala, B. Incidence of extrafloral nectaries and their relationship with growth and survival of lowland tropical rain forest trees. Biotropica 2016, 48, 321–331. [Google Scholar] [CrossRef]
  86. Barrio, I.C.; Rapini, A. Plants under pressure: The impact of environmental change on plant ecology and evolution. BMC Ecol. Evol. 2023, 23, 13. [Google Scholar] [CrossRef]
  87. McKinney, M.L. Urbanization as a major cause of biotic homogenization. Biol. Conserv. 2006, 127, 247–260. [Google Scholar] [CrossRef]
  88. Sax, D.F.; Gaines, S.D. Species diversity: From global decreases to local increases. Trends Ecol. Evol. 2003, 18, 561–566. [Google Scholar] [CrossRef]
  89. Bascompte, J.; Jordano, P.; Melián, C.J.; Olesen, J.M. The nested assembly of plant–animal mutualistic networks. Proc. Natl. Acad. Sci. USA 2003, 100, 9383–9387. [Google Scholar] [CrossRef]
  90. Gibb, H.; Cunningham, S.A. Habitat contrasts reveal a shift in the trophic position of ant assemblages. J. Anim. Ecol. 2011, 80, 119–127. [Google Scholar] [CrossRef]
  91. Queiroz, A.C.; Rabello, A.M.; Braga, D.L.; Santiago, G.S.; Zurlo, L.F.; Philpott, S.M.; Ribas, C.R. Cerrado vegetation types determine how land use impacts ant biodiversity. Biodivers. Conserv. 2020, 29, 2017–2034. [Google Scholar] [CrossRef]
  92. Belchior, C.; Sendoya, S.F.; Del-Claro, K. Temporal variation in the abundance and richness of foliage-dwelling ants mediated by extrafloral nectar. PLoS ONE 2016, 11, e0158283. [Google Scholar] [CrossRef]
  93. Powell, S.; Costa, A.N.; Lopes, C.T.; Vasconcelos, H.L. Canopy connectivity and the availability of diverse nesting resources affect species coexistence in arboreal ants. J. Anim. Ecol. 2011, 80, 352–360. [Google Scholar] [CrossRef]
  94. Antoniazzi, R.; Garro, R.N.; Dáttilo, W.; Ribeiro, S.P.; Neves, F.S. Ant species richness and interactions in canopies of two distinct successional stages in a tropical dry forest. Sci. Nat. 2019, 106, 20. [Google Scholar] [CrossRef]
  95. Falcão, J.C.; Dáttilo, W.; Izzo, T.J. Efficiency of different planted forests in recovering biodiversity and ecological interactions in Brazilian Amazon. For. Ecol. Manag. 2015, 339, 105–111. [Google Scholar] [CrossRef]
  96. Lara, C.; Martinez-Bolaños, E.; López-Vázquez, K.; Díaz-Castelazo, C.; Castillo-Guevara, C.; Cuautle, M. Effect of agricultural land-use change on the structure of a temperate forest ant–plant interaction network. Entomol. Sci. 2020, 23, 128–141. [Google Scholar] [CrossRef]
  97. Díaz-Castelazo, C.; Sánchez-Galván, I.R.; Guimarães, P.R., Jr.; Raimundo, R.L.G.; Rico-Gray, V. Long-term temporal variation in the organization of an ant–plant network. Ann. Bot. 2013, 111, 1285–1293. [Google Scholar] [CrossRef]
  98. Lange, D.; Del-Claro, K. Ant–plant interaction in a tropical savanna: May the network structure vary over time and influence the outcomes of associations? PLoS ONE 2014, 9, e105574. [Google Scholar] [CrossRef]
  99. Lange, D.; Dáttilo, W.; Del-Claro, K. Influence of extrafloral nectary phenology on ant–plant mutualistic networks in a Neotropical savanna. Ecol. Entomol. 2013, 38, 463–469. [Google Scholar] [CrossRef]
  100. Rico-Gray, V.; Díaz-Castelazo, C.; Ramírez-Hernández, A.; Guimaraes, P.R., Jr.; Nathaniel Holland, J. Abiotic factors shape temporal variation in the structure of an ant–plant network. Arthropod-Plant Interact. 2012, 6, 289–295. [Google Scholar] [CrossRef]
  101. Dáttilo, W. Different tolerances of symbiotic and nonsymbiotic ant–plant networks to species extinctions. Netw. Biol. 2012, 2, 127–138. [Google Scholar]
  102. Dáttilo, W.; Corro, E.J.; Ahuatzin, D.A.; Regolin, A.L.; Lopez-Acosta, J.C.; Ribeiro, M.C. Scale of effect matters: Forest cover influences on tropical ant–plant ecological networks. Food Webs 2022, 33, e00256. [Google Scholar] [CrossRef]
  103. Chamberlain, S.A.; Holland, J.N. Body size predicts degree in ant–plant mutualistic networks. Funct. Ecol. 2009, 23, 196–202. [Google Scholar] [CrossRef]
  104. Miranda, P.N.; Silva Ribeiro, J.E.L.; Corro, E.J.; Brasil, I.; Delabie, J.H.C.; Dáttilo, W. Structural stability of ant–plant mutualistic networks mediated by extrafloral nectaries: Looking at the effects of forest fragmentation in the Brazilian Amazon. Sociobiology 2022, 69, e8261. [Google Scholar] [CrossRef]
  105. Nooy, W.; Mrvar, A.; Batagelj, V. Exploratory Social Network Analysis with Pajek, 2nd ed.; Cambridge University Press: Cambridge, UK, 2011. [Google Scholar]
  106. González, A.M.M.; Dalsgaard, B.; Olesen, J.M. Centrality measures and the importance of generalist species in pollination networks. Ecol. Complex. 2010, 7, 36–43. [Google Scholar] [CrossRef]
  107. Heil, M. Extrafloral nectar at the plant–insect interface: A spotlight on chemical ecology, phenotypic plasticity, and food webs. Annu. Rev. Entomol. 2015, 60, 213–232. [Google Scholar] [CrossRef]
  108. Guimarães, P.R.; Rico-Gray, V.; Oliveira, P.S.; Izzo, T.J.; Reis, S.F.; Thompson, J.N. Interaction intimacy affects structure and coevolutionary dynamics in mutualistic networks. Curr. Biol. 2007, 17, 1797–1803. [Google Scholar] [CrossRef]
  109. Bascompte, J.; Jordano, P. Plant–animal mutualistic networks: The architecture of biodiversity. Annu. Rev. Ecol. Evol. Syst. 2007, 38, 567–593. [Google Scholar] [CrossRef]
  110. Gómez, J.M.; Perfectti, F. Fitness consequences of centrality in mutualistic individual-based networks. Proc. R. Soc. B Biol. Sci. 2012, 279, 1754–1760. [Google Scholar] [CrossRef]
  111. Davidson, D.W.; Cook, S.C.; Snelling, R.R. Performance of ants (Formicidae) on liquid diets: Ecological and evolutionary implications. Oecologia 2004, 139, 255–266. [Google Scholar] [CrossRef] [PubMed]
  112. Mackay, W.P. A review of the New World ants of the genus Dolichoderus (Hymenoptera: Formicidae). Sociobiology 1993, 22, 1–148. [Google Scholar]
  113. Guerrero, R.J. Transfer of two South American ant species from Tapinoma Foerster, 1850 to Forelius Emery, 1888 (Hymenoptera: Formicidae: Dolichoderinae). Zootaxa 2021, 4920, 428–438. [Google Scholar] [CrossRef] [PubMed]
  114. Wild, A.L. Taxonomic Revision of the Ant Genus Linepithema (Hymenoptera: Formicidae); University of California Press: London, UK, 2007; Volume 126, 151p. [Google Scholar]
  115. Arias-Penna, T.M. Subfamilia Ectatomminae. In Sistemática, Biogeografía y Conservación de las Hormigas Cazadoras de Colombia; Jiménez, E., Fernández, F., Arias, T.M., Lozano-Zambrano, F.H., Eds.; Instituto de Investigación de Recursos Biológicos Alexander von Humboldt: Bogotá, Colombia, 2008; pp. 53–107. [Google Scholar]
  116. Priest, G.V.; Camarota, F.; Vasconcelos, H.L.; Powell, S.; Marquis, R.J. Active modification of cavity nest-entrances is a common strategy in arboreal ants. Biotropica 2021, 53, 857–867. [Google Scholar] [CrossRef]
  117. McClure, M.; Chouteau, M.; Dejean, A. Territorial aggressiveness on the arboreal ant Azteca alfari by Camponotus blandus in French Guiana due to behavioural constraints. Comptes Rendus Biol. 2008, 331, 663–667. [Google Scholar] [CrossRef]
  118. DaRocha, W.D.; Ribeiro, S.P.; Neves, F.S.; Fernandes, G.W.; Leponce, M.; Delabie, J.H.C. How does bromeliad distribution structure the arboreal ant assemblage (Hymenoptera: Formicidae) on a single tree in a Brazilian Atlantic forest agroecosystem? Myrmecol. News 2015, 21, 83–92. [Google Scholar]
  119. Fagundes, R.; Terra, G.; Ribeiro, S.P.; Majer, J.D. The bamboo Merostachys fischeriana (Bambusoideae: Bambuseae) as a canopy habitat for ants of Neotropical montane forest. Neotrop. Entomol. 2010, 39, 906–911. [Google Scholar] [CrossRef]
  120. Soares, H., Jr.; Oliveira, P.S. Foraging and spatial ecology of a polydomous carpenter ant, Camponotus leydigi (Hymenoptera: Formicidae), in tropical Cerrado savanna: A natural history account. Environ. Entomol. 2021, 50, 19–27. [Google Scholar] [CrossRef]
  121. Ronque, M.U.; Fourcassié, V.; Oliveira, P.S. Ecology and field biology of two dominant Camponotus ants (Hymenoptera: Formicidae) in the Brazilian savannah. J. Nat. Hist. 2018, 52, 237–252. [Google Scholar] [CrossRef]
  122. Ulysséa, M.A.; Prado, L.P.D.; Brandão, C.R.F. Catalogue of the Dolichoderinae, Formicinae and Martialinae (Hymenoptera: Formicidae) types deposited at the Museu de Zoologia da Universidade de São Paulo, Brazil. Pap. Avulsos Zool. 2017, 57, 295–311. [Google Scholar] [CrossRef]
  123. Mackay, W.P. The Systematics and Biology of the New World Carpenter Ants of the Hyperdiverse Genus Camponotus (Hymenoptera: Formicidae). 2004. Available online: http://www.utep.edu/leb/ants/Camponotus.htm (accessed on 31 August 2024).
  124. Oliveira, A.M.; Powell, S.; Feitosa, R.M. A taxonomic study of the Brazilian turtle ants (Formicidae: Myrmicinae: Cephalotes). Rev. Bras. Entomol. 2021, 65, e20210028. [Google Scholar] [CrossRef]
  125. Longino, J.T. The Crematogaster (Hymenoptera: Formicidae: Myrmicinae) of Costa Rica. Zootaxa 2003, 151, 1–150. [Google Scholar] [CrossRef]
  126. Wilson, E.O. Pheidole in the New World: A Dominant, Hyperdiverse Ant Genus; Harvard University Press: Cambridge, MA, USA, 2003. [Google Scholar]
  127. Trager, J.C. A revision of the fire ants, Solenopsis geminata group (Hymenoptera: Formicidae: Myrmicinae). J. N. Y. Entomol. Soc. 1991, 99, 141–198. [Google Scholar]
  128. Cuezzo, F.; Calcaterra, L.A.; Chifflet, L.; Follett, P. Wasmannia Forel (Hymenoptera: Formicidae: Myrmicinae) in Argentina: Systematics and distribution. Sociobiology 2015, 62, 246–265. [Google Scholar] [CrossRef]
  129. Gillette, P.N.; Ennis, K.K.; Domínguez Martínez, G.; Philpott, S.M. Changes in species richness, abundance, and composition of arboreal twig-nesting ants along an elevational gradient in coffee landscapes. Biotropica 2015, 47, 712–722. [Google Scholar] [CrossRef]
  130. Dejean, A.; Labrière, N.; Touchard, A.; Petitclerc, F.; Roux, O. Nesting habits shape feeding preferences and predatory behavior in an ant genus. Naturwissenschaften 2014, 101, 323–330. [Google Scholar] [CrossRef] [PubMed]
  131. Ward, P.S. The ant subfamily Pseudomyrmecinae (Hymenoptera: Formicidae): Generic revision and relationship to other formicids. Syst. Entomol. 1990, 15, 449–489. [Google Scholar] [CrossRef]
  132. Ward, P.S. Systematic studies on Pseudomyrmecine ants: Revision of the Pseudomyrmex oculatus and P. subtilissimus species groups, with taxonomic comments on other species. Quaest. Entomol. 1989, 25, 393–468. [Google Scholar]
  133. Ward, P.S. The Nearctic species of the genus Pseudomyrmex (Hymenoptera: Formicidae). Quaest. Entomol. 1985, 21, 209–246. [Google Scholar]
Figure 1. Conceptual model illustrating the effects of plants with and without extrafloral nectaries (EFNs), as well as environments with contrasting levels of conservation (preserved and degraded), on the diversity and structure of ant–plant interaction networks.
Diversity 18 00314 g001
Figure 2. Location of the six sampling areas in Neotropical savannas located in the district of Serra Nova, municipality of Rio Pardo de Minas, Minas Gerais, Brazil. Green markers correspond to preserved areas located in the Serra Nova and Talhado State Park (PESNT) characterized by native vegetation and low human disturbance, and purple markers represent disturbed (rural) areas outside the conservation unit, characterized by modified vegetation and higher levels of anthropogenic disturbance.
Diversity 18 00314 g002
Figure 3. Quantitative ant–plant interaction networks in different plant communities in Neotropical savannas, including preserved areas (A1, A2, and A3) and disturbed areas (A4, A5, and A6). Light green bars represent plant species with extrafloral nectaries (EFNs), dark green bars correspond to plant species without EFNs, black bars represent all ants (arboreal and non-arboreal) recorded in the network, and gray lines, with thickness proportional to the number of interaction frequencies recorded.
Diversity 18 00314 g003
Figure 4. Tree community richness in networks with and without extrafloral nectaries (EFNs), considering two subsets of the ant community: (A) total network, including all recorded species (arboreal and non-arboreal), and (B) network composed only of arboreal ant species. Boxplots show the median, interquartile range, and data dispersion. Gray circles represent raw data points, black diamonds indicate predicted means from the negative binomial GLM, and error bars represent 95% confidence intervals.
Diversity 18 00314 g004
Figure 5. Abundance of the tree community in networks with and without extrafloral nectaries (EFNs), considering two subsets of the ant community: (A) total network, including all recorded species (arboreal and non-arboreal), and (B) network composed only of arboreal ant species. Boxplots show the median, interquartile range, and data dispersion. Gray circles represent raw data points, black diamonds indicate predicted means from the negative binomial GLM, and error bars represent 95% confidence intervals.
Diversity 18 00314 g005
Figure 6. Comparison of network nestedness (wNODF) considering two subsets of the ant community: (A) total network, including all recorded species (arboreal and non-arboreal), comparing preserved and disturbed environments, and (B) network composed only of arboreal ant species, comparing interactions with plants with and without extrafloral nectaries (EFNs). Boxplots show the median, interquartile range, and data dispersion. Gray circles represent raw data points, black diamonds indicate predicted means from the gaussian GLM, and error bars represent 95% confidence intervals.
Diversity 18 00314 g006
Figure 7. Comparison of network degree between plant species communities with and without extrafloral nectaries (EFNs) in ant–plant networks, considering two subsets of the ant community: (A) total network, including all recorded species (arboreal and non-arboreal), and (B) network composed only of arboreal ant species. Boxplots show the median, interquartile range, and data dispersion. Gray circles represent raw data points, black diamonds indicate predicted means from the negative binomial GLM, and error bars represent 95% confidence intervals.
Diversity 18 00314 g007
Figure 8. Comparison of network betweenness centrality between plant species communities with and without extrafloral nectaries (EFNs) in ant–plant networks, considering two subsets of the ant community: (A) total network, including all recorded species (arboreal and non-arboreal), and (B) network composed only of arboreal ant species. Boxplots show the median, interquartile range, and data dispersion. Gray circles represent raw data points, black diamonds indicate predicted means from the tweedie GLM, and error bars represent 95% confidence intervals.
Diversity 18 00314 g008
Figure 9. Comparison of network closeness centrality between plant species communities with and without extrafloral nectaries (EFNs) in ant–plant networks, considering two subsets of the ant community: (A) total network, including all recorded species (arboreal and non-arboreal), and (B) network composed only of arboreal ant species. Boxplots show the median, interquartile range, and data dispersion. Gray circles represent raw data points, black diamonds indicate predicted means from the gamma GLM, and error bars represent 95% confidence intervals.
Diversity 18 00314 g009
Table 1. Generalized linear models (GLMs) showing the effect of network type (with and without extrafloral nectaries—EFNs), plant richness, environment (preserved and disturbed), and the interaction between network type and environment on the richness and abundance of plants and ants, considering the total set of ant species (arboreal and non-arboreal) recorded in the ant–plant networks. Bolded values indicate significant results.
Response VariableExplanatory VariablesDfDevianceResid. DfResid. DevPr (>Chi)
Plant richnessNetwork type114.71013.1<0.001
Environment10.26912.80.610
Network type × Environment10.02812.780.881
Plant abundanceNetwork type17.391015.50.007
Environment10.05915.40.833
Network type × Environment11.03814.40.311
Ant richnessNetwork type12.191017.70.139
Environment11.13916.10.288
Network type × Environment11.14712.80.287
Plant richness12.19813.90.139
Ant abundanceNetwork type10.491014.60.485
Environment10.62914.00.431
Network type × Environment10.71713.20.399
Plant richness10.13813.90.716
Table 2. Results of generalized linear models (GLMs) evaluating the effects of network type (with and without extrafloral nectaries—EFNs), environment (preserved and disturbed), and their interaction on network-level topological descriptors (specialization—H2′, connectance, modularity, and nestedness—wNODF) in ant–plant interaction networks, considering the total set of ant species (arboreal and non-arboreal) recorded in the networks. Bolded values indicate significant results.
Response VariableExplanatory VariablesDfDevianceResid. DfResid. DevFPr (>F)
Specialization H2′Network type14.4097.834.320.076
Environment10.6887.160.660.442
Network type × Environment10.0477.120.040.857
ConnectanceNetwork type11.5998.671.430.271
Environment10.5688.110.500.502
Network type × Environment10.3377.780.300.603
ModularityNetwork type14.67918.441.920.208
Environment11.41817.030.580.471
Network type × Environment10.03716.990.010.910
Nestedness (wNODF)Network type12.2499.973.500.103
Environment13.8986.086.100.043
Network type × Environment11.6074.472.510.157
Table 3. Results of generalized linear models (GLMs) evaluating if plant species with and without extrafloral nectaries (EFNs) differ in the topological descriptors at the species level (degree, specialization d’, betweenness centrality, and closeness centrality), considering the total set of ant species (arboreal and non-arboreal) recorded in the ant–plant networks. Bolded values indicate significant results.
Response
Variable
Explanatory
Variables
FamilyDfTest Statisticp-Value
DegreeNetwork typeNegative binomial1χ2 = 8.2560.004
Specialization (d′)Network typeGaussian1F = 1.2190.276
Betweenness centralityNetwork typeTweedie1χ2 = 19.157<0.01
Closeness centralityNetwork typeGamma1χ2 = 4175.2<0.001
Disclaimer/Publisher’s Note: The statements, opinions and data contained in all publications are solely those of the individual author(s) and contributor(s) and not of MDPI and/or the editor(s). MDPI and/or the editor(s) disclaim responsibility for any injury to people or property resulting from any ideas, methods, instructions or products referred to in the content.