Article

Remote Sensing Estimation of Plant Diversity in Sandy Ecosystem Based on Sentinel-2 Data

College of Life and Environmental Sciences, Minzu University of China, Beijing 100081, China
*
Author to whom correspondence should be addressed.
Diversity 2026, 18(5), 295; https://doi.org/10.3390/d18050295
Submission received: 12 April 2026 / Revised: 12 May 2026 / Accepted: 12 May 2026 / Published: 15 May 2026
(This article belongs to the Special Issue Biodiversity Conservation Planning and Assessment—2nd Edition)

Abstract

Plant diversity is a key indicator of ecosystem structure, function, and restoration status, yet its rapid assessment remains challenging in sandy ecosystems where vegetation is sparse, spatially heterogeneous, and strongly affected by exposed soil backgrounds. In such environments, conventional greenness-based spectral indices may not adequately capture species-level variation because plant communities are controlled not only by photosynthetic biomass but also by soil moisture, micro-topography, and dune-related habitat heterogeneity. This study evaluated the potential of Sentinel-2-derived spectral indices for estimating plant α-diversity in the Hunshandak Sandland, northern China. Based on field observations from 888 plots collected during 2017–2024, four α-diversity metrics—species richness, Shannon–Wiener index, Simpson index, and Pielou evenness index—were calculated and compared with 21 spectral indices using correlation analysis, partial least squares regression (PLSR), and random forest (RF) models. The results showed that model performance varied substantially among diversity metrics. Species richness was estimated with the highest accuracy, whereas Shannon–Wiener, Simpson, and Pielou indices showed weaker predictability, indicating that remotely sensed spectral indices were more sensitive to species number than to abundance distribution and evenness. Moisture- and soil-background-sensitive indices, including the Normalized Difference Water Index (NDWI), Modified Normalized Difference Water Index (MNDWI), Bare Soil Index (BSI/BRI), and Chlorophyll Absorption Ratio Index (CARI), showed relatively stable relationships with plant diversity across different vegetation gradients. Although the overall explanatory power was moderate rather than high, the results demonstrate the practical value of Sentinel-2 spectral indices for regional screening of plant diversity patterns in sandy ecosystems. This study provides empirical evidence for biodiversity monitoring and ecological restoration assessment in semi-arid sandy landscapes and highlights the need to integrate environmental covariates, multi-source remote sensing, and phenological information in future studies.

1. Introduction

Plant diversity is a key indicator of ecosystem health and can reflect the structural and functional characteristics of ecosystems. In biodiversity assessment, α-diversity, or local diversity, and β-diversity, or species turnover, are two important dimensions. The combination of these two dimensions can comprehensively reflect the overall diversity pattern of an area [1,2]. Several indices have been widely used to estimate α-diversity, such as species richness [3], Simpson index [4], Shannon–Wiener index [5], and Pielou evenness index [6]. In contrast, β-diversity reflects differences in species composition between sites.
In recent years, the development of high-resolution satellite data, such as Sentinel-2, has greatly facilitated biodiversity monitoring by providing continuous, repeated, and spatially explicit observations of land surface conditions [7,8,9]. Sentinel-2 imagery has been widely used to monitor land cover change, vegetation dynamics, and desertification processes in northern China [8,10,11], and it is increasingly recognized as an effective data source for habitat monitoring and conservation assessment [12,13]. While plant diversity has been successfully assessed using remote sensing data in forests [14,15,16,17] and grasslands [18,19,20], sandy ecosystems remain relatively underrepresented in remote sensing-based biodiversity studies. Existing studies in sandy and semi-arid regions have mainly focused on vegetation cover, biomass, productivity, and desertification dynamics, whereas the spectral estimation of plant diversity is still limited [21,22,23,24]. This gap is important because biodiversity in sandy ecosystems directly influences vegetation stability, soil conservation, wind erosion resistance, forage availability, and the effectiveness of ecological restoration.
Sandy ecosystems are characterized by sparse vegetation, discontinuous canopy cover, high soil reflectance, strong water limitation, and pronounced microhabitat heterogeneity associated with dunes, interdune lowlands, semi-fixed dunes, fixed dunes, and sandy grasslands. These features make remote sensing estimation of plant diversity particularly difficult. In such landscapes, spectral signals from vegetation are frequently mixed with signals from bare sand and dry soil, and the spectral response of a 10 m Sentinel-2 pixel may represent a mosaic of plants, litter, biological soil crusts, and exposed sand rather than a homogeneous plant community [21,23,25]. Therefore, the relationship between spectral indices and plant diversity in sandy ecosystems may differ from that in forests, dense grasslands, or croplands [17,20,25,26].
The Hunshandak Sandland is located in the southern part of the Xilingol Plateau and represents an important sandy grassland ecosystem in the central Mongolian Plateau. It is not a coastal dune system, but an inland semi-arid sandy landscape shaped by wind erosion, dune stabilization processes, grazing disturbance, and restoration measures. Vegetation is distributed discontinuously along gradients of dune mobility, soil moisture, and grazing intensity. Plant communities usually consist of drought-tolerant grasses, shrubs, and psammophytic species, and species richness can vary markedly among dune crests, slopes, interdune depressions, and fixed sandy grasslands [21,22,23,24]. These characteristics make the region a suitable natural laboratory for testing whether satellite spectral indices can capture plant diversity patterns in heterogeneous sandy landscapes.
The theoretical basis for remote sensing of biodiversity is often linked to the spectral variation hypothesis, which assumes that spectral heterogeneity is related to environmental and biological heterogeneity [13,25,27,28,29]. However, the applicability of this hypothesis is context-dependent, particularly in sparsely vegetated and soil-dominated landscapes [13,25,30]. In sandy ecosystems, conventional greenness indices such as the Normalized Difference Vegetation Index (NDVI) may be weakened by soil background effects and nonlinear responses at different vegetation covers, whereas moisture-sensitive and soil-adjusted indices may better reflect the ecological gradients that structure plant communities [23,24,31]. Previous studies in arid and semi-arid ecosystems have shown that vegetation distribution and biodiversity patterns are strongly constrained by water availability, soil properties, and micro-topography, suggesting that moisture-related spectral signals may provide useful information for diversity estimation [22,24,32].
Despite these advances, three key questions remain unresolved. First, it is unclear which Sentinel-2-derived spectral indices are most sensitive and stable for estimating plant α-diversity in sandy ecosystems. Second, the predictive performance of spectral indices may differ among diversity metrics because richness, abundance-weighted diversity, and evenness represent different ecological attributes. Third, it remains necessary to determine whether the relationships between spectral indices and diversity change across vegetation complexity and cover gradients [13,21,25].
Therefore, the objectives of this study were to: (1) evaluate the relationships between Sentinel-2-derived spectral indices and four plant α-diversity metrics in the Hunshandak Sandland; (2) compare the predictive performance of correlation analysis, partial least squares regression (PLSR), and random forest (RF) models; (3) identify the spectral indices that are most stable and informative for estimating plant diversity in sandy ecosystems; and (4) clarify the ecological meaning and limitations of remote sensing-based diversity estimation under sparse and heterogeneous vegetation conditions, aiming to provide a scientific basis for biodiversity monitoring, ecological restoration assessment, and management of sandy ecosystems.

2. Materials and Methods

2.1. Study Area

The study was conducted in the Hunshandak Sandland, located on the southern Xilingol Plateau in northern China and forming part of the central Mongolian Plateau (Figure 1). The region is an inland semi-arid sandy ecosystem rather than a coastal dune system. It is characterized by alternating fixed dunes, semi-fixed dunes, mobile dunes, interdune lowlands, and sandy grasslands. Vegetation distribution is highly heterogeneous and is mainly controlled by soil moisture, dune stability, grazing pressure, and micro-topographic variation [21,22,23,24]. The climate is temperate semi-arid, with strong seasonal variation in precipitation and temperature. Most precipitation occurs during the growing season, especially from June to August, which coincides with the peak period of vegetation growth and species identification.
The plant communities are dominated by drought-tolerant grasses, forbs, and shrubs adapted to sandy soils. Typical habitats include fixed sandy dunes, semi-fixed dune vegetation, mobile dune vegetation, and interdune lowland vegetation. These habitat types differ in vegetation cover, soil water availability, bare sand exposure, and community composition.

2.2. Field Survey and Sample Plot Selection

Field sampling was conducted during the peak growing season in July from 2017 to 2024, when most herbaceous and shrub species can be reliably identified and when Sentinel-2 images are most representative of maximum vegetation development. A total of 888 plots of 1 m × 1 m were established across the Hunshandak Sandland. The plots were selected to represent the major vegetation and habitat gradients of the region, including fixed sandy grassland, semi-fixed dunes, mobile dunes, and interdune lowlands. Plot selection followed three criteria: (1) coverage of the main habitat types and vegetation-cover gradients; (2) accessibility and spatial distribution across the study area; and (3) avoidance of plots located directly on roads, settlements, cultivated land, water bodies, or recently disturbed surfaces.
To reduce geolocation and mixed-pixel errors, plots were placed in relatively homogeneous patches whenever possible, and their geographic coordinates were recorded using a handheld GPS device. For each plot, all vascular plant species were recorded, and the abundance or cover of each species was estimated. These data were used to calculate species richness, Shannon–Wiener index, Simpson index, and Pielou evenness index. The number of plots differed among habitat types because habitat areas and accessibility were uneven across the sandland. The sample distribution was as follows: fixed sandy grassland, 165 plots; semi-fixed dunes, 191 plots; interdune lowlands, 299 plots; semi-mobile dunes, 45 plots; and mobile dunes, 233 plots.

2.3. Calculation of the Plant Diversity Index

The α-diversity of each plot was quantified using four commonly used diversity metrics: species richness (S), Shannon–Wiener index (H), Simpson index (D), and Pielou evenness index (J) [3,4,5,6]. Species richness was defined as the number of plant species recorded in a plot. Plots with only one species were assigned a Pielou evenness value of zero to avoid division by zero and to reflect the absence of evenness among multiple species.

2.4. Sentinel-2 Imagery and Spectral Index Calculation

Sentinel-2 Level-2A surface reflectance images were used in this study. For each survey year, all available Sentinel-2 images within a 31-day window centered on the field survey date in July were collected. The phrase “31-day temporal resolution” therefore refers to the image compositing window rather than the revisit interval of Sentinel-2 or a single-date image. Images affected by clouds, cloud shadows, and low-quality observations were masked using the quality assessment layer and visual inspection when necessary. A monthly median composite was then generated for each year to reduce cloud contamination, atmospheric noise, and short-term variability. The composite image was matched with field plots surveyed in the corresponding year.
All Sentinel-2 bands used for index calculation were resampled to 10 m spatial resolution before extraction of plot-level spectral values. For each plot, the spectral index value of the corresponding Sentinel-2 pixel was extracted. Because the ground plot size was 1 m2 whereas the Sentinel-2 pixel size was 10 m × 10 m, this procedure inevitably introduced scale mismatch uncertainty, which is explicitly discussed in the limitations section [33].
Twenty-one spectral indices were calculated from Sentinel-2 reflectance bands (Table 1). The full names and acronyms of the main indices are written as follows: Normalized Difference Vegetation Index (NDVI), Enhanced Vegetation Index 2 (EVI2), Normalized Difference Water Index (NDWI), Modified Normalized Difference Water Index (MNDWI), Normalized Difference Moisture Index (NDMI), Normalized Difference Red Edge Index (NDREI), Chlorophyll Absorption Ratio Index (CARI), Bare Soil Index or Bare Reflectance Index (BSI/BRI), and other vegetation- or soil-sensitive indices [31,34]. Sentinel-2 imagery and spectral index calculations were processed using ENVI 5.6 software (L3Harris Geospatial, Boulder, CO, USA).

2.5. Statistical Analysis

We stratified the data by species richness into three gradients—low richness, medium richness, and high richness—defined as 2 R i c h n e s s < 5 , 5 R i c h n e s s < 10 , and 10 R i c h n e s s 12 , respectively. We also stratified the data by NDVI into three vegetation-cover gradients: NDVI < 0.2, 0.2 ≤ NDVI < 0.4, and NDVI ≥ 0.4. These gradients were used to reflect differences in community complexity and vegetation cover. Correlation analyses were performed for each gradient and for the full dataset to identify indices with predictive potential and their associations with diversity metrics.
For model development, the dataset was split into training and testing subsets using a year-stratified random sampling strategy. Specifically, samples from each survey year were randomly divided into training and testing sets according to the same proportion to avoid overrepresentation or exclusion of any single year. This approach preserved the temporal structure of the eight-year dataset while maintaining sufficient sample size for both model fitting and independent evaluation.
Partial least squares regression (PLSR) and random forest (RF) models were used to evaluate the predictive performance of spectral indices. Model performance was assessed using the coefficient of determination ( R 2 ), root mean square error (RMSE), mean absolute error (MAE), and relative prediction error where appropriate. RMSE and MAE were added because they provide direct measures of estimation error in the original units of the diversity indices and complement R 2 , which only describes the proportion of explained variance.
R M S E = 1 n i = 1 n ( y i y i ^ ) 2
M A E = 1 n i = 1 n y i y i ^
where y i and y i ^ are the observed and predicted values, respectively, and n is the number of validation samples.
The RF model was used to rank the relative importance of spectral indices. Because RF importance values can be affected by collinearity among predictors, the interpretation focused on indices that showed consistent importance across diversity metrics and vegetation gradients rather than on a single ranking result.

3. Results

3.1. Relationships Between Spectral Indices and Plant Diversity

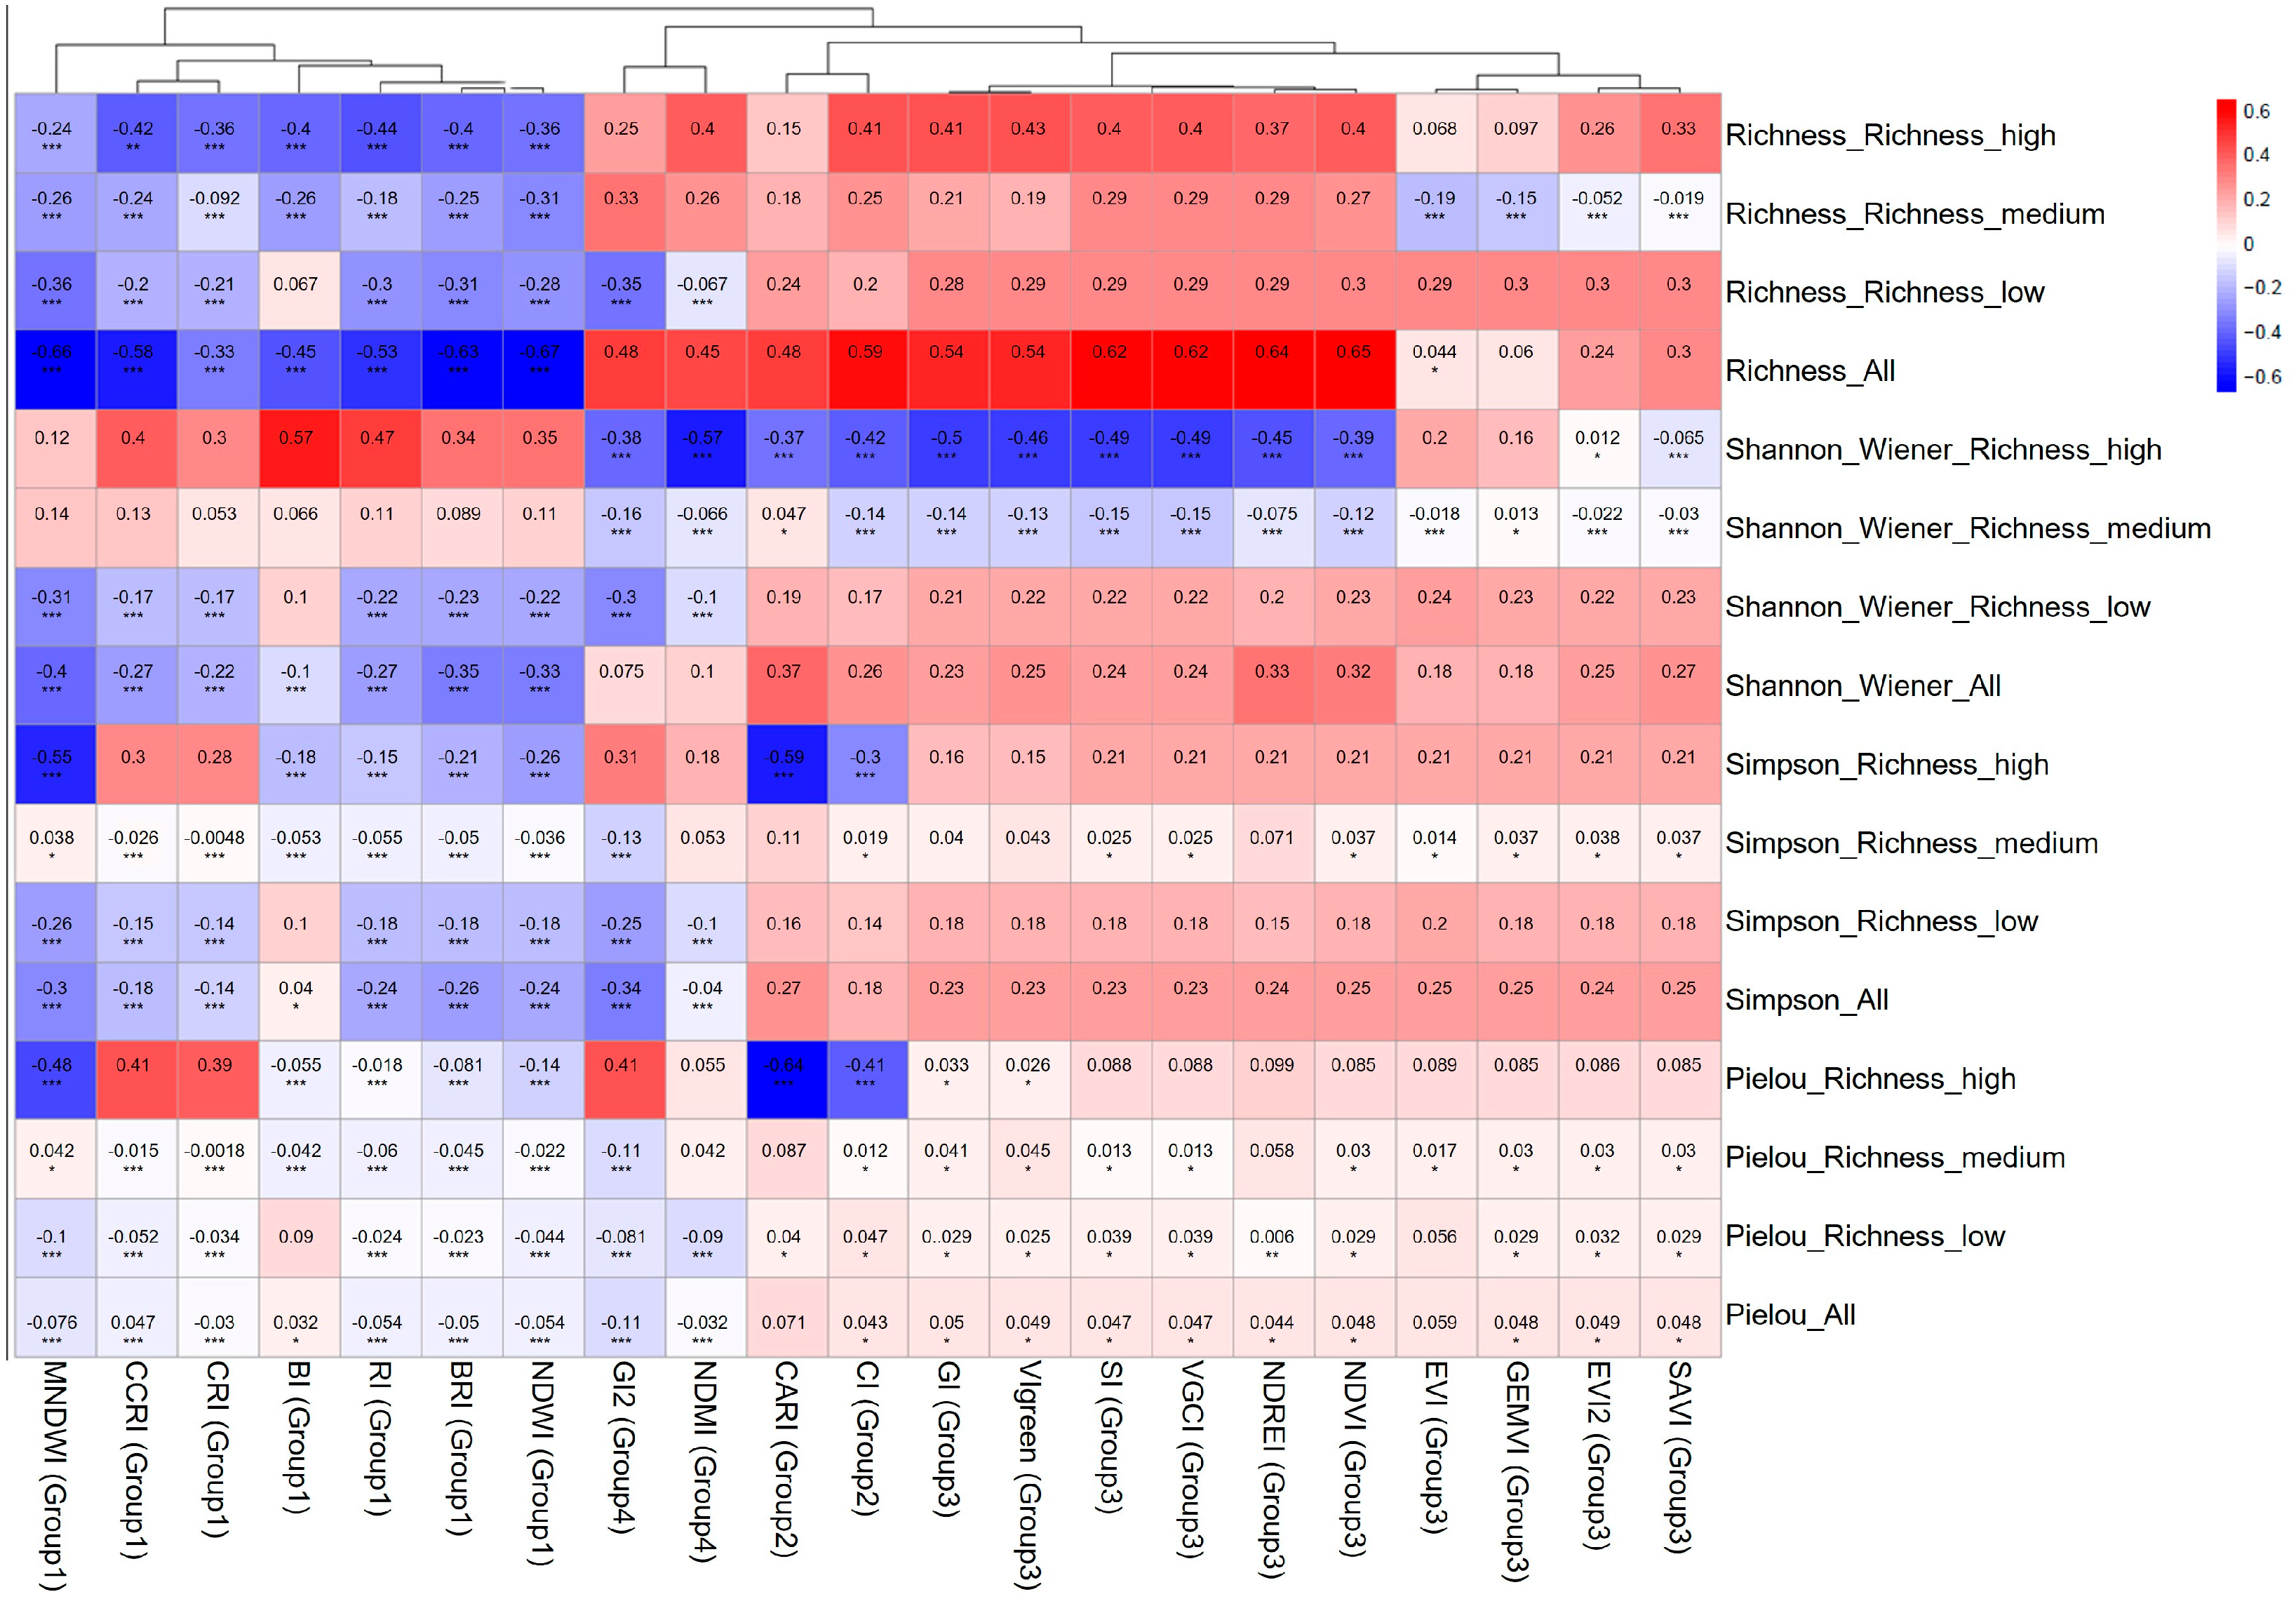
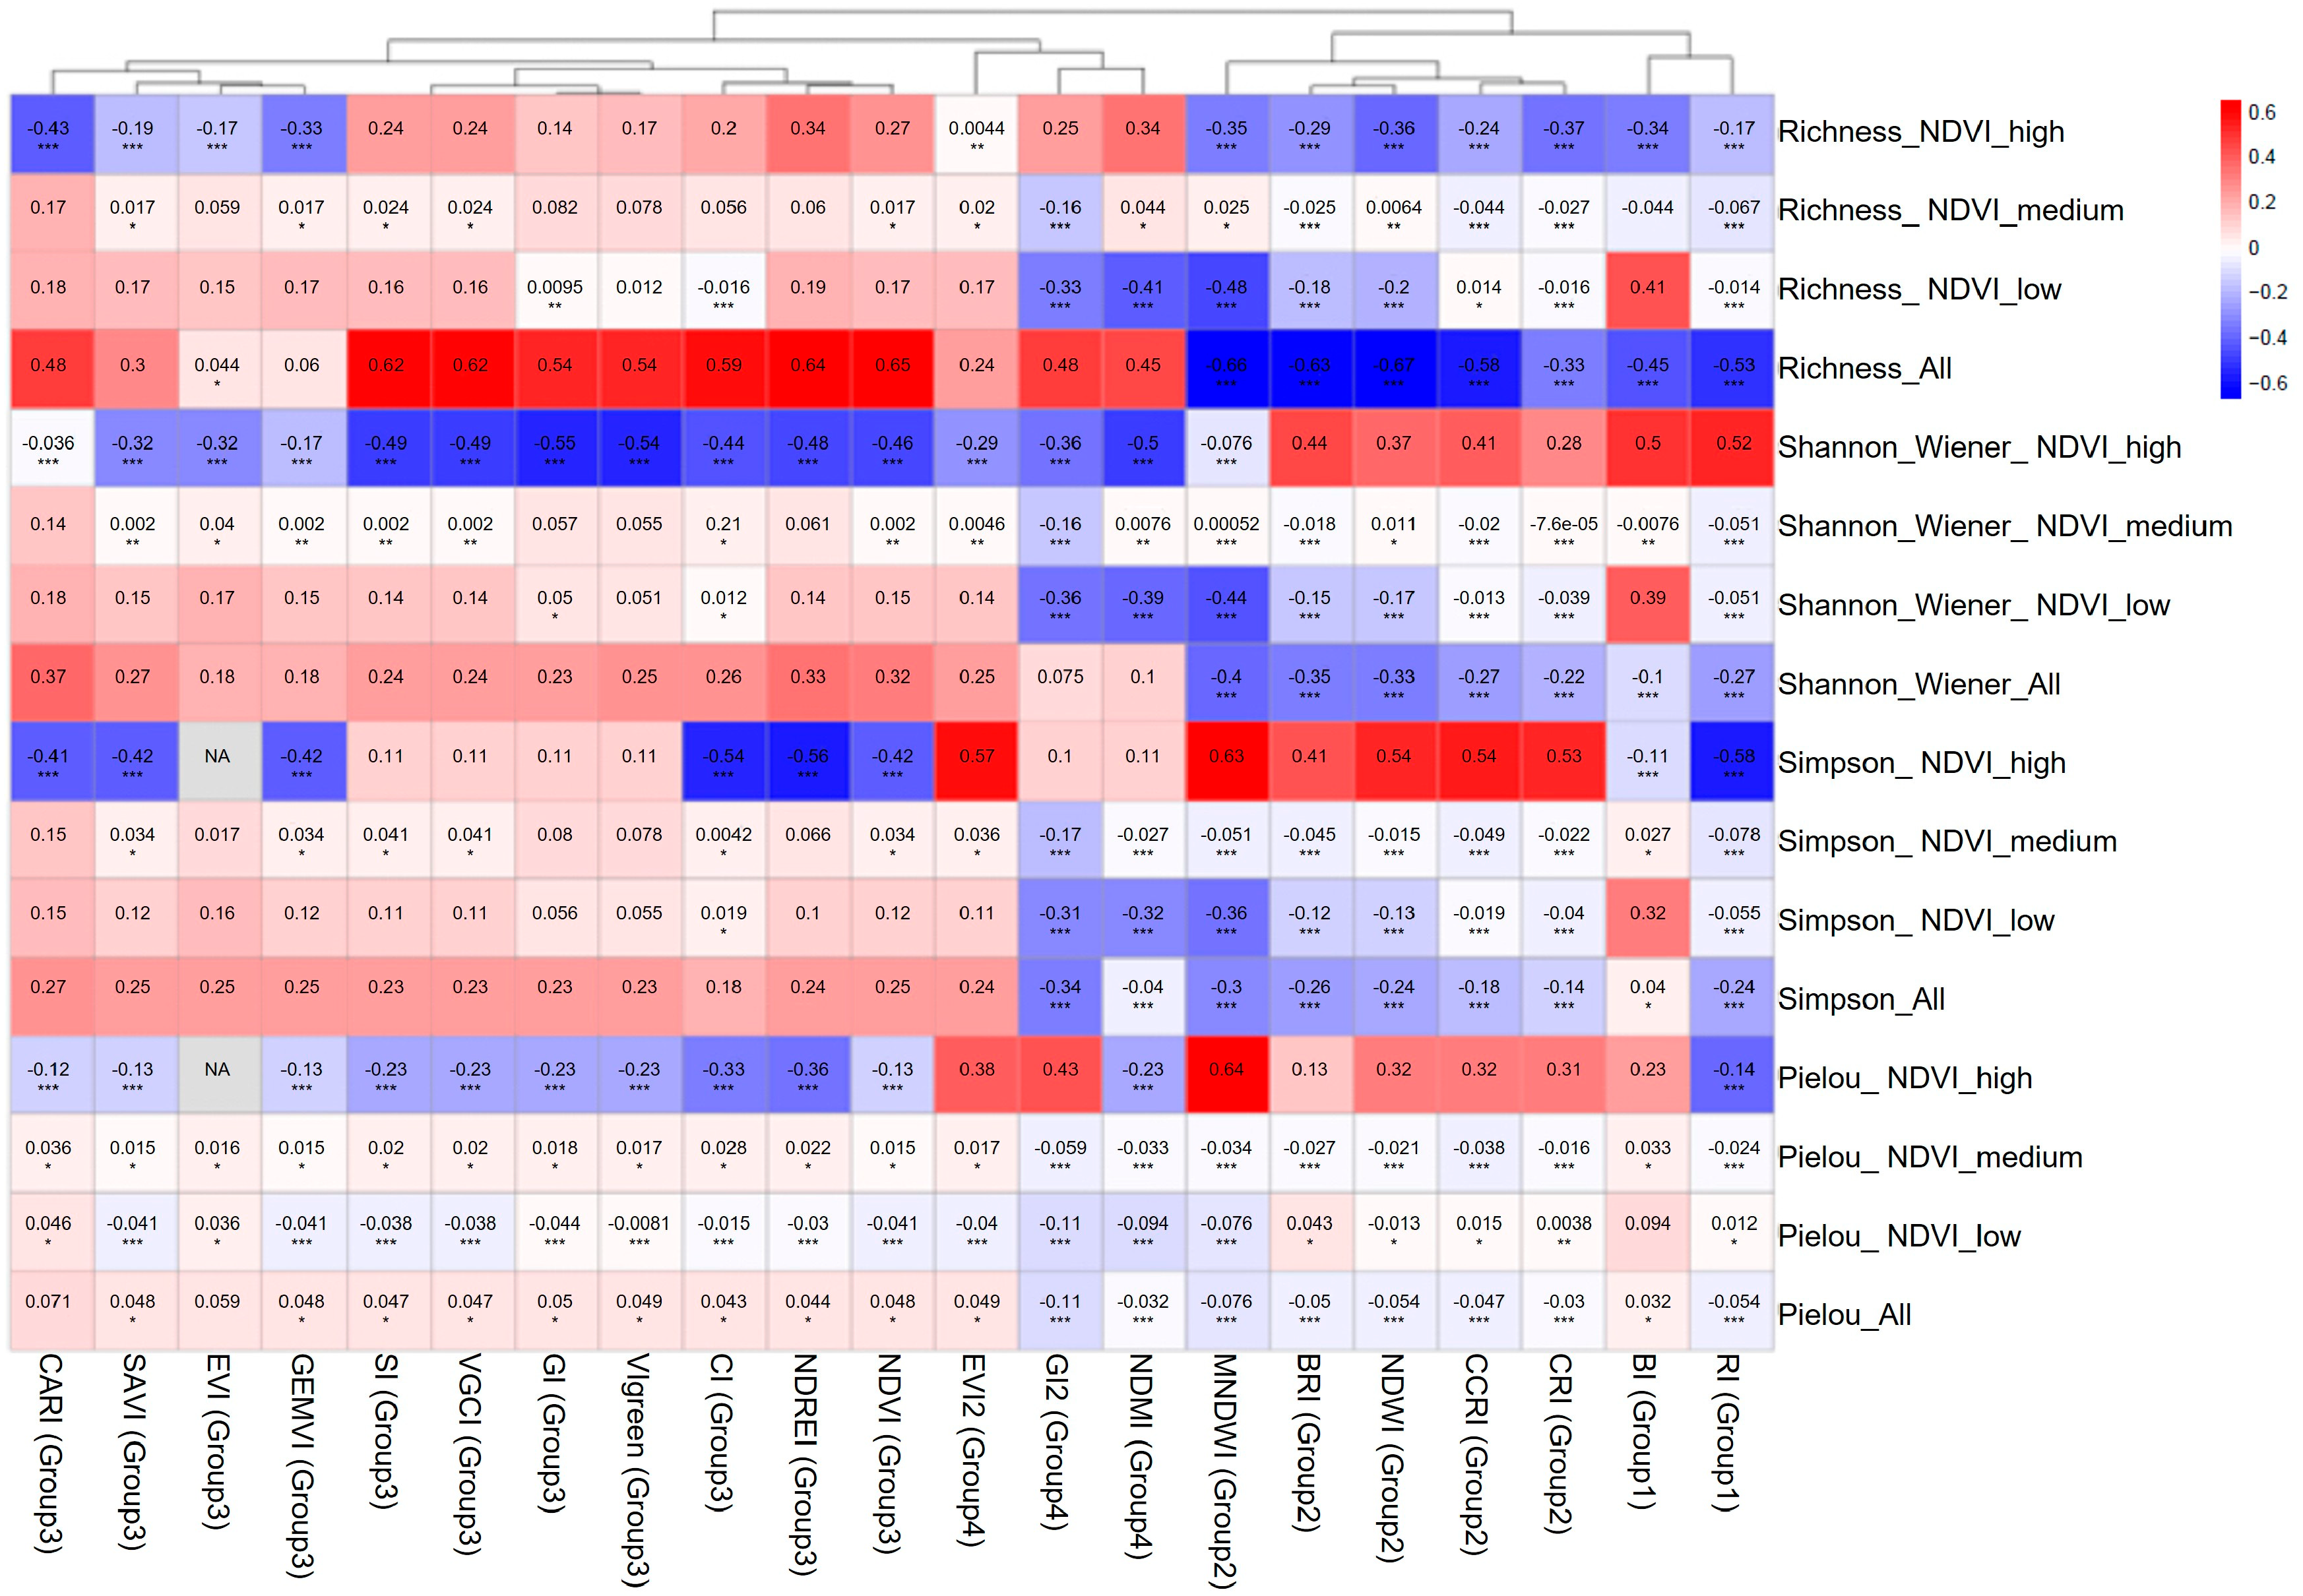
Most significant correlations between spectral indices and plant diversity were negative (Figure 2 and Figure 3). This pattern can be explained by the ecological and spectral characteristics of sandy ecosystems. In the Hunshandak Sandland, areas with high exposed sand and low vegetation cover may contain patchy communities composed of stress-tolerant annuals, forbs, and psammophytic species, resulting in relatively high species richness at fine scales. In contrast, sites with higher vegetation cover or stronger greenness signals may be dominated by a few productive grasses or shrubs, reducing local evenness or richness. From a spectral perspective, high soil reflectance and variable soil moisture can alter the response of visible, near-infrared, and shortwave-infrared bands, causing moisture- and soil-sensitive indices to show inverse relationships with plot-level diversity [21,23,24,25]. Therefore, the negative correlations do not necessarily indicate that vegetation condition is poor where diversity is high; rather, they reflect the combined influence of sparse vegetation, bare soil background, water availability, and community dominance.

3.2. PLSR Model Performance for Different Diversity Indices

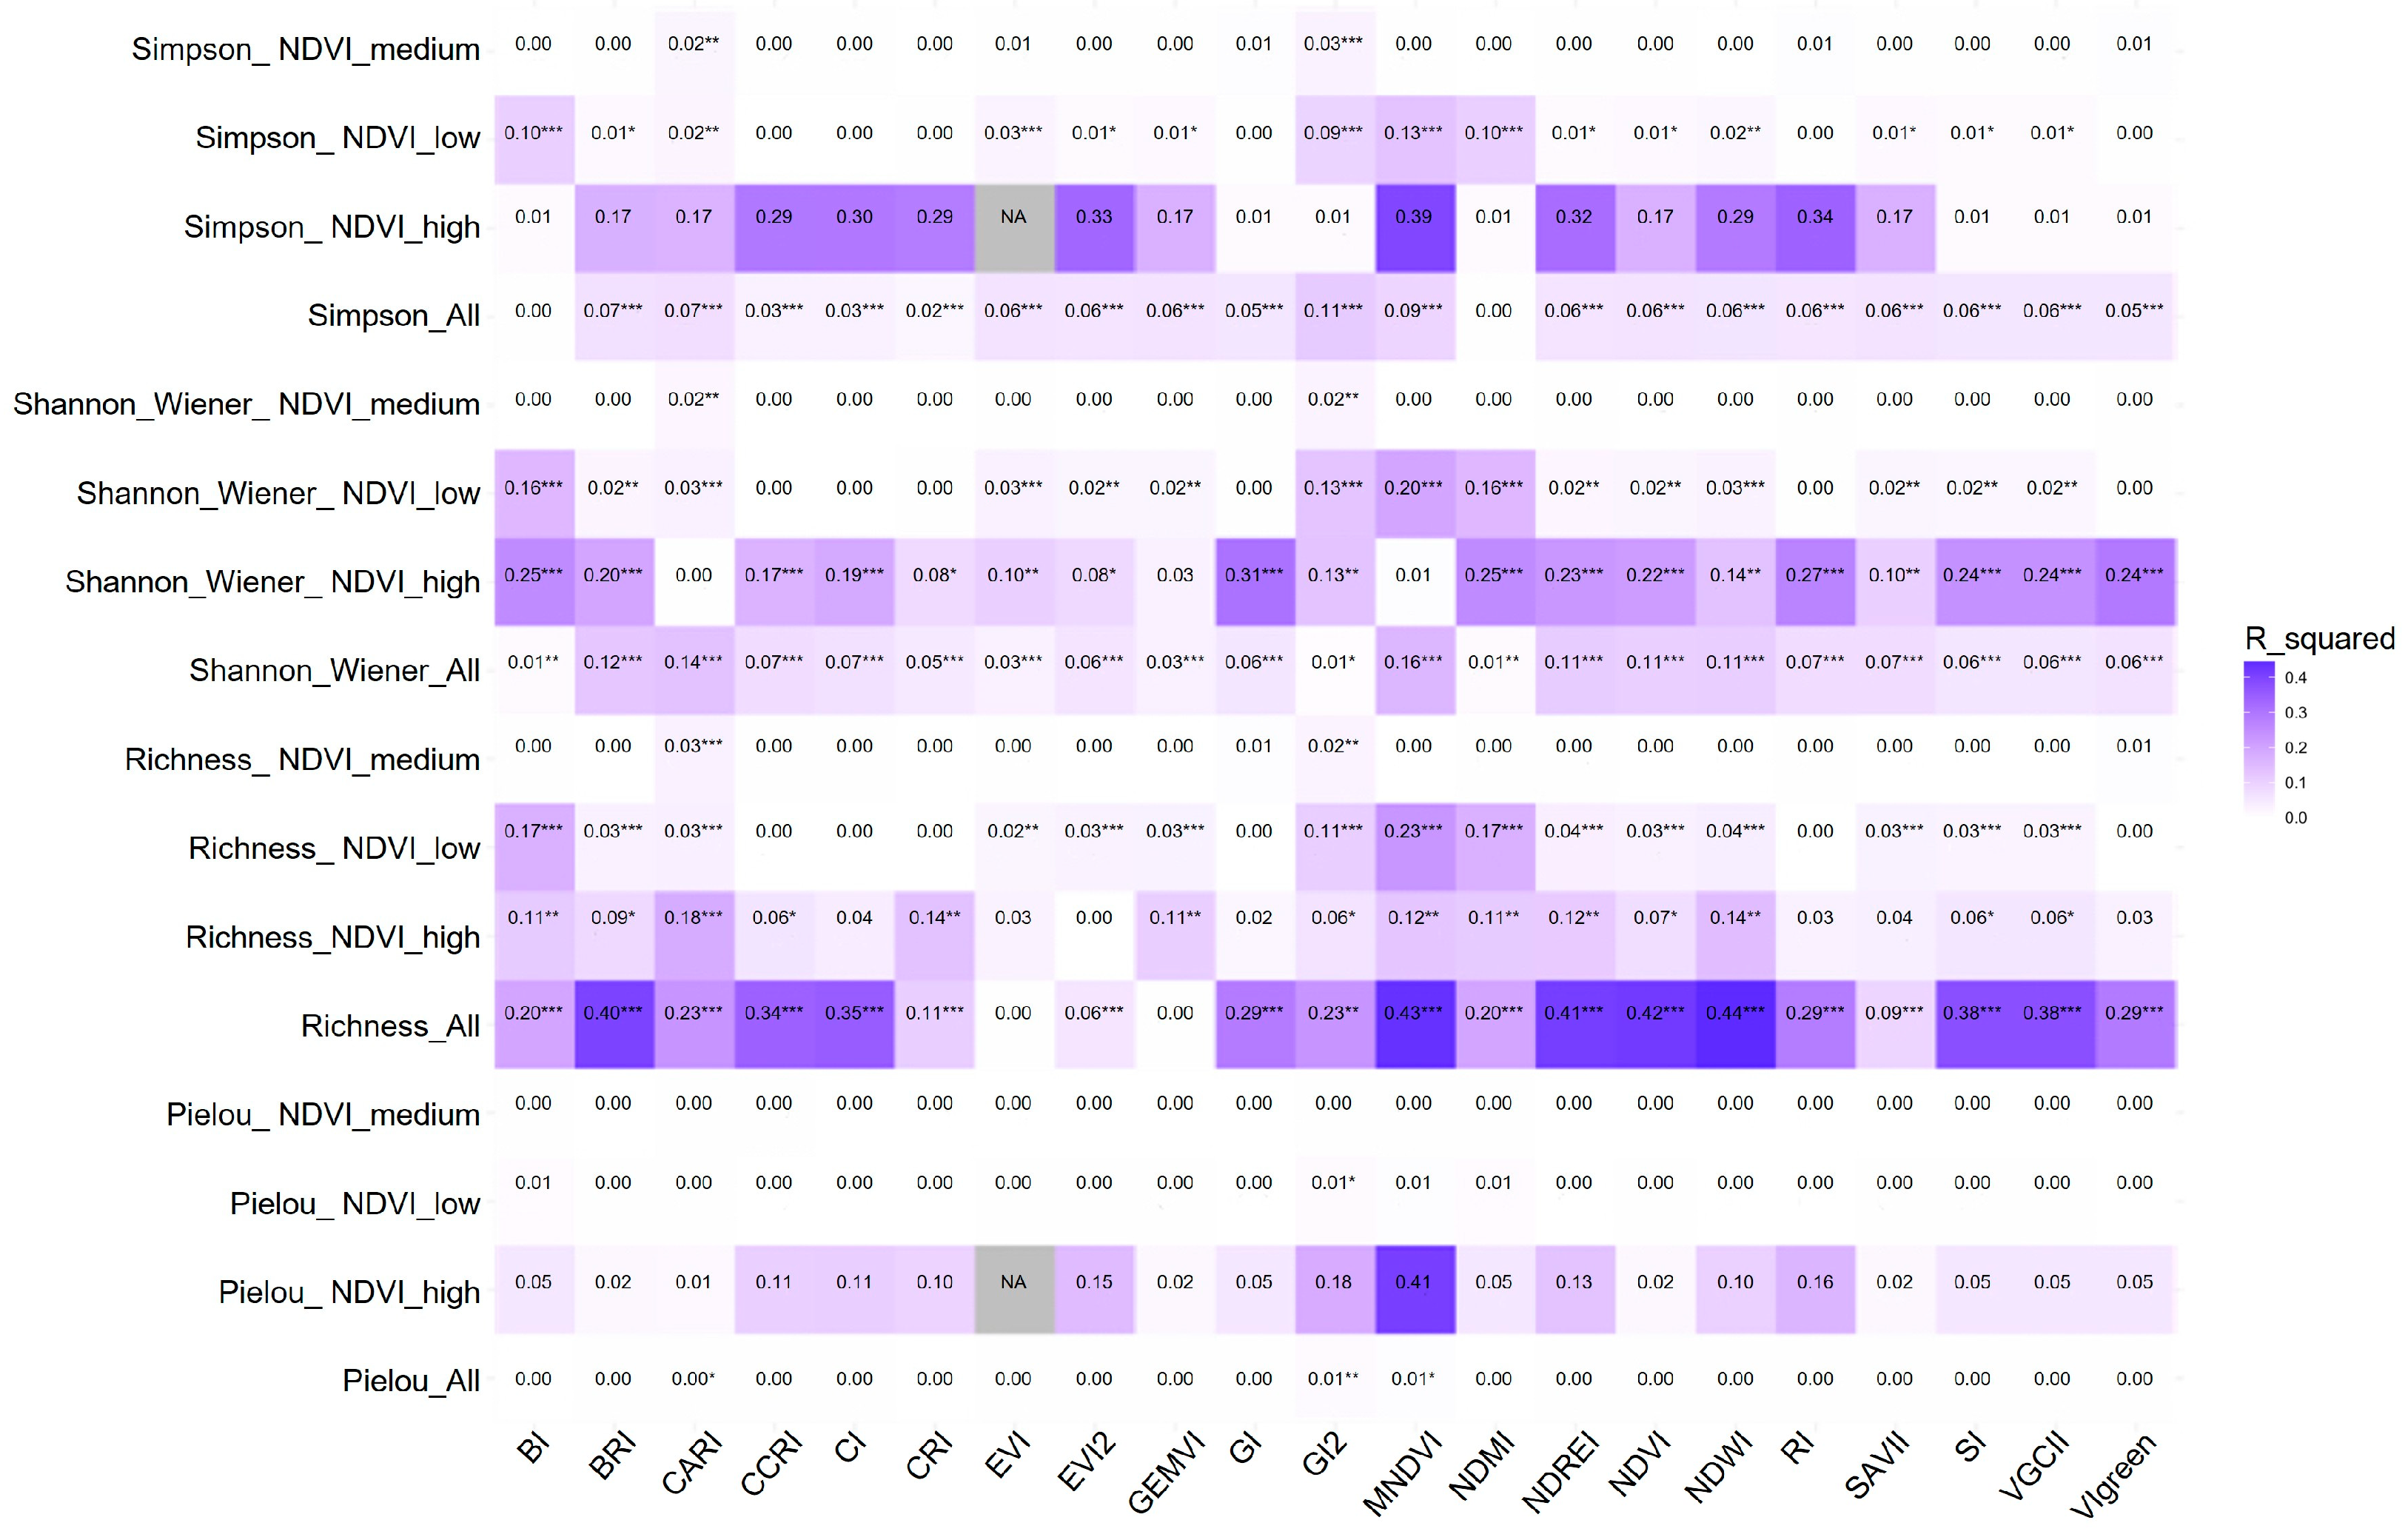
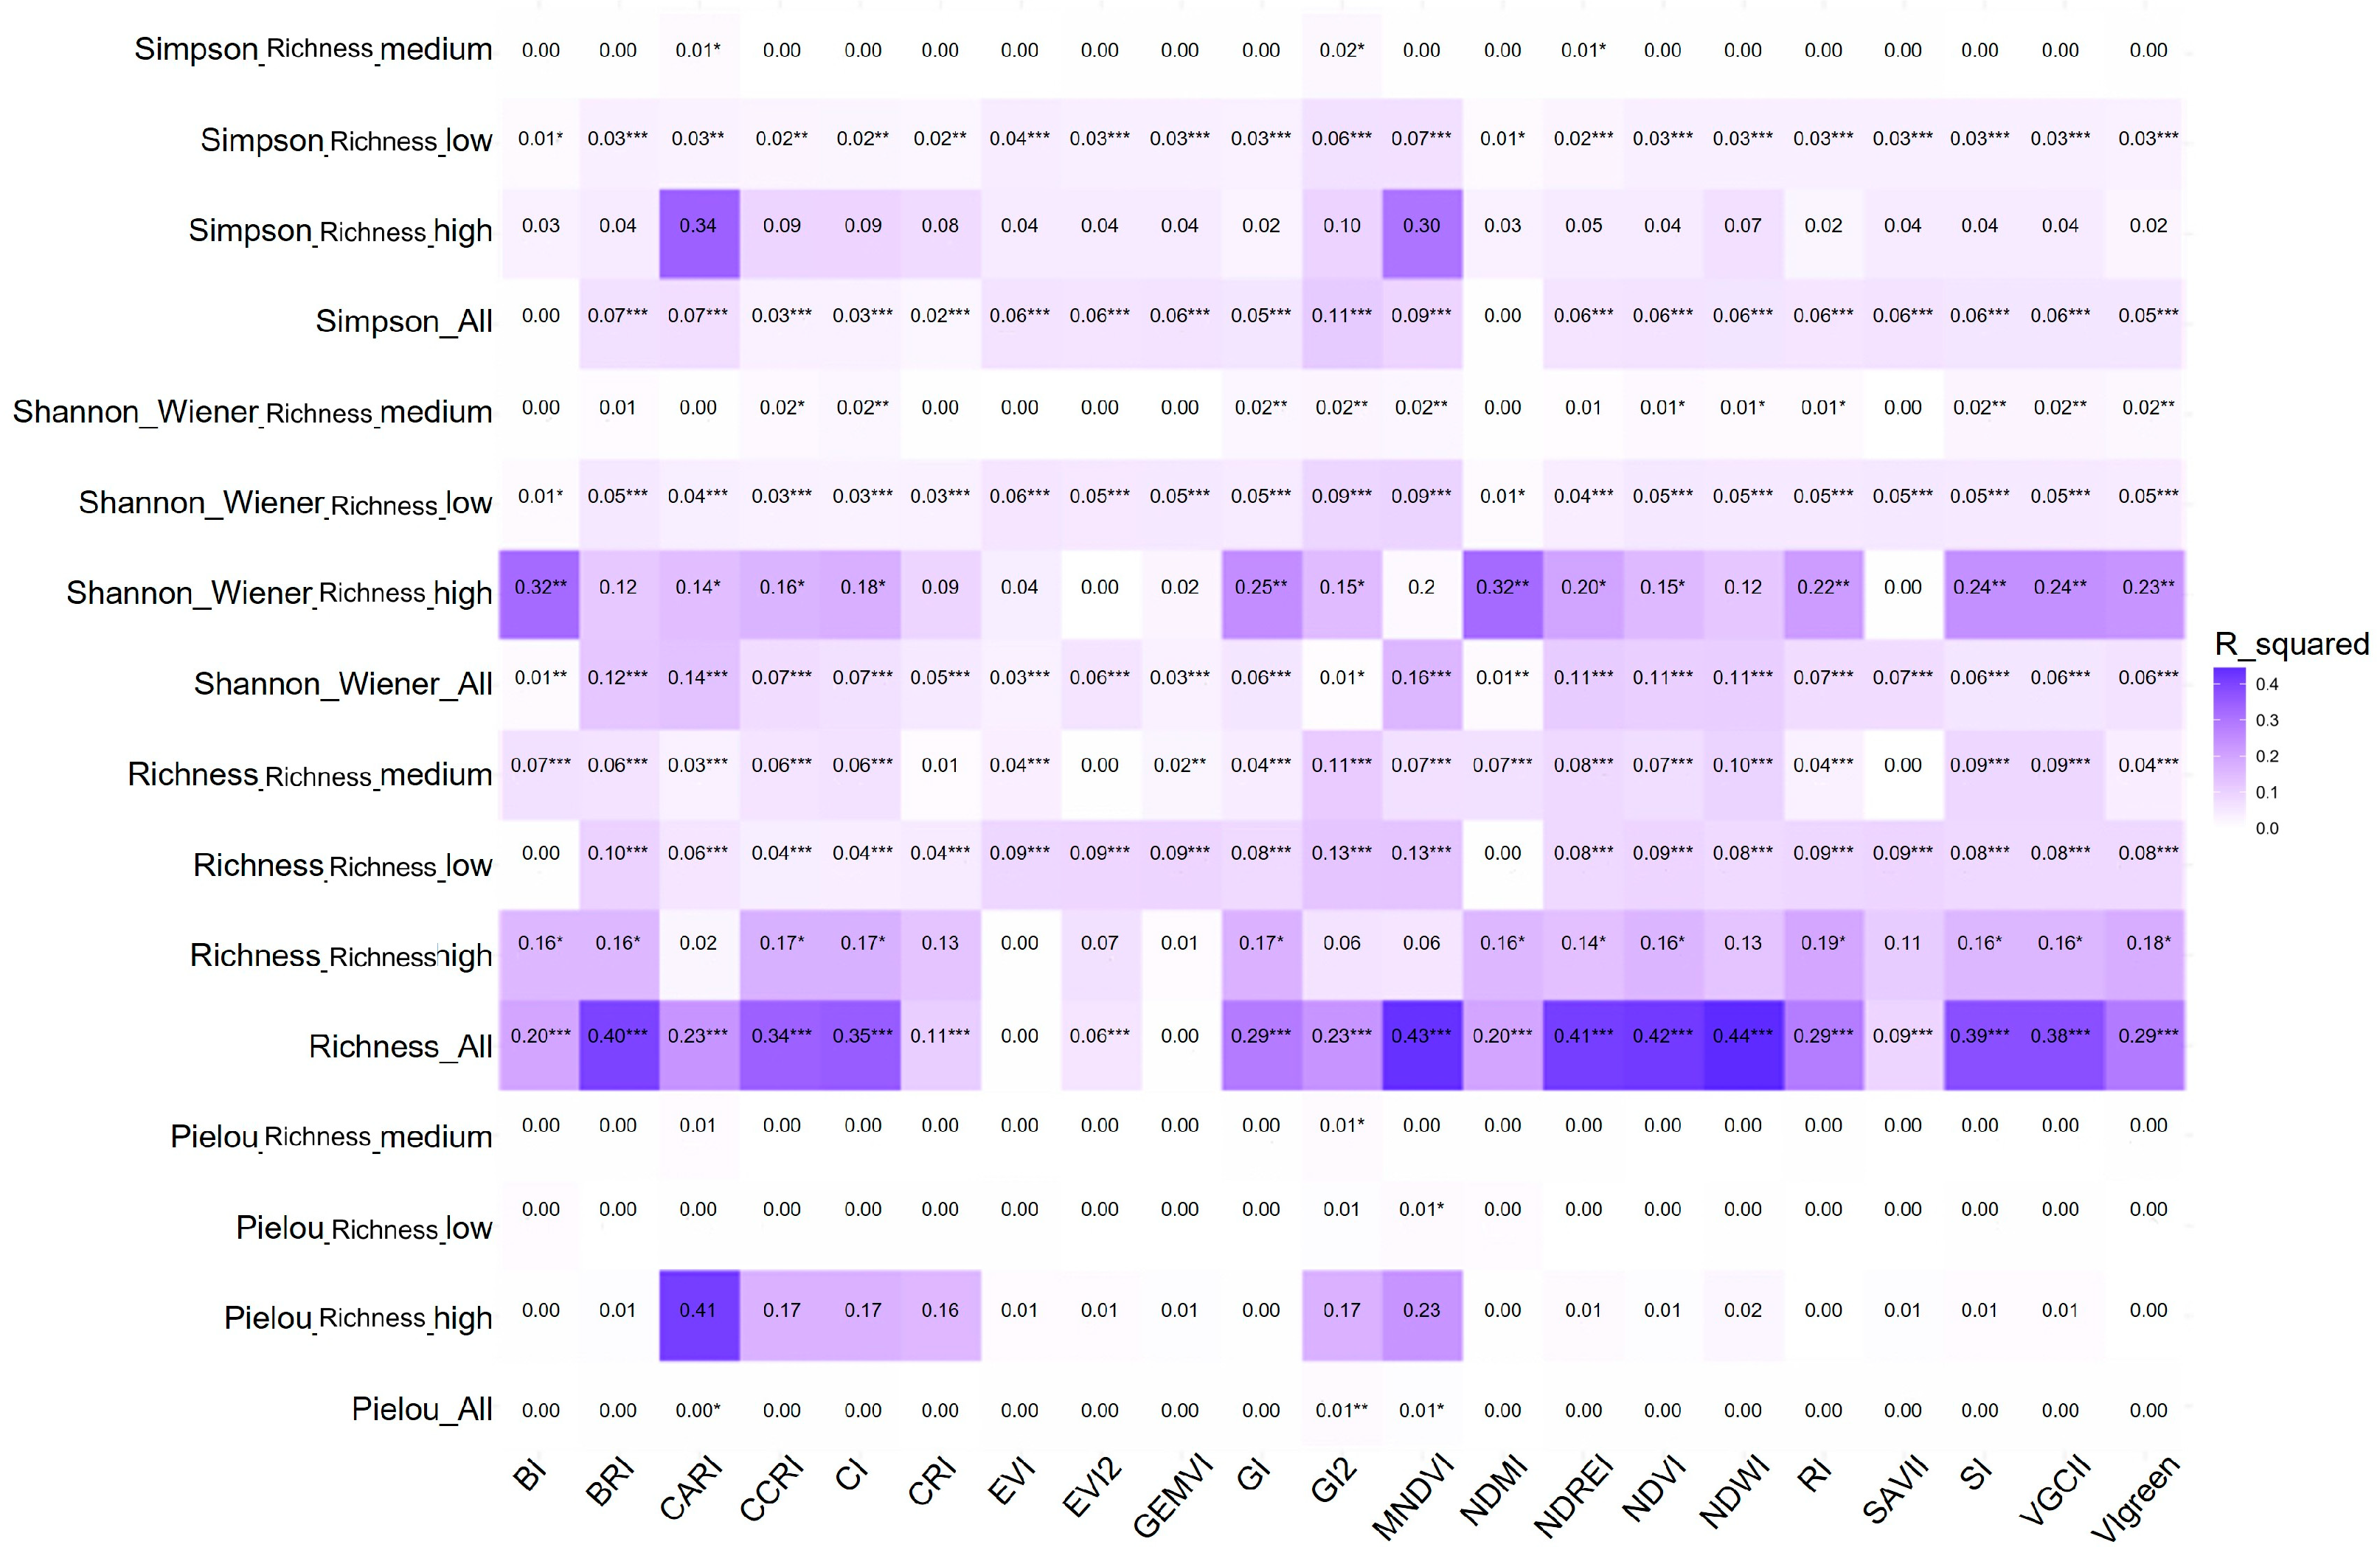
PLSR model performance differed markedly among diversity metrics. Species richness showed the highest predictive performance, whereas Shannon–Wiener, Simpson, and Pielou indices showed lower R2 values, generally below 0.20 in several PLSR models (Figure 4 and Figure 5). These results indicate that Sentinel-2 spectral indices were more effective in capturing variation in species number than in characterizing abundance-weighted diversity or evenness. The weaker performance for Shannon–Wiener, Simpson, and Pielou indices is ecologically reasonable because these metrics depend strongly on the relative abundance distribution of species within 1 m2 plots, which is difficult to detect using 10 m optical satellite pixels [25,33]. Therefore, these indices were retained in the analysis not as highly predictable mapping targets but as complementary ecological indicators that reveal the limits of spectral estimation for different dimensions of α-diversity.
For species richness, NDVI showed relatively high performance in some PLSR analyses. However, NDWI, MNDWI, BRI/BSI, and CARI were emphasized because they showed more stable relationships across vegetation gradients and were more consistent with the environmental constraints of sandy ecosystems [21,23,24,31]. NDVI is sensitive to photosynthetic greenness and vegetation cover, but in sparse sandy vegetation it is easily affected by exposed soil, litter, and mixed-pixel effects [23,25]. In contrast, moisture- and soil-background-sensitive indices better capture the gradients of soil water availability, bare sand exposure, and habitat heterogeneity that structure plant communities in this region. Thus, NDVI may be useful for predicting richness in specific conditions, whereas NDWI, MNDWI, BRI/BSI, and CARI provide more ecologically interpretable and transferable information in sandy ecosystems (Figure 5).

3.3. Importance of Spectral Indices

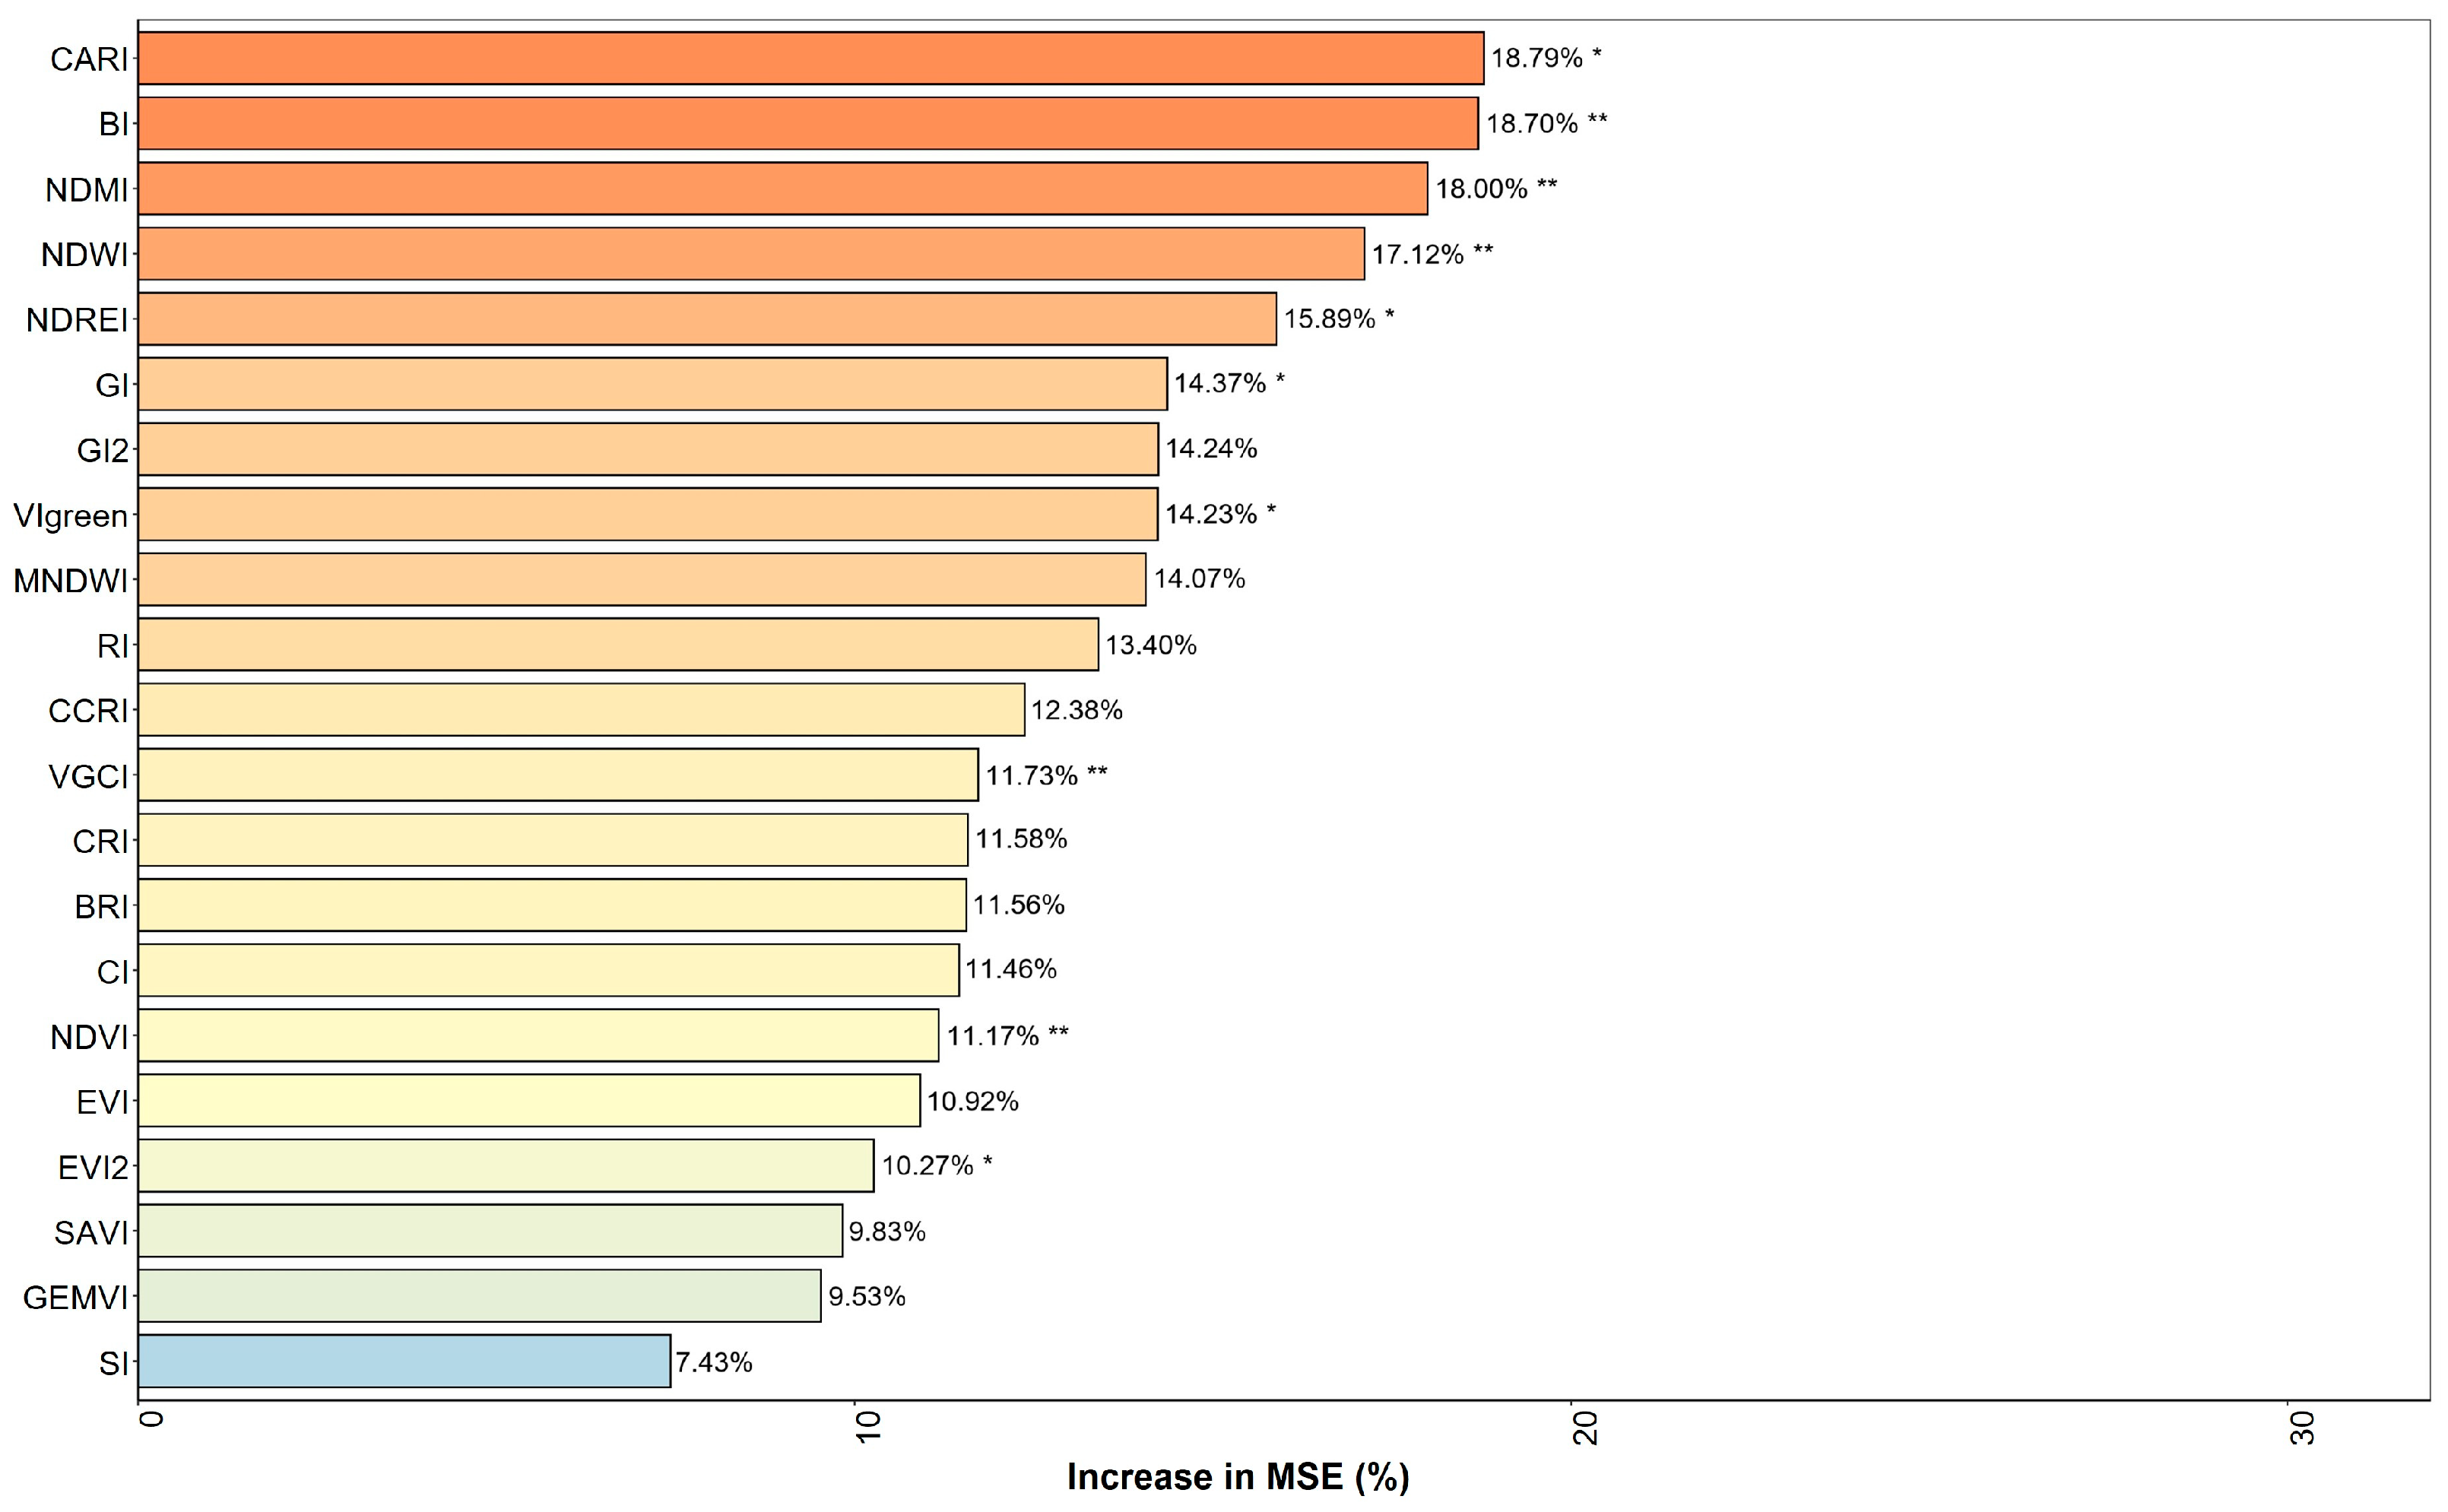
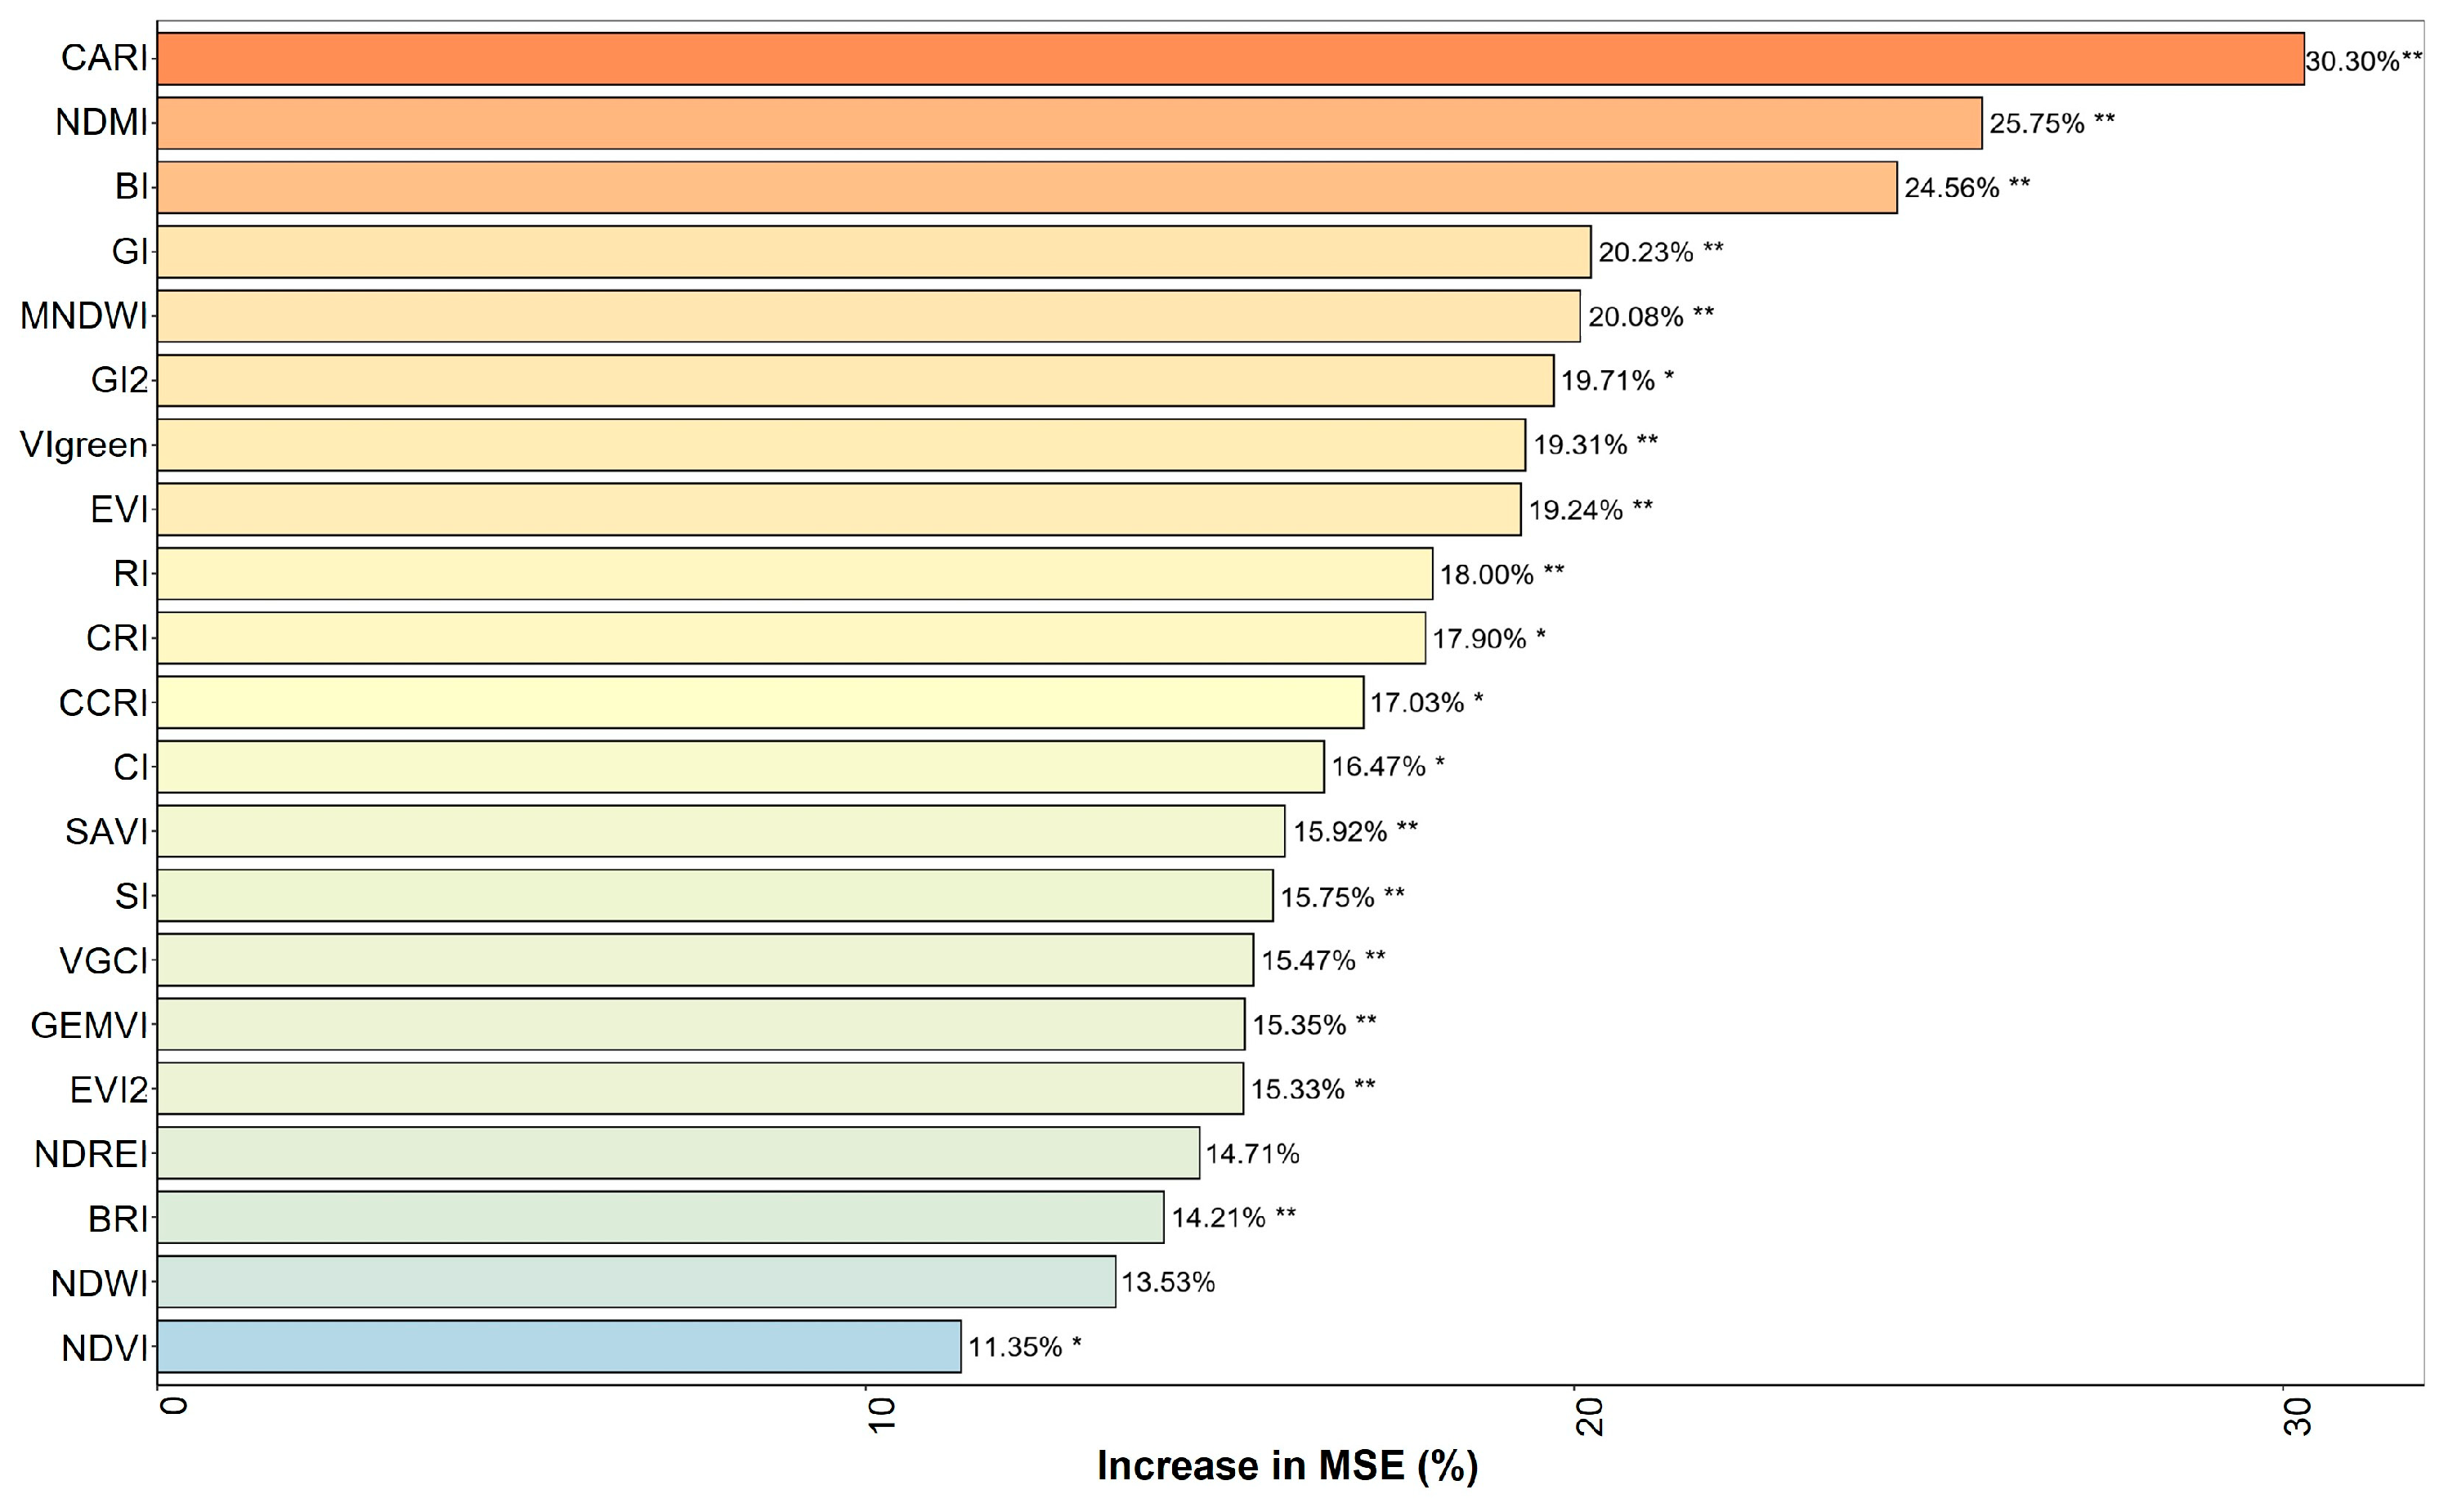
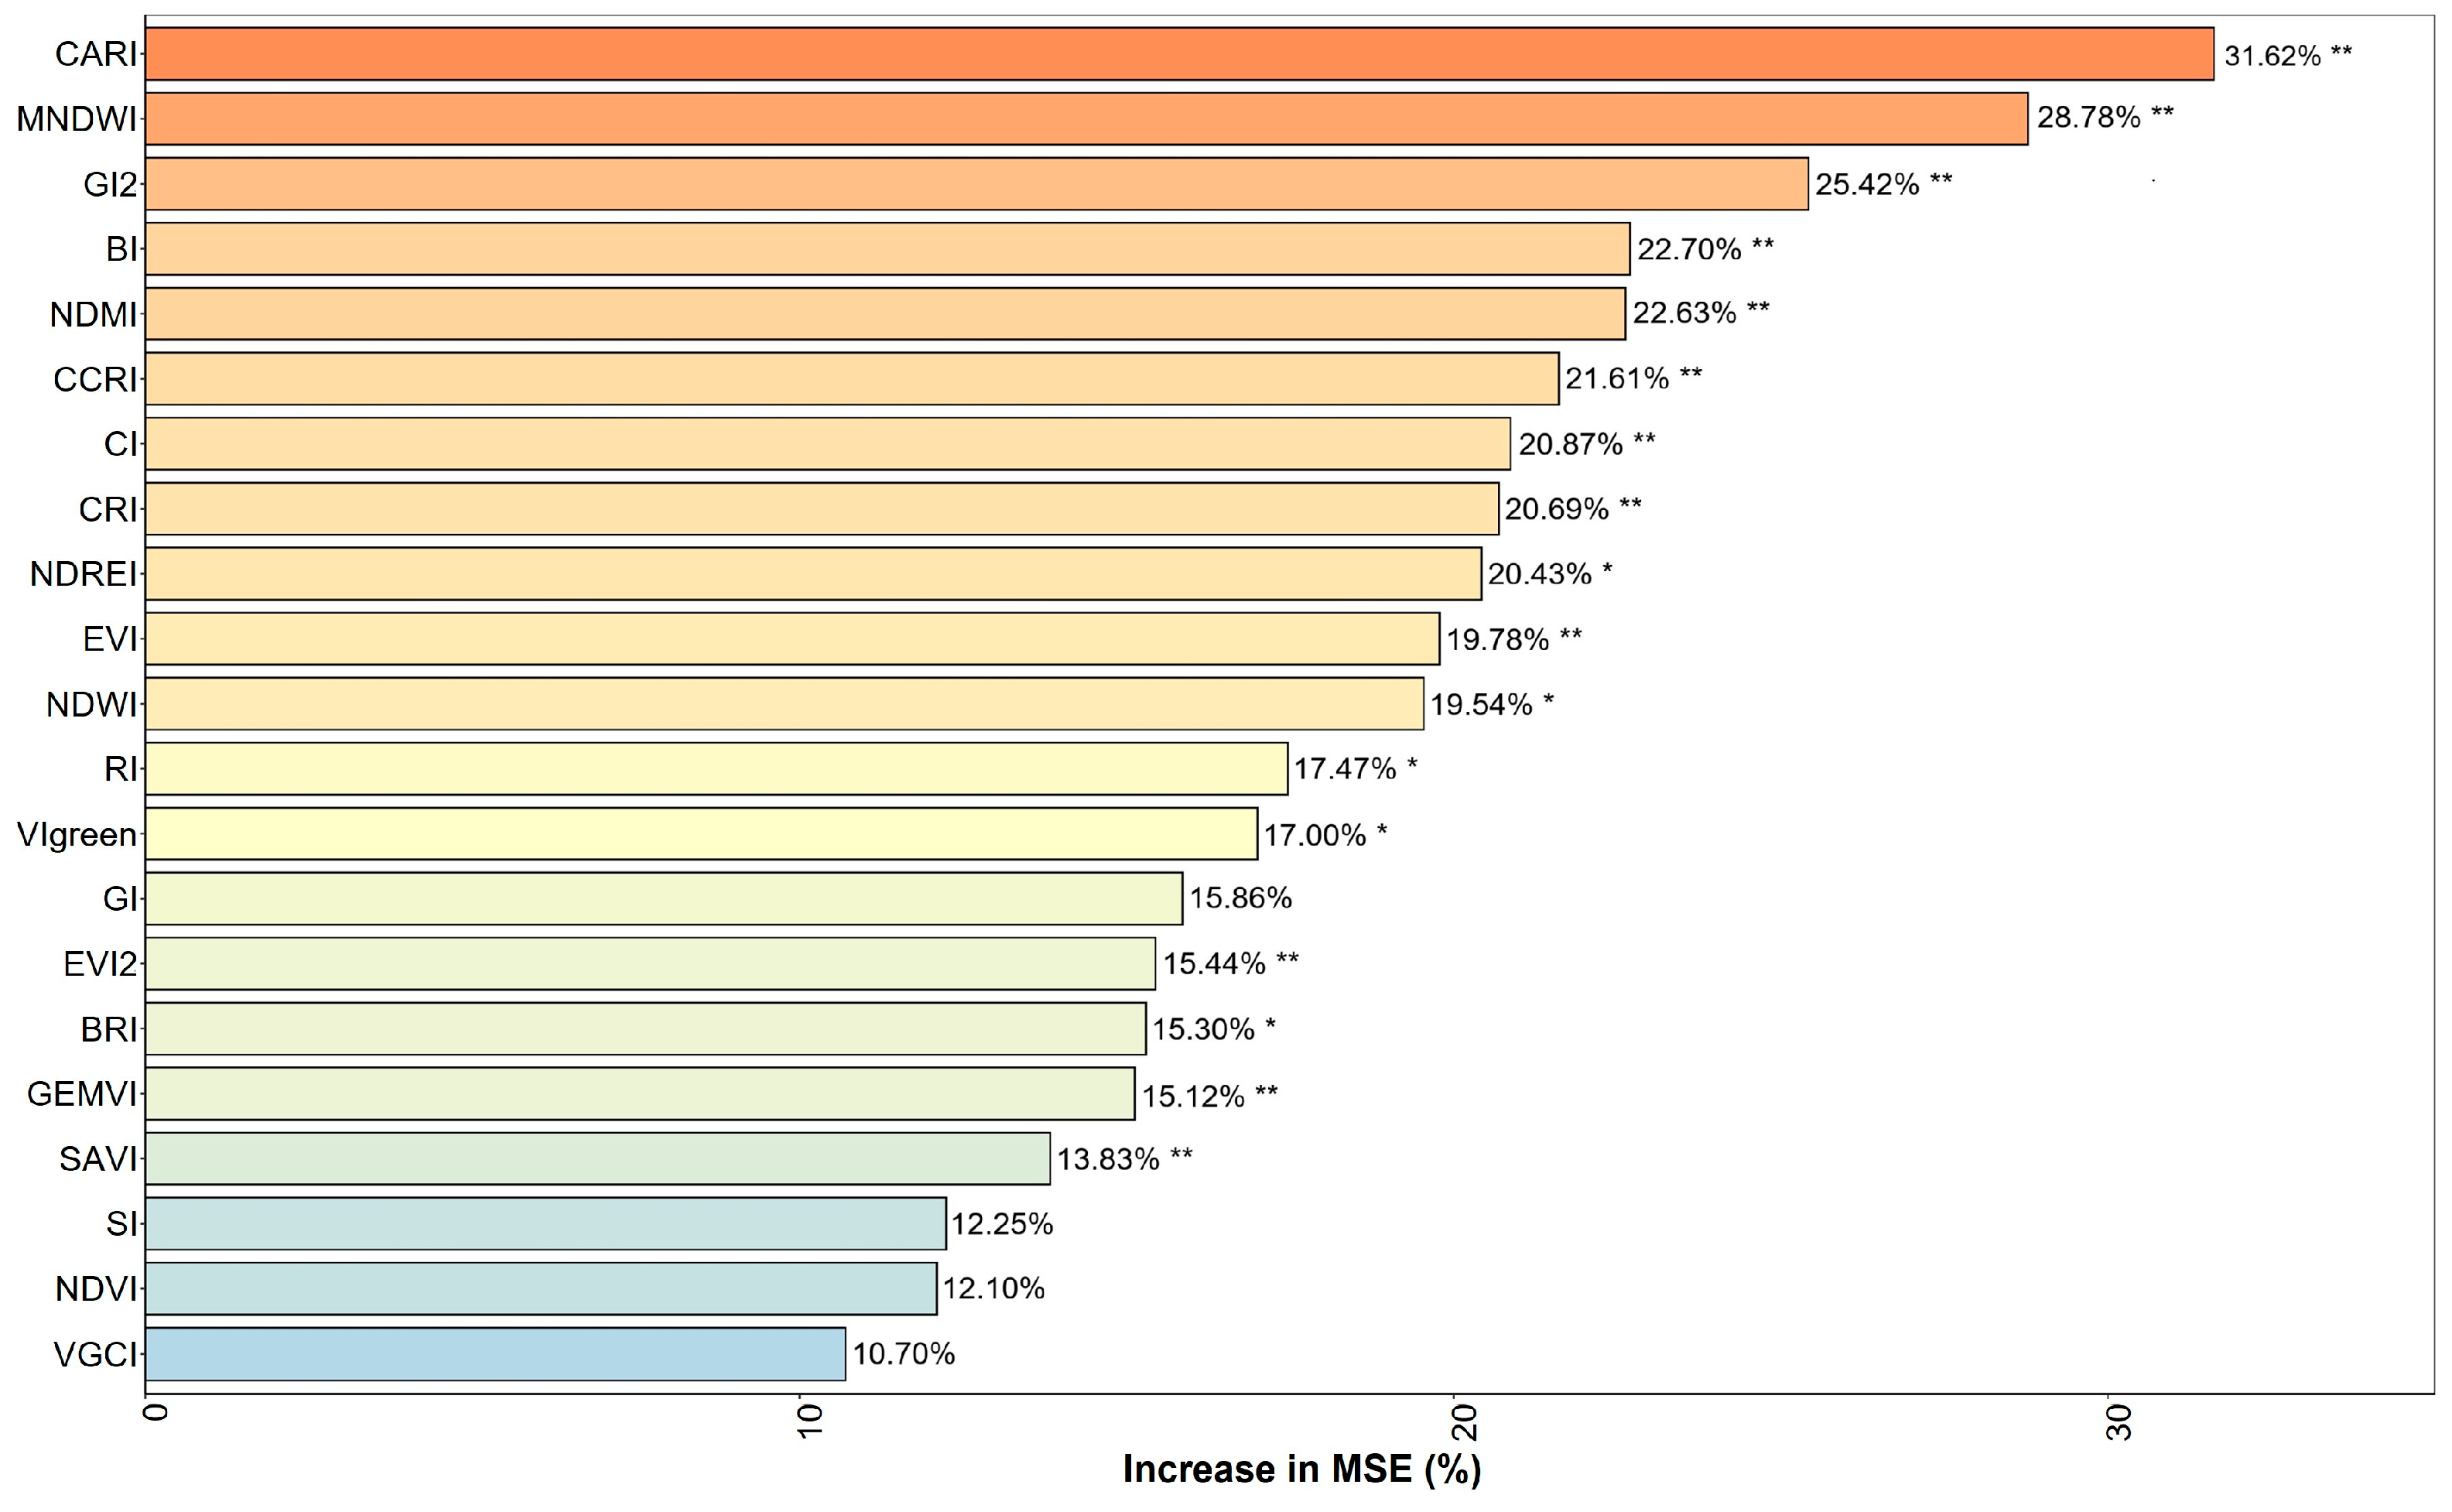
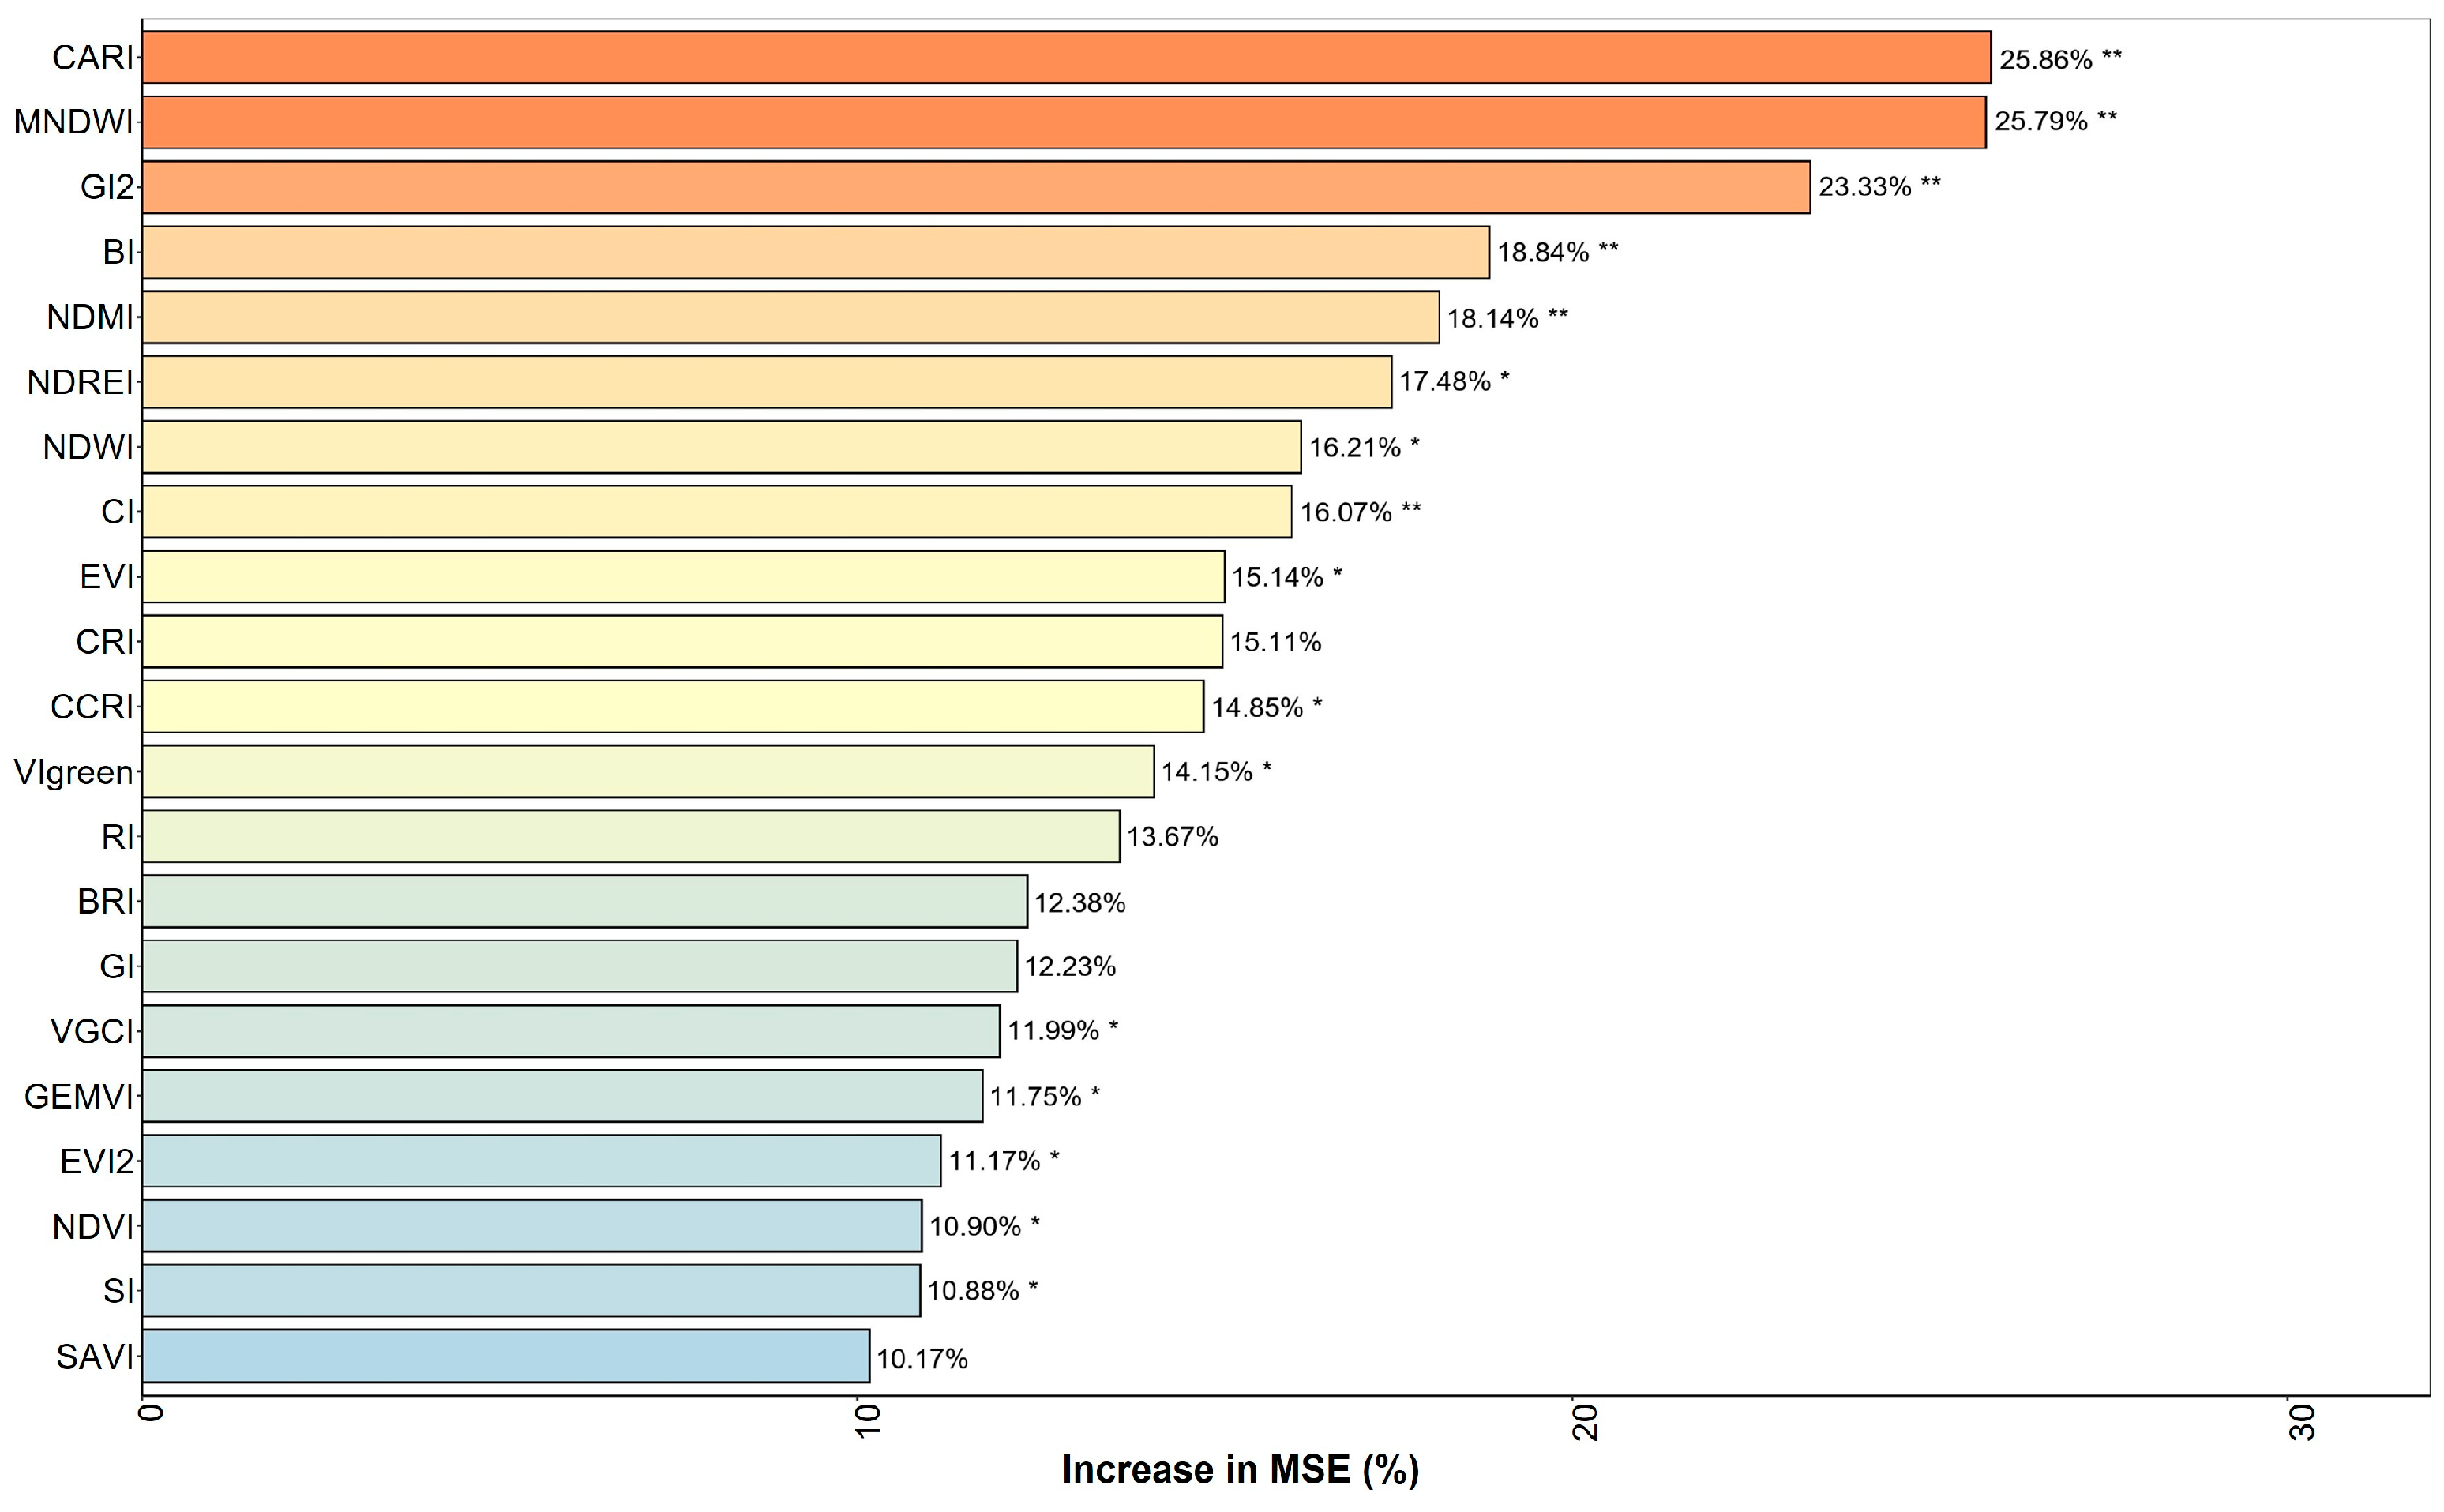
The RF importance analysis showed that CARI was one of the most important and stable indices across several model settings (Figure 6, Figure 7, Figure 8 and Figure 9). This result suggests that chlorophyll absorption and red-edge/visible spectral information contain useful signals related to vegetation composition and community structure. Therefore, CARI is an important complementary predictor. Nevertheless, NDWI and MNDWI were still highlighted because they represent moisture-related constraints that are especially relevant to sandy ecosystems and because they showed consistent associations with diversity across gradients [21,24,31] (Figure 6, Figure 7, Figure 8 and Figure 9).

4. Discussion

4.1. Ecological Interpretation of Spectral–Diversity Relationships in Sandy Ecosystems

The results showed that the relationships between plant α-diversity and Sentinel-2 spectral indices were generally weaker than those reported for some forests, dense grasslands, and highly productive ecosystems. This difference is expected because sandy ecosystems are characterized by sparse vegetation cover, strong soil background interference, high spatial heterogeneity, and small-scale variation in species composition [21,23,24,25]. In dense vegetation systems, canopy reflectance is more directly related to leaf area, chlorophyll content, and structural complexity, which can lead to high model accuracy [16,17,26]. In contrast, the spectral signal in sandy ecosystems is a mixed response of vegetation, bare sand, soil moisture, litter, and biological soil crusts. As a result, the spectral contribution of individual plant species or small community patches is diluted at the Sentinel-2 pixel scale [25,33].
Previous studies have shown that the performance of remote sensing-based biodiversity estimation is highly ecosystem-dependent [13,18,19,25,27]. For example, studies in prairie and grassland systems have demonstrated that soil correction and spectral dimension reduction can improve species richness estimation, but the strength of spectral–diversity relationships decreases when soil background and landscape heterogeneity increase [18,20,25]. In sandy grasslands, hyperspectral indices have been shown to be useful for estimating species richness at fine scales [21], but satellite-based estimation remains more difficult because broadband multispectral data cannot capture narrow absorption features and fine-scale species differences. Therefore, the moderate R2 observed in this study should not be interpreted as model failure, but rather as a realistic representation of the difficulty of estimating plot-level α-diversity in sparse and heterogeneous sandy landscapes.

4.2. Why Moisture- and Soil-Sensitive Indices Performed Well

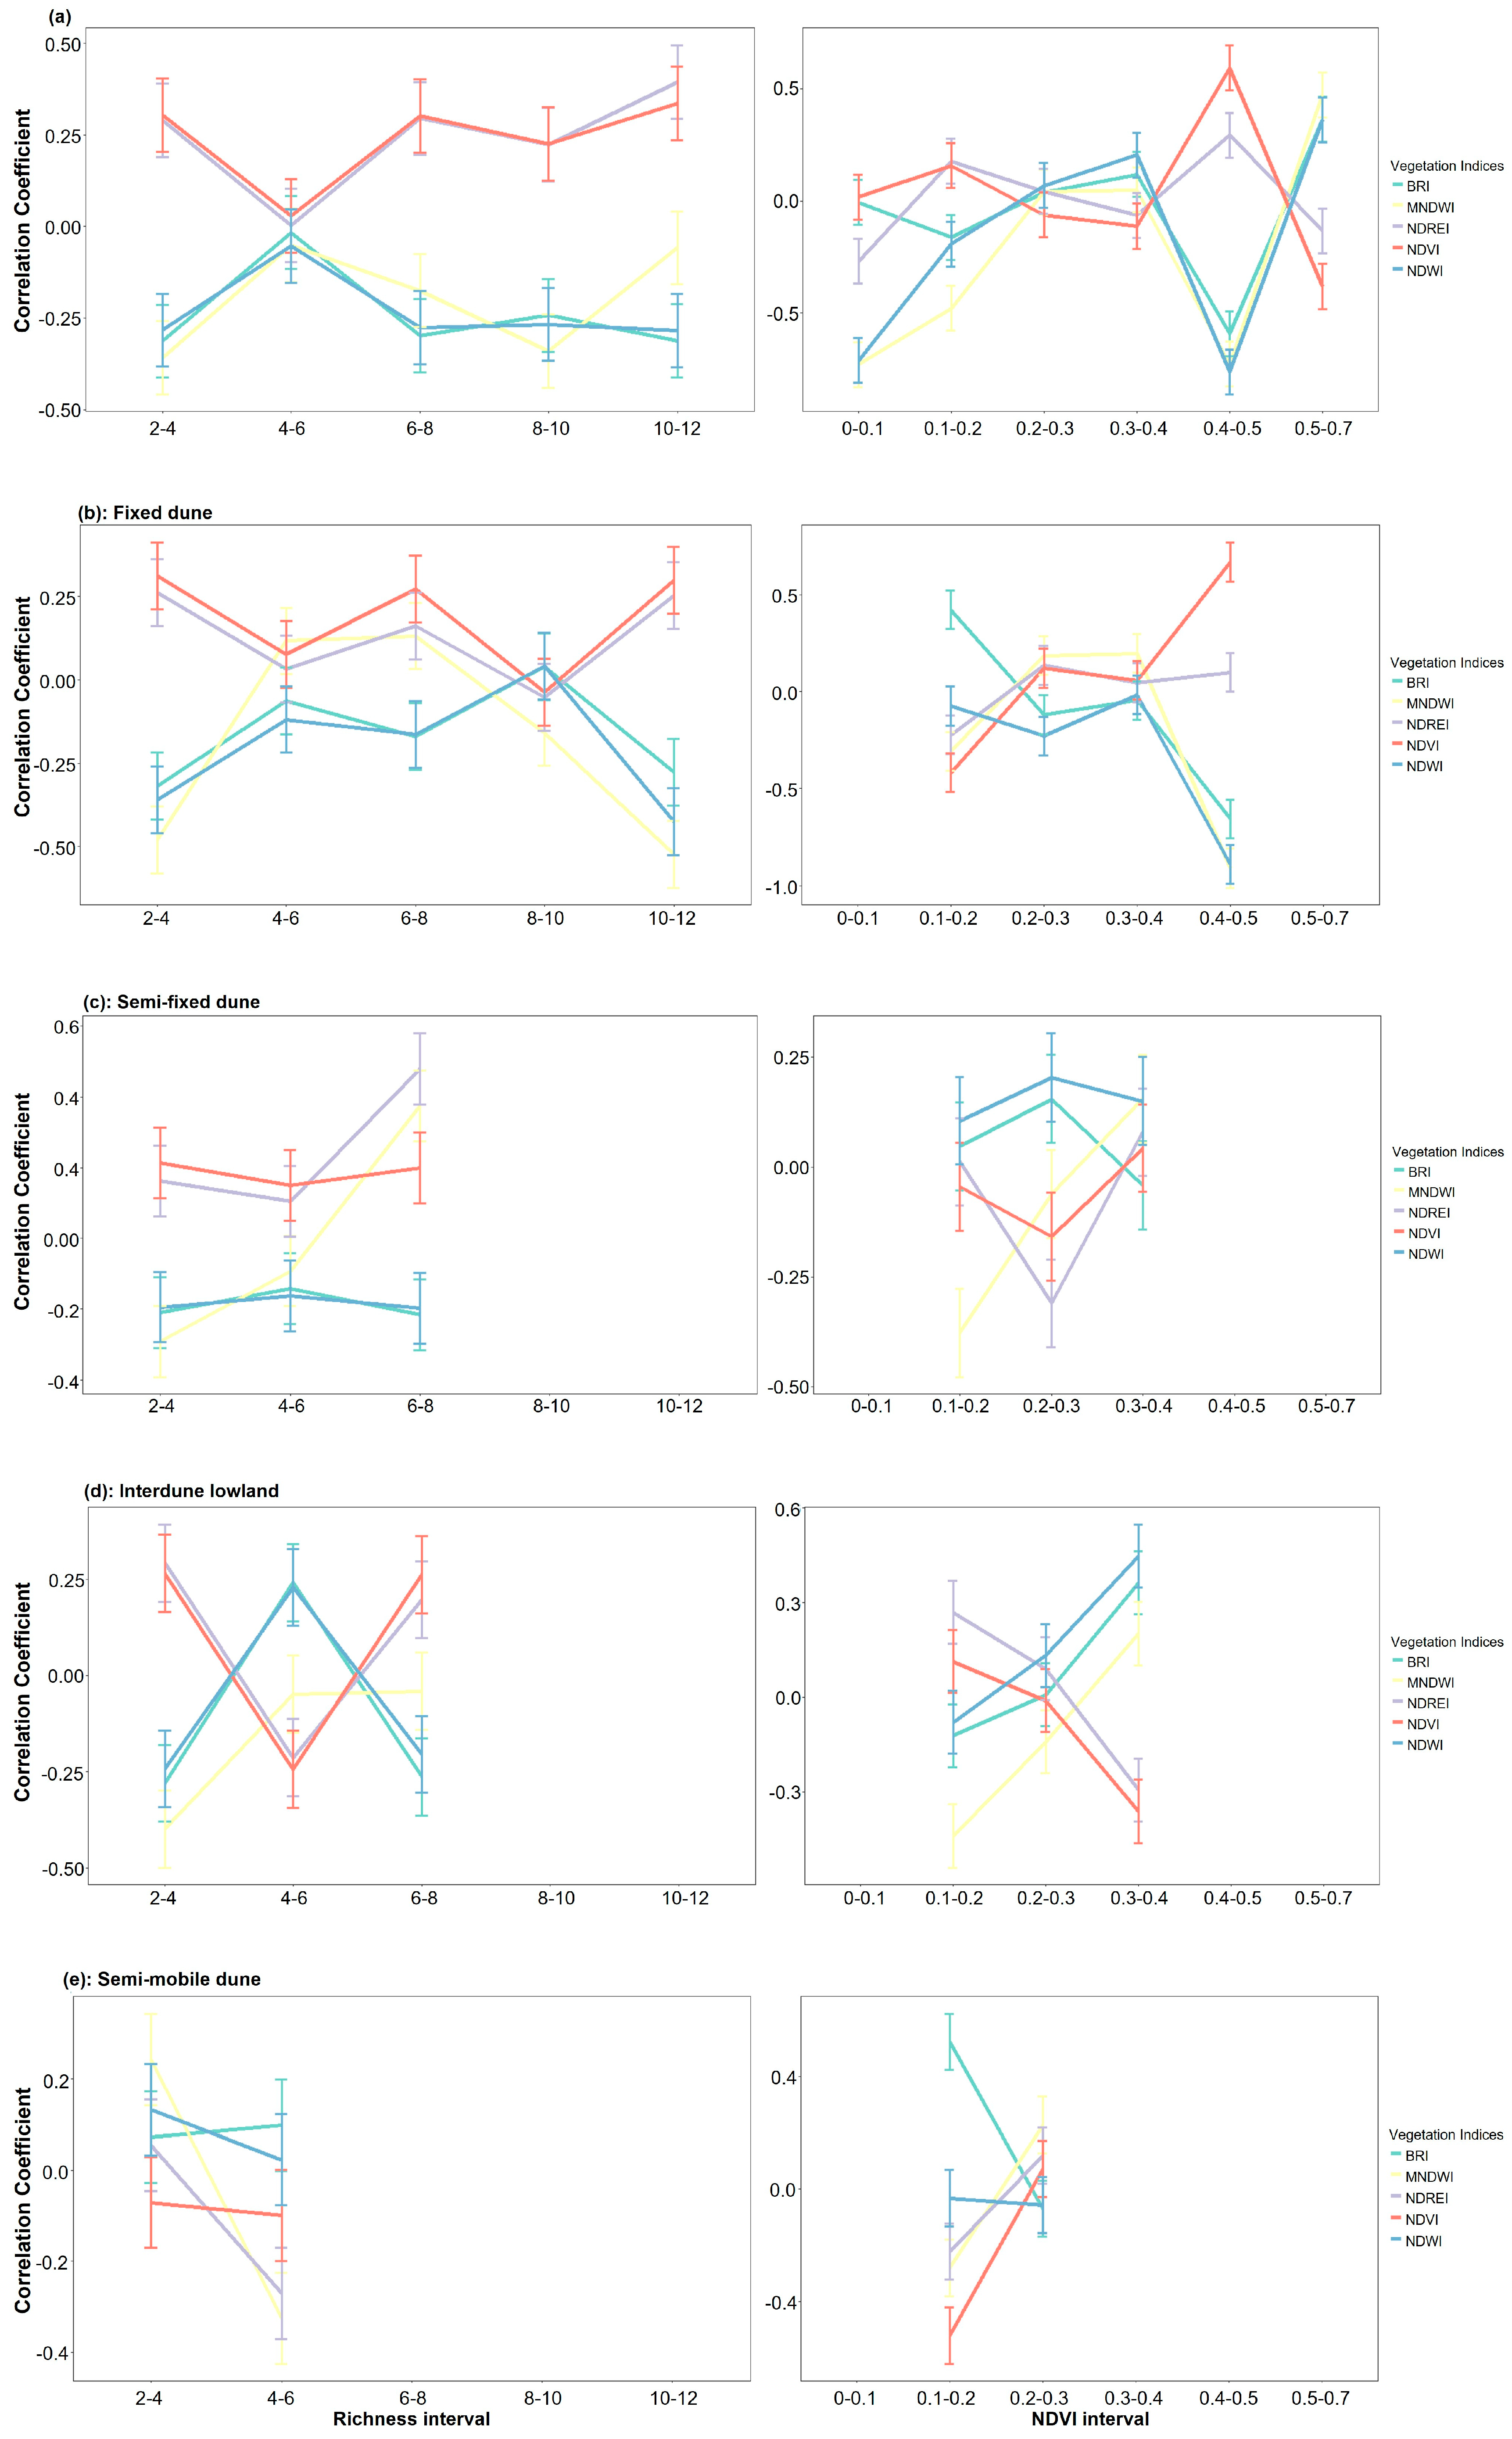
The relatively good performance of NDWI, MNDWI, BRI/BSI, NDMI, and CARI indicates that plant diversity in the Hunshandak Sandland is closely linked to moisture availability, bare soil exposure, and vegetation physiological condition [21,23,24,31]. Water availability is a dominant limiting factor in semi-arid sandy ecosystems and strongly influences seedling establishment, species coexistence, and community turnover [22,24]. Interdune lowlands and fixed sandy grasslands often have higher soil moisture and more stable plant communities, whereas mobile and semi-fixed dunes are more strongly affected by drought stress and wind erosion (Figure 10 and Figure 11). Therefore, indices that capture water content or soil background may indirectly represent the environmental gradients controlling plant diversity.
Although NDVI remains a useful indicator of vegetation greenness and productivity, it is not always the most robust diversity predictor in sandy ecosystems [23]. High NDVI values may indicate dominance by a few productive species rather than high species richness, while some low-cover habitats may support relatively diverse assemblages of drought-tolerant species (Figure 11). This explains why NDVI performed well in certain models but was not considered universally superior. The combination of NDWI, MNDWI, BRI/BSI, CARI, and NDVI provides a more complete representation of the vegetation–soil–moisture continuum in sandy ecosystems [21,23,24,31].

4.3. Interpretation of Moderate Model Accuracy

The predictive accuracy was highest for species richness and substantially lower for Shannon–Wiener, Simpson, and Pielou indices. This pattern is consistent with the ecological meaning of these indices. Species richness is a count of species presence and may be partly related to habitat heterogeneity and environmental gradients detectable by remote sensing. In contrast, Shannon–Wiener, Simpson, and Pielou indices depend on species abundance distribution and evenness within small plots. These abundance-based attributes are more sensitive to local competition, grazing, micro-topography, and stochastic recruitment, which are difficult to capture using Sentinel-2 spectral indices alone [13,25,33].
Therefore, we retained all four α-diversity indices because they represent different dimensions of plant diversity and provide a more complete evaluation of the applicability and limitations of Sentinel-2 data. However, we revised the interpretation to avoid overstating model performance. Species richness should be regarded as the most suitable diversity metric for Sentinel-2-based estimation in this sandy ecosystem, while Shannon–Wiener, Simpson, and Pielou indices should be interpreted cautiously and mainly used for comparative or exploratory assessment.

4.4. Comparison with Studies in Arid and Sandy Environments

The present results are broadly consistent with previous studies showing that biodiversity estimation in arid and semi-arid ecosystems is constrained by sparse vegetation, soil background effects, and water limitation [21,22,23,24,25]. Peng et al. [21] reported that hyperspectral indices could estimate plant species richness in sandy grasslands, but their study used fine-scale hyperspectral data that are more sensitive to narrow spectral features than Sentinel-2 multispectral imagery. Gholizadeh et al. [18] also showed that soil correction and dimensionality reduction improved α-diversity estimation in prairie ecosystems, emphasizing the importance of soil background effects. Studies using Sentinel-1/2 data, climate data, or multi-source satellite data have further shown that additional environmental and structural information can improve biodiversity estimation in complex landscapes [12,17,20,35].
Compared with studies reporting R2 values greater than 0.90 in tropical forests or alpine grasslands, the R2 values in this study were lower [17,20,26]. This discrepancy can be explained by several factors. First, dense forests and productive grasslands often have stronger canopy signals and greater vertical or horizontal structural variation detectable by remote sensing [16,26]. Second, some high-accuracy studies use hyperspectral, UAV, LiDAR, SAR, or multi-source data rather than broadband Sentinel-2 indices alone [12,17,35]. Third, plot size and satellite pixel size are often more compatible in those studies, reducing scale mismatch [33]. Fourth, tropical forests and alpine grasslands may show stronger relationships between spectral variability and species or functional diversity, whereas sandy ecosystems have discontinuous vegetation and strong soil interference [21,23,25]. Therefore, the moderate performance in this study reflects the ecological and technical difficulty of satellite-based diversity estimation in sandy landscapes.
The comparison with studies on snow or river-ice monitoring was removed because those applications differ substantially from the ecological context of this study. The revised comparison focuses on sandy, arid, semi-arid, prairie, and grassland environments, which are more relevant to the interpretation of our results [18,20,21,22,23,24].

4.5. Implications for Ecological Monitoring and Restoration

The results have practical implications for biodiversity monitoring and ecological restoration in sandy ecosystems. First, Sentinel-2 data can provide a cost-effective tool for regional screening of potential diversity hotspots and restoration priority areas, especially when combined with field validation [13,30,32]. Second, moisture- and soil-sensitive indices can help identify environmental gradients associated with plant community variation, which is important for assessing dune stabilization, vegetation recovery, and habitat quality [21,23,24,31]. Third, the finding that species richness is more predictable than evenness-based diversity suggests that remote sensing products should be used as complementary indicators rather than replacements for field surveys [13,33].
For restoration management, the combined use of NDWI, MNDWI, BRI/BSI, CARI, and NDVI may help evaluate whether vegetation recovery reflects only increasing cover or also increasing habitat heterogeneity and species richness. This distinction is important because restoration projects in sandy ecosystems often aim not only to increase vegetation cover but also to improve community stability, biodiversity, and resistance to wind erosion. Integrating multi-index remote sensing features enables proactive identification of latent degradation risks in advance of vegetation diversity decreasing. It also supports targeted restoration layout and zoning optimization, helping balance sand fixation, biodiversity conservation and sustainable land use under ongoing climate aridification.

4.6. Limitations and Prospects

Although this study used an extensive field dataset and a systematic analytical framework, several limitations should be acknowledged.
First, there was an unavoidable spatial scale mismatch between field plots and Sentinel-2 pixels. Each field plot covered 1 m × 1 m, whereas one Sentinel-2 10 m pixel represents 100 m2. In heterogeneous sandy ecosystems, a satellite pixel may include a mixture of plant patches, bare sand, litter, biological soil crusts, and microhabitats. Therefore, the spectral value extracted for a plot may not fully represent the local species composition recorded in the 1 m2 quadrat. This mismatch is likely an important source of uncertainty and may partly explain the moderate model performance, especially for Shannon–Wiener, Simpson, and Pielou indices [33]. Future studies should consider larger field plots, nested sampling designs, UAV imagery, or spatial aggregation methods that better match satellite pixel size.
Second, although the field dataset covered eight years, both field surveys and satellite composites were restricted to July. July corresponds to the peak growing season and is suitable for species identification in the study area, but a single-month snapshot cannot capture full seasonal phenological dynamics. Many species differ in emergence, flowering, senescence, and water-use strategies, and these phenological differences may provide important information for species discrimination. Future work should incorporate multi-season Sentinel-2 time series and phenological metrics to improve the estimation of diversity [35].
Third, the current models used only optical spectral indices. Plant diversity in semi-arid sandy ecosystems is strongly controlled by soil texture, soil moisture, topography, precipitation, grazing intensity, and human disturbance. The exclusion of these environmental covariates limits the explanatory power of the models [20,24,35]. Integrating soil maps, digital elevation models, climate data, grazing information, and restoration history may improve both prediction accuracy and ecological interpretation.
Fourth, the study did not include three-dimensional structural information. Active remote sensing data such as LiDAR and synthetic aperture radar (SAR) can provide information on vegetation height, roughness, biomass structure, and surface moisture, which may be highly relevant to biodiversity estimation. Combining Sentinel-2 with LiDAR, SAR, UAV imagery, and high-resolution hyperspectral data could better capture the structural and functional complexity of sandy plant communities [12,35].
Fifth, the analytical framework was based on established spectral indices and conventional statistical or machine-learning models. Although PLSR and RF are robust and interpretable, they may not fully capture nonlinear and scale-dependent relationships between spectral features and biodiversity [36,37]. Future studies could test convolutional neural networks, gradient boosting, spatial cross-validation, and hybrid ecological–remote sensing models. However, advanced models should be accompanied by sufficient field data, independent validation, and ecological interpretability to avoid overfitting [33].
Finally, the present study focused on α-diversity and did not explicitly evaluate β-diversity or species composition turnover. Because sandy ecosystems are highly heterogeneous, future work should combine α-diversity, β-diversity, functional traits, and spectral heterogeneity to better understand biodiversity patterns across dune landscapes [13,14,15,16,17,18,19,20,21,22,23,24,25,26,27,28,29,30,31,32].

5. Conclusions

This study evaluated the potential of Sentinel-2-derived spectral indices for estimating plant α-diversity in the Hunshandak Sandland based on 888 field plots collected during 2017–2024. The results showed that spectral indices could capture part of the spatial variation in plant diversity, but model performance differed among diversity metrics. Species richness was the most predictable index, whereas Shannon–Wiener, Simpson, and Pielou indices showed weaker predictive performance and should be interpreted cautiously. Moisture- and soil-background-sensitive indices, especially NDWI, MNDWI, BRI/BSI, and CARI, provided relatively stable information for diversity estimation in sandy ecosystems. NDVI also performed well in some models, but its interpretation was more dependent on vegetation cover and soil background conditions.
Overall, the performance of Sentinel-2 spectral indices was moderate rather than exceptional. The results indicate that Sentinel-2 data are useful for regional-scale screening and comparative assessment of plant diversity patterns, particularly species richness, but they cannot replace field surveys for detailed community-level biodiversity assessment. Future studies should reduce spatial scale mismatch, incorporate seasonal phenology, integrate environmental covariates, and combine optical data with LiDAR, SAR, UAV, or hyperspectral observations to improve the accuracy and ecological interpretability of plant diversity estimation in sandy ecosystems. These findings suggest that Sentinel-2-based species richness estimates can support rapid, large-scale diversity screening and long-term monitoring, provided they are periodically validated with field data. For land management in sandy ecosystems, moisture-adjusted indices such as NDWI and MNDWI may help identify conservation priority zones, assess restoration outcomes, and guide adaptive management.

Author Contributions

Conceptualization, Y.P.; formal analysis, K.X.; investigation, Z.L. and X.C.; writing—original draft preparation, K.X.; writing—review and editing, Y.P.; visualization, Z.L. and X.C.; supervision, Y.P.; project administration, Y.P.; funding acquisition, Y.P. All authors have read and agreed to the published version of the manuscript.

Funding

This research was funded by the National Natural Science Foundation of China (32271555).

Institutional Review Board Statement

Not applicable.

Data Availability Statement

The original contributions presented in this study are included in the article. Further inquiries can be directed to the corresponding author.

Acknowledgments

We would like to express our heartfelt gratitude to the anonymous reviewers for their constructive and valuable comments and suggestions.

Conflicts of Interest

The authors declare no conflicts of interest.

References

  1. Lande, R. Statistics and partitioning of species diversity, and similarity among multiple communities. Oikos 1996, 76, 5–13. [Google Scholar] [CrossRef]
  2. Whittaker, R.H. Evolution and measurement of species diversity. TAXON 1972, 21, 213–251. [Google Scholar] [CrossRef]
  3. Colwell, R.K. Biodiversity: Concepts, Patterns, and Measurement. Princet. Guide Ecol. 2009, 663, 257–263. [Google Scholar]
  4. Simpson, E.H. Measurement of diversity. Nature 1949, 163, 688. [Google Scholar] [CrossRef]
  5. Shannon, C.E. A mathematical theory of communication. Bell Syst. Tech. J. 1948, 27, 379–423+623–656. [Google Scholar] [CrossRef]
  6. Pielou, E.C. The measurement of diversity in different types of biological collections. J. Theor. Biol. 1966, 13, 131–144. [Google Scholar] [CrossRef]
  7. Phiri, D.; Simwanda, M.; Salekin, S.; Nyirenda, V.R.; Murayama, Y.; Ranagalage, M. Sentinel-2 data for land cover/use mapping: A review. Remote Sens. 2020, 12, 2291. [Google Scholar] [CrossRef]
  8. Karnieli, A.; Qin, Z.; Wu, B.; Panov, N.; Yan, F. Spatio-temporal dynamics of land-use and land-cover in the Mu Us sandy land, China, using the change vector analysis technique. Remote Sens. 2014, 6, 9316–9339. [Google Scholar] [CrossRef]
  9. Schimel, D.; Townsend, P.A.; Pavlick, R. Prospects and pitfalls for spectroscopic remote sensing of biodiversity at the global scale. In Remote Sensing of Plant Biodiversity; Springer: Berlin/Heidelberg, Germany, 2020; pp. 503–518. [Google Scholar]
  10. Kreri, S.; Farhi, N.; Bennia, A.; Derdour, A.; Kébir, L.W.; Alharbi, K.M.; Bojer, A.K.; Arafat, A.A. Remote sensing assessment of vegetation and moisture dynamics in semi-arid regions. Sci. Rep. 2026, 16, 6549. [Google Scholar] [CrossRef] [PubMed]
  11. Meng, X.; Gao, X.; Li, S.; Lei, J. Spatial and temporal characteristics of vegetation NDVI changes and the driving forces in Mongolia during 1982–2015. Remote Sens. 2020, 12, 603. [Google Scholar] [CrossRef]
  12. Yang, Q.; Wang, L.; Huang, J.; Lu, L.; Li, Y.; Du, Y.; Ling, F. Mapping plant diversity based on combined SENTINEL-1/2 data—Opportunities for subtropical mountainous forests. Remote Sens. 2022, 14, 492. [Google Scholar] [CrossRef]
  13. Rocchini, D.; Boyd, D.S.; Féret, J.B.; Foody, G.M.; He, K.S.; Lausch, A.; Nagendra, H.; Wegmann, M.; Pettorelli, N. Satellite remote sensing to monitor species diversity: Potential and pitfalls. Remote Sens. Ecol. Conserv. 2016, 2, 25–36. [Google Scholar] [CrossRef]
  14. Schneider, F.D.; Morsdorf, F.; Schmid, B.; Petchey, O.L.; Hueni, A.; Schimel, D.S.; Schaepman, M.E. Mapping functional diversity from remotely sensed morphological and physiological forest traits. Nat. Commun. 2017, 8, 1441. [Google Scholar] [CrossRef]
  15. Zheng, Z.; Zeng, Y.; Schneider, F.D.; Zhao, Y.; Zhao, D.; Schmid, B.; Schaepman, M.E.; Morsdorf, F. Mapping functional diversity using individual tree-based morphological and physiological traits in a subtropical forest. Remote Sens. Environ. 2021, 252, 112170. [Google Scholar] [CrossRef]
  16. Meng, J.; Li, S.; Wang, W.; Liu, Q.; Xie, S.; Ma, W. Estimation of forest structural diversity using the spectral and textural information derived from SPOT-5 satellite images. Remote Sens. 2016, 8, 125. [Google Scholar] [CrossRef]
  17. Sesnie, S.E.; Espinosa, C.I.; Jara-Guerrero, A.K.; Tapia-Armijos, M.F. Ensemble machine learning for mapping tree species alpha-diversity using multi-source satellite data in an Ecuadorian seasonally dry forest. Remote Sens. 2023, 15, 583. [Google Scholar] [CrossRef]
  18. Gholizadeh, H.; Gamon, J.A.; Zygielbaum, A.I.; Wang, R.; Schweiger, A.K.; Cavender-Bares, J. Remote sensing of biodiversity: Soil correction and data dimension reduction methods improve assessment of α-diversity (species Richness) in prairie ecosystems. Remote Sens. Environ. 2018, 206, 240–253. [Google Scholar] [CrossRef]
  19. Zhao, Y.; Sun, Y.; Chen, W.; Zhao, Y.; Liu, X.; Bai, Y. The potential of mapping grassland plant diversity with the links among spectral diversity, functional trait diversity, and species diversity. Remote Sens. 2021, 13, 3034. [Google Scholar] [CrossRef]
  20. Tian, Y.; Fu, G. Quantifying plant species α-diversity using normalized difference vegetation index and climate data in alpine grasslands. Remote Sens. 2022, 14, 5007. [Google Scholar] [CrossRef]
  21. Peng, Y.; Fan, M.; Song, J.; Cui, T.; Li, R. Assessment of plant species diversity based on hyperspectral indices at a fine scale. Sci. Rep. 2018, 8, 4776. [Google Scholar] [CrossRef]
  22. Drori, R.; Dan, H.; Sprintsin, M.; Sheffer, E. Precipitation-sensitive dynamic threshold: A new and simple method to detect and monitor forest and woody vegetation cover in sub-humid to arid areas. Remote Sens. 2020, 12, 1231. [Google Scholar] [CrossRef]
  23. Fern, R.R.; Foxley, E.A.; Bruno, A.; Morrison, M.L. Suitability of NDVI and OSAVI as estimators of green biomass and coverage in a semi-arid rangeland. Ecol. Indic. 2018, 94, 16–21. [Google Scholar] [CrossRef]
  24. Wei, W.; Zhang, H.; Zhou, J.; Zhou, L.; Xie, B.; Li, C. Drought monitoring in arid and semi-arid region based on multi-satellite datasets in northwest, China. Environ. Sci. Pollut. Res. Int. 2021, 28, 51556–51574. [Google Scholar] [CrossRef]
  25. Schmidtlein, S.; Fassnacht, F.E. The spectral variability hypothesis does not hold across landscapes. Remote Sens. Environ. 2017, 192, 114–125. [Google Scholar] [CrossRef]
  26. Peña-Lara, V.A.; Dupuy, J.M.; Reyes-Garcia, C.; Sanaphre-Villanueva, L.; Portillo-Quintero, C.A.; Hernández-Stefanoni, J.L. Modelling species Richness and functional diversity in tropical dry forests using multispectral remotely sensed and topographic data. Remote Sens. 2022, 14, 5919. [Google Scholar] [CrossRef]
  27. Farwell, L.S.; Gudex-Cross, D.; Anise, I.E.; Bosch, M.J.; Olah, A.M.; Radeloff, V.C.; Razenkova, E.; Rogova, N.; Silveira, E.M.; Smith, M.M. Satellite image texture captures vegetation heterogeneity and explains patterns of bird Richness. Remote Sens. Environ. 2021, 253, 112175. [Google Scholar] [CrossRef]
  28. Cavender-Bares, J.; Gamon, J.A.; Hobbie, S.E.; Madritch, M.D.; Meireles, J.E.; Schweiger, A.K.; Townsend, P.A. Harnessing plant pectra to integrate the biodiversity sciences across biological and spatial scales. Am. J. Bot. 2017, 104, 966–969. [Google Scholar] [CrossRef]
  29. Lausch, A.; Bannehr, L.; Beckmann, M.; Boehm, C.; Feilhauer, H.; Hacker, J.M.; Heurich, M.; Jung, A.; Klenke, R.; Neumann, C.; et al. Linking Earth Observation and taxonomic, structural and functional biodiversity: Local to ecosystem perspectives. Ecol. Indic. 2016, 70, 317–339. [Google Scholar] [CrossRef]
  30. Pettorelli, N.; Schulte to Bühne, H.; Tulloch, A.; Dubois, G.; Macinnis-Ng, C.; Queirós, A.M.; Keith, D.A.; Wegmann, M.; Schrodt, F.; Stellmes, M.; et al. Satellite remote sensing of ecosystem functions: Opportunities, challenges and way forward. Remote Sens. Ecol. Conserv. 2018, 4, 71–93. [Google Scholar] [CrossRef]
  31. Gao, B.-C. NDWI—A normalized difference water index for remote sensing of vegetation liquid water from space. Remote Sens. Environ. 1996, 58, 257–266. [Google Scholar] [CrossRef]
  32. Wang, R.; Gamon, J.A. Remote sensing of terrestrial plant biodiversity. Remote Sens. Environ. 2019, 231, 111218. [Google Scholar] [CrossRef]
  33. Fassnacht, F.; Hartig, F.; Latifi, H.; Berger, C.; Hernández, J.; Corvalán, P.; Koch, B. Importance of sample size, data type and prediction method for remote sensing-based estimations of aboveground forest biomass. Remote Sens. Environ. 2014, 154, 102–114. [Google Scholar] [CrossRef]
  34. Huete, A.; Didan, K.; Miura, T.; Rodriguez, E.P.; Gao, X.; Ferreira, L.G. Overview of the radiometric and biophysical performance of the MODIS vegetation indices. Remote Sens. Environ. 2002, 83, 195–213. [Google Scholar] [CrossRef]
  35. Rahmanian, S.; Nasiri, V.; Amindin, A.; Karami, S.; Maleki, S.; Pouyan, S.; Borz, S.A. Prediction of plant diversity using multi-seasonal remotely sensed and geodiversity data in a mountainous area. Remote Sens. 2023, 15, 387. [Google Scholar] [CrossRef]
  36. Qi, Y. Random forest for bioinformatics. In Ensemble Machine Learning: Methods and Applications; Rokach, L., Maimon, O., Eds.; Springer: Berlin/Heidelberg, Germany, 2012; pp. 307–323. [Google Scholar]
  37. Wang, B.; Chen, Y.; Yan, Z.; Liu, W. Integrating remote sensing data and CNN-LSTM-Attention Techniques for improved forest stock volume Estimation: A Comprehensive analysis of Baishanzu Forest Park, China. Remote Sens. 2024, 16, 324. [Google Scholar] [CrossRef]
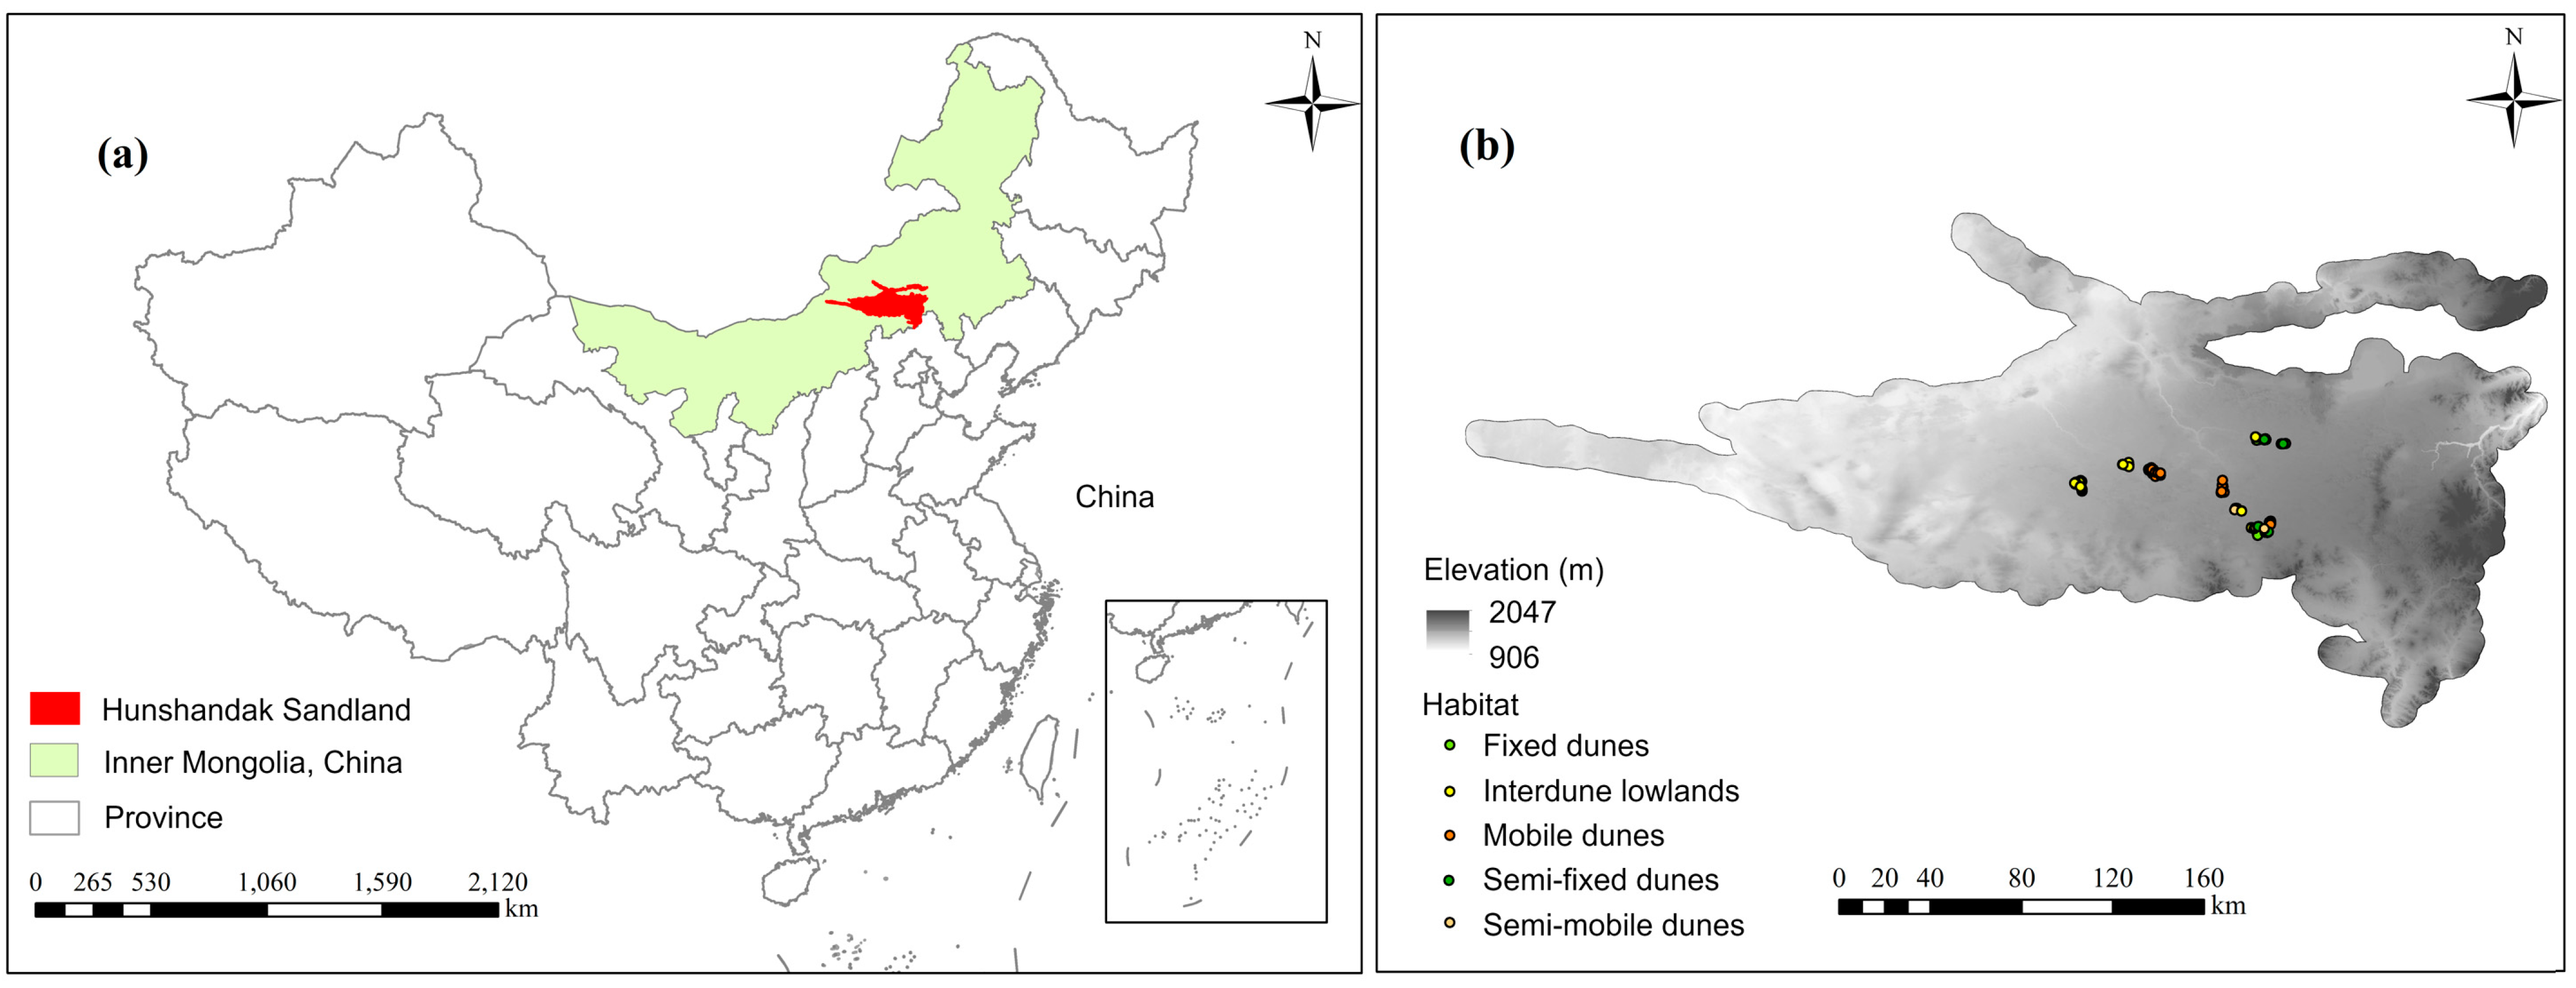
Figure 1. Study area (a) and sampling distribution (b) in the Hunshandak Sandland, northern China.
Diversity 18 00295 g001
Figure 2. Heat map of correlations on four diversity indices (Shannon index, Simpson index, Richness, and Pielou index) for each spectral vegetation index along the species Richness gradient (low, moderate, and high) by calculating the Pearson correlation coefficients, r, p values, and performing cluster analysis. (In the figure, the quantity of “*” indicates the significance level: “***”, p < 0.001, highly significant; “**”, p < 0.01, very significant; “*”, p < 0.05, significant; and no asterisk indicates not significant. The color variation and values represent r).
Diversity 18 00295 g002
Figure 3. The correlation heatmap of four diversity indices (Shannon index, Simpson index, Richness, and Pielou index) along NDVI gradients (<0.2, 0.2–0.4, >0.4) based on Pearson correlation coefficients. note: *: p < 0.05, **: p < 0.01, ***: p < 0.001.
Diversity 18 00295 g003
Figure 4. R-squared and significance p-values of the PLSR model under species Richness gradients. note: *: p < 0.05, **: p < 0.01, ***: p < 0.001.
Diversity 18 00295 g004
Figure 5. R square and significance p values of the Partial Least Squares Regression (PLSR) model under NDVI gradients. note: *: p < 0.05, **: p < 0.01, ***: p < 0.001.
Diversity 18 00295 g005
Figure 6. The importance and significance of spectral vegetation indices under Richness index based on RF models. “Increase in MSE” is the criterion for evaluating the relative importance of the corresponding spectral vegetation index, and the greater the value, the higher the importance. note: *: p < 0.05, **: p < 0.01.
Diversity 18 00295 g006
Figure 7. Importance ranking of spectral vegetation indices for Shannon diversity derived from random forest models, with higher values indicating greater explanatory importancenote: *: p < 0.05, **: p < 0.01.
Diversity 18 00295 g007
Figure 8. Importance ranking of spectral vegetation indices for Simpson diversity index derived from random forest models, with higher values indicating greater explanatory importance. note: *: p < 0.05, **: p < 0.01.
Diversity 18 00295 g008
Figure 9. Importance ranking of spectral vegetation indices for Pielou diversity derived from random forest models, with higher values indicating greater explanatory importance note: *: p < 0.05, **: p < 0.01.
Diversity 18 00295 g009
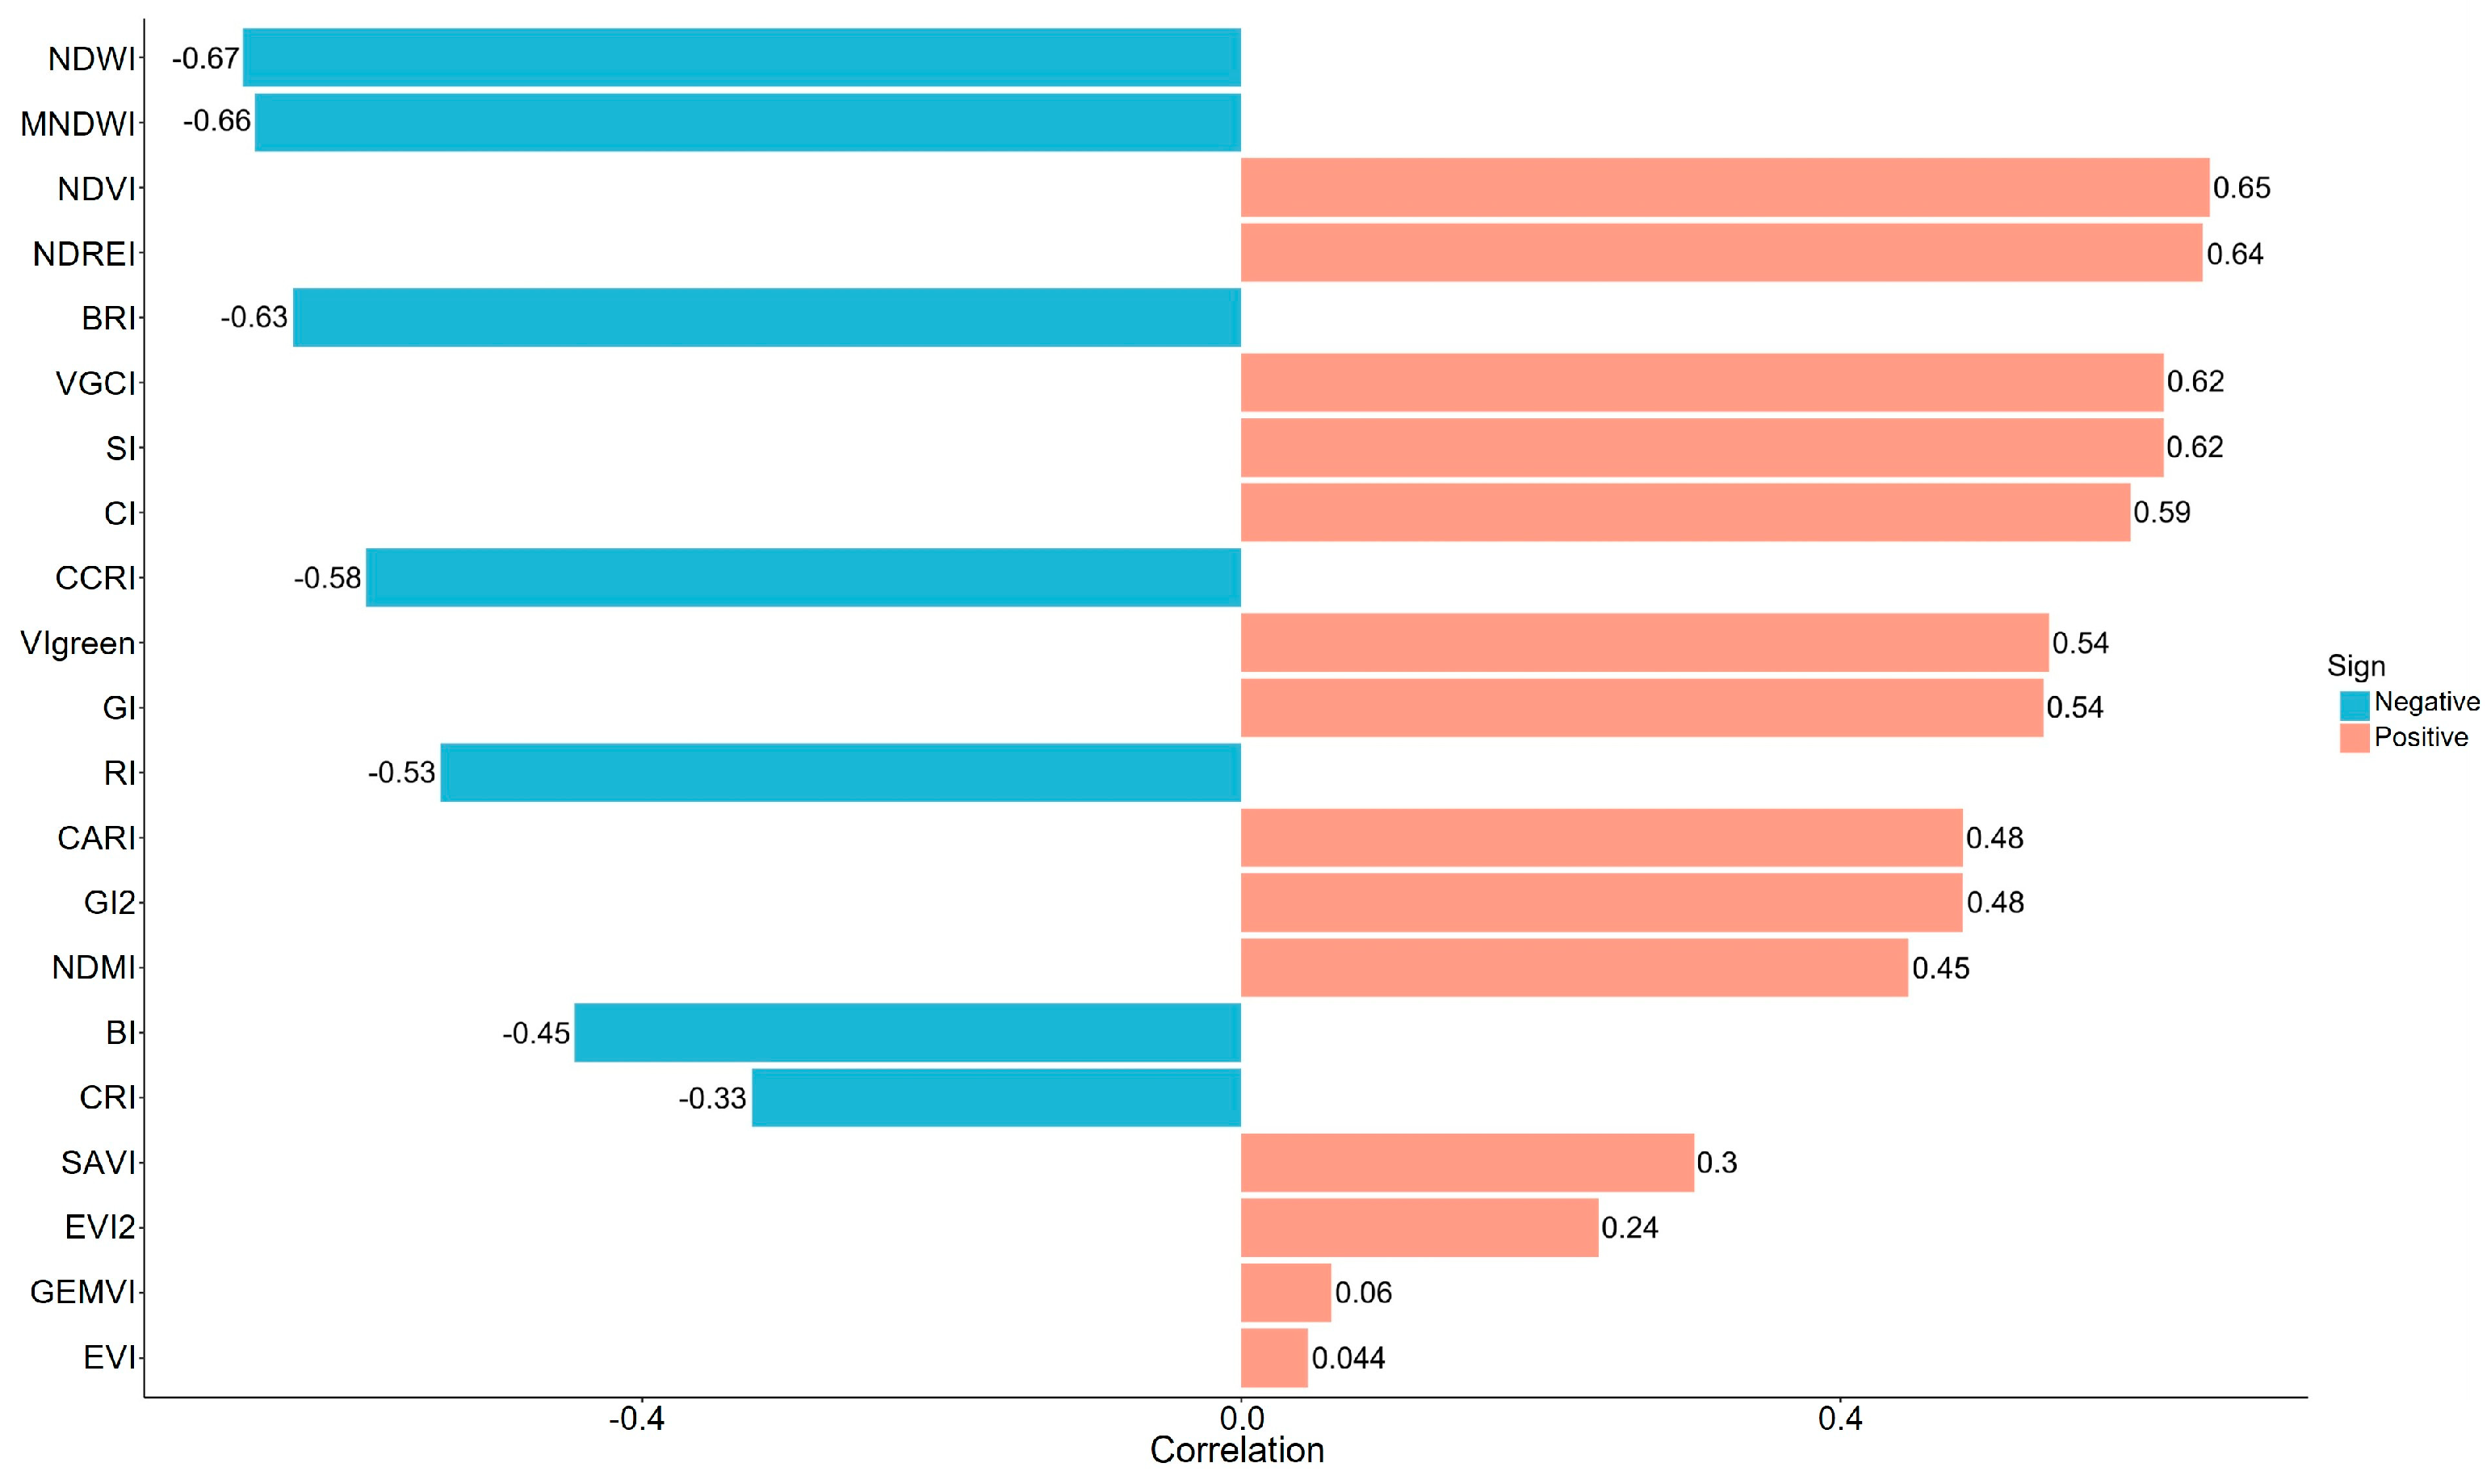
Figure 10. The absolute value ranking of correlation coefficients between spectral vegetation indices and plant richness.
Diversity 18 00295 g010
Figure 11. Variation in correlation coefficients between the top five spectral indices and richness across richness and NDVI intervals in different habitats: (a) entire study area; (b) fixed dunes; (c) semi-fixed dunes; (d) interdune lowlands; (e) semi-mobile dunes.
Diversity 18 00295 g011
Table 1. List of spectral vegetation indices calculated using remote sensing bands and raster segmentation packages.
NumberIndexFormula
1NDVI(B8 − B4)/(B8 + B4)
2BI(B11 − B8)/(B11 + B8)
3BRIB4/B8
4CI(B5 − B4)/(B5 + B4)
5CARIB4 + (2 × (B5 − B4) × (B3 − B4))
6CCRIB4/B5
7VIgreen(B3 − B4)/(B3 + B4)
8CRI(B5 + B4)/(B5 − B4)
9EVI22.5 × (B8 − B4)/(B8 + 2.4 × B4 + 1)
10EVI2.5 × (B8A − B4)/(B8A + 6 × B4 − 7.5 × B2 + 1)
11GEMVI(B8 − B4)/(B8 + B4 + 1)
12GI2(B3 − B2)/(B3 + B2)
13GIB3/B4
14MNDWI(B3 − B11)/(B3 + B11)
15NDMI(B8 − B11)/(B8 + B11)
16NDREI(B8 − B5)/(B8 + B5)
17NDWI(B3 − B8)/(B3 + B8)
18RIB4/B3
19SAVI(B8 − B4)/(B8 + B4 + L) × (1 + L)
20SIB8/B4
21VGCI(B8 − B4)/B4
Disclaimer/Publisher’s Note: The statements, opinions and data contained in all publications are solely those of the individual author(s) and contributor(s) and not of MDPI and/or the editor(s). MDPI and/or the editor(s) disclaim responsibility for any injury to people or property resulting from any ideas, methods, instructions or products referred to in the content.