Article

Microhabitat Primarily Structures Bacterial Communities, While Management History Shapes Functional Potential in Tomato-Associated Soils


by
Santiago Adolfo Vio
1,
Joaquín Rilling
2,
Manuel Fernandez-Lopez
3,
Milko Alberto Jorquera
4,
Mariano Pistorio
5 and
María Flavia Luna
1,6,*
1
Centro de Investigación y Desarrollo en Fermentaciones Industriales, CINDEFI (CONICET/UNLP), Calle 50 227, La Plata 1900, Argentina
2
Instituto Iberoamericano de Desarrollo Sostenible (IIDS), Universidad Autónoma de Chile, Las Delicias 428, Temuco 4780000, Chile
3
Microbiology of Agroforestry Ecosystems Group, Department Soil and Plant Microbiology, Estación Experimental del Zaidin (CSIC), Calle Profesor Albareda 1, 18008 Granada, Spain
4
Laboratorio de Ecología Microbiana Aplicada, Departamento de Ciencias Químicas y Recursos Naturales, Universidad de La Frontera, Temuco 4780000, Chile
5
Instituto de Biotecnología y Biología Molecular, IBBM (CONICET/UNLP), Calle 50 y 115, La Plata 1900, Argentina
6
Comisión de Investigaciones Científicas de la Provincia de Buenos Aires (CIC-PBA), Calle 526 e/Calles 10 y 11, La Plata 1900, Argentina
*
Author to whom correspondence should be addressed.
Diversity 2026, 18(5), 256; https://doi.org/10.3390/d18050256
Submission received: 25 March 2026 / Revised: 21 April 2026 / Accepted: 23 April 2026 / Published: 26 April 2026
(This article belongs to the Special Issue Rhizosphere Microbial Community Diversity)

Abstract

Intensive horticultural management modifies soil physicochemical conditions, yet its effects on microbial community assembly and functional organization remain poorly resolved. This study examined bulk soil (BS) and rhizosphere soil (Rh) bacterial communities associated with tomato plants grown in two contrasting commercial horticultural establishments: a long-term intensive monoculture (>10 years; MC) and a recently established system (FC). Total bacterial abundance and community structure were characterized using qPCR and 16S rRNA gene amplicon sequencing, respectively; the abundance and diversity of functional plant-growth-promoting (PGP) genes—nifH, phoD, and acdS—were assessed by qPCR and DGGE profiling. The MC system, associated with increased salinity, nutrient accumulation, and organic matter content, supported higher bacterial abundance, whereas the FC system showed a higher relative abundance of PGP genes. Amplicon sequencing revealed significant differentiation between BS and Rh, identifying microhabitat in tomato-associated soil as the primary driver of taxonomic structure, while site effects were weaker. In contrast, DGGE profiling supported differences in functional gene composition between management systems, whereas predicted pathway profiles inferred from 16S data were comparatively similar across samples. Overall, these results indicate that horticultural intensification is associated with shifts in predicted functional potential that are not paralleled by major changes in taxonomic structure.

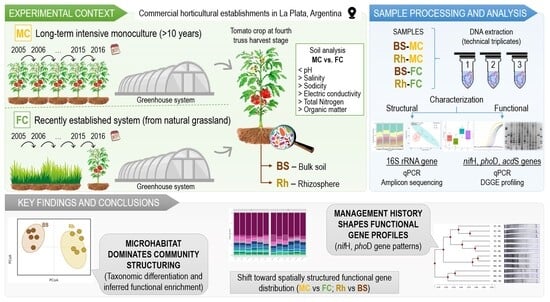
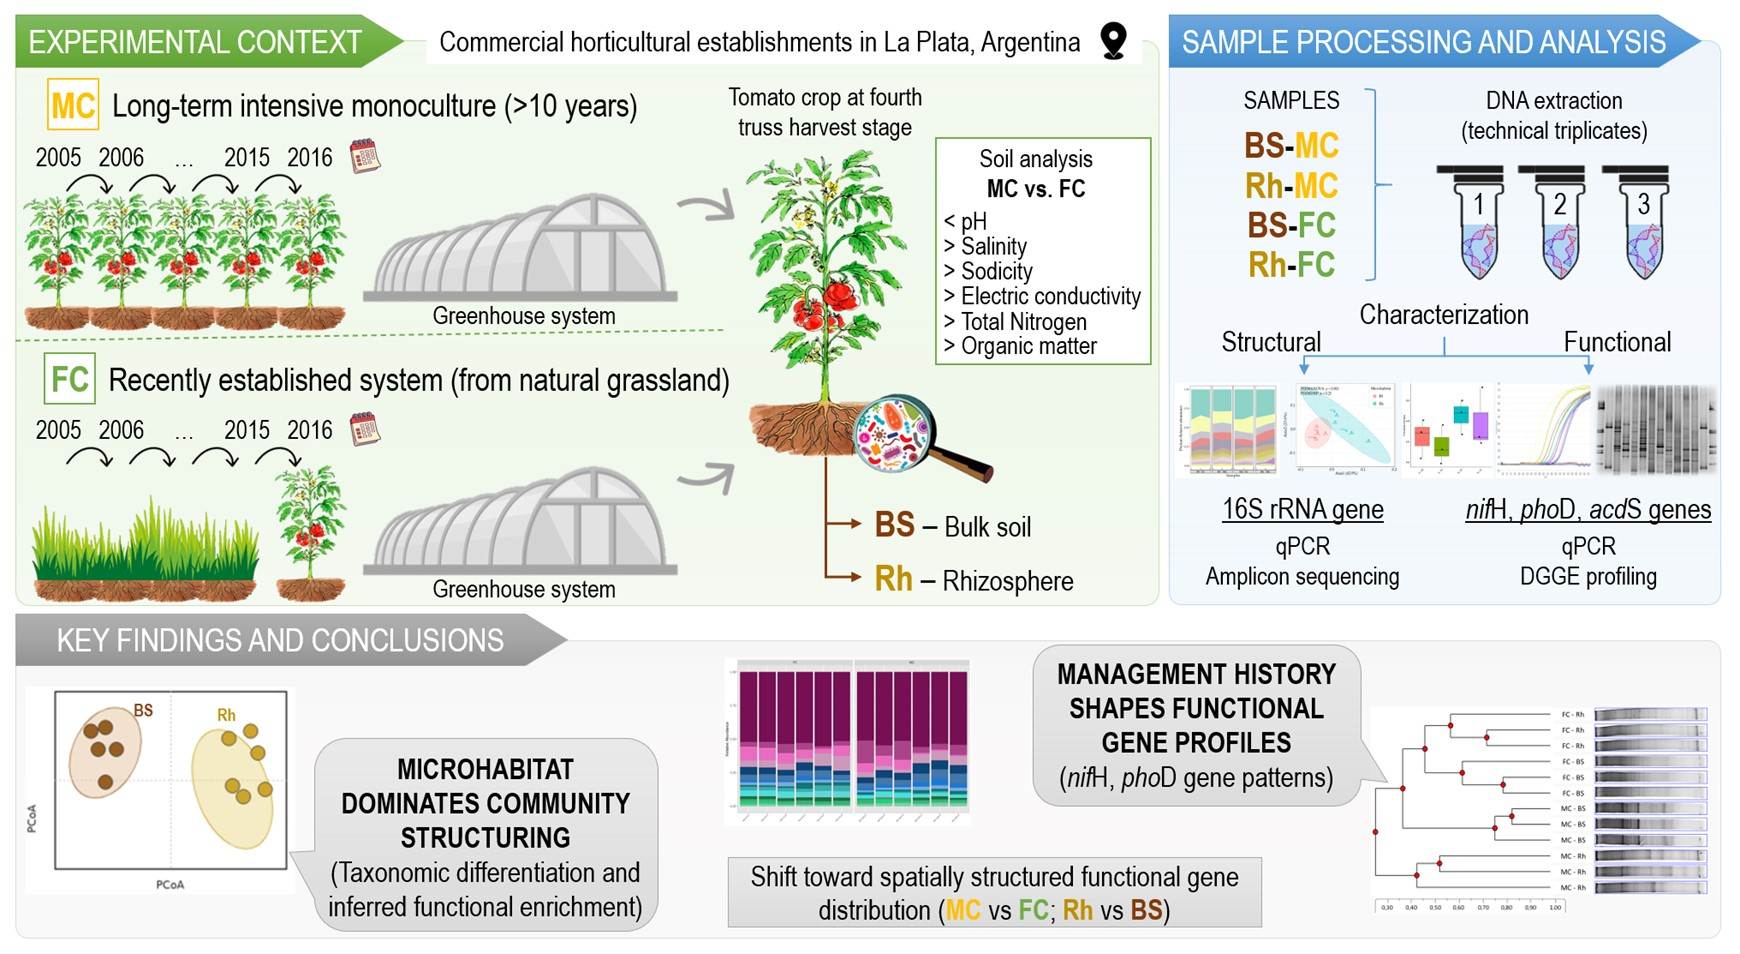
Graphical Abstract

1. Introduction

Horticulture contributes significantly to the supply of essential nutrients for a balanced diet to an ever-growing global population, particularly through the production of fruits and vegetables. In Argentina, tomato production for fresh consumption represents one of the most important horticultural activities, supporting an annual consumption of approximately 16 kg per capita [1]. Tomato cultivation is largely concentrated in peri-urban areas [2], such as the Cinturón Hortícola Platense (CHP), located around the city of La Plata (Buenos Aires Province). The CHP represents one of the main tomato-producing horticultural regions in Argentina. Over the last decade, tomato production in this area has increased considerably, reaching average yields of approximately 100 tons per hectare, predominantly under greenhouse conditions [1].
To sustain these high productivity levels, cropping systems have become highly dependent on external inputs such as fertilizers and pesticides [3,4,5]. These inputs are commonly used to supply essential nutrients, particularly nitrogen (N) and phosphorus (P), and to control pests and diseases. Nitrogen and phosphorus are mainly applied as chemical fertilizers; however, poultry and horse manures—valuable sources of organic matter rich in N and P—are also widely used as soil amendments by CHP horticultural producers. Such anthropogenic interventions in agroecosystem management can strongly modify soil physical and chemical properties and, consequently, alter soil biological components, ultimately affecting plant development [6,7].
Plants actively shape the composition of their associated microbiota by enriching specific microbial populations in the rhizosphere. Through root exudates and other mechanisms (e.g., mucilage secretion, border cell release, pH modulation, and volatile organic compound signaling), plants selectively recruit particular microorganisms while excluding others from the surrounding soil, leading to microbial communities at the soil–root interface that differ markedly from those found in bulk soil [8]. Increasing evidence indicates that rhizosphere microbiota plays an essential role in plant performance, health, and survival [9,10]. In particular, bacterial groups that confer beneficial effects on plant growth are commonly referred to as plant growth-promoting bacteria (PGPB). These microorganisms can support plant growth through both direct mechanisms—such as phytohormone production, nutrient solubilization or mineralization, biological nitrogen fixation (N2), metal chelation, and modulation of plant ethylene levels via ACC deaminase activity—and indirect mechanisms—including phytopathogen suppression, competition for nutrients and ecological niches, and the induction of systemic resistance in plants [11].
Several studies across different cropping systems have demonstrated that agricultural management—including fertilization, crop rotation, and long-term monoculture—can influence soil and rhizosphere bacterial communities, affecting their diversity and composition [12,13,14,15,16]. However, host selection processes may moderate these effects in the rhizosphere, leading to context-dependent community assembly patterns [17,18]. Tomato-associated soil and rhizosphere microbial communities have been studied in relation to plant health and growth promotion using both culture-dependent and culture-independent approaches [19,20,21,22]. Despite these advances, the relative roles of long-term management and plant-driven selection in structuring microbial communities and their functional potential remain poorly resolved [23,24,25]. In particular, it remains unclear whether long-term agricultural intensification alters community composition or influences the distribution of microbial functional traits.
This study tests the hypothesis that long-term intensive management of tomato crops alters soil physicochemical conditions and shapes microbial community structure and functional potential. It further evaluates whether plant-driven filtering in the rhizosphere acts as a dominant assembly force that may override management effects on community composition, and whether this filtering is further modulated by the underlying soil microbial pool. To address these questions, bacterial communities in bulk soil and the tomato rhizosphere were examined across contrasting horticultural management histories. An integrative approach combining qPCR, 16S rRNA gene amplicon sequencing, and DGGE fingerprinting was employed to assess soil properties, microbial abundance, community structure, and the distribution of key functional genes—nifH (nitrogen fixation), phoD (organic phosphorus mineralization), and acdS (ethylene regulation)—with the aim of identifying the main ecological drivers shaping microbial communities in intensive horticultural systems.

2. Materials and Methods

2.1. Experimental Sites

Sampling was conducted in two commercial horticultural establishments located within the Cinturón Hortícola Platense (CHP), La Plata, Argentina. The sites are geographically close and share comparable edaphoclimatic conditions. Site 1 (MC, long-term monoculture; 35°0′56.88″ S, 57°56′3.84″ W) corresponds to an establishment with a long history (>25 years) of intensive horticulture, including at least 10 years of continuous tomato monoculture under conventional management. In contrast, site 2 (FC, first crop; 35°1′14.52″ S, 57°57′33.48″ W) corresponds to a recently established horticultural system where tomato was cultivated for the first time; the previous land use was natural grassland. Within each site, three spatially independent greenhouses with comparable management history and crop conditions were selected as experimental units.
At both sites, tomato plants (Solanum lycopersicum L.) var. Elpida (Enza Zaden) were transplanted in early January 2016 using seedlings from the same production batch. Plants were arranged in single rows (30 cm bed width, 50 cm inter-row spacing; 4–5 plants m−2). Agronomic practices were comparable between sites and included north–south greenhouse orientation, soil tillage prior to transplanting, polyethylene mulch covering planting rows, drip irrigation, and single-stem vertical training. Importantly, both sites were managed under the same conventional horticultural practices during the study period. Therefore, the main difference between sites reflects their contrasting management histories, a primary factor explicitly addressed in this study, rather than differences in current agronomic practices.

2.2. Sample Collection, Soil Physicochemical Analysis, and Total DNA Extraction

Within each site, the three selected greenhouses were treated as independent biological replicates (n = 3). In each greenhouse, bulk soil (BS) and rhizosphere (Rh) samples were collected in May 2016, under identical crop phenological conditions across both sites (fourth truss harvest stage). Bulk soil (0–10 cm depth) was collected from three randomly selected interplant points per greenhouse. Subsamples were pooled (150 g each) to obtain one composite BS sample per greenhouse (450 g fresh soil per composite sample). For rhizosphere sampling, three randomly selected tomato plants per greenhouse were carefully uprooted. Loosely adhering soil was removed, and roots were shaken to detach tightly adhering soil, which was operationally defined as rhizosphere soil. Subsamples from three plants were pooled (6 g each) to obtain one composite Rh sample per greenhouse (18 g fresh soil per composite sample). In total, 12 samples (2 sites × 2 microhabitats × 3 replicates) were transported on ice to the Microorganismos de Aplicación en Agricultura Laboratory (MAAlab, CINDEFI, La Plata, Argentina), stored at 4 °C, and processed within 24 h. Soil physicochemical properties were determined from one composite sample per site using standard USDA (United States Department of Agriculture) soil laboratory methods for agricultural soils [26], including soil pH (1:2.5 soil:water), electrical conductivity, organic matter, total nitrogen, available phosphorus, exchangeable cations (Ca, Mg, K, Na), cation exchange capacity, and particle-size distribution.
Total DNA was extracted from 600 mg of each composite BS and Rh sample using the FastDNA™ Spin Kit for Soil (MP Biomedicals, Fountain Parkway, Solon, OH, USA), following the manufacturer’s instructions. DNA concentration was adjusted to 30 ng µL−1, and purity was assessed by 260/280 absorbance ratio (~1.8) using a NanoDrop 2000 (Thermo Ficher Scientific, Waltham, MA, USA). DNA integrity was verified by PCR amplification of the 16S rRNA gene using universal primers 341F (5′-AGAGTTTGATCMTGGCTCAG-3′) and 907R (5′-CCGTCAATTCMTTTRAGTTT-3′) under standard conditions. PCR products were visualized on 1.5% (w/v) agarose gels stained with ethidium bromide.

2.3. Quantification of Total Bacterial Abundance and Plant-Growth-Promoting Functional Genes

Total bacterial abundance in BS and Rh samples was quantified by quantitative PCR (qPCR) targeting the 16S rRNA gene. Reactions were performed in triplicate for each composite sample using a 7300 Real-Time PCR System (Applied Biosystems LLC, Carlsbad, CA, USA) and PowerUp™ SYBR Green Master Mix (Molecular Probes, Thermo Fisher Scientific, Willow Creek Road, Eugene, OR, USA), following the manufacturer’s instructions. Each reaction was carried out in a final volume of 20 µL containing 10 µL of PowerUp™ SYBR Green Master Mix, 0.4 µM of each primer, and 2 µL of template DNA. Primer sets and qPCR cycling conditions are summarized in Table 1. Each qPCR run included a no-template control to verify the absence of contamination.
Absolute gene copy numbers were determined using standard curves generated from five 10-fold serial dilutions of synthetic double-stranded DNA fragments corresponding to each target gene (Integrated DNA Technologies, Coralville, IA, USA). Standard curves were constructed from three independent qPCR runs by plotting quantification cycle (Cq) values against the logarithm of gene copy number. Amplification efficiency (Table 1) was calculated from the slope of the standard curve (Efficiency = 10(−1/slope) − 1), considering values ranging from 90 to 110% as acceptable. Gene abundance was expressed as gene copies per gram of dry soil. Soil dry weight was determined in triplicate by oven-drying subsamples at 60 °C until constant weight. Primer specificity was verified by melting curve analysis performed at the end of each qPCR run.
The abundance of functional genes associated with plant-growth-promoting traits—nifH (nitrogen fixation), phoD (organic phosphorus mineralization), and acdS (ethylene regulation)—was quantified by qPCR using the primer sets and reaction conditions detailed in Table 1. Absolute copy numbers (AQ) were determined using synthetic double-stranded DNA corresponding to each target gene. Results were expressed as gene copies per gram of dry soil. To account for differences in total bacterial abundance among samples, the relative abundance (RQ) of functional genes was calculated by normalizing nifH, phoD, and acdS copy numbers to the corresponding 16S rRNA gene copy numbers within each sample.

2.4. Illumina Amplicon Sequencing and Data Analysis

A fragment spanning the V3–V4 region of the bacterial 16S rRNA gene was amplified using primers 338F (5′-ACTCCTACGGGAGGCAGCAG-3′) and 806R (5′-GGACTACHVGGGTWTCTAAT-3′) [31] and sequenced (2 × 300 bp, Illumina, San Diego, CA, USA) by Mr. DNA Laboratories (Shallowater, TX, USA). Sequence data were processed using QIIME 2 v2024.2 [32]. Reads were demultiplexed, quality-filtered, and denoised with DADA2 [33] to obtain amplicon sequence variants (ASVs). All samples were rarefied to an even sequencing depth of 65,500 sequences prior to downstream analyses. Following rarefaction, two datasets were generated: a non-filtered dataset and a filtered dataset excluding low-prevalence ASVs (present in fewer than two samples) and low-abundance ASVs (total abundance ≤ 5 reads). Sensitivity analyses were performed using both datasets to evaluate the robustness of the results to ASV filtering. Representative sequences were aligned with MAFFT [34] and a phylogenetic tree was constructed using FastTree [35]. Taxonomy was assigned using a naïve Bayes classifier trained on the SILVA v138 database [36]. Alpha diversity (Shannon, Pielou) and beta diversity (Bray–Curtis, weighted and unweighted UniFrac) were calculated using QIIME 2 v2024.2. Differences in community structure were assessed using PERMANOVA, the proportion of explained variance (R2) was used as an effect-size estimate for each factor (site, microhabitat, site x microhabitat), and homogeneity of dispersion was evaluated using PERMDISP (999 permutations). Differentially abundant taxa were identified using ANCOM-BC [37], and indicator taxa were determined using the IndVal [38] approach. Core microbiome analyses were conducted in QIIME2. Downstream analyses and visualization were performed in R studio v4.5.2 [39] using the packages vegan, dplyr, ggplot2, pheatmap, ggrepel, and tidyr. Potential functional profiles were predicted using PICRUSt2 v2.5.2 [40], and pathway abundances were inferred based on the MetaCyc [41] database for downstream analyses.

2.5. DGGE Fingerprinting of N2-Fixing and Phosphate-Mineralizing Bacterial Communities

Denaturing gradient gel electrophoresis (DGGE) was used to characterize nitrogen-fixing and phosphate-mineralizing bacterial communities in bulk soil (BS) and rhizosphere (Rh) composite samples from both study sites. Fragments of the nifH and phoD genes were amplified by PCR using primer sets containing a GC clamp to stabilize partially melted DNA fragments during DGGE separation. Primer sequences and PCR cycling conditions are summarized in Table 2.
PCR products were separated using a DCode DGGE system (Bio-Rad Laboratories, Hercules, CA, USA). Aliquots of 20 µL of each PCR product were loaded onto 6% (w/v) polyacrylamide gels containing a 50–75% denaturing gradient (where 100% denaturant corresponds to 7 M urea and 40% formamide). Electrophoresis was performed at 80 V for 16 h. After electrophoresis, gels were stained with SYBR Gold (Molecular Probes, Invitrogen, Waltham, MA, USA) for 30 min and visualized under UV illumination. DGGE banding patterns were analyzed using CLIQS 1D Pro software v.1.3.063 (TotalLab Ltd., Gosforth, Newcastle upon Tyne, UK). Band presence–absence matrices were generated and used to assess similarities among bacterial communities. Similarity profile analysis based on Bray–Curtis similarity was performed with a significance level of 5% using PRIMER-E v6 software (PRIMER-E Ltd., Oaklands Rd, Auckland, New Zealand). Ordination of samples was visualized using non-metric multidimensional scaling (nMDS). Cluster analysis of DGGE profiles was also performed using the unweighted pair-group method with arithmetic averages (UPGMA). Community diversity was estimated from DGGE banding patterns using richness (S), Shannon–Wiener (H′), and Simpson (1/D) diversity indices [43].

2.6. Statistical Data Analysis

All statistical analyses were performed using InfoStat v.2018 software (Universidad Nacional de Córdoba, Córdoba, Argentina) [44]. Gene copy numbers obtained from qPCR assays were log10-transformed prior to analysis to improve normality and homoscedasticity. Standard curves were generated by linear regression of quantification cycle (Cq) values against the logarithm of gene copy number from serially diluted standards. The goodness of fit of each regression model was evaluated using analysis of variance (ANOVA). These models were subsequently used to estimate gene copy numbers in environmental samples and to calculate associated 95% confidence intervals. Differences in absolute and relative gene abundances, as well as diversity indices derived from DGGE profiles, were evaluated using two-way factorial ANOVA, considering site (MC and FC) and microhabitat (BS and Rh) as fixed factors. Greenhouses were treated as independent biological replicates within each site (n = 3). When significant effects were detected, means were compared using Tukey’s post hoc test (p ≤ 0.05). Assumptions of normality and homoscedasticity were assessed using the Shapiro–Wilk test and Cochran’s C test, respectively. Multivariate analysis was performed to integrate variables obtained from qPCR and DGGE analyses, including total bacterial abundance (16S rRNA gene copy number), relative abundance (RQ) of functional genes (nifH, phoD, and acdS), and diversity indices (richness, Shannon, and Simpson) of nifH- and phoD-harbouring communities. Prior to principal component analysis (PCA), variables were standardized, and the correlation structure among variables was examined to confirm the suitability of the dataset for multivariate analysis. PCA was conducted on the correlation matrix without rotation, and results were visualized using biplots.

3. Results

3.1. Physicochemical Soil Characteristics of Both Horticultural Agroecosystems

Physicochemical properties of bulk soils from both horticultural systems are shown in Table 3.
Both soils were classified as silt loam, with comparable texture and proportions of sand, silt, and clay. A descriptive evaluation of soil physicochemical properties indicated punctual differences between sites across several chemical parameters. MC soil showed higher values of electrical conductivity, cation exchange capacity, organic matter, organic carbon, total nitrogen, and available phosphorus based on composite sample measurements compared with FC soil. Exchangeable cations, including calcium, magnesium, potassium, and sodium, were also higher in MC. In contrast, FC soil exhibited a higher C/N ratio. Soil pH values were slightly higher in FC than in MC.

3.2. Total Bacterial Abundance and Plant-Growth-Promoting Functional Genes Quantified by qPCR

Standard curves for the 16S rRNA, nifH, phoD, and acdS genes showed strong linear relationships (R2 > 0.99) between quantification cycle (Cq) values and the Log10 of gene copy number, with high amplification efficiency and specificity across assays. Detailed regression statistics, melting curves, and model diagnostics are provided in the Supplementary Materials (Figures S1–S8; Tables S1–S8).
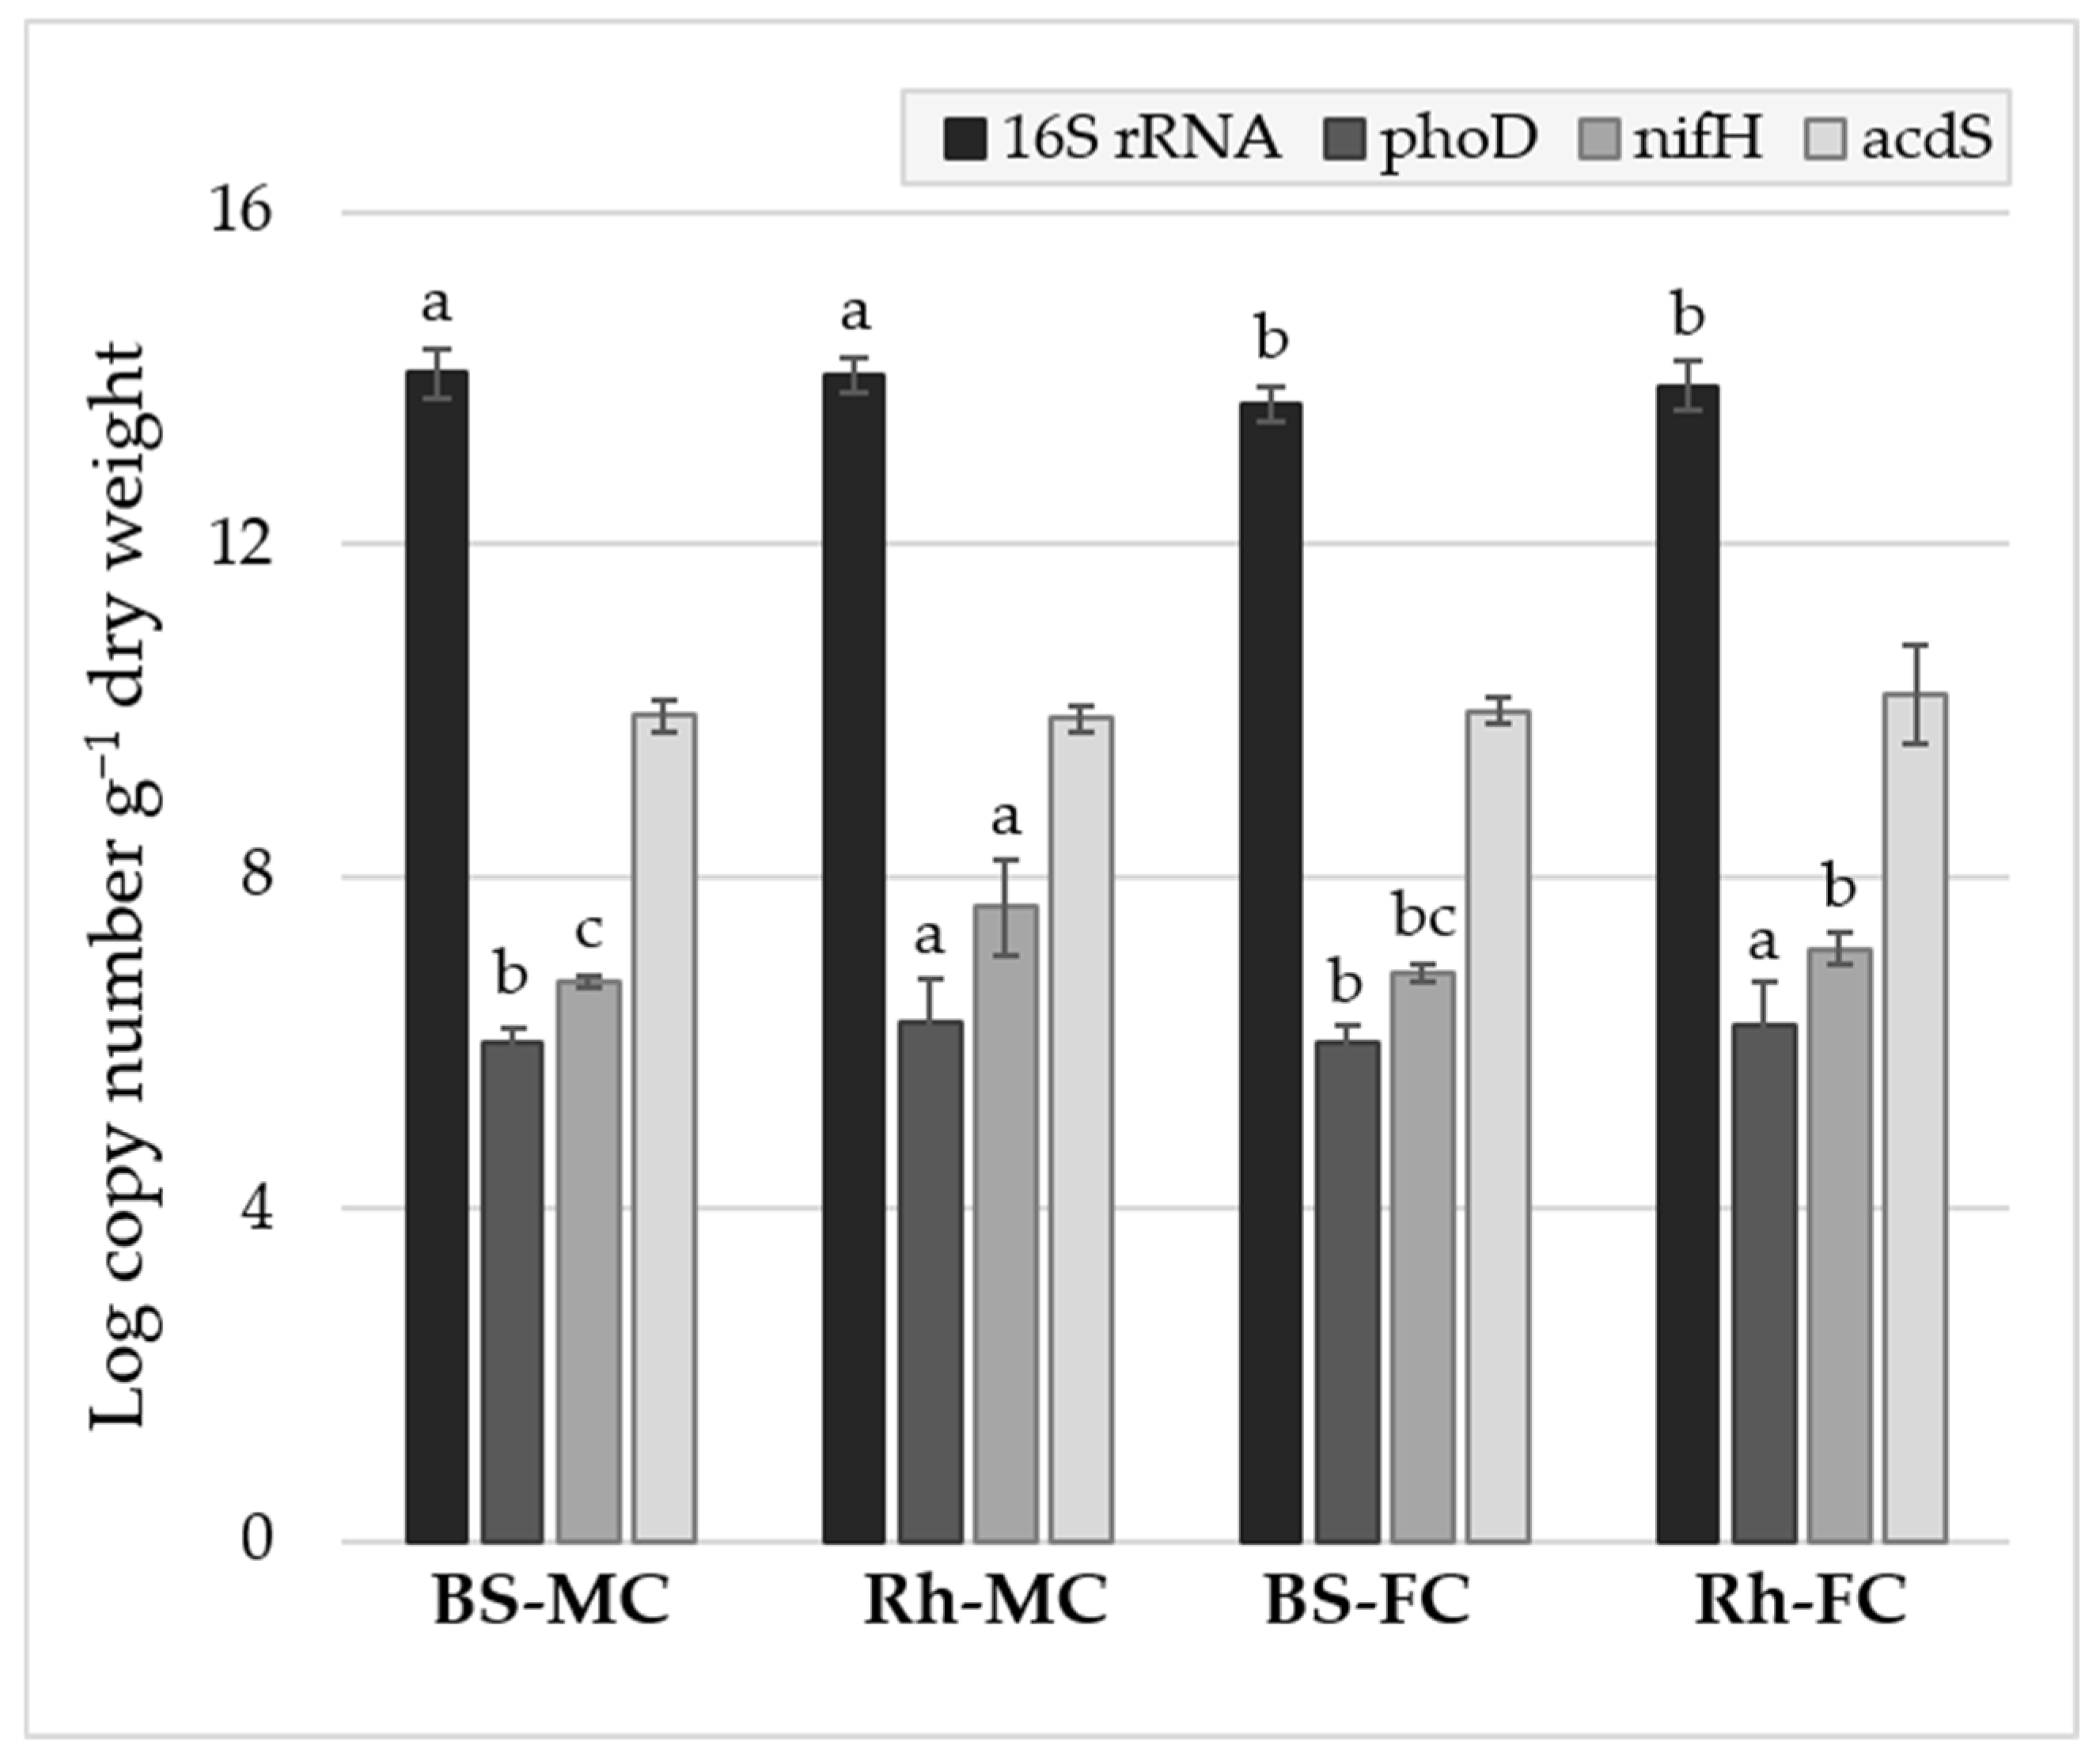
Absolute quantification (AQ) of the 16S rRNA gene revealed significantly higher total bacterial abundance in the long-term monoculture site (MC) compared with the first tomato crop site (FC) (p ≤ 0.05; Figure 1). In contrast, no significant differences in total bacterial abundance were detected between bulk soil (BS) and rhizosphere (Rh) samples.
Regarding functional genes associated with plant-growth-promoting activities, absolute abundance patterns differed depending on the functional marker analyzed (Figure 1). The abundance of the phoD gene did not differ between sites but was significantly higher in Rh samples than in BS (p ≤ 0.01). Similarly, nifH abundance showed a strong microhabitat effect, with significantly higher copy numbers detected in the tomato Rh compared with BS (p ≤ 0.01). In addition, a significant site × microhabitat interaction was detected for nifH, reflecting the particularly high abundance observed in MC-Rh samples. In contrast, acdS copy numbers did not differ significantly between sites or microhabitats.
When functional genes were normalized to total bacterial abundance, the relative quantification (RQ) highlighted clear differences between sites (Table 4). For phoD and nifH significant site × microhabitat interactions were observed. In MC, the rhizosphere showed higher relative abundance of both genes compared with bulk soil, whereas no differences between BS and Rh were detected in FC. In contrast, acdS showed consistently higher values in FC than in MC across both microhabitats, resulting in a significant site effect.

3.3. Bacterial Community Composition

Demultiplexing of the 16S rRNA gene amplicon libraries yielded 2,588,705 paired-end reads across the 12 samples, with sequencing depth ranging from 174,180 to 255,909 reads per sample. After quality filtering and denoising using DADA2, 1,025,796 high-quality non-chimeric sequences were retained, representing 12,034 amplicon sequence variants (ASVs). Per-sample sequencing depth after denoising ranged from 65,668 to 105,814 reads (median: 85,220), and no samples were discarded due to low coverage (Supplementary Table S9). Samples were rarefied to 65,500 sequences to standardize sequencing depth for downstream diversity analyses, based on the lowest sequencing depth across samples. Rarefaction curves based on observed ASVs approached saturation across samples, indicating that sequencing depth was sufficient to capture the majority of bacterial diversity present in the samples (Supplementary Figure S9). Detailed DADA2 denoising statistics for each sample are provided in Supplementary Table S9.
Alpha diversity metrics differed between microhabitats and sites (Table 5). Shannon diversity and Pielou’s evenness were significantly influenced by microhabitat (p ≤ 0.05), with BS samples exhibiting higher values than Rh samples. In contrast, observed ASV richness and Faith’s phylogenetic diversity were significantly affected by the interaction between site and microhabitat (p ≤ 0.05). The highest richness and phylogenetic diversity were observed in FC-BS samples, whereas the lowest values were detected in FC rhizosphere samples. To evaluate the robustness of these patterns, alpha diversity was also calculated after removing low-prevalence and low-frequency ASVs prior to rarefaction. The filtered dataset yielded patterns consistent with those observed here (Supplementary Table S10).
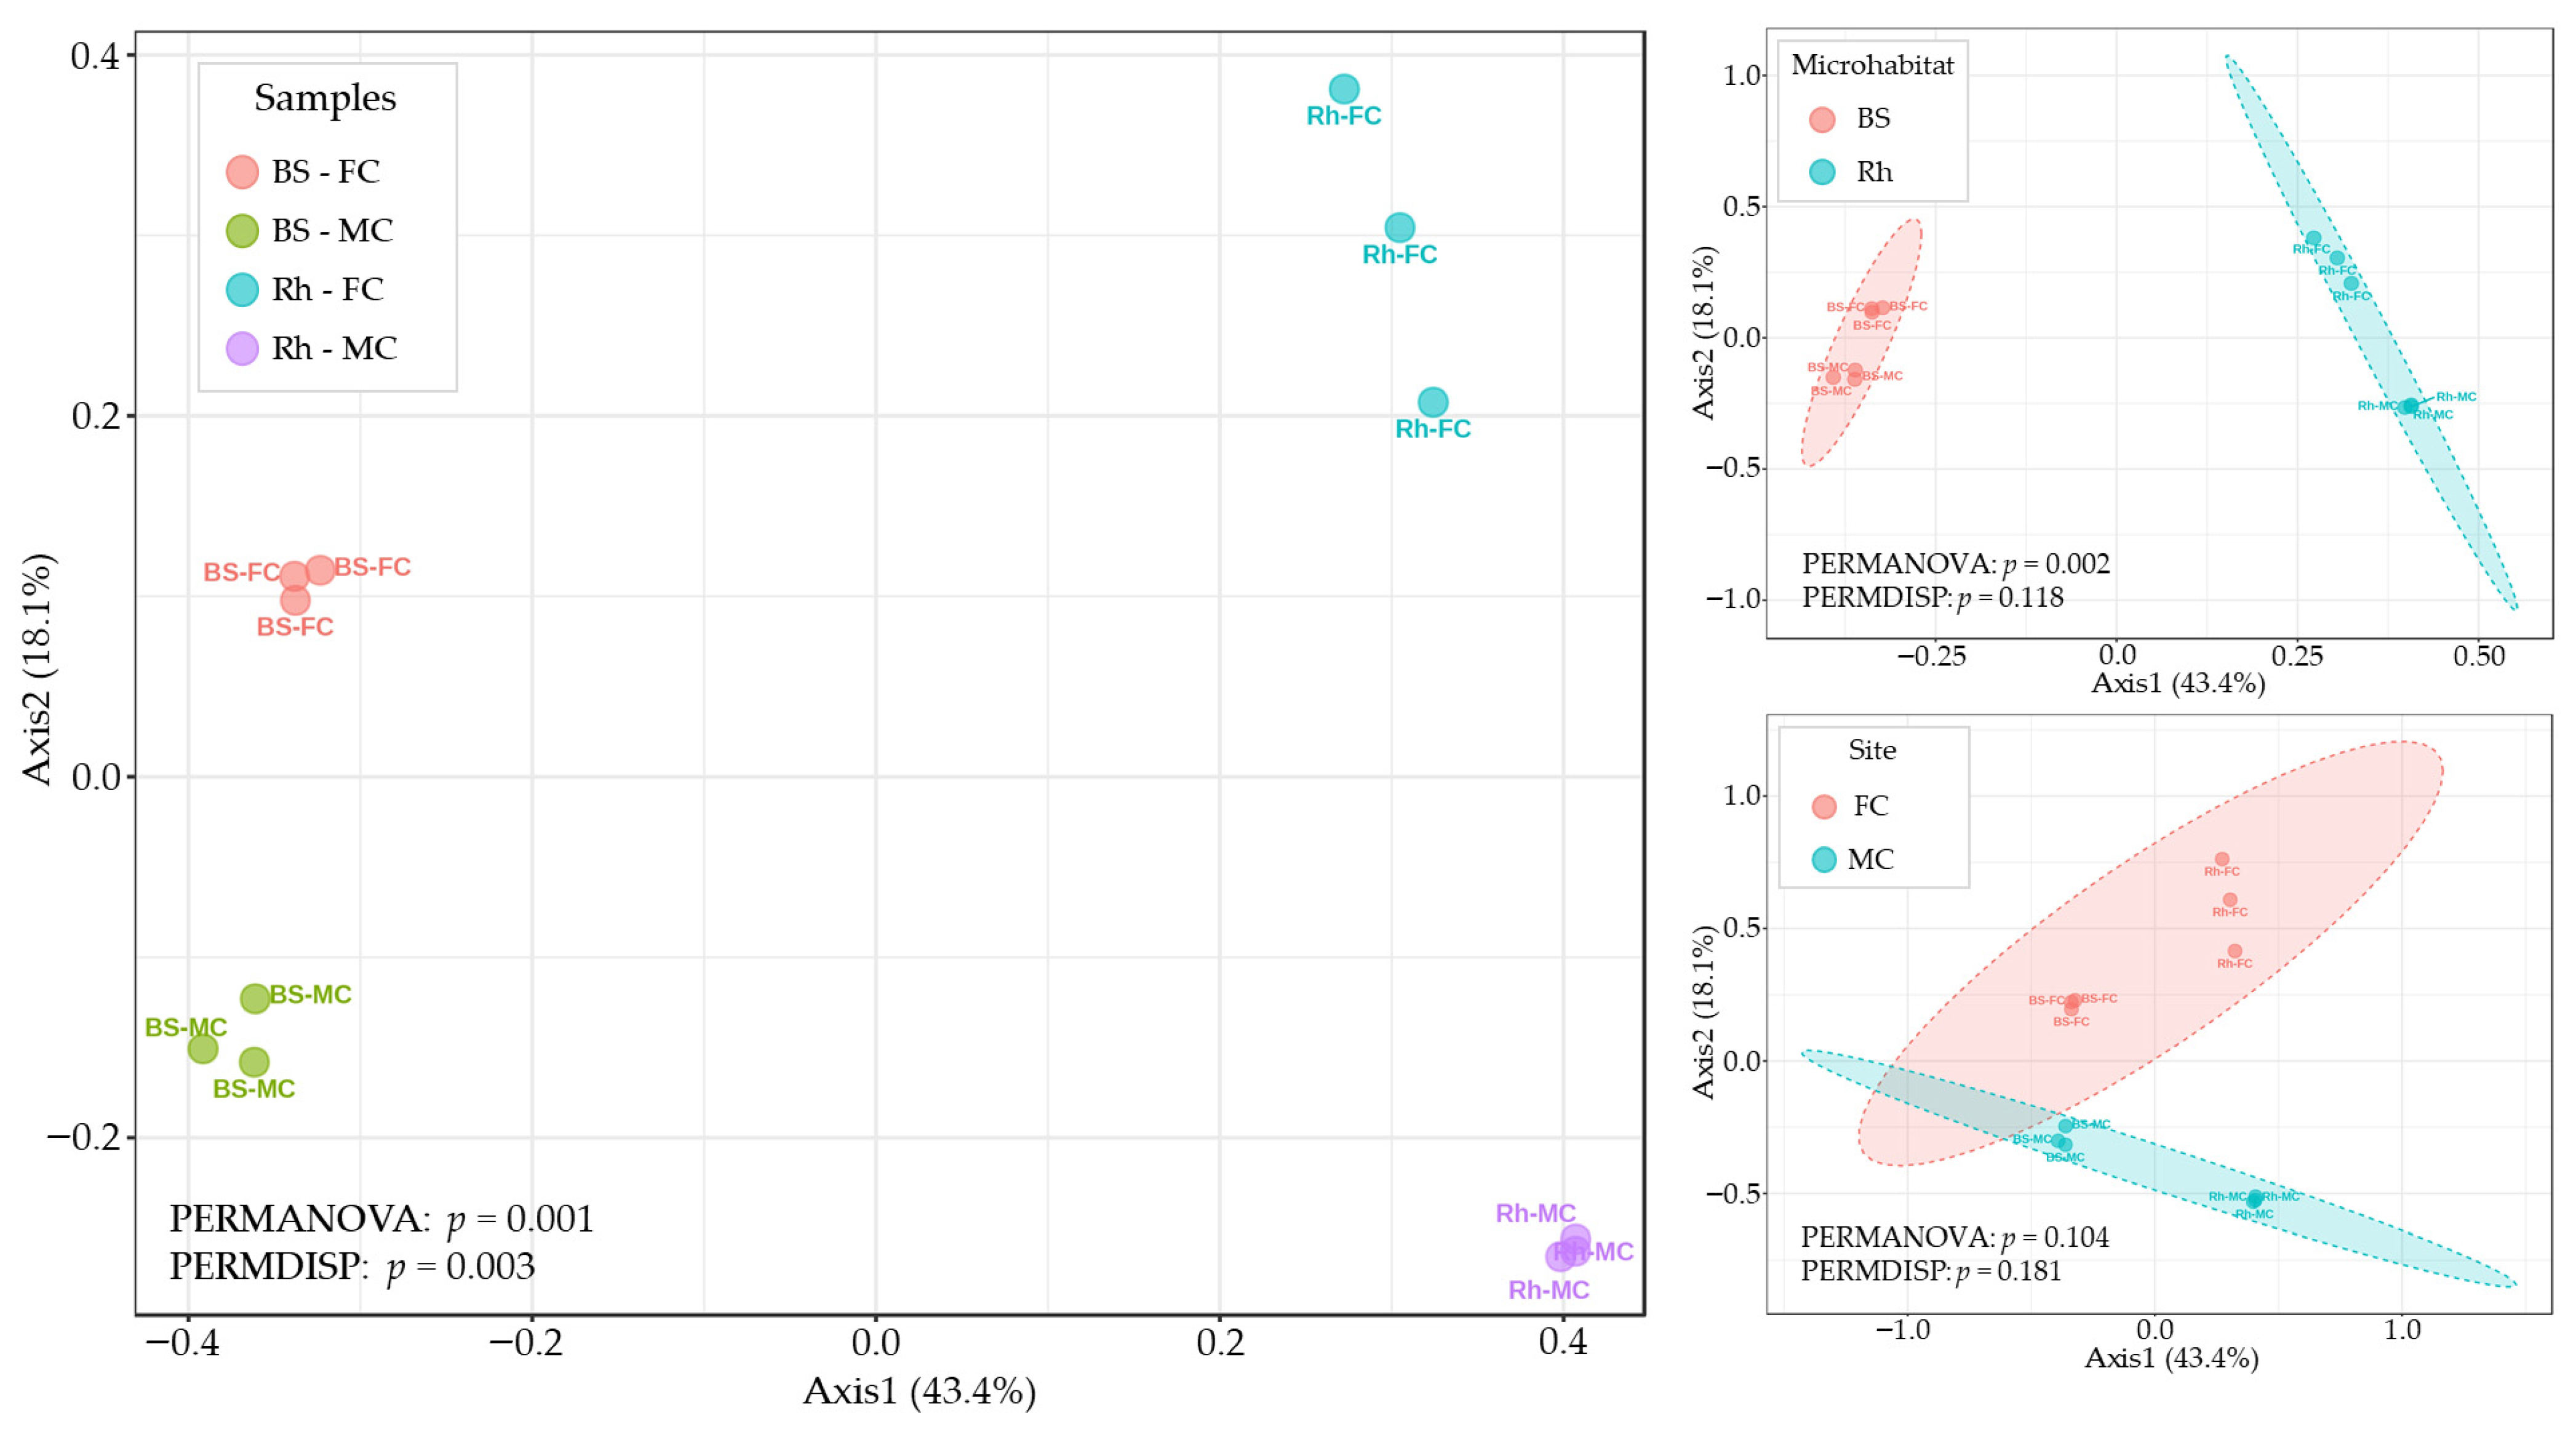
Principal coordinate analysis (PCoA) based on Bray–Curtis dissimilarities at genus level revealed a clear separation of samples according to microhabitat along the first axis, which explained 43.4% of the total variation (Figure 2). BS and Rh samples formed distinct clusters, whereas samples from different sites showed partial overlap. PERMANOVA confirmed that microhabitat significantly influenced bacterial community structure (R2 = 0.430; p = 0.002), whereas the effect of site alone was not significant (R2 = 0.166, p = 0.104). A significant effect was also detected for the Site × Microhabitat interaction (R2 = 0.699, p = 0.001). Tests for homogeneity of multivariate dispersion indicated no significant differences for microhabitat or site, whereas dispersion differed significantly for the Site × Microhabitat interaction. Therefore, results for this interaction term should be interpreted with caution, as they may partially reflect differences in dispersion rather than centroid separation. Comparable patterns were obtained using phylogeny-based distance metrics. Weighted UniFrac analyses also detected a significant effect of microhabitat (R2 = 0.367, p = 0.001) and of the site × microhabitat interaction (R2 = 0.689, p = 0.001), while the effect of site alone was weaker and associated with heterogeneity of dispersion (R2 = 0.203, p = 0.035). Full statistical outputs for all distance metrics are provided in Supplementary Table S11 and Figure S10. Analyses performed on the filtered ASV dataset produced consistent results.
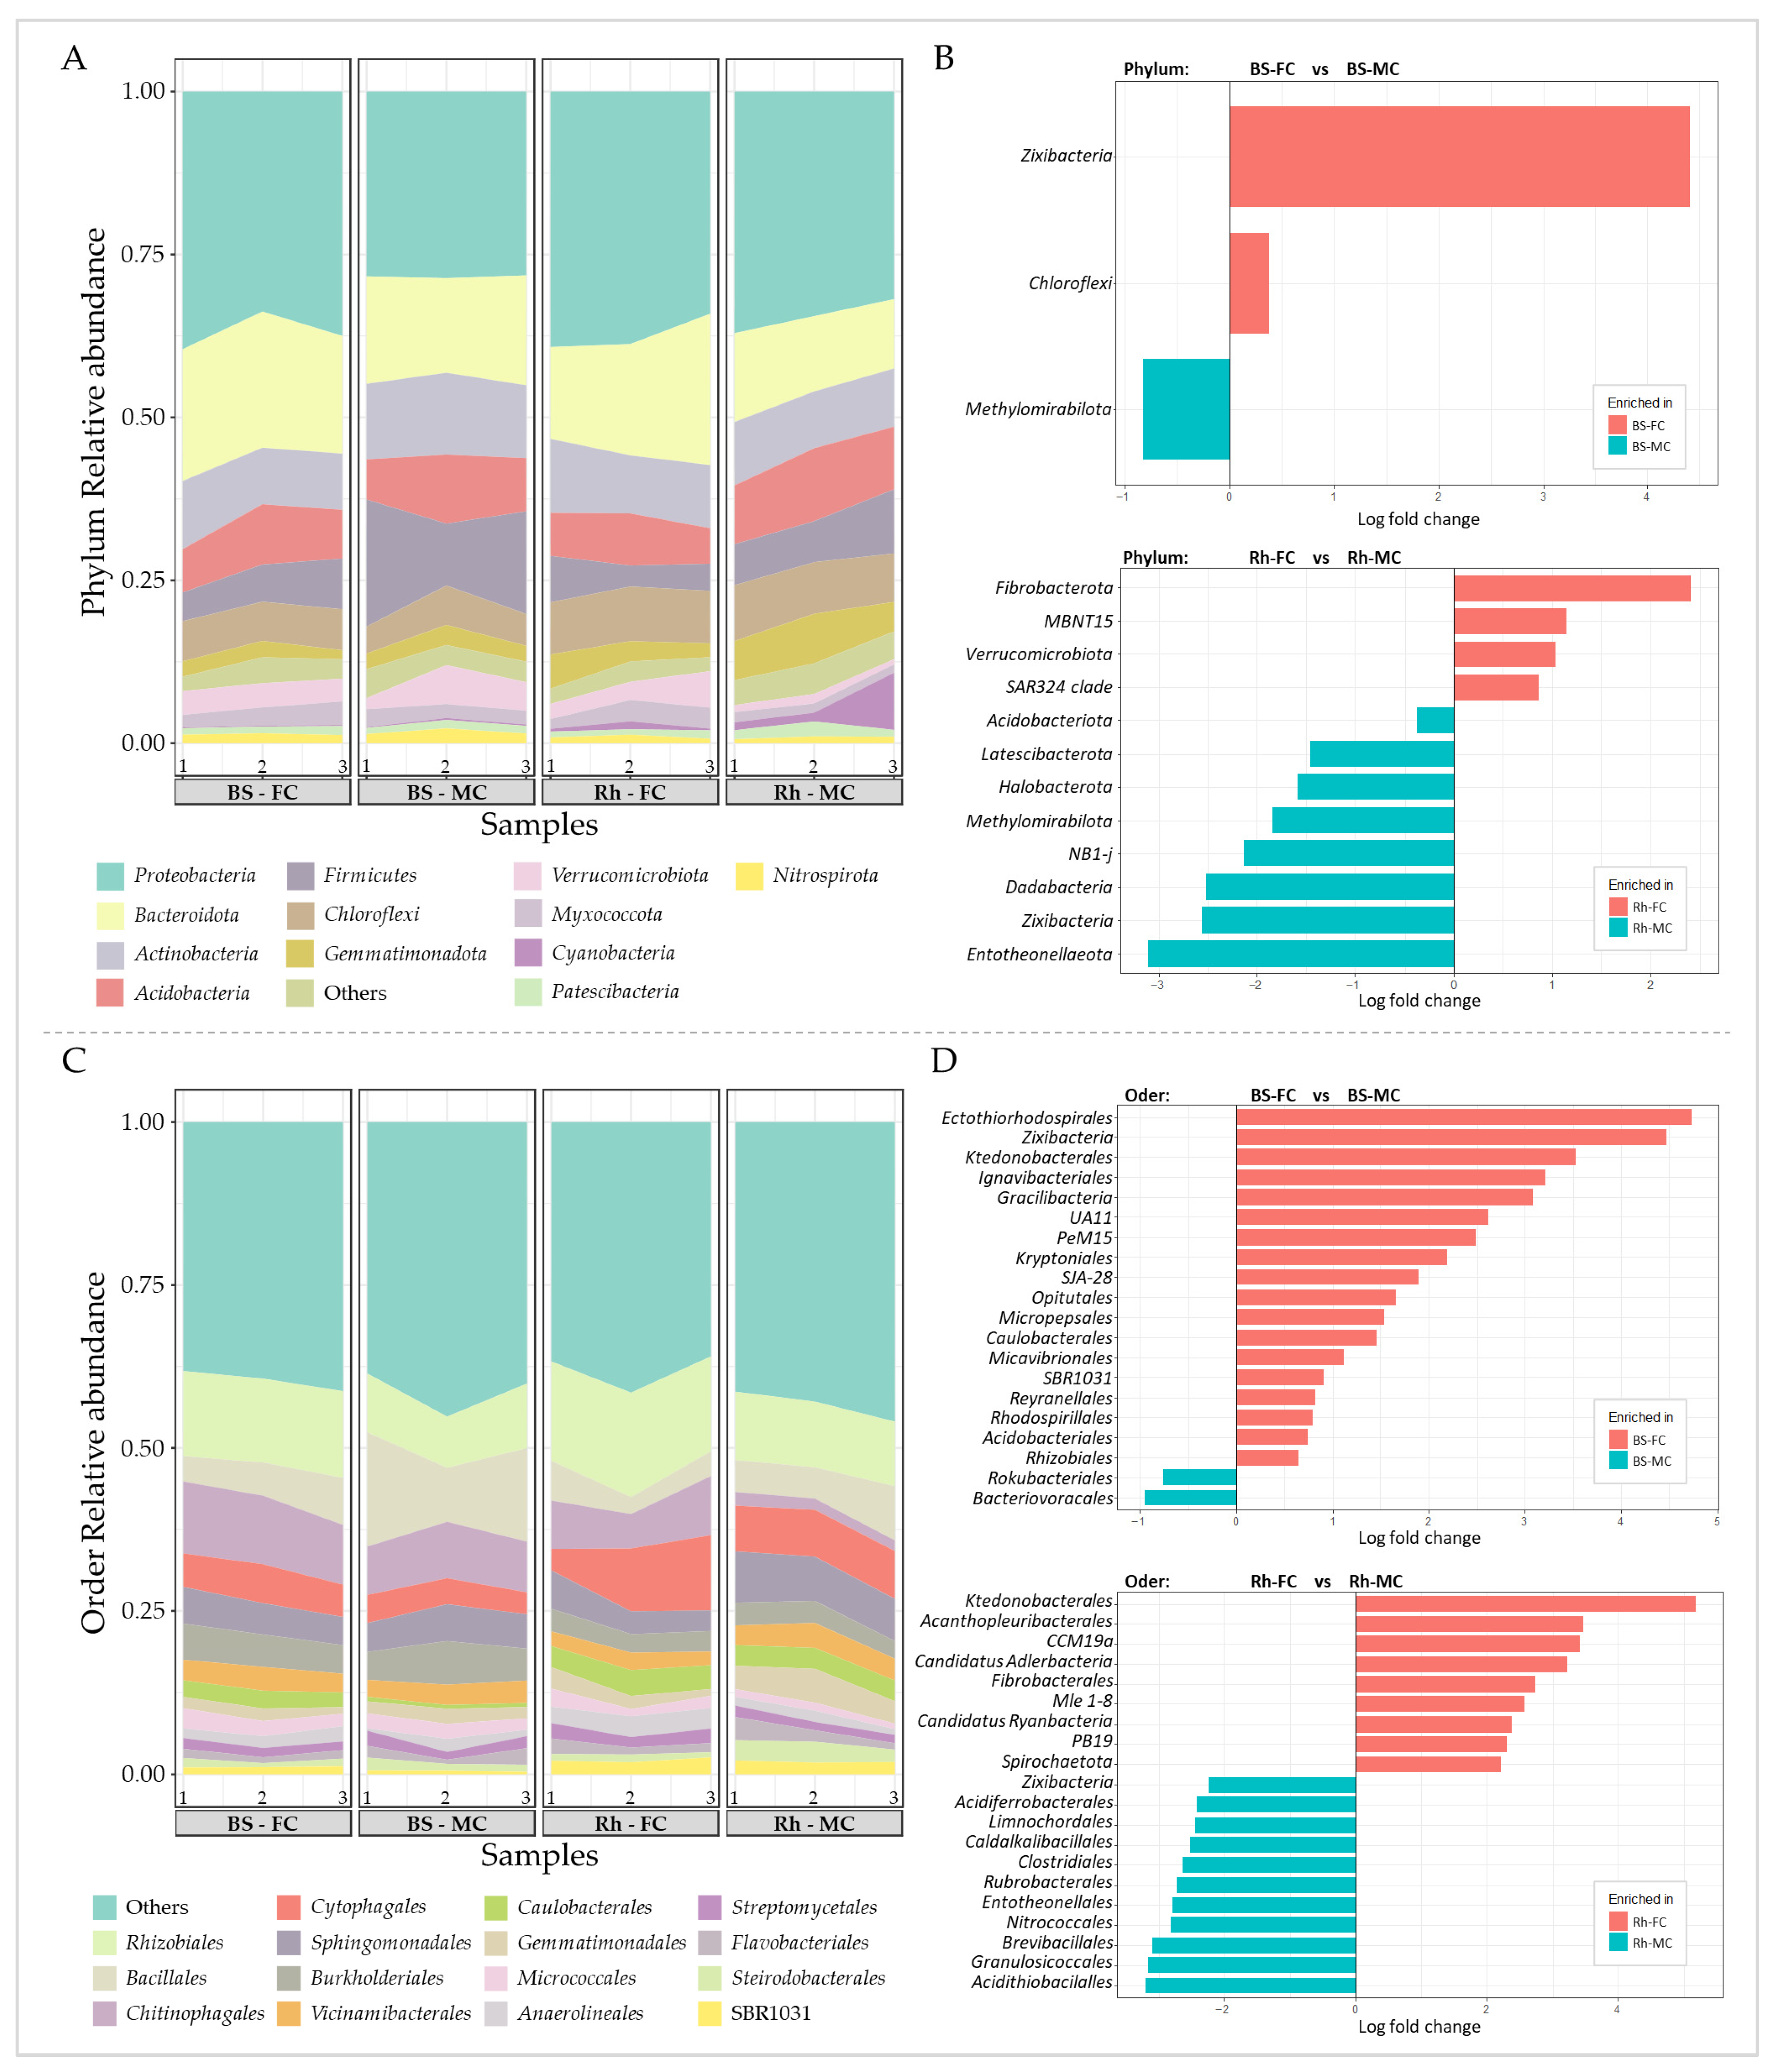
Consistent with the beta-diversity patterns, bacterial communities across all samples were dominated by a limited number of major phyla. Proteobacteria was the most abundant group in both sites and microhabitats, followed by Bacteroidota, Actinobacteriota, Acidobacteriota, and Firmicutes, while additional phyla such as Chloroflexi, Gemmatimonadota, Verrucomicrobiota, Patescibacteria, and Nitrospirota were consistently detected at lower relative abundances (Figure 3).
Although global site-level differences were not significant, taxon-level analyses were performed within each microhabitat to detect site-specific taxa. Differential abundance analyses revealed several taxa associated with each site within the two microhabitats. In BS, only a few phyla differed significantly between sites, with Zixibacteria and Chloroflexi enriched in FC and Methylomirabilota enriched in MC (Figure 3B). In contrast, a broader set of phyla differed between sites within the rhizosphere, including enrichment of Fibrobacterota and Verrucomicrobiota in FC, whereas Acidobacteriota, Latescibacterota, and several additional lineages were more abundant in MC rhizosphere samples. These differences became more pronounced at the order level. In BS, orders such as Ectothiorhodospirales and Ktedonobacterales were enriched in FC, whereas Rokubacteriales and Bacteroidovoracales were associated with MC (Figure 3D). In Rh communities, Ktedonobacterales and Fibrobacterales were more abundant in FC, while Clostridiales, Rubrobacterales, and Acidithiobacillales were enriched in MC.
The Proteobacteria-to-Acidobacteria (P/A) ratio was also evaluated to assess differences in trophic balance between sites. The P/A ratio differed significantly between sites, with higher values in FC than in MC (P/AFC = 5.05 vs. P/AMC = 3.40; ANOVA p = 0.0089), whereas no significant effects of microhabitat or interaction were detected.
Additional analyses across taxonomic levels supported these patterns. Global comparisons between microhabitats and sites identified further differentially abundant lineages across phylum, order, and genus levels (Supplementary Figure S11). Genus-level analyses conducted separately within each microhabitat also revealed multiple taxa associated with each site (Supplementary Figure S12).
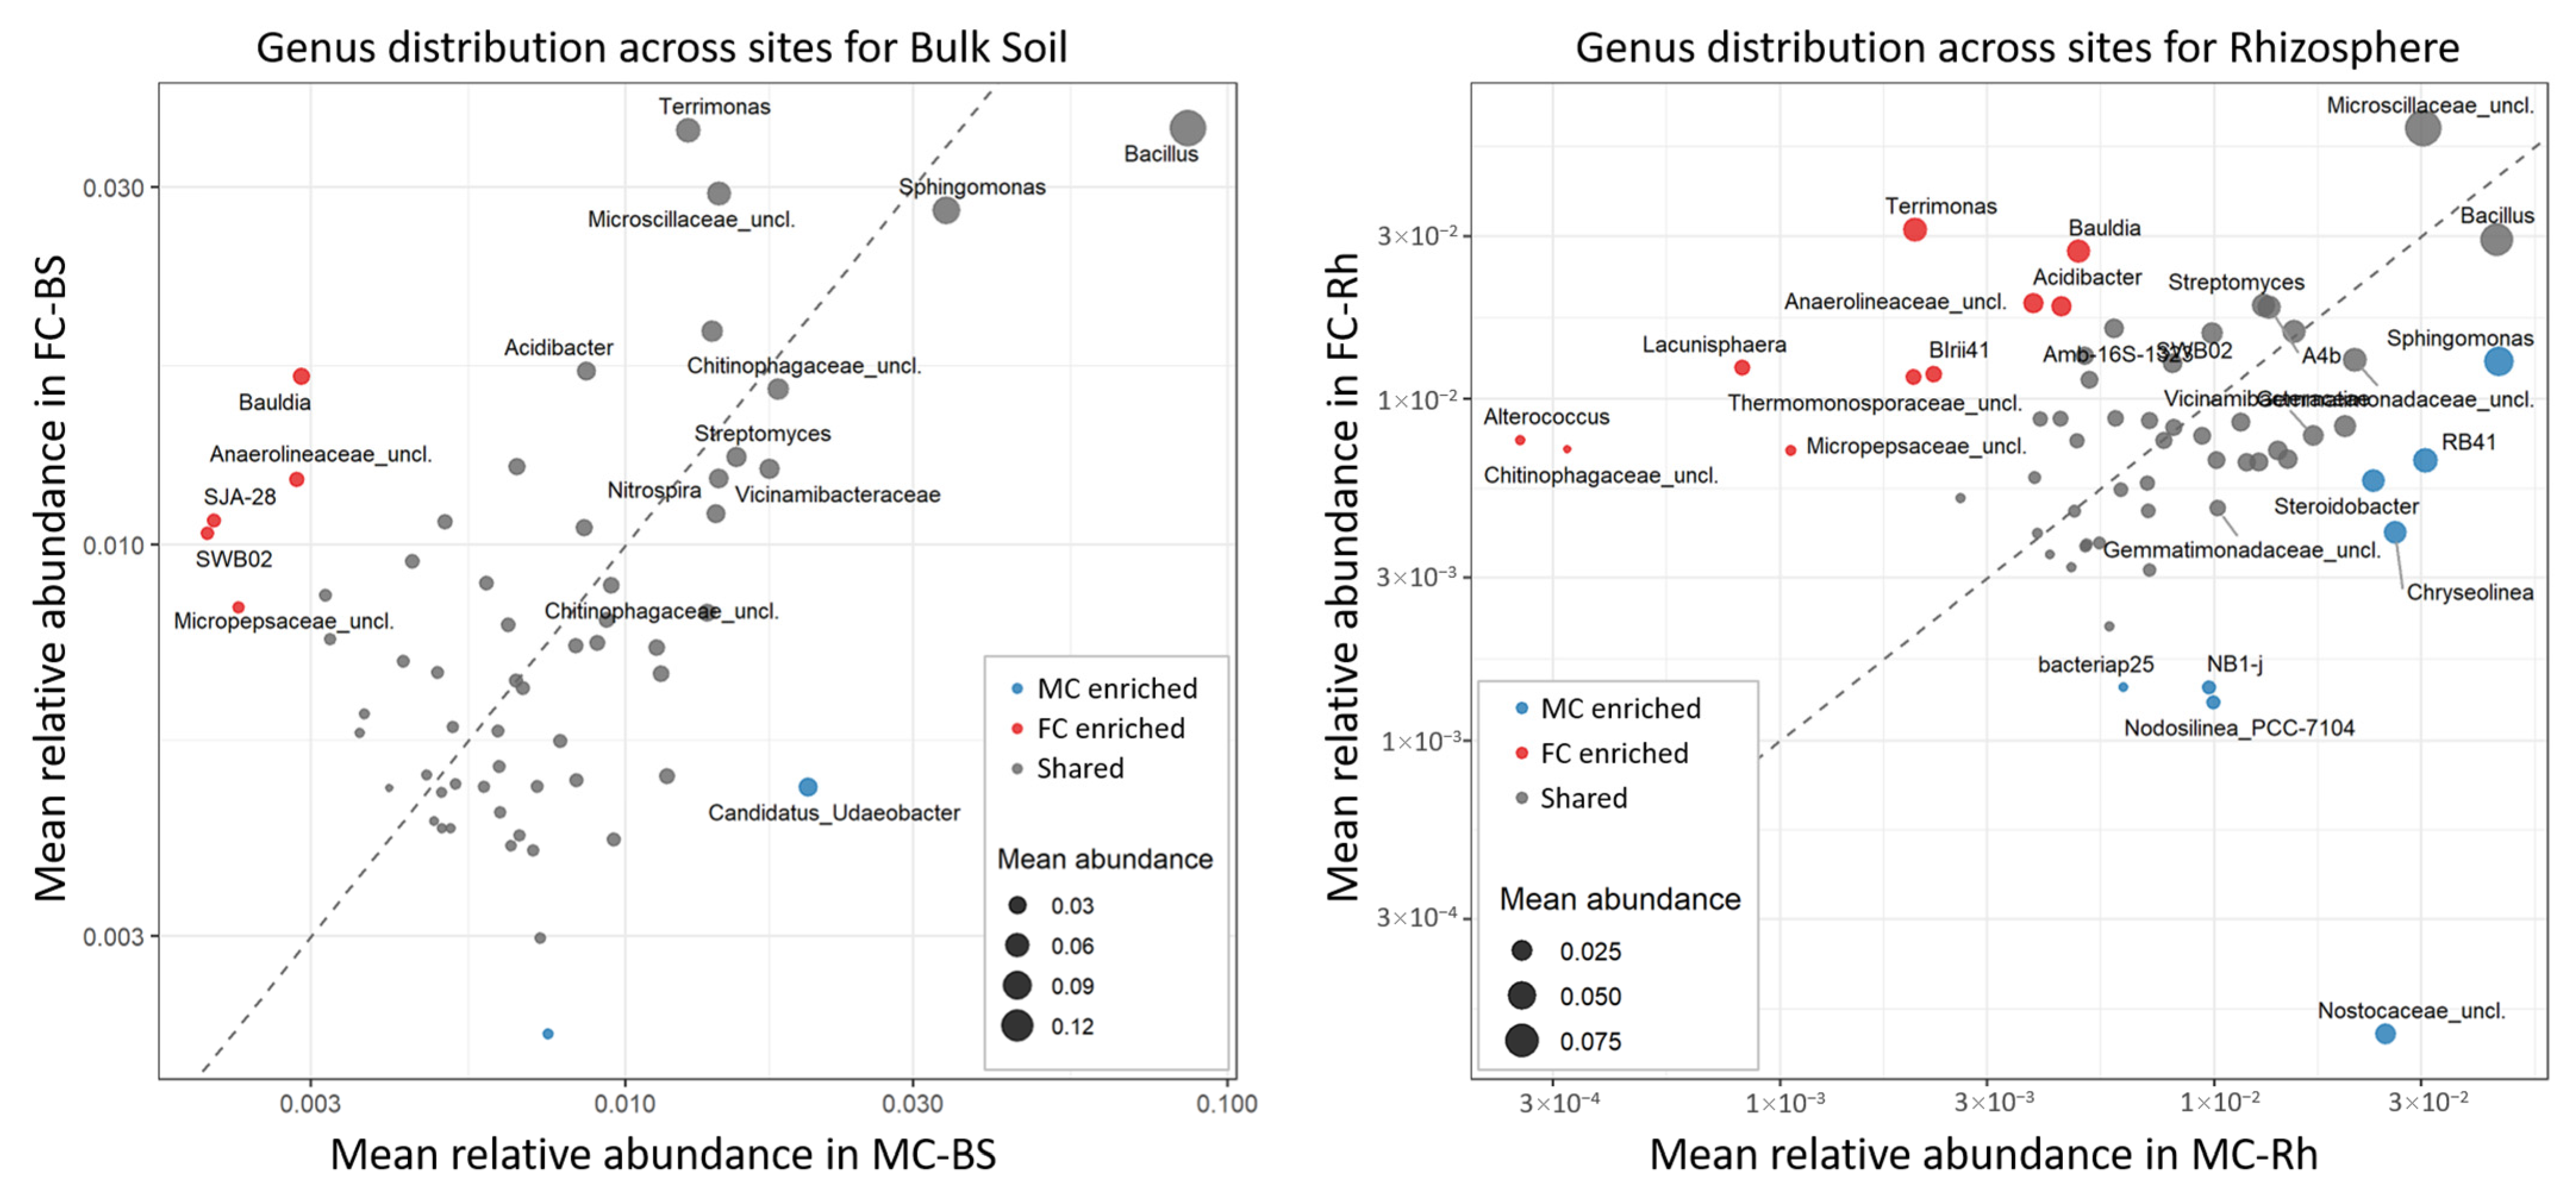
The distribution of dominant genera between microhabitats and sites showed that most taxa were broadly shared across conditions and differed mainly in their relative abundances (Figure 4).
Within each microhabitat, most dominant genera were shared between sites and differed mainly in their relative abundances rather than in strict site-specific occurrence (Figure 4). In BS, only a small number of genera showed clear site-associated enrichment, with a limited set of taxa displaying higher relative abundances in FC and very few enriched in MC. In contrast, Rh communities exhibited more pronounced site-associated shifts, with several genera enriched in FC and a smaller subset enriched in MC. Consistent with this pattern, exploratory comparisons performed at the global microhabitat and site levels revealed that the majority of dominant genera were similarly distributed across conditions, with only a limited number of enriched taxa (Supplementary Figure S13).
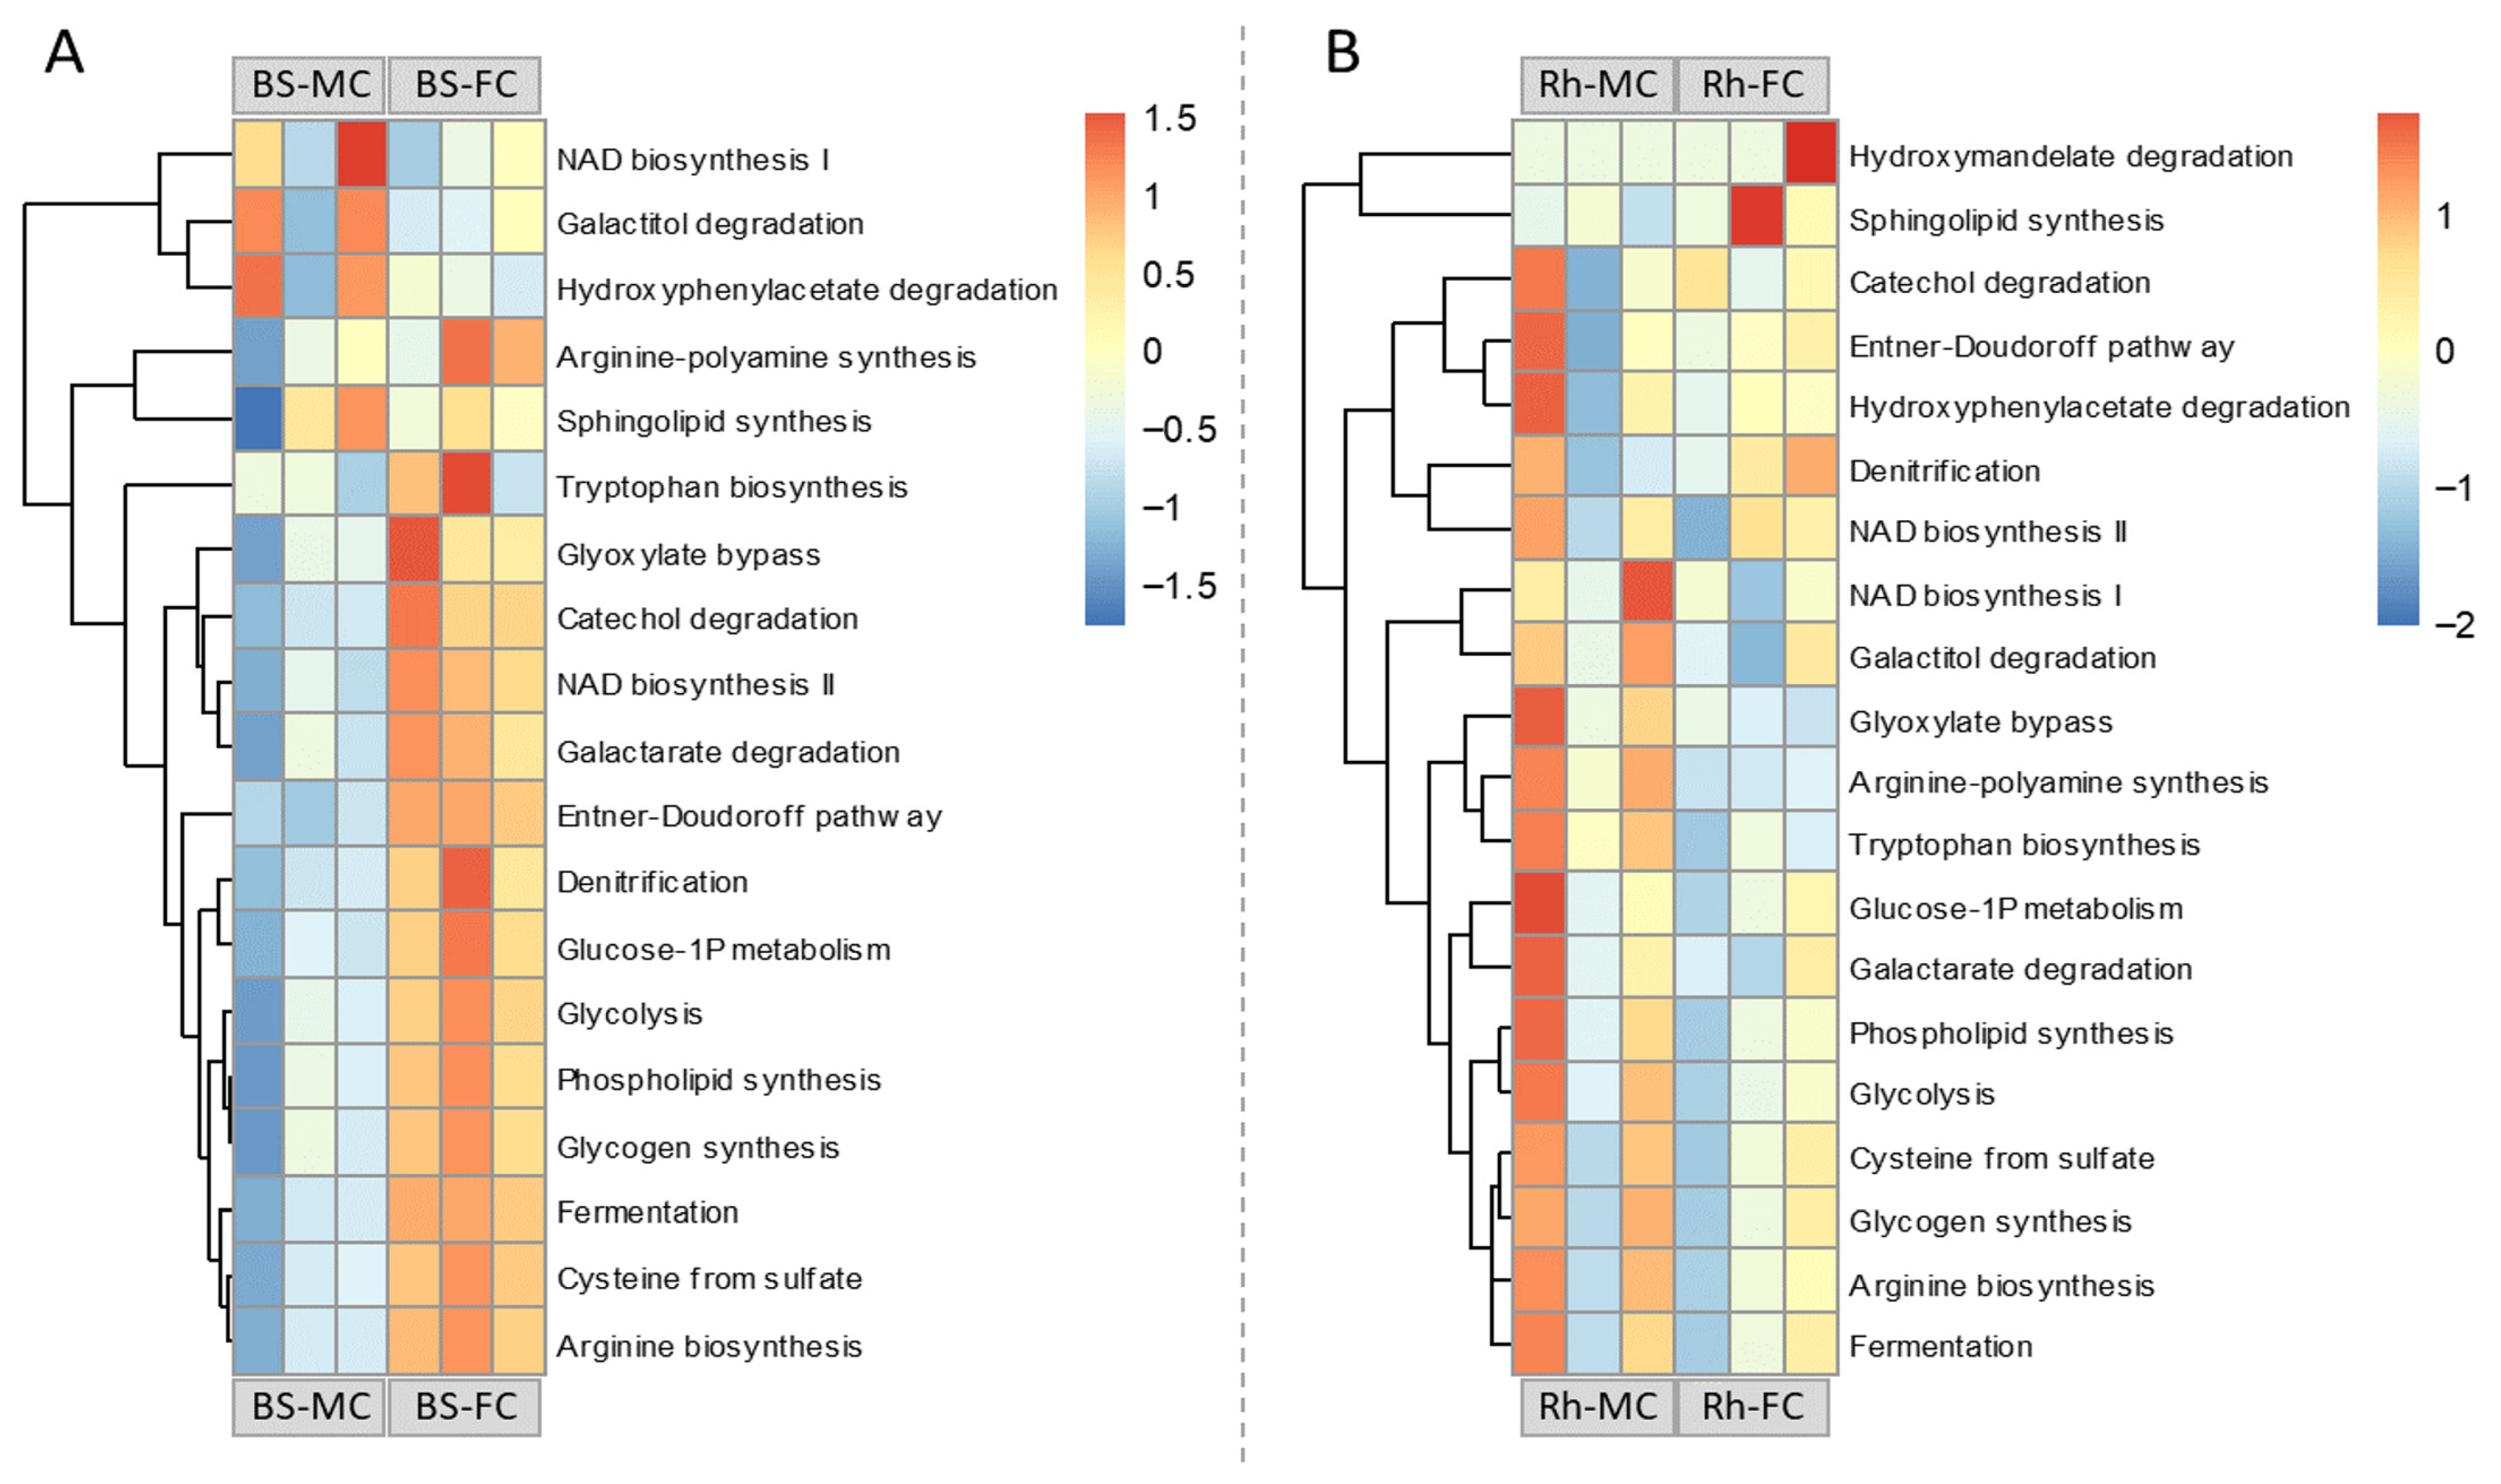
Functional alpha diversity based on predicted MetaCyc pathways did not differ significantly between sites or microhabitats (p > 0.05; Supplementary Table S13). Functional community structure inferred from predicted pathways also showed no significant differences when sites or microhabitats were considered individually; however, a significant Site × Microhabitat interaction was detected, with homogeneous dispersion among groups (PERMANOVA, p = 0.036; PERMDISP, p > 0.05; Supplementary Table S12). Overall, predicted functional profiles were broadly similar across samples. Examination of selected ecologically relevant pathways revealed a tendency for several functions to exhibit higher predicted abundances in BS-FC compared to BS-MC, whereas patterns in the rhizosphere were less consistent across sites (Figure 5).

3.4. Fingerprint of N2-Fixing and Phosphate-Mineralizing Bacterial Communities

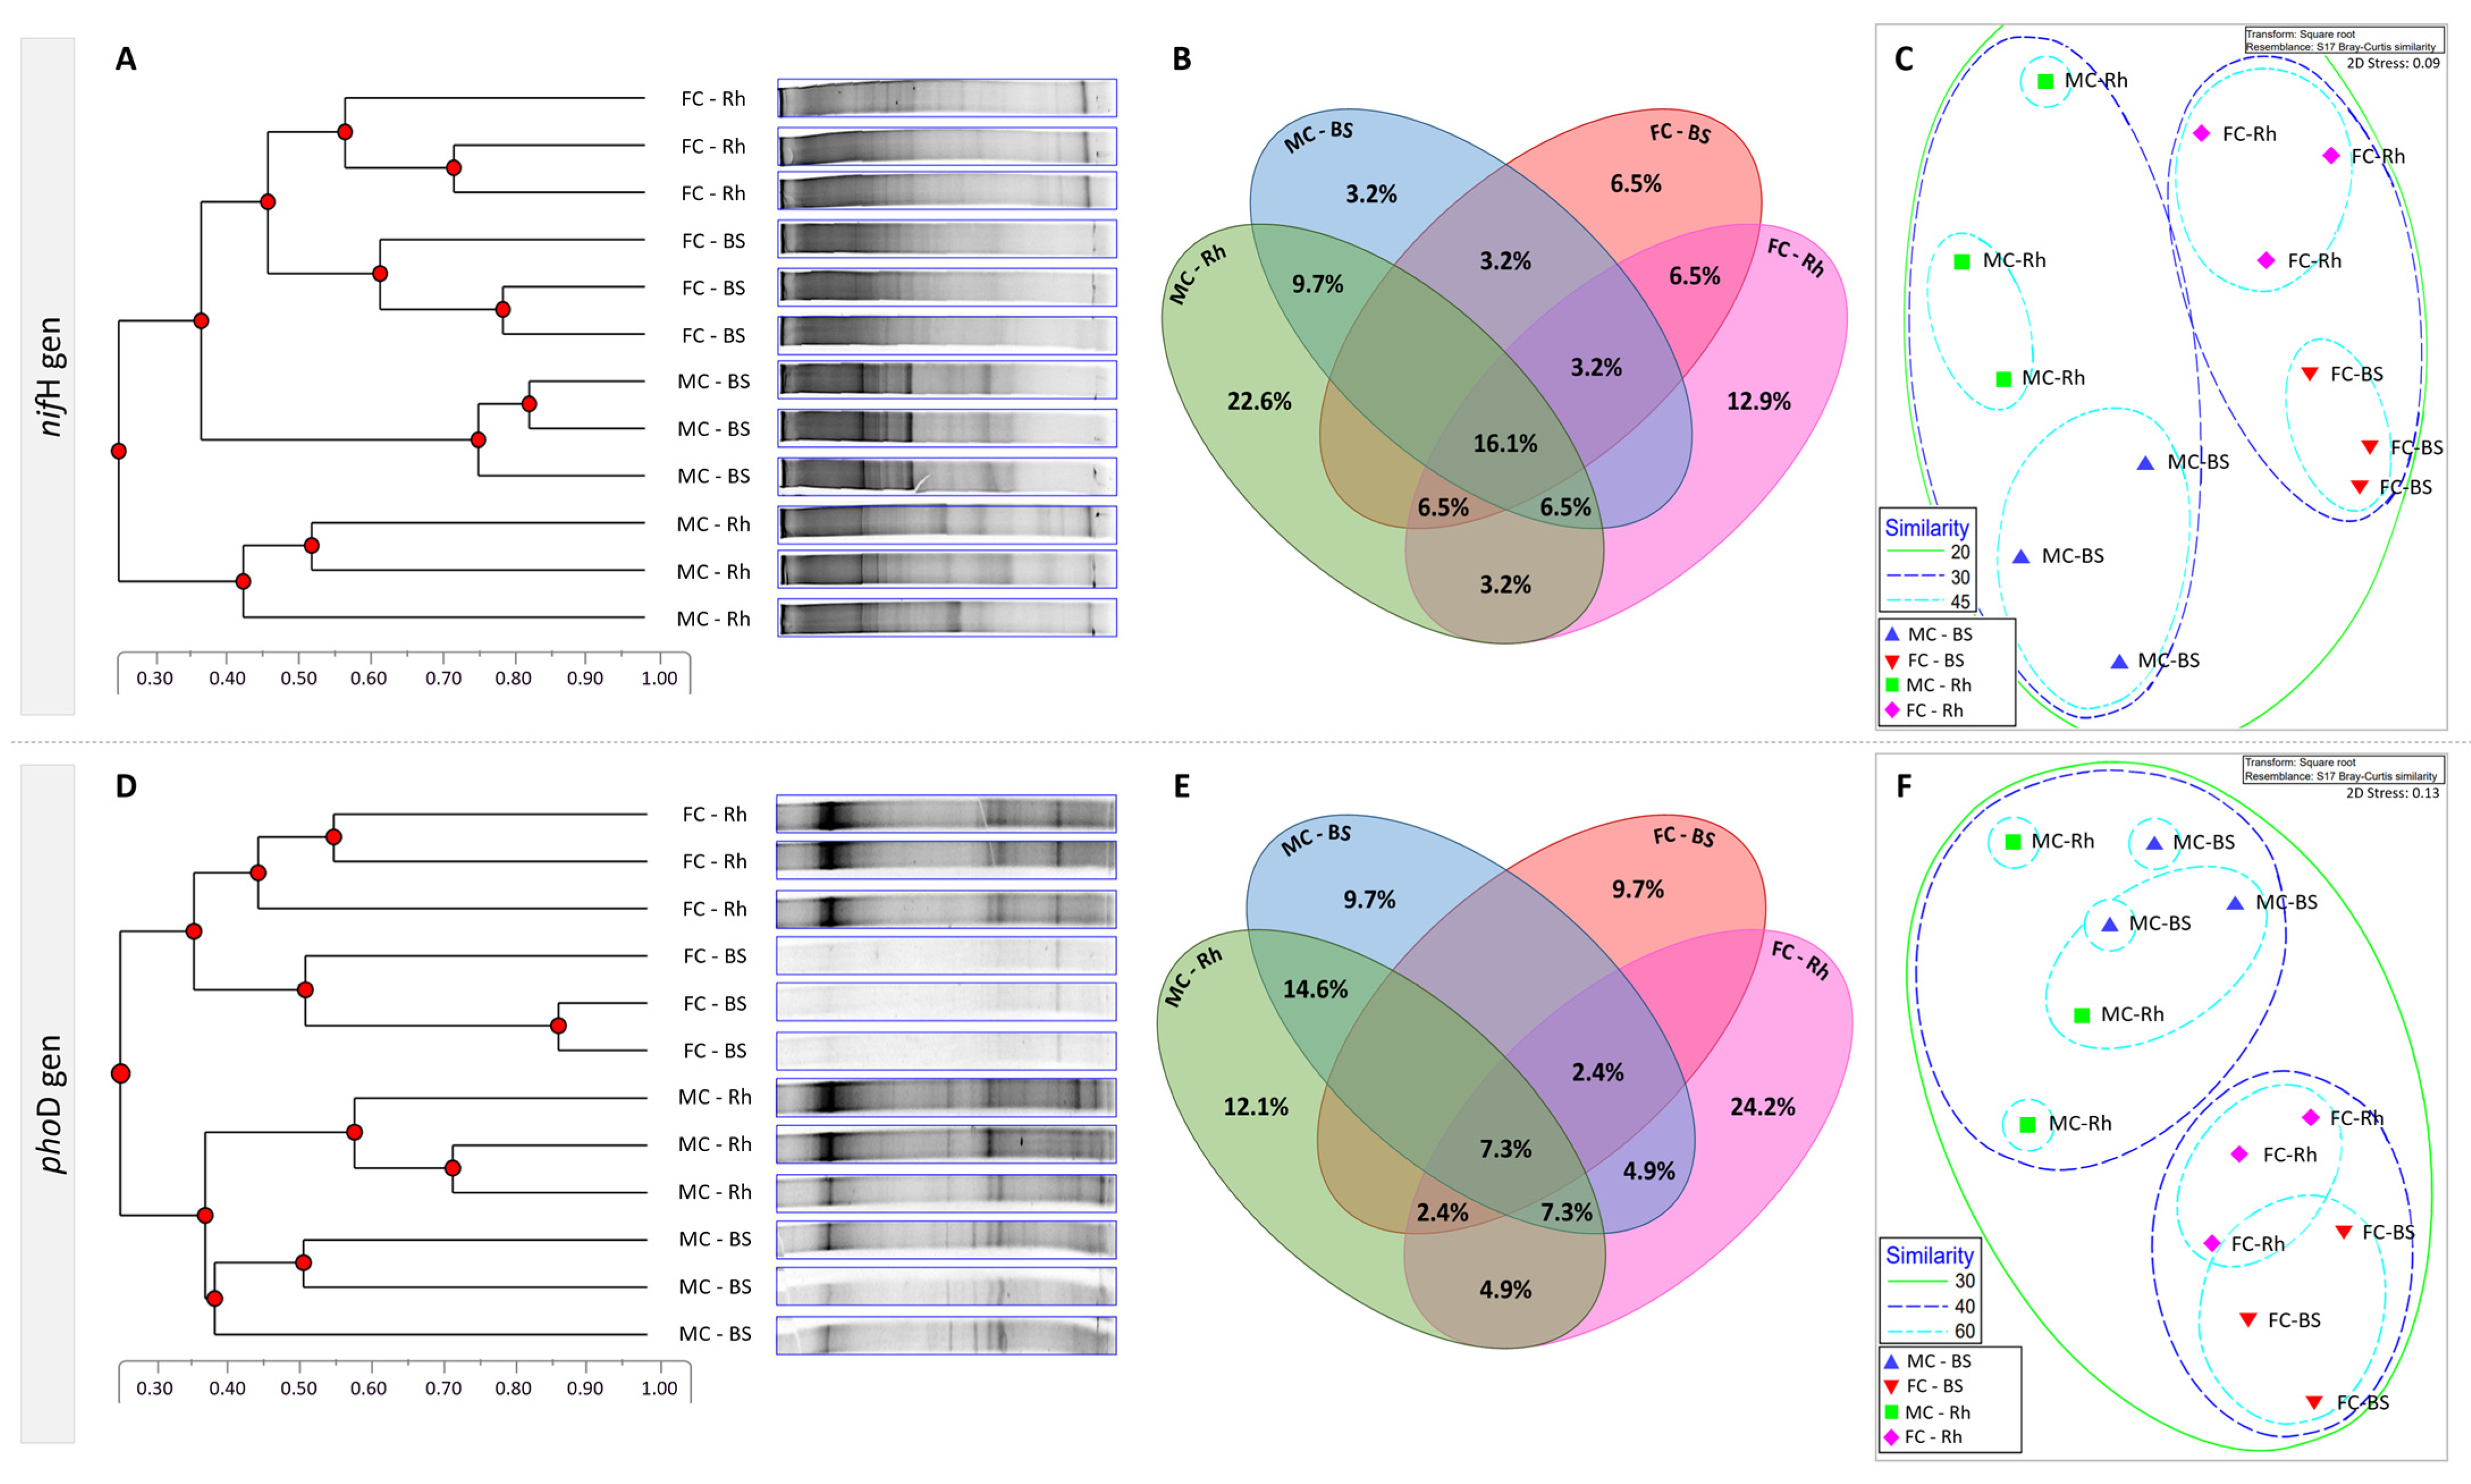
DGGE fingerprinting of nifH- and phoD-harbouring bacterial communities revealed clear differences in functional gene composition between the two horticultural sites (MC and FC; Figure 6).
Cluster analysis showed that samples grouped primarily according to site for both functional genes (Figure 6A,D). For nifH, BS and Rh samples from each site formed distinct clusters, separating MC and FC communities at approximately 30% similarity (Figure 6A). A comparable pattern was observed for phoD, with samples from both sites separating at approximately 40% similarity (Figure 6D). Ordination analysis based on Bray–Curtis similarity supported these patterns (Figure 6C,F). The nMDS plot of nifH profiles showed a clear separation between sites and an additional differentiation between BS and Rh samples within each site. In contrast, phoD DGGE profiles were primarily structured by site, with substantial overlap between BS and Rh communities. SIMPROF analysis confirmed that these clusters were statistically significant (p ≤ 0.05), and the low stress values (≤0.15) indicated a good representation of the similarity relationships among samples. Venn diagrams further illustrated the distribution of DGGE band positions across sample types, revealing both shared and site-specific bands for nifH and phoD functional gene profiles (Figure 6B,E).
Diversity indices calculated from DGGE banding patterns revealed contrasting patterns between functional gene profiles and sites (Table 6). For nifH-harbouring communities, Richness (S) of nifH-associated communities was significantly influenced by both site and microhabitat, with higher richness observed in MC compared to FC, and in the rhizosphere compared to bulk soil. In contrast, inverse Simpson diversity (1/D) was significantly affected by site, with higher values in FC than in MC, while no significant effect of microhabitat was detected for this index. Shannon diversity (H) did not show significant differences across sites or microhabitats. Richness (S) of phoD-associated communities was significantly affected by both site and microhabitat, with higher richness observed in MC compared to FC, and in the rhizosphere compared to bulk soil. Shannon diversity (H) was also significantly influenced by both site and microhabitat, showing higher values in MC than in FC and in the rhizosphere relative to bulk soil. Inverse Simpson diversity (1/D) was significantly affected by site, with higher values in MC compared to FC, while no significant effect of microhabitat was detected for this index. No significant site × microhabitat interactions were detected for any diversity index.

3.5. Integrated Multivariate Analysis of Bacterial Abundance, Diversity, and Potential Functional Traits

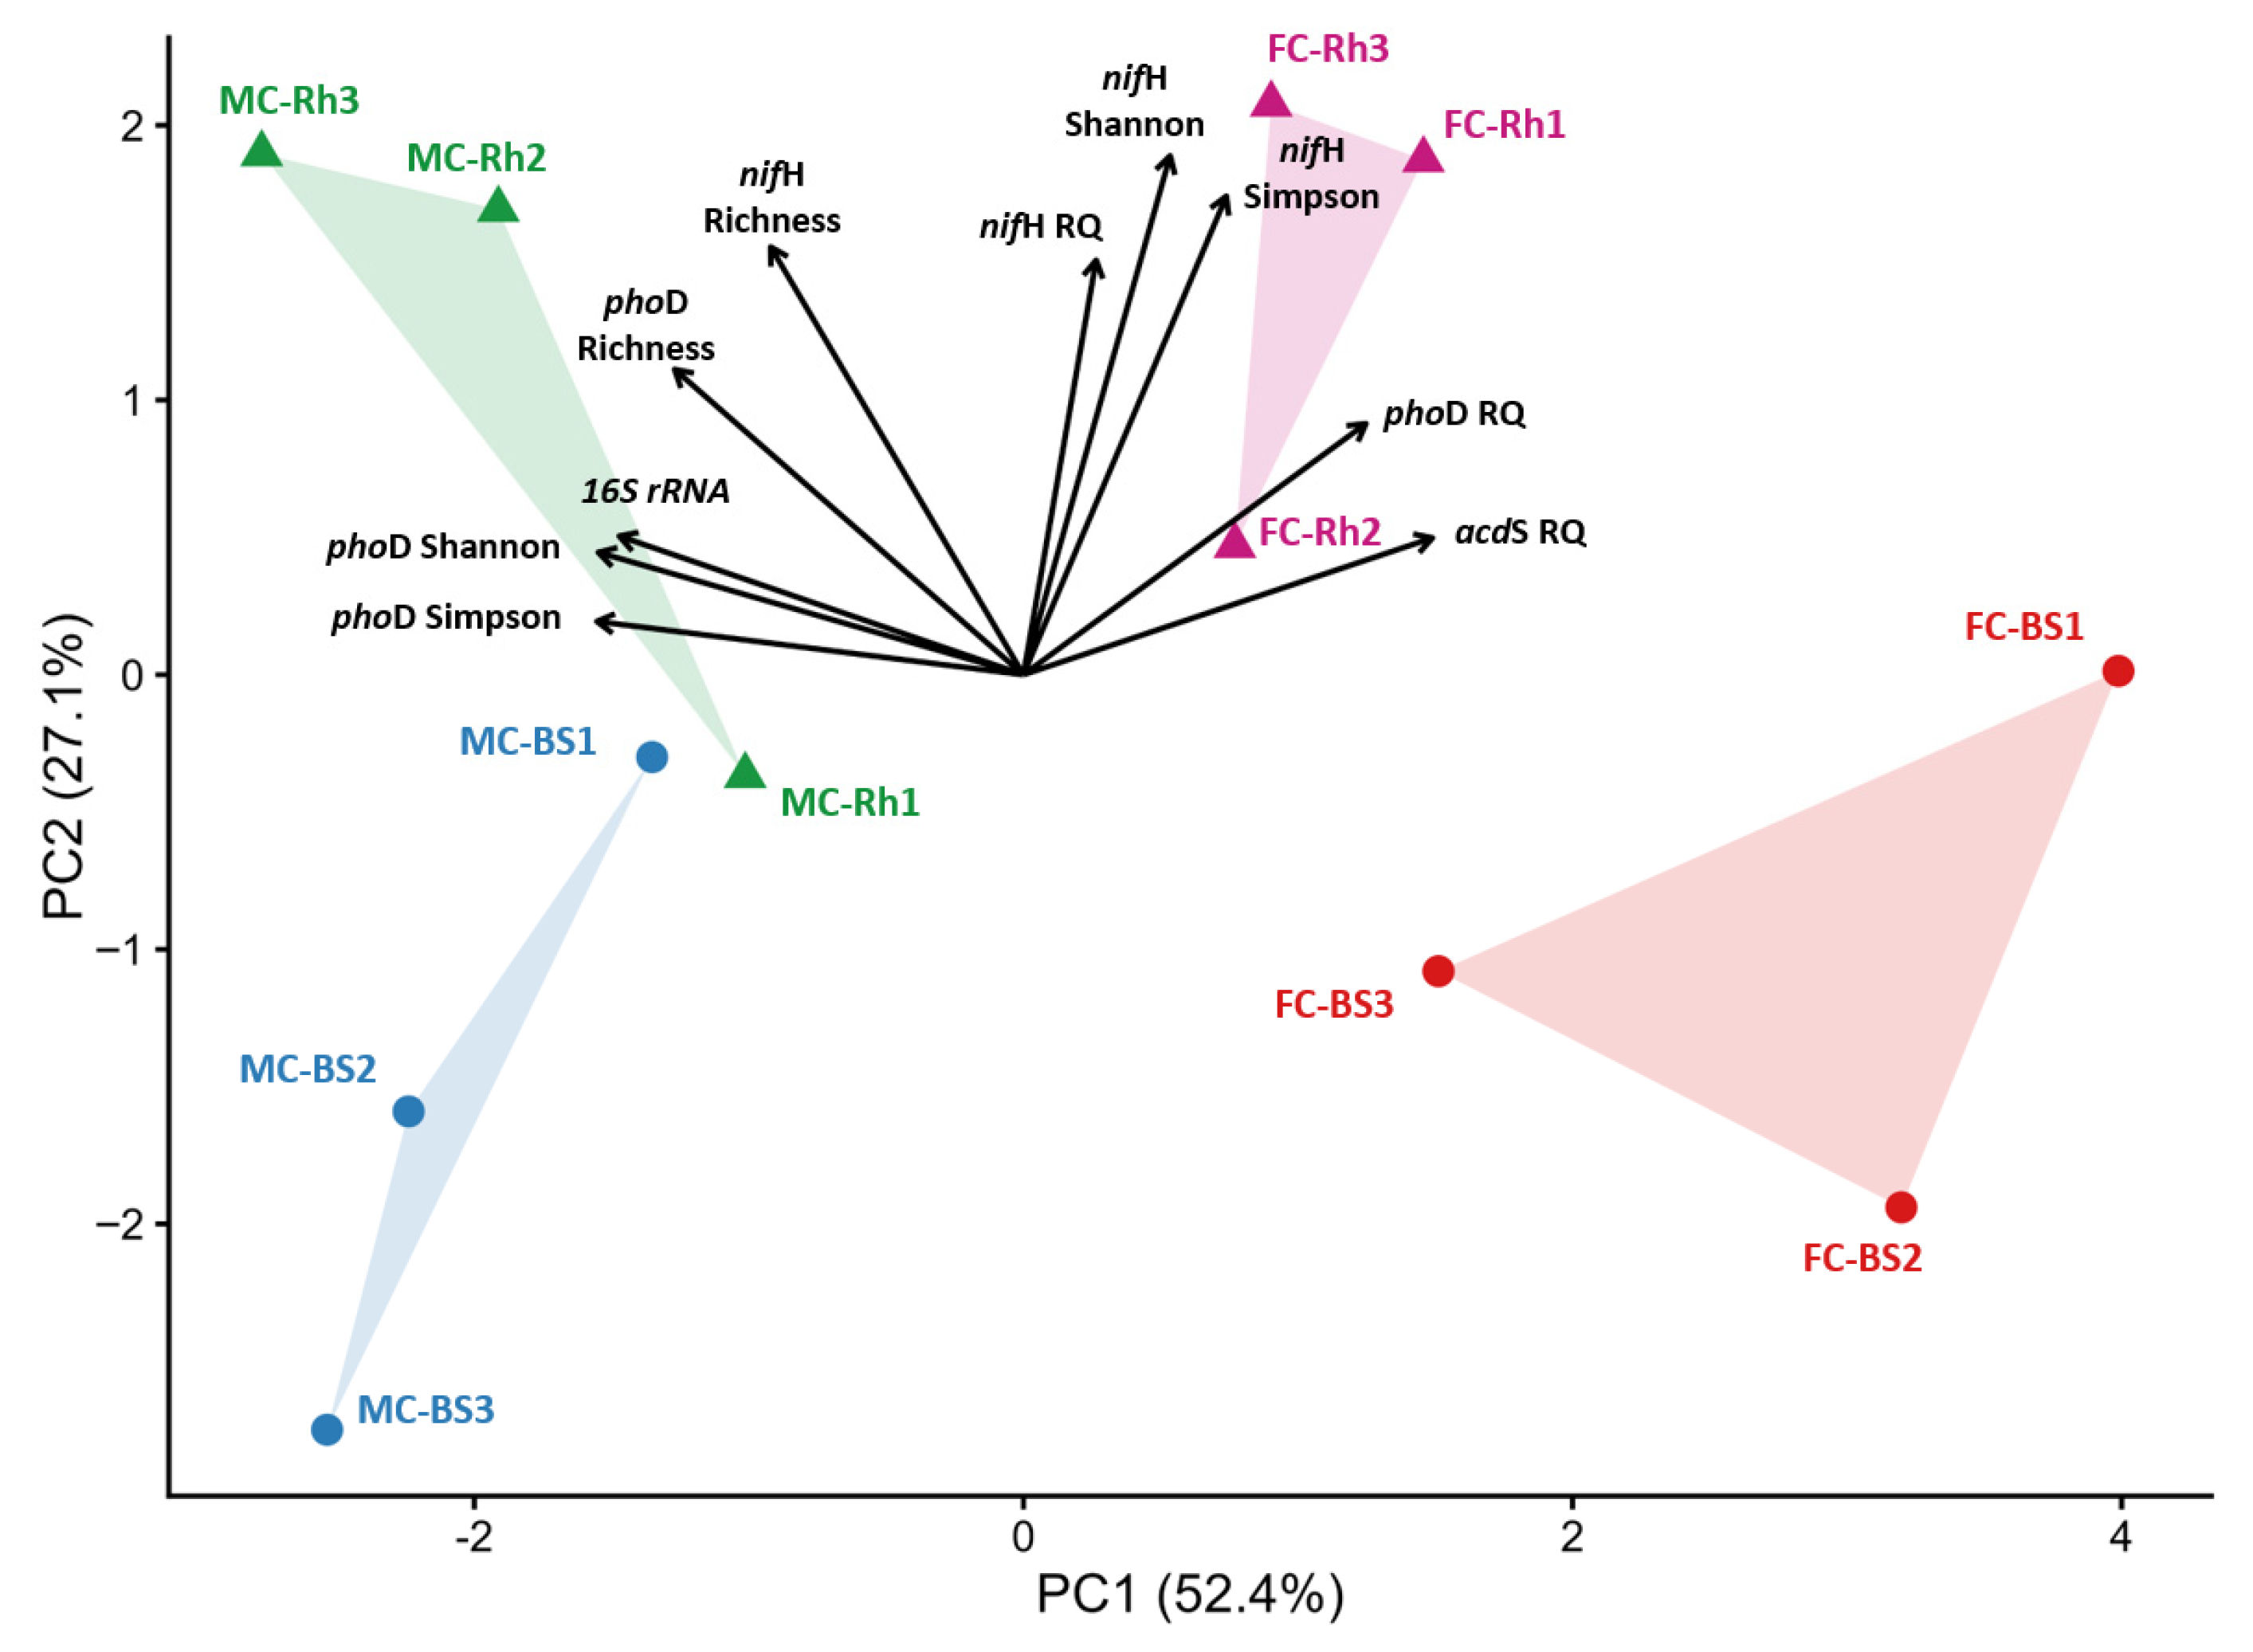
A principal component analysis (PCA) was performed to integrate the variables obtained from qPCR and DGGE analyses, including total bacterial abundance (16S rRNA gene copy number), relative abundance (RQ) of plant-growth-promoting functional genes (nifH, phoD, and acdS), and diversity indices of nifH and phoD functional gene profiles (Figure 7).
The first two principal components explained 79.5% of the total variance (PC1 = 52.4%, PC2 = 27.1%). Along PC1, samples were primarily separated according to horticultural management history. Samples from the long-term monoculture (MC) were located on the positive side of the axis, whereas samples from the first tomato crop (FC) system were positioned on the negative side. Variables contributing positively to PC1 included total bacterial abundance (16S rRNA gene copy number) and diversity indices of phoD and nifH functional gene profiles, particularly richness and Shannon diversity. In contrast, higher values of the relative abundance of acdS, phoD, and nifH genes were associated with the negative side of the axis. The second principal component (PC2) showed separation between bulk soil (BS) and rhizosphere (Rh) samples. Rh samples were positioned towards positive PC2 values and were associated with diversity and relative abundance metrics of DGGE-based nifH profiles, whereas BS samples were generally distributed towards negative values of the axis.

4. Discussion

Before discussing ecological implications, it is important to define the scope and limitations of the approaches used. All inferences are based on three independent greenhouse-level replicates per site (MC vs. FC) and should be interpreted within this experimental scale. In addition, soil physicochemical properties were determined from composite samples per site and are therefore presented as a descriptive characterization rather than as statistically supported differences. Functional metrics—including gene abundance (qPCR), DGGE-based functional gene fingerprinting, and pathway predictions derived from 16S rRNA gene data—represent inferred functional potential rather than realized activity. In particular, PICRUSt2-derived profiles provide indirect estimates based on taxonomic composition and should be interpreted with caution due to potential functional redundancy and database-related biases. Although DGGE offers lower taxonomic resolution than sequencing-based approaches, it remains a robust tool for comparative analysis of functional gene community profiles. Accordingly, the patterns described below reflect relative changes in inferred functional potential and functional gene distribution rather than direct measurements of ecosystem processes.

4.1. Long-Term Horticultural Management Reshapes Soil Properties and Microbial Community Assembly

Long-term horticultural management has been associated with changes in soil physicochemical conditions, including nutrient accumulation, salinization, and shifts in organic matter dynamics, which can influence microbial biomass and community structure, although not necessarily through large-scale taxonomic turnover [45,46]. In line with these reported patterns, the monoculture site (MC) exhibited higher values of electrical conductivity, nutrient availability, and organic matter content [47], and supported higher total bacterial abundance, consistent with patterns typically observed in resource-enriched environments. At the same time, the elevated electrical conductivity observed in MC may impose osmotic constraints on microbial communities [48]. Thus, the MC system appears to reflect the coexistence of potentially antagonistic drivers, in which resource enrichment may favor microbial growth whereas salinity-related stress may limit it. The observed abundance patterns are therefore more likely explained by the combined and potentially opposing influence of multiple environmental factors rather than by a single dominant driver.
Despite these environmental differences, site effects on alpha diversity were modulated by microhabitat (Table 5). Richness and phylogenetic diversity showed significant site × microhabitat interactions, with differences between bulk soil and rhizosphere observed only in FC, whereas MC exhibited comparable diversity across microhabitats. Beta-diversity analyses further showed a clear separation between microhabitats, while the effect of site remained secondary (Figure 2). These patterns were robust to the exclusion of low-prevalence and low-abundance ASVs, indicating that the observed differences are driven by consistent shifts in prevalent community members rather than rare taxa. Differential abundance analyses further supported this pattern (Figure 3): FC was enriched in taxa associated with oligotrophic conditions (e.g., Chloroflexi), whereas MC favored taxa linked to nutrient-enriched environments (e.g., Methylomirabilota) [49,50,51]. Similar patterns were observed in the rhizosphere, where FC retained taxa associated with complex carbon utilization (e.g., Acidobacteriota and Verrucomicrobiota), while MC favored nutrient-responsive groups. Additionally, the Proteobacteria-to-Acidobacteria ratio also differed between sites, suggesting shifts in trophic balance between management regimes. Changes in the relative abundance of these phyla have been linked to land-use and environmental gradients, although their interpretation may vary depending on edaphic context [52,53].
Functional attributes showed stronger sensitivity to management than taxonomic composition. In the present study, differences in the relative abundance of plant-growth-promoting genes and in functional gene composition (Table 4 and Figure 6) suggest that functional potential divergence arises from selective amplification within a shared taxonomic pool rather than from taxonomic replacement, consistent with previous observations [54]. This was reflected in the distribution of potential functional traits, with nitrogen fixation and phosphorus mobilization enriched in the rhizosphere but more spatially constrained in MC than in FC (Figure 6 and Table 6).
Together, these results indicate that long-term management may be associated with persistent differences in soil microbial communities, consistent with the influence of historical management on current community patterns. Under monoculture, community organization was associated with taxa characteristic of nutrient-enriched conditions and with a more spatially restricted distribution of key functional gene-based traits, whereas the less intensively managed site retained taxa linked to oligotrophic strategies and complex carbon turnover, together with a more even distribution of inferred functional potential. Under this environmental context, the rhizosphere imposes strong selective pressures but does not fully offset these site-associated differences, indicating that plant-driven assembly operates on a community conditioned by prior land-use context. This interpretation is consistent with abundance-driven community reconfiguration in soils [55] and plant-mediated assembly processes described for tomato systems [20], supporting an interpretation in which management is associated with reorganization of community structure and inferred functional potential without extensive taxonomic turnover [20,24,56].

4.2. Microhabitat-Driven Assembly of Soil Bacterial Communities

Microhabitat differentiation was the main driver of bacterial community structure, exceeding the effect of long-term management. The rhizosphere imposes strong selective pressures through root exudation and localized nutrient gradients, promoting the recruitment of specialized microbial assemblages [57,58].
In this study, total bacterial abundance did not differ between microhabitats (Figure 1), alpha diversity was consistently higher in bulk soil, whereas the rhizosphere exhibited reduced diversity and evenness (Table 5), consistent with plant-driven ecological selection. Beta-diversity analyses revealed a clear separation between microhabitats, which consistently explained a larger proportion of variance than site across all distance metrics (PERMANOVA R2; Figure 2). Stronger differentiation under Bray–Curtis compared to weighted UniFrac indicates that this separation is primarily driven by shifts in relative abundances within phylogenetically related groups rather than taxonomic turnover. These patterns were robust across filtering approaches, confirming that they reflect changes in prevalent taxa.
Microhabitat also influenced inferred functional potential. Higher abundances of nifH and phoD genes in the rhizosphere (Figure 1), together with microhabitat-specific clustering (Figure 6), indicate enrichment of functional gene markers related to nutrient acquisition and plant interaction [59]. This was accompanied by shifts in functional gene composition, consistent with coordinated taxonomic and functional selection during rhizosphere assembly [60]. In parallel, PICRUSt2 predictions indicated enrichment of pathways associated with labile carbon utilization and rapid energy turnover (Figure 5), consistent with the availability of root-derived substrates [61].
Although consistent across sites, the rhizosphere effect differed in magnitude and expression. It was more pronounced in FC in terms of diversity reduction, consistent with differences in the underlying microbial pool available for rhizosphere filtering, as local community assembly is constrained by the composition of the regional species pool [62]. In contrast, in MC this effect was primarily reflected as a spatial concentration of functional gene-based traits, suggesting a greater dependence on host-driven processes. Together, these results support a hierarchical model in which the rhizosphere reorganizes communities from a shared soil reservoir, with plant-driven selection outweighing edaphic legacy [18,23].

4.3. Differential Structuring of Taxonomic and Functional Potential Dimensions

Microbial communities showed high taxonomic overlap across sites and microhabitats (Figure 3 and Figure 4), indicating that differences were driven primarily by shifts in relative abundance rather than species turnover. This supports a reconfiguration framework in which communities retain a conserved taxonomic backbone while adjusting their internal structure in response to environmental filtering [55,63].
Within this framework, functional patterns inferred from gene abundance and pathway predictions did not fully mirror the relatively stable taxonomic structure. While bacterial abundance and community composition showed limited variation, potential functional indicators—including plant-growth-promoting gene abundance (Figure 1 and Table 4), DGGE-based functional gene composition (Figure 6 and Table 6), and predicted pathway profiles (Figure 5)—displayed clearer differentiation between sites. This suggests that functional divergence may arise through abundance redistribution within a shared taxonomic pool rather than through extensive taxonomic replacement. Multivariate analyses exploratorily summarized this pattern (Figure 7), with management associated with variation in inferred functional potential along the primary axis, while microhabitat contributed to secondary variation.
These patterns may be interpreted in the context of functional redundancy in soil microbiomes, where environmental filtering may modulate the relative abundance and inferred contribution of functional groups rather than replacing taxa [58]. From a mechanistic perspective, they reflect a trade-off between resource availability and representation of functional-gene-based traits: in nutrient-enriched systems, reduced reliance on microbial nutrient acquisition is associated with lower relative abundance of these functional markers, whereas in less intensive systems these markers are maintained or enriched [64,65].

4.4. Implications for Microbial Functioning and Agroecosystem Sustainability in Intensive Horticulture

This study suggests that horticultural intensification is associated with shifts in inferred microbial functional potential primarily through changes in functional gene distribution rather than major taxonomic restructuring. Despite punctual differences in soil physicochemical properties associated with management history—such as increased electrical conductivity and salinity—bacterial communities maintained a relatively stable taxonomic structure. This indicates that long-term intensive practices may influence soil physicochemical conditions more strongly than microbial composition, highlighting the relative compositional stability of the soil microbiome under contrasting environmental conditions [20,62].
Ecologically, this pattern reflects a shift in the balance between microbiome-mediated processes and external inputs. In resource-enriched systems, reduced dependence on microbial nutrient acquisition is associated with lower relative abundance of functional gene markers such as nitrogen fixation and phosphorus mobilization, whereas in less intensive systems these markers are maintained or enhanced due to greater ecological demand. This suggests a stronger contribution of input-driven nutrient cycling under intensive management. Such patterns are often interpreted as indicative of functional redundancy, where ecosystem processes may be maintained despite shifts in community composition [8], although this was not directly assessed in the present study. However, changes in the distribution of inferred functional potential could affect their responsiveness under reduced inputs or environmental stress.
These findings highlight the importance of maintaining microbial functional potential—particularly nutrient cycling and plant–microbe interaction traits—for sustainable horticulture. Future work should move beyond potential-based inferences to directly assess microbial activity and its linkage to ecosystem processes and plant performance, enabling a more mechanistic understanding of how management shapes microbiome function in agroecosystems [49,66,67].

5. Conclusions

This study indicates that microhabitat (bulk soil and rhizosphere soil), rather than management, was the primary factor shaping bacterial taxonomic structure, with patterns consistent with rhizosphere filtering acting on a shared taxonomic pool. Despite edaphic differences, taxonomic structure remained largely conserved, suggesting reconfiguration rather than turnover. In contrast, inferred functional potential was more strongly shaped by management, with reduced plant-growth-promoting genes under intensive long-term monoculture. These results support a partial divergence between taxonomic structure and inferred functional potential in soil microbiomes under contrasting management regimes. Under the conditions evaluated, horticultural intensification was associated with shifts in microbial functional potential inferred from gene-based approaches without major changes in taxonomic structure, with potential implications for agroecosystem functioning as inferred from these functional proxies, although these patterns should be interpreted within methodological limitations.

Supplementary Materials

The following supporting information can be downloaded at: https://www.mdpi.com/article/10.3390/d18050256/s1, Supplementary Material S1: Microhabitat primarily structures bacterial communities, while management history shapes functional potential in tomato-associated soils.

Author Contributions

Conceptualization, M.F.L. and S.A.V.; methodology, M.F.L. and S.A.V.; formal analysis, S.A.V. and M.F.L.; investigation, S.A.V. and J.R.; data curation, S.A.V., J.R. and M.F.-L.; writing—original draft preparation, S.A.V. and J.R.; writing—review and editing, S.A.V., M.P., M.A.J., M.F.-L. and M.F.L.; visualization, S.A.V.; supervision, M.A.J., M.P., M.F.-L. and M.F.L.; project administration, M.F.L.; funding acquisition, M.F.L. All authors have read and agreed to the published version of the manuscript.

Funding

This research was funded by the Comisión de Investigaciones Científicas de la Provincia de Buenos Aires (CIC-PBA), La Plata, Argentina (PITAP2017); and the Universidad Nacional de La Plata (UNLP), La Plata, Argentina (X-925). M.A.J. thanks the FONDECYT project (ANID-Chile) no. 1240602.

Data Availability Statement

The original contributions presented in this study are included in the Supplementary Materials. Further inquiries can be directed to the corresponding author.

Acknowledgments

We gratefully acknowledge the Red Latinoamericana de Ciencias Biológicas (RELAB) for financial support through a mobility fellowship that enabled a research stay at the Universidad de La Frontera (Temuco, Chile), where qPCR and DGGE analyses were performed. We also thank COMPO EXPERT for the logistical support that enabled a research stay at the Estación Experimental del Zaidín (CSIC, Granada, Spain), where bioinformatic analyses of 16S rRNA gene sequencing data were conducted.

Conflicts of Interest

The authors declare no conflicts of interest.

Abbreviations

The following abbreviations are used in this manuscript:
AQAbsolute Quantification
BSBulk soil samples
CqQuantification Cycle
DGGEDenaturing gradient gel electrophoresis
FCFirst crop site
MCMonoculture site
PGPBPlant-growth-promoting bacteria
qPCRquantitative PCR
RQRelative Quantification
RhRhizosphere samples

References

  1. Ministerio de Agricultura, Ganadería y Pesca de la Nación (Argentina). Producción de Tomate en Argentina; Gobierno de Argentina: Buenos Aires, Argentina, 2020; Available online: https://www.argentina.gob.ar/sites/default/files/produccion-tomate-argentina-diciembre-2020.pdf (accessed on 20 December 2025).
  2. Barsky, A. El periurbano productivo, un espacio en constante transformación: Introducción al estado del debate, con referencias al caso de Buenos Aires. Scr. Nova 2005, 9, 194. [Google Scholar]
  3. Marzocca, A.; García, M.; Pérez, L. Intensive horticultural practices and soil quality in peri-urban systems. Agronomy 2021, 11, 1234. [Google Scholar] [CrossRef] [Scilit]
  4. Ramos, M.E.; Benítez, E.; García, P.A.; Robles, A.B. Cover crops under different management systems: Effects on soil quality and microbial communities. Agric. Ecosyst. Environ. 2015, 203, 53–62. [Google Scholar] [CrossRef] [Scilit]
  5. Solis, M.; Cappelletti, N.; Bonetto, C.; Franco, M.; Fanelli, S.; Amalvy, J.; Mugni, H. Attenuation of insecticide impact by a small wetland in a stream draining a horticultural basin in Argentina. Sci. Total Environ. 2021, 785, 147317. [Google Scholar] [CrossRef] [Scilit]
  6. Hartmann, M.; Six, J. Soil structure and microbiome functions in agroecosystems. Nat. Rev. Earth Environ. 2023, 4, 4–18. [Google Scholar] [CrossRef] [Scilit]
  7. Ying, D.; Chen, X.; Hou, J.; Zhao, F.; Li, P. Soil properties and microbial functional attributes drive the response of soil multifunctionality to long-term fertilization management. Appl. Soil Ecol. 2023, 192, 105095. [Google Scholar] [CrossRef] [Scilit]
  8. Ling, N.; Wang, T.; Kuzyakov, Y. Rhizosphere microbiome and plant nutrition. Soil Biol. Biochem. 2022, 165, 108537. [Google Scholar] [CrossRef] [Scilit]
  9. Luo, C.; He, Y.; Chen, Y. Rhizosphere microbiome regulation: Unlocking the potential for plant growth. Curr. Res. Microb. Sci. 2024, 8, 100322. [Google Scholar] [CrossRef] [Scilit]
  10. Santoyo, G. Advances in the Plant Microbiome: Rhizosphere, Endosphere, and Phyllosphere. Microorganisms 2025, 13, 2581. [Google Scholar] [CrossRef] [Scilit]
  11. Orozco-Mosqueda, M.C.; Santoyo, G.; Glick, B.R. Recent advances in the bacterial phytopathogen biocontrol and plant growth promotion. Plants 2023, 12, 606. [Google Scholar] [CrossRef] [Scilit]
  12. Adebayo, A.A.; Enagbonma, B.J.; Babalola, O.O. Comparative metagenomics on community structure and diversity of rhizomicrobiome associated with monoculture and soybean precedent carrot. Sci. Rep. 2025, 15, 28161. [Google Scholar] [CrossRef] [Scilit] [PubMed]
  13. Bo, H.; Li, Z.; Jin, D.; Xu, M.; Zhang, Q. Fertilizer management methods affect bacterial community structure and diversity in the maize rhizosphere soil of a coal mine reclamation area. Ann. Microbiol. 2023, 73, 24. [Google Scholar] [CrossRef] [Scilit]
  14. Martins Costa, R.; Lima Costa, M.K.; Barbosa Rocha, S.M.; Lima Leite, M.R.; de Alcantara Neto, F.; Antunes de Souza, H.; Prudencio de Araujo Pereira, A.; Maciel Melo, V.M.; Valente de Medeiros, E.; Mendes, L.W.; et al. Soil management shapes bacterial and archaeal communities in soybean rhizosphere: Comparison of no-tillage and integrated crop–livestock systems. Rhizosphere 2024, 30, 100886. [Google Scholar] [CrossRef] [Scilit]
  15. Wang, P.; Yan, S.; Zhang, W.; Xie, X.; Li, M.; Ren, T.; Gu, L.; Zhang, Z. Effect of soil management systems on the rhizosphere bacterial community structure of tobacco: Continuous cropping vs. paddy–upland rotation. Front. Plant Sci. 2022, 13, 996858. [Google Scholar] [CrossRef] [Scilit]
  16. Gong, B.; He, Y.; Luo, Z.; Peng, H.; Cai, H.; Zhu, Y.; Bin, J.; Ding, M. Response of rhizosphere soil physicochemical properties and microbial community structure to continuous cultivation of tobacco. Ann. Microbiol. 2024, 74, 4. [Google Scholar] [CrossRef] [Scilit]
  17. Xiong, C.; Zhu, Y.-G.; Wang, J.-T.; Singh, B.; Han, L.-L.; Shen, J.-P.; Li, P.-P.; Wang, G.-B.; Wu, C.-F.; Ge, A.-H.; et al. Host selection shapes crop microbiome assembly and network complexity. New Phytol. 2021, 229, 1091–1104. [Google Scholar] [CrossRef] [Scilit]
  18. Schmidt, J.E.; Kent, A.D.; Brisson, V.L.; Gaudin, A.C.M. Agricultural management and plant selection interactively affect rhizosphere microbial community structure and nitrogen cycling. Microbiome 2019, 7, 146. [Google Scholar] [CrossRef] [Scilit] [PubMed]
  19. Anzalone, A.; Di Guardo, M.; Bella, P.; Ghadamgahi, F.; Dimaria, G.; Zago, R.; Cirvilleri, G.; Catara, V. Bioprospecting of beneficial bacteria traits associated with tomato roots in a greenhouse environment reveals that sampling sites have a stronger effect than the root compartment. Front. Plant Sci. 2021, 12, 637582. [Google Scholar] [CrossRef] [Scilit] [PubMed]
  20. Allard, S.M.; Walsh, C.S.; Wallis, A.E.; Ottesen, A.R.; Brown, E.W.; Micallef, S.A. Solanum lycopersicum (tomato) hosts robust phyllosphere and rhizosphere bacterial communities when grown in soil amended with various organic and synthetic fertilizers. Sci. Total Environ. 2016, 573, 555–563. [Google Scholar] [CrossRef] [Scilit]
  21. Vio, S.A.; Paiva González, K.B.; Gortari, M.C.; Galar, M.L.; Pistorio, M.; Luna, M.F. Exploring the Cultivable Fraction of the Bacterial Microbiome from Tomato Plants for Growth-Promoting and Biocontrol Traits Toward Bioinput Development. Agriculture 2026, 16, 610. [Google Scholar] [CrossRef] [Scilit]
  22. Dong, C.J.; Wang, L.L.; Li, Q.; Shang, Q.M. Bacterial communities in the rhizosphere, phyllosphere and endosphere of tomato plants. PLoS ONE 2019, 14, e0223847. [Google Scholar] [CrossRef] [Scilit]
  23. Dong, M.; Kuramae, E.E.; Zhao, M.; Li, R.; Shen, Q.; Kowalchuk, G.A. Tomato growth stage modulates bacterial communities across different soil aggregate sizes and disease levels. ISME Commun. 2023, 3, 104. [Google Scholar] [CrossRef] [Scilit]
  24. Dang, K.; Ji, L.; Slaughter, L.C.; Hou, J.; Shen, M.; Li, J.; Dong, Y. Synergistic changes of rhizosphere bacterial community and soil properties in greenhouse soils under long-term tomato monoculture. Appl. Soil Ecol. 2023, 183, 104738. [Google Scholar] [CrossRef] [Scilit]
  25. Schmidt, J.E.; Vannette, R.L.; Igwe, A.; Blundell, R.; Casteel, C.L.; Gaudin, A.C.M. Effects of agricultural management on rhizosphere microbial structure and function in processing tomato plants. Appl. Environ. Microbiol. 2019, 85, e01064-19. [Google Scholar] [CrossRef] [Scilit] [PubMed]
  26. Soil Survey Staff. Soil Survey Laboratory Methods Manual; Soil Survey Investigations Report No. 51, Version 2; United States Department of Agriculture, Natural Resources Conservation Service: Lincoln, NE, USA, 2014. Available online: https://www.nrcs.usda.gov/sites/default/files/2023-01/SSIR51.pdf (accessed on 11 April 2026).
  27. Redford, A.J.; Bowers, R.M.; Knight, R.; Linhart, Y.; Fierer, N. The ecology of the phyllosphere: Geographic and phylogenetic variability in the distribution of bacteria on tree leaves. Environ. Microbiol. 2010, 12, 2885–2893. [Google Scholar] [CrossRef] [Scilit]
  28. Sakurai, M.; Wasaki, J.; Tomizawa, Y.; Shinano, T.; Osaki, M. Analysis of bacterial communities on alkaline phosphatase genes in soil supplied with organic matter. Soil Sci. Plant Nutr. 2008, 54, 62–71. [Google Scholar] [CrossRef] [Scilit]
  29. Poly, F.; Monrozier, L.J.; Bally, R. Improvement in the RFLP procedure for studying the diversity of nifH genes in soil communities. Res. Microbiol. 2001, 152, 95–103. [Google Scholar] [CrossRef] [Scilit]
  30. Blaha, D.; Prigent-Combaret, C.; Mirza, M.S.; Moënne-Loccoz, Y. Phylogeny of the 1-aminocyclopropane-1-carboxylate deaminase-encoding gene acdS in plant-associated bacteria and development of a PCR assay for its detection. FEMS Microbiol. Ecol. 2006, 56, 455–470. [Google Scholar] [CrossRef] [Scilit]
  31. Takahashi, S.; Tomita, J.; Nishioka, K.; Hisada, T.; Nishijima, M. Development of a Prokaryotic Universal Primer for Simultaneous Analysis of Bacteria and Archaea Using Next-Generation Sequencing. PLoS ONE 2014, 9, e105592. [Google Scholar] [CrossRef] [Scilit]
  32. Bolyen, E.; Rideout, J.R.; Dillon, M.R.; Bokulich, N.A.; Abnet, C.C.; Al-Ghalith, G.A.; Alexander, H.; Alm, E.J.; Arumugam, M.; Asnicar, F.; et al. Reproducible, interactive, scalable and extensible microbiome data science using QIIME 2. Nat. Biotechnol. 2019, 37, 852–857. [Google Scholar] [CrossRef] [Scilit]
  33. Callahan, B.J.; McMurdie, P.J.; Rosen, M.J.; Han, A.W.; Johnson, A.J.A.; Holmes, S.P. DADA2: High-resolution sample inference from Illumina amplicon data. Nat. Methods 2016, 13, 581–583. [Google Scholar] [CrossRef] [Scilit]
  34. Katoh, K.; Standley, D.M. MAFFT multiple sequence alignment software version 7: Improvements in performance and usability. Mol. Biol. Evol. 2013, 30, 772–780. [Google Scholar] [CrossRef] [Scilit]
  35. Price, M.N.; Dehal, P.S.; Arkin, A.P. FastTree 2—Approximately maximum-likelihood trees for large alignments. PLoS ONE 2010, 5, e9490. [Google Scholar] [CrossRef] [Scilit] [PubMed]
  36. Glöckner, F.O.; Yilmaz, P.; Quast, C.; Gerken, J.; Beccati, A.; Ciuprina, A.; Bruns, G.; Yarza, P.; Peplies, J.; Westram, R.; et al. 25 years of serving the community with ribosomal RNA gene reference databases and tools. Nucleic Acids Res. 2020, 48, D69–D76. [Google Scholar] [CrossRef] [Scilit]
  37. Lin, H.; Peddada, S.D. Analysis of compositions of microbiomes with bias correction. Nat. Commun. 2020, 11, 3514. [Google Scholar] [CrossRef] [Scilit]
  38. De Cáceres, M.; Legendre, P. Associations between species and groups of sites: Indices and statistical inference. Ecology 2009, 90, 3566–3574. [Google Scholar] [CrossRef] [Scilit]
  39. R Core Team. R: A Language and Environment for Statistical Computing; R Foundation for Statistical Computing: Vienna, Austria, 2024; Available online: https://www.R-project.org/ (accessed on 10 December 2025).
  40. Douglas, G.M.; Maffei, V.J.; Zaneveld, J.R.; Yurgel, S.N.; Brown, J.R.M.; Taylor, C.M.; Huttenhower, C.; Langille, M.G.I. PICRUSt2 for prediction of metagenome functions. Nat. Biotechnol. 2020, 38, 685–688. [Google Scholar] [CrossRef] [Scilit]
  41. Caspi, R.; Billington, R.; Keseler, I.M.; Kothari, A.; Krummenacker, M.; Midford, P.E.; Ong, W.K.; Paley, S.; Subhraveti, P.; Karp, P.D. The MetaCyc database of metabolic pathways and enzymes—A 2019 update. Nucleic Acids Res. 2020, 48, D445–D453. [Google Scholar] [CrossRef] [Scilit]
  42. Wartiainen, I.; Eriksson, T.; Zheng, W.; Rasmussen, U. Variation in the active diazotrophic community in rice paddy soil. Appl. Environ. Microbiol. 2008, 74, 4884–4892. [Google Scholar] [CrossRef] [Scilit]
  43. Haegeman, B.; Hamelin, J.; Moriarty, J.; Neal, P.; Dushoff, J.; Weitz, J.S. Robust estimation of microbial diversity in theory and in practice. ISME J. 2014, 7, 1092–1101. [Google Scholar] [CrossRef] [Scilit] [PubMed]
  44. di Rienzo, J.A.; Casanoves, F.; Balzarini, M.G.; Gonzalez, L.; Tablada, M.; Robledo, C. Infostat, version 2018; Grupo Infostat, FCA; Universidad Nacional de Córdoba, Argentina: Córdoba, Argentina, 2018. Available online: https://www.infostat.com.ar/ (accessed on 10 November 2022).
  45. Bünemann, E.K.; Schwenke, G.D.; Van Zwieten, L. Impact of agricultural inputs on soil organisms—A review. Soil Res. 2006, 44, 379–406. [Google Scholar] [CrossRef] [Scilit]
  46. Leff, J.W.; Jones, S.E.; Prober, S.M.; Barberán, A.; Borer, E.T.; Firn, J.L.; Harpole, W.S.; Hobbie, S.E.; Hofmockel, K.S.; Knops, J.M.H.; et al. Consistent responses of soil microbial communities to elevated nutrient inputs in grasslands across the globe. Proc. Natl. Acad. Sci. USA 2015, 112, 10967–10972. [Google Scholar] [CrossRef] [Scilit]
  47. Gruszka Vendruscolo, E.C.; Mesa, D. Soil physicochemical and microbiological analysis of greenhouse-tomato under two commercial systems with different levels of production: A metagenomic approach. Rhizosphere 2025, 35, 101122. [Google Scholar] [CrossRef] [Scilit]
  48. Zhang, W.-W.; Wang, C.; Xue, R.; Wang, L.-J. Effects of salinity on the soil microbial community and soil fertility. J. Integr. Agric. 2019, 18, 1360–1368. [Google Scholar] [CrossRef] [Scilit]
  49. Ettwig, K.F.; Butler, M.K.; Le Paslier, D.; Pelletier, E.; Mangenot, S.; Kuypers, M.M.M.; Schreiber, F.; Dutilh, B.E.; Zedelius, J.; de Beer, D.; et al. Nitrite-driven anaerobic methane oxidation by oxygenic bacteria. Nature 2010, 464, 543–548. [Google Scholar] [CrossRef] [Scilit]
  50. Fierer, N. Embracing the unknown: Disentangling the complexities of the soil microbiome. Nat. Rev. Microbiol. 2017, 15, 579–590. [Google Scholar] [CrossRef] [Scilit]
  51. Kielak, A.M.; Barreto, C.C.; Kowalchuk, G.A.; van Veen, J.A.; Kuramae, E.E. The ecology of Acidobacteria: Moving beyond genes and genomes. Front. Microbiol. 2016, 7, 744. [Google Scholar] [CrossRef] [Scilit]
  52. Ho, A.; Di Lonardo, D.P.; Bodelier, P.L.E. Revisiting life strategy concepts in environmental microbial ecology. FEMS Microbiol. Ecol. 2017, 93, fix006. [Google Scholar] [CrossRef] [Scilit]
  53. Kim, J.M.; Roh, A.S.; Choi, S.C.; Kim, E.J.; Choi, M.T.; Ahn, B.K.; Kim, S.K.; Lee, Y.H. Diversity and composition of soil Acidobacteria and Proteobacteria communities as a bacterial indicator of past land-use change from forest to farmland. Sci. Total Environ. 2021, 797, 148944. [Google Scholar] [CrossRef] [Scilit] [PubMed]
  54. Chen, H.; Ma, K.; Lu, C.; Fu, Q.; Qiu, Y.; Zhao, J.; Huang, Y.; Yang, Y.; Schadt, C.W.; Chen, H. Functional redundancy in soil microbial community based on metagenomics across the globe. Front. Microbiol. 2022, 13, 878978. [Google Scholar] [CrossRef] [Scilit] [PubMed]
  55. Hartman, K.; van der Heijden, M.G.A.; Wittwer, R.A.; Banerjee, S.; Walser, J.-C.; Schlaeppi, K. Cropping practices manipulate abundance patterns of root and soil microbiome members paving the way to smart farming. Microbiome 2018, 6, 14. [Google Scholar] [CrossRef] [Scilit] [PubMed]
  56. Louca, S.; Polz, M.F.; Mazel, F.; Albright, M.B.N.; Huber, J.A.; O’Connor, M.I.; Ackermann, M.; Hahn, A.S.; Srivastava, D.S.; Crowe, S.A.; et al. Function and functional redundancy in microbial systems. Nat. Ecol. Evol. 2018, 2, 936–943. [Google Scholar] [CrossRef] [Scilit]
  57. Reinhold-Hurek, B.; Bünger, W.; Burbano, C.S.; Sabale, M.; Hurek, T. Roots Shaping Their Microbiome: Global Hotspots for Microbial Activity. Annu. Rev. Phytopathol. 2015, 53, 403–424. [Google Scholar] [CrossRef] [Scilit]
  58. Rilling, J.I.; Acuña, J.J.; Sadowsky, M.J.; Jorquera, M.A. Putative Nitrogen-Fixing Bacteria Associated with the Rhizosphere and Root Endosphere of Wheat Plants Grown in an Andisol from Southern Chile. Front. Microbiol. 2018, 9, 2710. [Google Scholar] [CrossRef] [Scilit]
  59. Philippot, L.; Raaijmakers, J.M.; Lemanceau, P.; van der Putten, W.H. Going back to the roots: The microbial ecology of the rhizosphere. Nat. Rev. Microbiol. 2013, 11, 789–799. [Google Scholar] [CrossRef] [Scilit]
  60. Bulgarelli, D.; Schlaeppi, K.; Spaepen, S.; van Themaat, E.V.L.; Schulze-Lefert, P. Structure and functions of the bacterial microbiota of plants. Annu. Rev. Plant Biol. 2013, 64, 807–838. [Google Scholar] [CrossRef] [Scilit] [PubMed]
  61. Zhalnina, K.; Louie, K.B.; Hao, Z.; Mansoori, N.; da Rocha, U.N.; Shi, S.; Cho, H.; Karaoz, U.; Loqué, D.; Bowen, B.P.; et al. Dynamic root exudate chemistry and microbial substrate preferences drive patterns in rhizosphere microbial community assembly. Nat. Microbiol. 2018, 3, 470–480. [Google Scholar] [CrossRef] [Scilit]
  62. Vellend, M. Conceptual synthesis in community ecology. Q. Rev. Biol. 2010, 85, 183–206. [Google Scholar] [CrossRef] [Scilit] [PubMed]
  63. Shade, A.; Peter, H.; Allison, S.D.; Baho, D.L.; Berga, M.; Bürgmann, H.; Huber, D.H.; Langenheder, S.; Lennon, J.T.; Martiny, J.B.H.; et al. Fundamentals of microbial community resistance and resilience. Front. Microbiol. 2012, 3, 417. [Google Scholar] [CrossRef] [Scilit]
  64. Acuña, J.J.; Jorquera, M.A.; Martínez, O.A.; Menezes-Blackburn, D.; Fernández, M.T.; Marschner, P.; Greiner, R.; Mora, M.L. Indole Acetic Acid and Phosphatase Activity Produced by Rhizobacteria Affect the Phosphorus Availability in Soil. J. Soil Sci. Plant Nutr. 2016, 16, 360–373. [Google Scholar] [CrossRef] [Scilit]
  65. Malik, A.A.; Puissant, J.; Buckeridge, K.M.; Goodall, T.; Jehmlich, N.; Chowdhury, S.; Gweon, H.S.; Peyton, J.M.; Mason, K.E.; van Agtmaal, M.; et al. Land use driven change in soil pH affects microbial carbon cycling processes. Nat. Commun. 2018, 9, 3591. [Google Scholar] [CrossRef] [Scilit] [PubMed]
  66. van der Heijden, M.G.A.; Bardgett, R.D.; van Straalen, N.M. The unseen majority: Soil microbes as drivers of plant diversity and productivity in terrestrial ecosystems. Ecol. Lett. 2008, 11, 296–310. [Google Scholar] [CrossRef] [Scilit] [PubMed]
  67. Richardson, A.E.; Simpson, R.J. Soil microorganisms mediating phosphorus availability. Plant Physiol. 2011, 156, 989–996. [Google Scholar] [CrossRef] [Scilit] [PubMed]
Figure 1. Absolute abundance of bacterial and functional genes in bulk soil (BS) and rhizosphere (Rh) samples from both sites. Log-transformed gene copy numbers of 16S rRNA, nifH, phoD, and acdS per g of dry-weight soil quantified by qPCR in samples from MC and FC. Different letters indicate significant differences among groups according to Tukey’s post hoc test (p ≤ 0.05).
Diversity 18 00256 g001
Figure 2. Principal coordinate analysis (PCoA) of bacterial community composition based on Bray–Curtis dissimilarities at genus level. Samples correspond to bulk soil (BS) and rhizosphere (Rh) collected from long-term monoculture (MC) and first tomato crop (FC) systems. Ellipses represent 95% confidence intervals for group clustering. The first axis explains 43.4% of the total variation. Insets show ordinations highlighting grouping by microhabitat and horticultural management. PERMANOVA and PERMDISP results are indicated in the panels.
Diversity 18 00256 g002
Figure 3. Taxonomic composition and differentially abundant bacterial taxa across sites within each microhabitat. (A) Relative abundance of dominant bacterial phyla across replicate samples from each site–microhabitat combination (BS–FC, BS–MC, Rh–FC, Rh–MC). Remaining taxa are grouped as “Others”. (B) Bacterial phyla showing significant differential abundance between sites within each microhabitat based on ANCOM-BC log fold change estimates. (C) Relative abundance of dominant bacterial orders across samples. (D) Bacterial orders significantly differing between sites within each microhabitat according to ANCOM-BC. Differential abundance analyses were performed separately for bulk soil (BS) and rhizosphere (Rh), contrasting FC and MC. Positive log fold change values indicate taxa enriched in FC and negative values taxa enriched in MC (FDR-corrected).
Diversity 18 00256 g003
Figure 4. Distribution of dominant bacterial genera across sites within each microhabitat. Scatter plots show the mean relative abundance of bacterial genera detected in bulk soil (left) and rhizosphere (right) samples from long-term monoculture (MC; S1) and first crop (FC; S2) systems. Each point represents a genus, with point size proportional to its mean relative abundance across samples. The dashed diagonal line indicates equal abundance between sites. Genera positioned above the diagonal are relatively more abundant in FC, whereas those below the line are relatively more abundant in MC. Colors indicate genera enriched in MC (blue), enriched in FC (red), or shared between sites (grey). Only dominant genera are displayed for visualization clarity.
Diversity 18 00256 g004
Figure 5. Heatmaps of selected predicted metabolic pathways across site–microhabitat combinations. (A) Bulk soil (BS) and (B) rhizosphere (Rh) samples from long-term monoculture (MC) and first crop (FC) systems. Pathways correspond to selected MetaCyc functions inferred from 16S rRNA gene data using PICRUSt2. Colors represent row-scaled relative abundances (z-scores), highlighting relative differences among samples. Hierarchical clustering was applied to pathways to group functions with similar abundance patterns across samples.
Diversity 18 00256 g005
Figure 6. DGGE-based analysis of nifH- and phoD-harboring bacterial communities in bulk soil (BS) and tomato rhizosphere (Rh) from long-term monoculture (MC) and first tomato crop (FC) horticultural systems. (A,D) Cluster analysis of DGGE banding profiles for nifH (A) and phoD (D) genes using the Bray–Curtis similarity index and UPGMA clustering. Red nodes indicate significant groupings determined by the SIMPROF test (p ≤ 0.05). Representative DGGE gel profiles corresponding to each sample are shown alongside the dendrograms. (B,E) Venn diagrams showing the percentage of DGGE band positions shared among samples for nifH (B) and phoD (E) genes. (C,F) Non-metric multidimensional scaling (nMDS) ordination of DGGE banding patterns for nifH (C) and phoD (F) functional gene profiles based on Bray–Curtis similarity. Stress values are indicated in the plots.
Diversity 18 00256 g006
Figure 7. Principal component analysis (PCA) integrating variables derived from qPCR and DGGE analyses. The ordination includes total bacterial abundance (16S rRNA gene copy number), relative abundance (RQ) of plant-growth-promoting functional genes (nifH, phoD, and acdS), and diversity indices (richness, Shannon, and Simpson) of nifH and phoD functional gene profiles obtained from DGGE. Points represent bulk soil (BS) and tomato rhizosphere (Rh) samples collected from the long-term monoculture (MC) and first tomato crop (FC) horticultural systems. Arrows indicate the direction and magnitude of variable contributions to the ordination space. The percentage of variance explained by each principal component (PC1 and PC2) is shown on the axes.
Diversity 18 00256 g007
Table 1. Primers sequences, qPCR conditions used for the amplification of target genes, and amplification efficiency obtained.
Target GenePrimers (5′–3′)qPCR Cycling ConditionsEfficiency (%)Reference
16S rRNA799f: AACMGGATTAGATACCCKG
1115r: AGGGTTGCGCTCGTTG
94 °C for 1 min; 30 cycles of 94 °C for 1 min, 53 °C for 1 min, 72 °C for 1 min; final extension at 72 °C for 10 min93.3[27]
phoDALPS-F730:
CAGTGGGACGACCACGAGGT
ALPS-R1101:
GAGGCCGATCGGCATGTCG
94 °C for 3 min; 35 cycles of 94 °C for 1 min, 57 °C for 1 min, 72 °C for 2 min; final extension at 72 °C for 7 min96.5[28]
nifHPolF: TGCGAYCCSAARGCBGACTC
PolR: ATSGCCATCATYTCRCCGGA
95 °C for 15 min; 30 cycles of 94 °C for 1 min, 55 °C for 1 min, 72 °C for 1 min; final extension at 72 °C for 10 min104.6[29]
acdSacdSF5: TGCGATGAGAGCGTTTCA
acdSR8: CGTTGCCGTTGTTGTCGTT
95 °C for 3 min; 40 cycles of 95 °C for 15 s, 57 °C for 30 s, 72 °C for 30 s; final extension at 72 °C for 7 min91.8[30]
Table 2. Primers sequences and PCR conditions used for DGGE analysis of functional genes.
Target GenePrimers (5′–3′)PCR ConditionsReference
phoDALPS-F730:
CAGTGGGACGACCACGAGGT
ALPS-R1101-GC:
GAGGCCGATCGGCATGTCG-a
3 min at 94 °C, and 35 cycles at 94 °C for 1 min, 57 °C for 1 min and 72 °C for 2 min, followed by 7 min at 72 °C[28]
nifHPolF:
TGCGAYCCSAARGCBGACTC
PolR-GC:
ATSGCCATCATYTCRCCGGA-b
15 min at 95 °C, and 30 cycles 94 °C for 1 min, 55 °C for 1 min, and 72 °C for 1 min, followed by 10 min at 72 °C[42]
a GCclamp (5′-CGC CCG CCG CGC CCC GCG CCC GTC CCG CCG CCC CCG CCC G-3′) b GCclamp (5′-CGC CCG CCG CGC CCC GCG CCC GGC CCG CCC GAC GAT GTA GAT YTC CTG-3′).
Table 3. Physicochemical bulk soil characteristics of both horticultural agroecosystem (MC and FC). Values represent mean ± standard deviation of technical replicates obtained from composite samples.
DeterminationUnitsMCFC
pH1:2.5-7.4 ± 0.17.9 ± 0.1
Electrical conductivitydS m−17.2 ± 0.22.6 ± 0.3
Cation Exchange CapacitycmolC kg−128 ± 120.4 ± 0.8
Organic Matter%3.8 ± 0.12.5 ± 0.1
Total Nitrogen%0.30 ± 0.050.13 ± 0.03
Organic Carbon%2.2 ± 0.51.4 ± 0.7
Carbon/Nitrogen ratio-7.310.8
Phosphorusppm215 ± 9131 ± 5
CalciumcmolC kg−125.7 ± 0.915 ± 1
MagnesiumcmolC kg−12.90 ± 0.070.60 ± 0.03
PotassiumcmolC kg−12.94 ± 0.041.94 ± 0.03
SodiumcmolC kg−15.95 ± 0.062.48 ± 0.04
Texture-Silt loamSilt loam
Sand%28 ± 230 ± 1
Silt%64 ± 358 ± 2
Clay%8 ± 112 ± 3
Table 4. Relative abundance of bacterial functional genes in bulk soil and tomato rhizosphere from the long-term monoculture and first tomato crop greenhouses. Values represent means ± 95% confidence intervals (n = 3).
Target GeneMCFCANOVA Resultsp
BSRhBSRh
phoD (×10−8)0.85 ± 0.01 b1.5 ± 0.1 a2.1 ± 0.6 a2.0 ± 0.1 aInteraction<0.01
nifH (×10−8)4.6 ± 1.1 b39.9 ± 13.7 a15.8 ± 8.2 a16.9 ± 3.3 aInteraction<0.01
acdS (×10−4)0.75 ± 0.4 b0.77 ± 0.3 b2.1 ± 1.0 a1.9 ± 0.1 aSite<0.01
MC: long-term monoculture; FC: First crop; BS: Bulk soil; Rh: Rhizosphere; ANOVA results indicate factor/s with significant difference (Tukey’s test). Different letters within the same row indicate significant differences among groups.
Table 5. Alpha diversity indices of bacterial communities obtained from the original ASV dataset. Shannon entropy, observed ASVs, Faith’s phylogenetic diversity, and Pielou’s evenness were calculated for bulk soil and rhizosphere samples from the long-term monoculture and first tomato crop systems.
Diversity IndexMCFCANOVA Resultsp
BSRhBSRh
Observed ASVs1965 ab2127 ab2356 a1704 bInteraction0.01
Shannon diversity10.08 a10.03 b10.38 a9.75 bMicrohabitat0.03
Faith’s pd132.5 ab136.6 ab149.4 a118.6 bInteraction0.05
Pielou’s evenness0.922 a0.909 b0.926 a0.909 bMicrohabitat0.04
MC: long-term monoculture; FC: First crop; BS: Bulk soil; Rh: Rhizosphere; ANOVA results indicate factor/s with significant difference (Tukey’s test). Different letters within the same row indicate significant differences among groups.
Table 6. Diversity indices calculated from DGGE banding patterns of nifH and phoD genes in bulk soil and tomato rhizosphere samples from both horticultural sites. Values represent means ± standard deviation (n = 3). Statistical significance was evaluated using factorial ANOVA considering site and microhabitat as factors.
Target GeneDiversity IndexMCFCANOVA Resultsp
BSRhBSRh
nifHRichness10 ± 1 a; b11.7 ± 0.6 a; a8.3 ± 0.6 b; b11 ± 1 b; aSite; Microhabitat0.04; 0.02
Shannon–Wiener1.6 ± 0.21.7 ± 0.31.8 ± 0.22.1 ± 0.1NS-
Simpson4 ± 1 b4 ± 1 b5 ± 1 a6.4 ± 0.8 aSite0.04
phoDRichness10 ± 2 a; b15 ± 2 a; a5 ± 1 b; b11 ± 1 b; aSite; Microhabitat0.01; 0.01
Shannon–Wiener2.0 ± 0.1 a; b2.1 ± 0.2 a; a1.3 ± 0.3 b; b1.7 ± 0.2 b; aSite; Microhabitat0.01; 0.05
Simpson5.8 ± 0.2 a6 ± 1 a3.0 ± 0.7 b3.9 ± 0.4 bSite<0.01
MC: long-term monoculture; FC: First crop; BS: Bulk soil; Rh: Rhizosphere; ANOVA results indicate factor/s with significant difference (Tukey’s test); NS: Not significant. Different letters within the same row indicate significant differences among groups.
Disclaimer/Publisher’s Note: The statements, opinions and data contained in all publications are solely those of the individual author(s) and contributor(s) and not of MDPI and/or the editor(s). MDPI and/or the editor(s) disclaim responsibility for any injury to people or property resulting from any ideas, methods, instructions or products referred to in the content.