Article

Exploring Cladocera Assemblage and Responses to Land Use Patterns

1
Department of Hydrobiology, University of Debrecen, Egyetem Square 1, H-4032 Debrecen, Hungary
2
Pál-Juhász Nagy Doctoral School of Biology and Environmental Science, University of Debrecen, Egyetem tér 1, H-4032 Debrecen, Hungary
3
Department of Natural Sciences, School of Pure and Applied Sciences, Mount Kenya University, Thika P.O. Box 342-01000, Kenya
4
National Laboratory for Water Science and Water Security, Department of Hydrobiology, University of Debrecen, Egyetem tér 1, H-4032 Debrecen, Hungary
5
Department of Inorganic and Analytical Chemistry, Faculty of Science and Technology, University of Debrecen, Egyetem tér 1, H-4032 Debrecen, Hungary
6
Department of Limnology, University of Pannonia, Egyetem u. 10, H-8200 Veszprém, Hungary
7
Department of Aquatic Environmental Sciences, Ludovika University of Public Service, Bajcsy-Zsilinszky Str. 12-14, H-6500 Baja, Hungary
*
Author to whom correspondence should be addressed.
Diversity 2025, 17(9), 642; https://doi.org/10.3390/d17090642
Submission received: 3 June 2025 / Revised: 18 August 2025 / Accepted: 22 August 2025 / Published: 12 September 2025
(This article belongs to the Special Issue Diversity and Ecology of Freshwater Plankton)

Abstract

Cladocera communities in surface sediments from 31 lakes in Hungary were analysed to assess the impacts of land use on the aquatic systems. We evaluated the alpha and beta diversity metrics, with land use classification types based on the Corine Land Cover. Physical and water chemistry parameters were analysed using standardised procedures. Using redundancy analysis (RDA), total phosphorus (TP) was identified as the key driver of Cladocera composition and distribution. End-member mixing analysis (EMMA) revealed distinctive ecological patterns in Cladocera assemblages across land use types. Our results demonstrate that agriculture and urbanisation contribute to the associated degradation of the lakes and changes in trophic states. Wetlands, forests, and open waters play a critical role as buffer zones in mitigating anthropogenic effects, with Cladocera community composition mirroring the nutrient conditions of the lakes.

Graphical Abstract

1. Introduction

Due to the decline in global biodiversity, all ecosystems on Earth are at risk. Humanity is confronted with the sixth large extinction resulting from its activities, compromising the integrity of the biosphere in delivering ecosystem services and health [1,2]. Wetlands are important components of the ecosystems that safeguard the sustenance of plant and animal life on Earth. They contribute to important services as ecological roles in carbon sequestration, flood mitigation, and wildlife protection and provide food resources for humans [3,4]. Freshwater ecosystems are facing increased anthropogenic pressures, including pollution from expanding human settlements and climate change, leading to detrimental effects on aquatic ecosystems [5,6].
Urbanisation and agriculture have rapidly grown over the last few decades, resulting in human land use that alters aquatic resources. Like many European countries, Hungary is experiencing increased land utilisation, accelerated urbanisation, and demographic trends toward cities in industrialised regions. Most of the land in Hungary is also used for agricultural purposes. Agricultural and urban activities generate significant nutrient loads, and runoff progressively deteriorates water quality. Excess nutrient enrichment induces eutrophication, disrupting the complex ecological food web by diminishing diversity nodes and connectivity in lakes, restricting community, and modifying energy transfer across trophic levels [7].
Land use practices significantly alter trophic conditions, with effects on zooplankton communities [8]. Agricultural nutrient flows, including nitrates (NO3), phosphates (PO43−), chlorides (Cl), suspended solids, and agrochemicals, elevate nutrient richness, promoting undesirable lake pollution effects, contributing to eutrophic conditions and phytoplankton biomass production in lakes [9]. Urbanisation further heightens stress on aquatic systems through industrial and residential effluents and thermal discharge leading to increased lake water temperatures and habitat fragmentation, while eliminating sensitive species. Forests as watersheds and wetlands support ecological buffering and the removal of contaminants, thereby maintaining balanced zooplankton assemblages. Land use-driven disturbances may trigger different responses, including biotic homogenisation and successional shifts, which result in the loss of sensitive species and subsequently dominance by pollutant-tolerant species [10].
Zooplankton community structures exhibit distinctive responses to anthropogenic conditions. Increased temperature drives population instability, species displacement, and dynamics in the life histories of zooplankton [11]. Increased phosphorus and nitrogen deposits in agricultural–urban catchments have led to higher conductivity (µS cm), biological oxygen demand (BOD5), total suspended solids (TSS) concentrations, and heavy metal concentrations [12]. These synergies restructure zooplankton communities through the competitive exclusion of sensitive taxa, dominance of r-selected species, and trophic disruption.
Zooplankton, especially cladocerans, occupy a crucial position in the lake food web, as they transfer material and energy to higher trophic levels. Cladocera are primary consumers and inhabit various aquatic habitats and are sensitive to eutrophication. Cumulative stressors of environmental changes show faster in the Cladocera community by driving predictable community shifts from sensitive specialists to generalist species and the competitive dominance of opportunistic species [13]. Cladocera composition reflects the overall condition of freshwater lake environments [14]. Cladocera are monophyletic freshwater wetland organisms, morphologically characterised by a size range of 0.2–18 mm and translucent bodies. They are of Palaeozoic origin, with 620 species currently identified, of which 98 species are recorded in Hungary [15,16]. They are common in occurrence, at high, middle, and low altitudes, in shallow and deep lakes, and in alkaline, acidic, and neutral conditions. Cladoceran taxa are adaptable to diverse environmental conditions [17], including trophic states [17,18,19], total phosphorus [17,20], water depth, transparency, temperature, and conductivity [21], making them important zooplankton groups for paleolimnological proxy studies and contemporary bioindicators of lake changes [20,22,23].
The relationship between the water quality and ecological conditions of the lake plays a crucial role in the hydrological process and Cladocera biodiversity. These parameters govern ecological processes and alpha (α) and beta (β) diversities of Cladocera communities and act as environmental filters in species niche selection, partitioning, and composition. Alpha and beta diversity indices act as ecological weights, revealing the uniqueness of lakes under different land use types, highlighting assemblages or shifts within and across habitats [24,25]. Studies have demonstrated that Cladocera community assemblages have demonstrated a tendency towards nutrient enrichment in aquatic ecosystems and can be evaluated as important zooplankton functional groups [26]. By continuously studying the multifunctional patterns of Cladocera communities, their distribution, and environmental variables, it is possible to reflect on the palaeoecological processes of a lake.
In this study, we investigated how various land use types influence the abundance and composition of Cladocera assemblages in small lakes. Our main questions are as follows: (i) Is there an association between main cladoceran taxa and land use types? (ii) Is there any relationship between environmental parameters and land use types? (iii) What is the importance of watershed land use types shaping lacustrine cladoceran communities?

2. Materials and Methods

2.1. Study Area and the Measured Environmental Variables

An integrated sampling technique was conducted across 31 shallow lakes and ponds in Hungary during the summer of 2017–2022 (Figure 1). Using spatial focus, we collected top surface sediments up to 1 cm depth to represent contemporary sedimentation and water samples from the water column. The samples were transferred in polyethylene bags and stored at 4 °C in the laboratory until analysis.
Physical and chemical variables of the temperature (°C), oxygen concentration (mgL−1), and saturation (%), conductivity (µS cm−1), and pH were measured with a Hach Lange HQ40d multi-meter. Water samples were analysed for total phosphorus (TP), nitrite-nitrogen (NO2−N), nitrate-nitrogen (NO3−N), ammonium-nitrogen (NH4-N), soluble reactive silica (Si), sulphate (SO42−), chloride (Cl−), bicarbonate (HCO3), and chemical oxygen demand (COD) according to APHA (2012). Algal biomass was estimated by the sum of algal counts [27]. Nutrient concentrations and COD were expressed in µgL−1 and mgL−1, respectively. The loss-on-ignition (LOI) method [28] was employed to determine the organic matter (OM) (550 °C, 4 h) and carbonate content [Carb] (950 °C, 2 h) in sediment samples.
Cladocera sample preparations involved treatment of sediment subsamples (1 cm3) with a 10% potassium hydroxide (KOH) solution in 100 mL beakers. The sediments were heated for 30 min at approximately 80 °C to 100 °C with gentle stirring using a wooden rod. Organic matter from the remnants was removed using 70% ethanol. The samples were gently washed, rinsed, and sieved through a 35 µm mesh, then transferred to polypropylene tubes, filled to a volume of 25 mL. Samples were further stained with safranine-glycerin for improved identification. Following the treatment and preparation, 100 μL of each subsample was quantitatively pipetted onto a microscope slide for enumeration [29].
Subsequently, we analysed the slides with a microscope (B–183, OPTIKA Microscope, 24010, Ponteranica, Italy) at magnifications of ×100 to ×400, counting to 100 Cladocera remains from each sample or 25 slides if the 100 individual count was not achieved. Only identifiable Cladocera remains (headshields, shells, post-abdominal claws, and mucrones) were counted. The two halves of the carapaces were regarded as one individual. Each taxon’s most prevalent body components were employed to determine the density (ind cm−3). The composition of the Cladocera community was determined based on the identification methodology [22,30].

2.2. Land Cover and Use Classification

Land use classification was conducted according to the remote sensing protocol standardised by the Corine Land Cover (CLC) database [31] and methodological adjustment [27]. The method classifies land use into five types: (1) urban areas that comprise human infrastructure, settlements, and industrialisation zones; (2) agricultural areas characterised by pasture and croplands; (3) forests and semi-natural areas, including shrubland, woodlands, and natural vegetation; (4) wetlands encompassing marshlands, swamps, and floodplains; (5) open water bodies represented by open areas of lakes, reservoirs, and rivers. Using GIS (QGIS 3.10 software) analysis, we calculated the aerial proportions of each land use type within the sampling points. The dominant land use type was operationally defined as the category type within the selected watershed.

2.3. Statistical Analysis

Before analysing the multivariate statistics, Cladocera data were Hellinger-transformed to reduce the influence of dominance disparities. Species diversity of the subfossil cladoceran assemblages was estimated using Hill’s numbers [32] on densities, in which N0 represents species richness (number of taxa), N1 represents the Shannon–Wiener diversity, and N2 represents the inverse Simpson diversity, which is the reciprocal of Simpson’s diversity index [32,33,34]. The Shannon–Wiener index is sensitive to rare taxa, while the Simpson index is sensitive to dominant taxa. Hill’s numbers were calculated by the Renyi function of the vegan package [33].
Total variance of species compositional data can be regarded as beta-diversity; thus, beta-diversity was calculated for all lakes separately. Beta-diversity is partitioned into three components: replacement, richness difference, and similarity with the beta. div.comp function of the adespatial R-package. Replacement refers to the substitution of species among sediment layers, while richness difference indicates how much communities differ from each other in their number of species. For this, we used the SDR-simplex approach [35,36] based on the Jaccard index. The pairwise values can then be presented in ternary plots (i.e., simplices) where Replacement + Richness Difference + Similarity = 1. With the pairwise sums of the additive components, it is also possible to compare the contribution of beta diversity (Replacement + Richness difference) and nestedness (Richness difference + Similarity) to gamma diversity. All analyses were run in the R statistical environment [37].
To test the differences among Cladocera communities according to land use types, a permutational multivariate analysis of variance (PERMANOVA) was conducted using the adonis2 function of vegan, based on Euclidean distance. We introduced land use variables to determine the maximum land use types. Principal component analysis (PCA) was conducted on covariance matrices of cladoceran data to gain insights into the patterns in communities. Then, we performed redundancy analysis (RDA) after filtering out rare taxa (retaining only species present in three or more lakes). Environmental variables were identified through forward selection and a permutation test, which identified the most influential variables until no further variables met the significance threshold (p < 0.05). The variation inflation factor (VIF) was calculated to screen environmental variables responsible for multicollinearity. If the VIF value of environment variables was above 20, they were removed from the RDA. We used Spearman’s rank correlation to assess the relationship between environmental parameters and land use variables. End-member mixing analysis (EMMA) was conducted to determine whether cladoceran communities could reflect the land use effect. Percentages of cladoceran species were introduced into the EMMA [38,39].

3. Results

3.1. Land Use Description

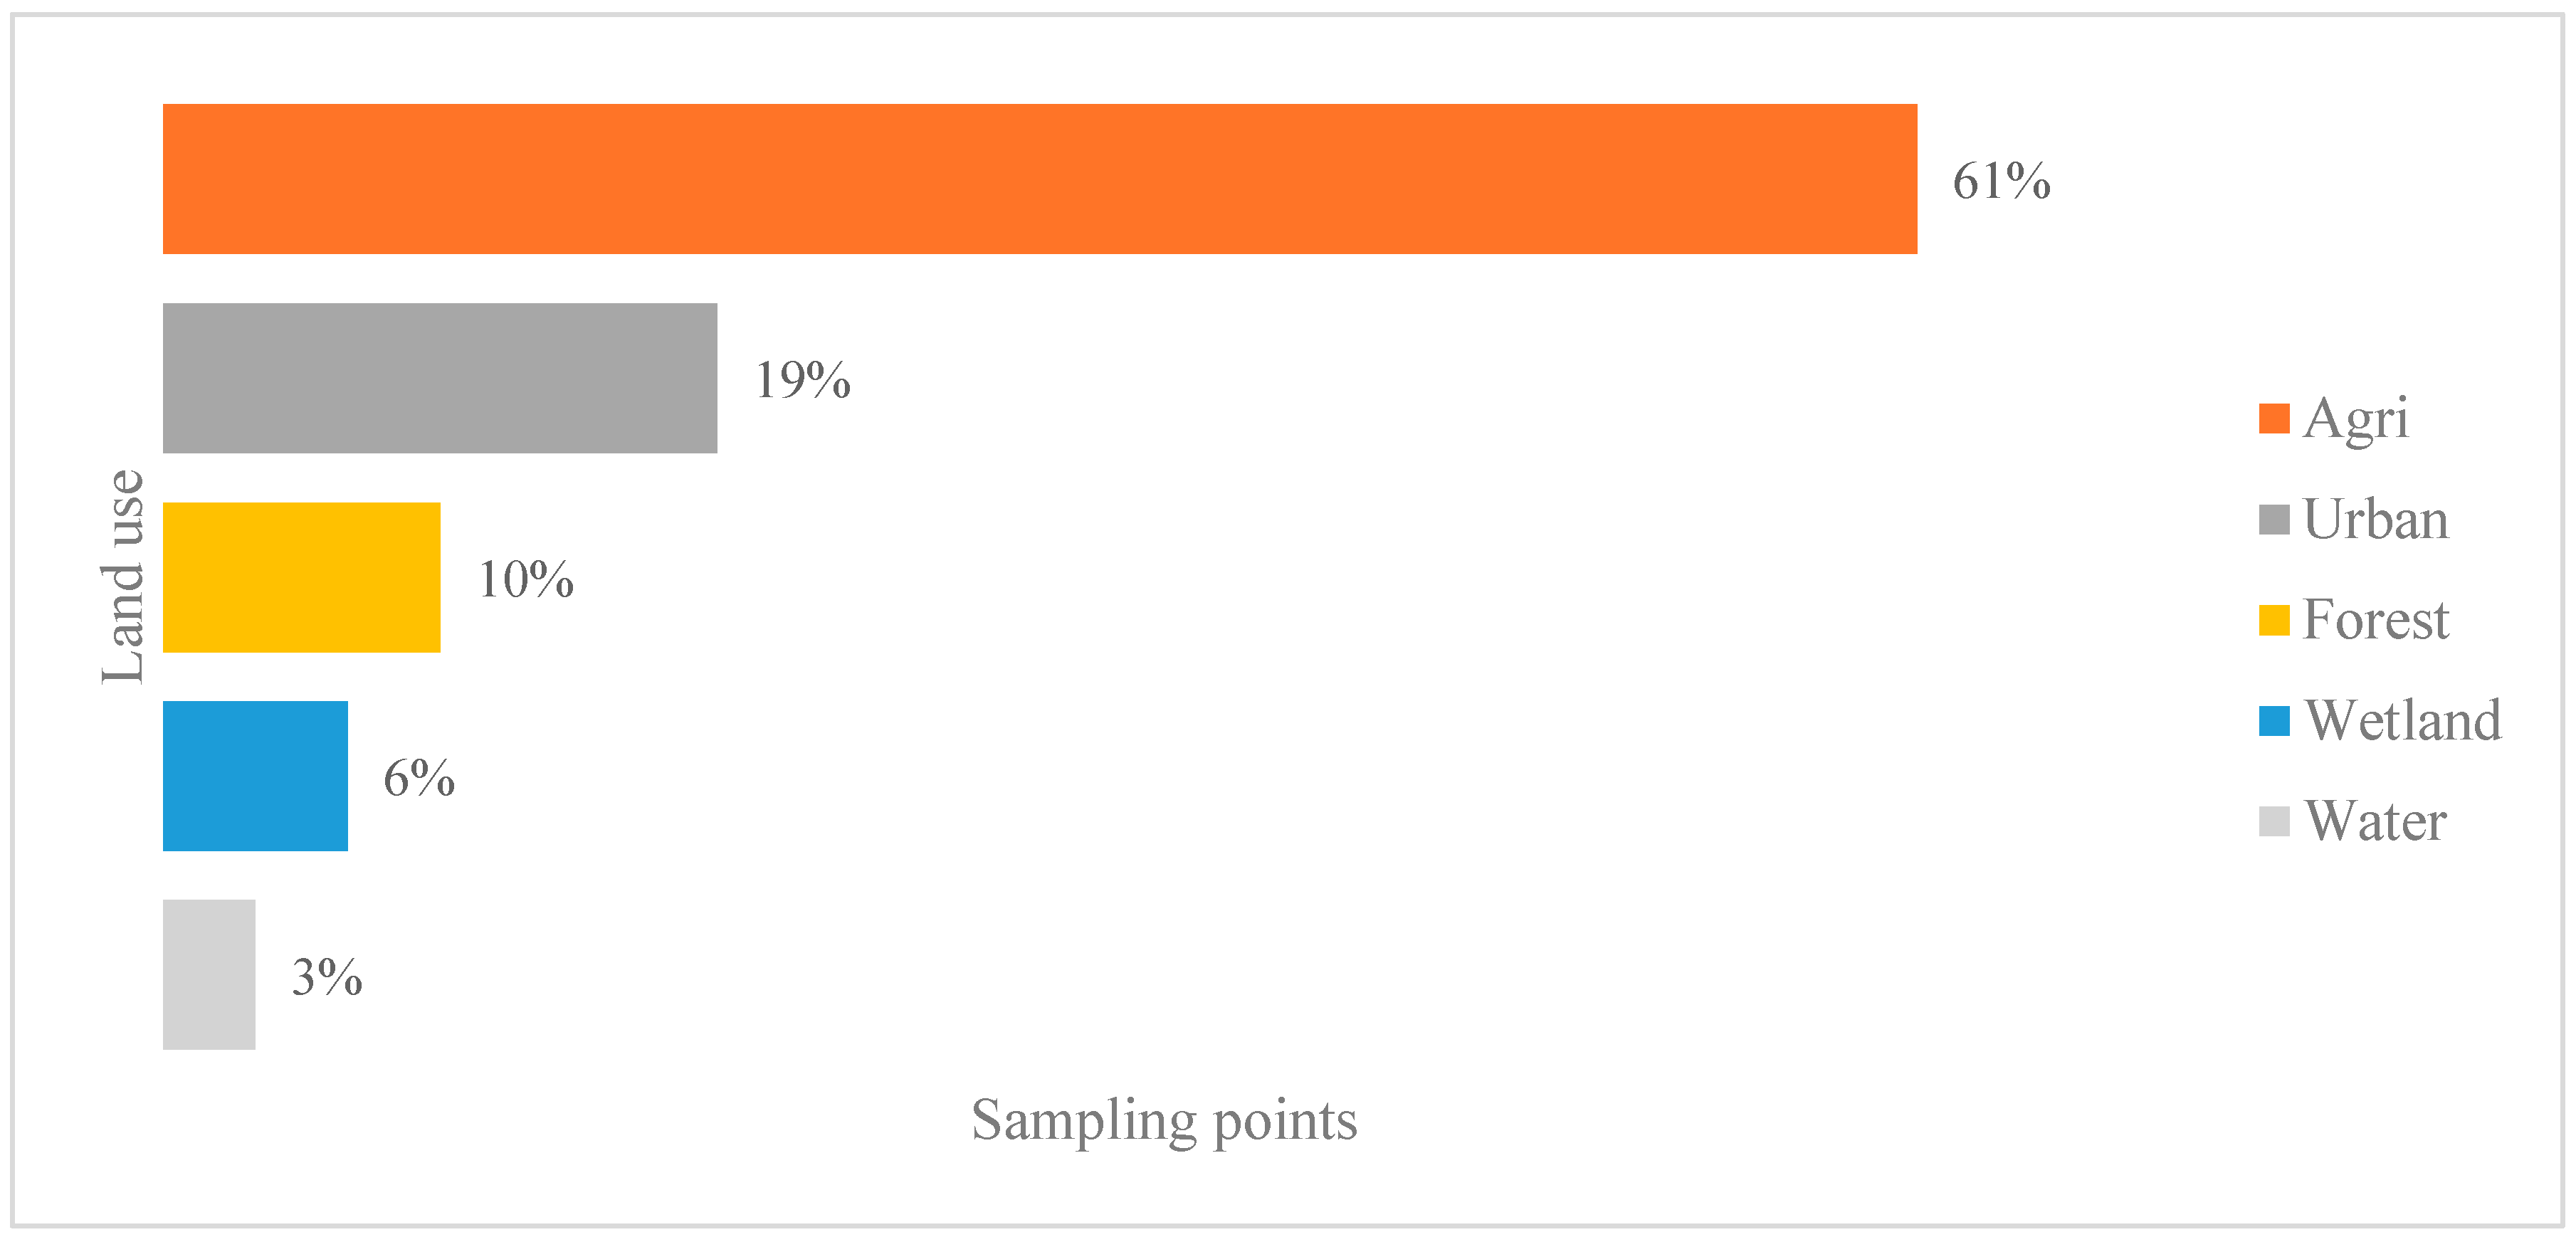
The sampled stations were classified into land use types and grouped into five categories: agricultural, urban, forest, wetland, and open water (Figure 2).
Agriculture (61%) significantly exceeded the other land uses. This distribution reflects national land use patterns, where agriculture accounts for about 3.5% of the GDP of Hungary; approximately 50% (5.3 million ha) of land is cultivated [40]. Therefore, Hungarian water bodies are primarily affected by agricultural land use, indicating vulnerability to nutrient runoff from agricultural activities, with a slight contribution from urban areas. In our case, agricultural land use was dominant around the lakes. At the same time, urban and forest areas occurred in moderate proportions, and the watershed areas, such as wetlands and open water, comprised the smallest coverage of land use types (Figure 2).

3.2. Environmental Variables

In total, 17 parameters were measured, including physicochemical and biological elements, and recorded (Appendix A). Conductivity ranged from 129.7 to 2410 µS cm−1. The lowest mean measurement recorded was ammonium-N at 0.08 µgL-1 (range: 0.01–0.59 µgL−1). The highest positive skewness was identified in both nitrite-N and silicate (5.04 µgL−1). The total biomass range (44.37–61,750.02 μg L−1) and positive variation (SD, 15,866.42 μg L−1) mirrored the differences in lake productivity. The DO range was (2.51–15.24 mgL−1), mean 9.4 mgL−1, and very low levels represented hypoxic conditions. For pH measurements, a range of 7.8 to 9.99 was recorded.

3.3. Correlation Between Environmental and Land Use Variables

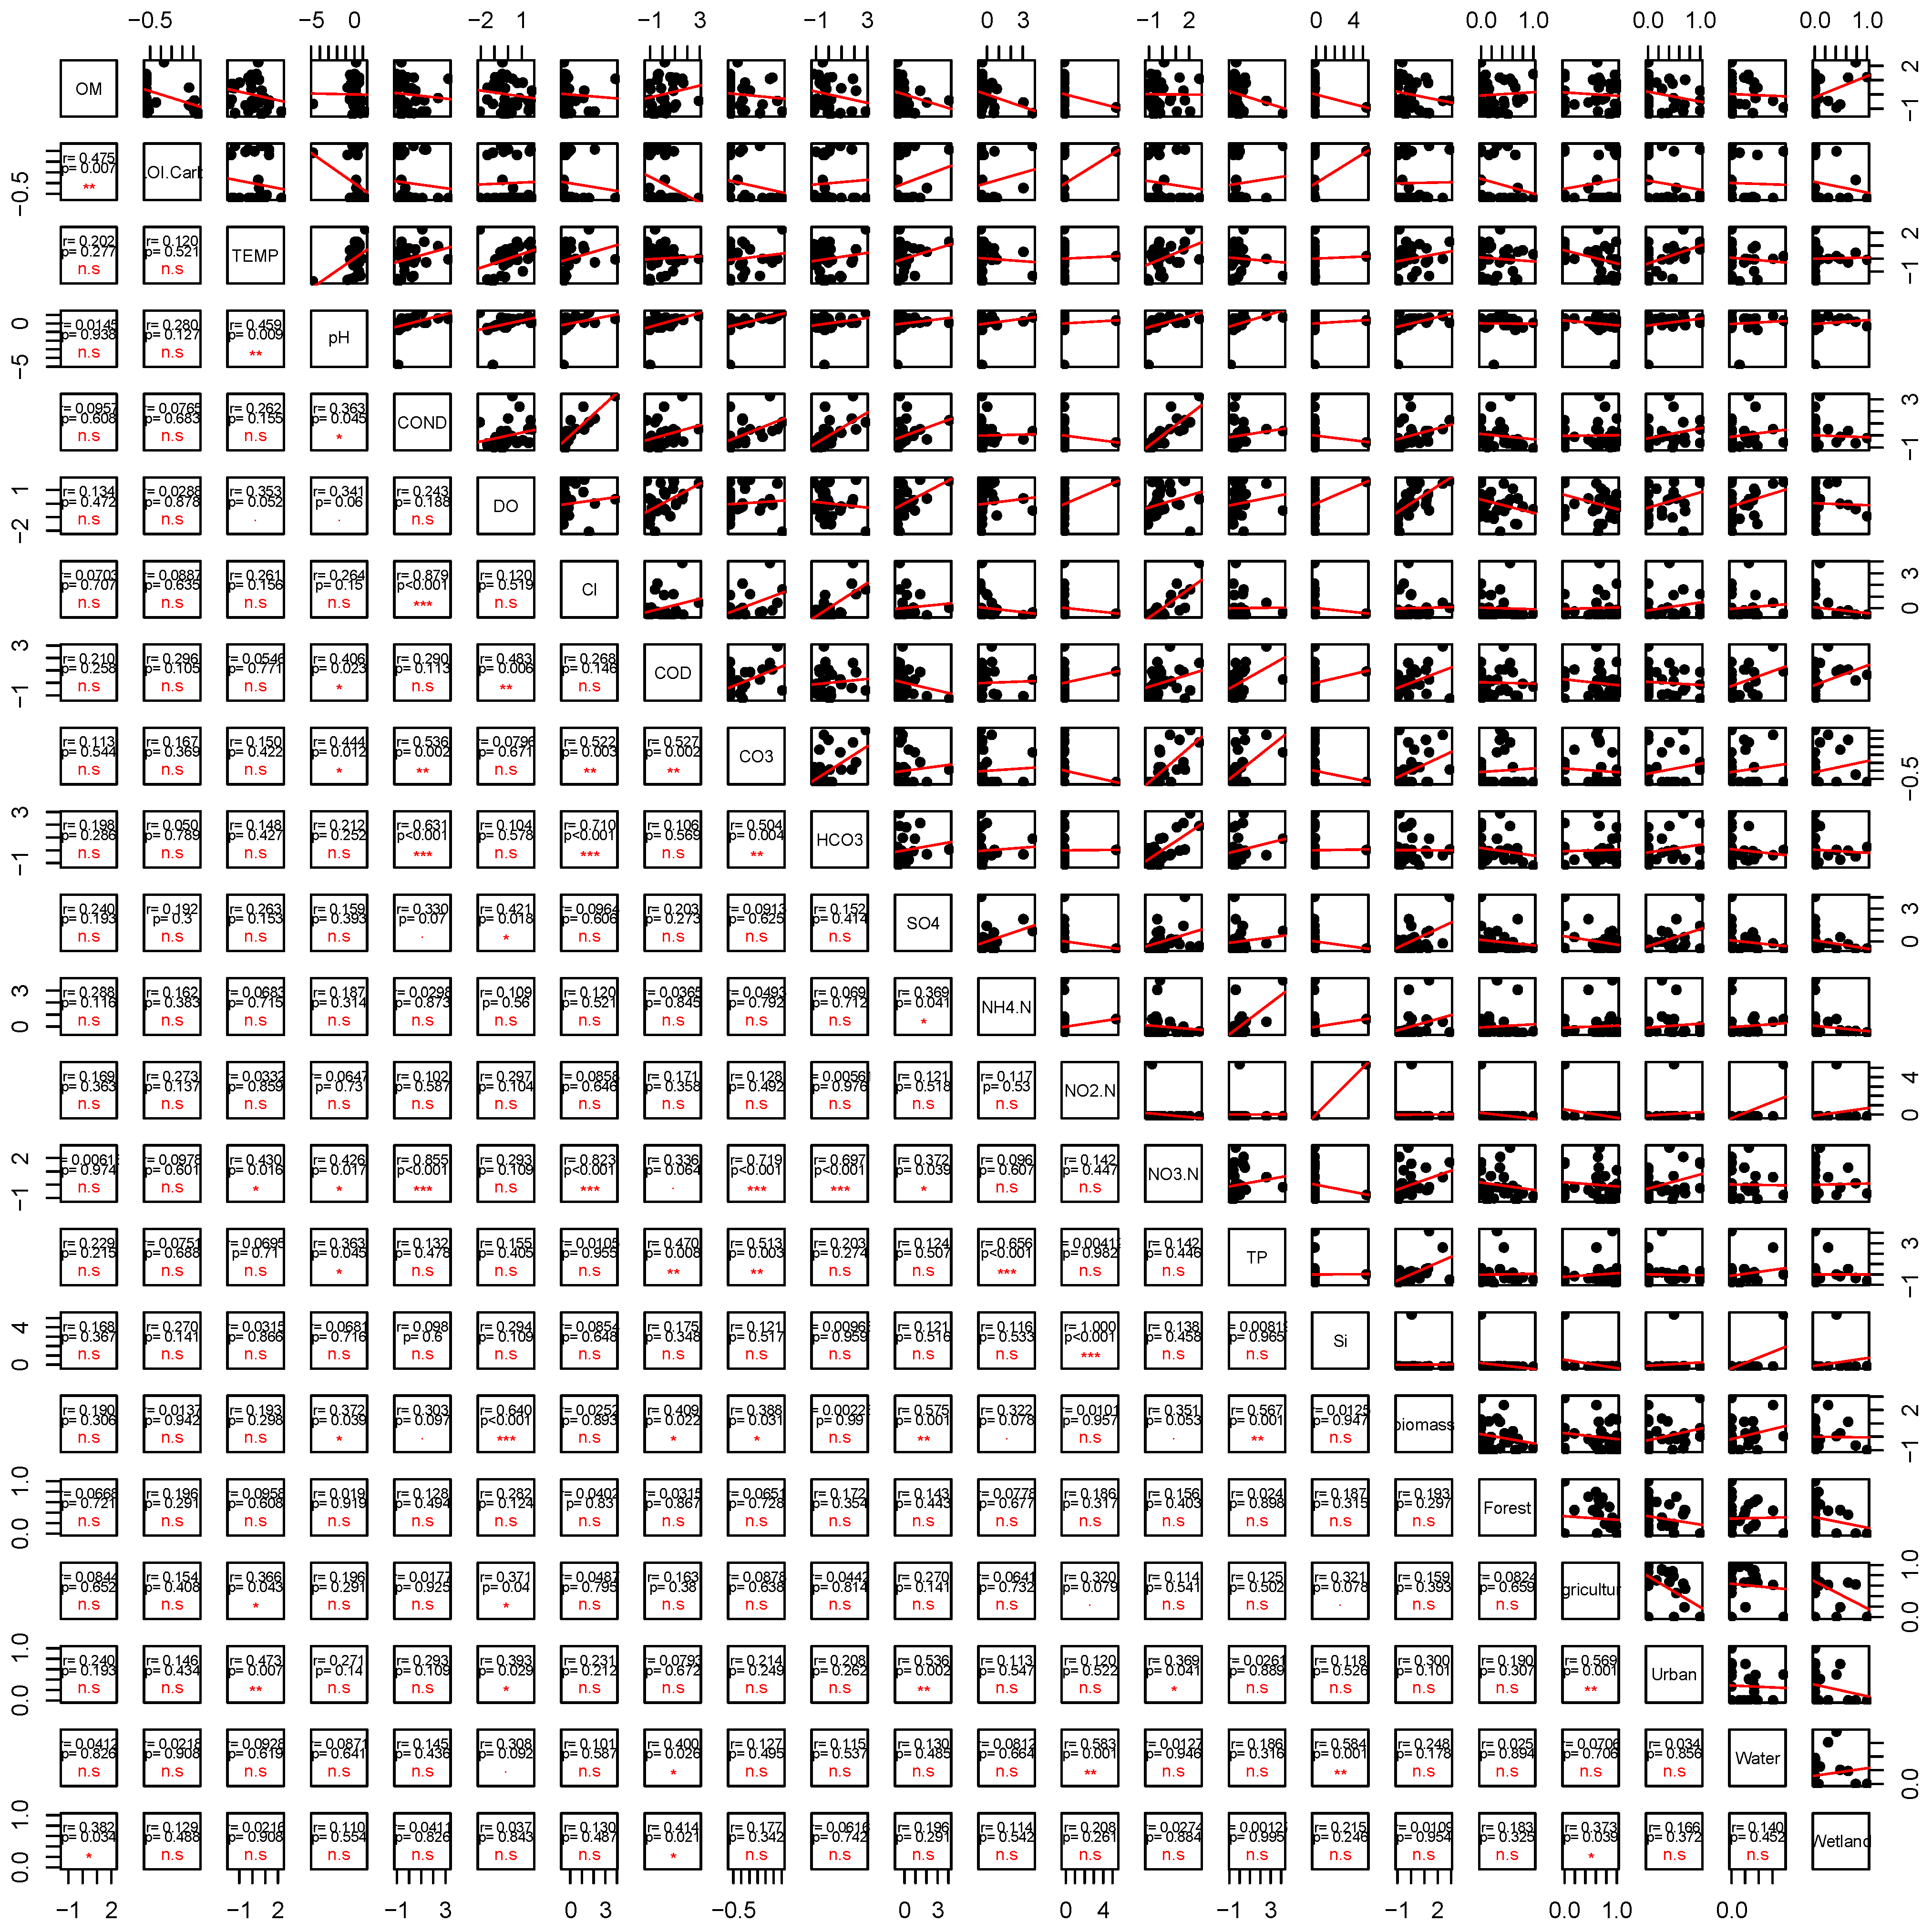
Environmental factors exhibited a weak correlation among land use types; however, the strongest correlations were observed between parameters (Appendix B). The significant relationships include chloride (Cl-) and COND (r = 0.879; p < 0.001); NO3-N and COND (r = 0.855, p < 0.001); NO3-N and Cl- (r = 0.823; p < 0.001); NO3-N and HCO3 (r = 0.697; p < 0.001); NH4-N and TP (r = 0.656, p < 0.001); and DO and Biomass (r = 0.640, p < 0.001) (Appendix B and Appendix D). NO3-N correlated with COND, Cl-, and HCO3, suggesting that nitrate–carbonate dynamics in the lakes and agricultural–urban areas may be possible contributors. Notably, the positive association with nutrients, DO, and biomass indicated high productivity in the lakes.

3.4. Cladocera Communities and Diversity Metrics

We recorded 36 Cladocera species remains from the 31 lakes. The Chydoridae family had the highest recorded species diversity. The highest relative abundance was observed in B. coregoni (37.4%), B. longirostris (26%), C. sphaericus (6.8%), A. affinis (4.8%), and A. harpae (2.93%). The Aloninae subfamily showed the highest diversity, including A. affinis, A. costata, A. gutata, A. intermedia, A. rustica, and A. quadrangularis. The total occurrence of Daphnia species was represented by D. pulex (2.6%) and D. longispina (1.24%). The Sididae family was represented by D. brachyurum (0.09%), occurring in appreciable numbers.
Further, we evaluated the alpha–beta diversity indices (Table 1) to identify the variations within sites using Richness (S), Shannon’s index (H’), and the Simpson index (D), accounting for Cladocera richness and evenness distribution patterns.
Species richness across sampled sites ranged from 1 to 30 species (Table 1), with some sites dominated by at least 1 species and others supporting up to 30 species, reflecting high variability in community structure. This broad range in Cladocera richness suggests heterogeneous conditions, and the low species recorded in other sites suggests distinct ecological conditions. Shannon’s index (H’) (median = 6, mean = 7) revealed moderate diversity within sites and some communities influenced by the dominant Cladocera taxa. The Simpson dominance index (D = 5) highlighted a few species in dominance. Beta diversity patterns were evaluated to analyse Cladocera community composition between sites (Figure 3).
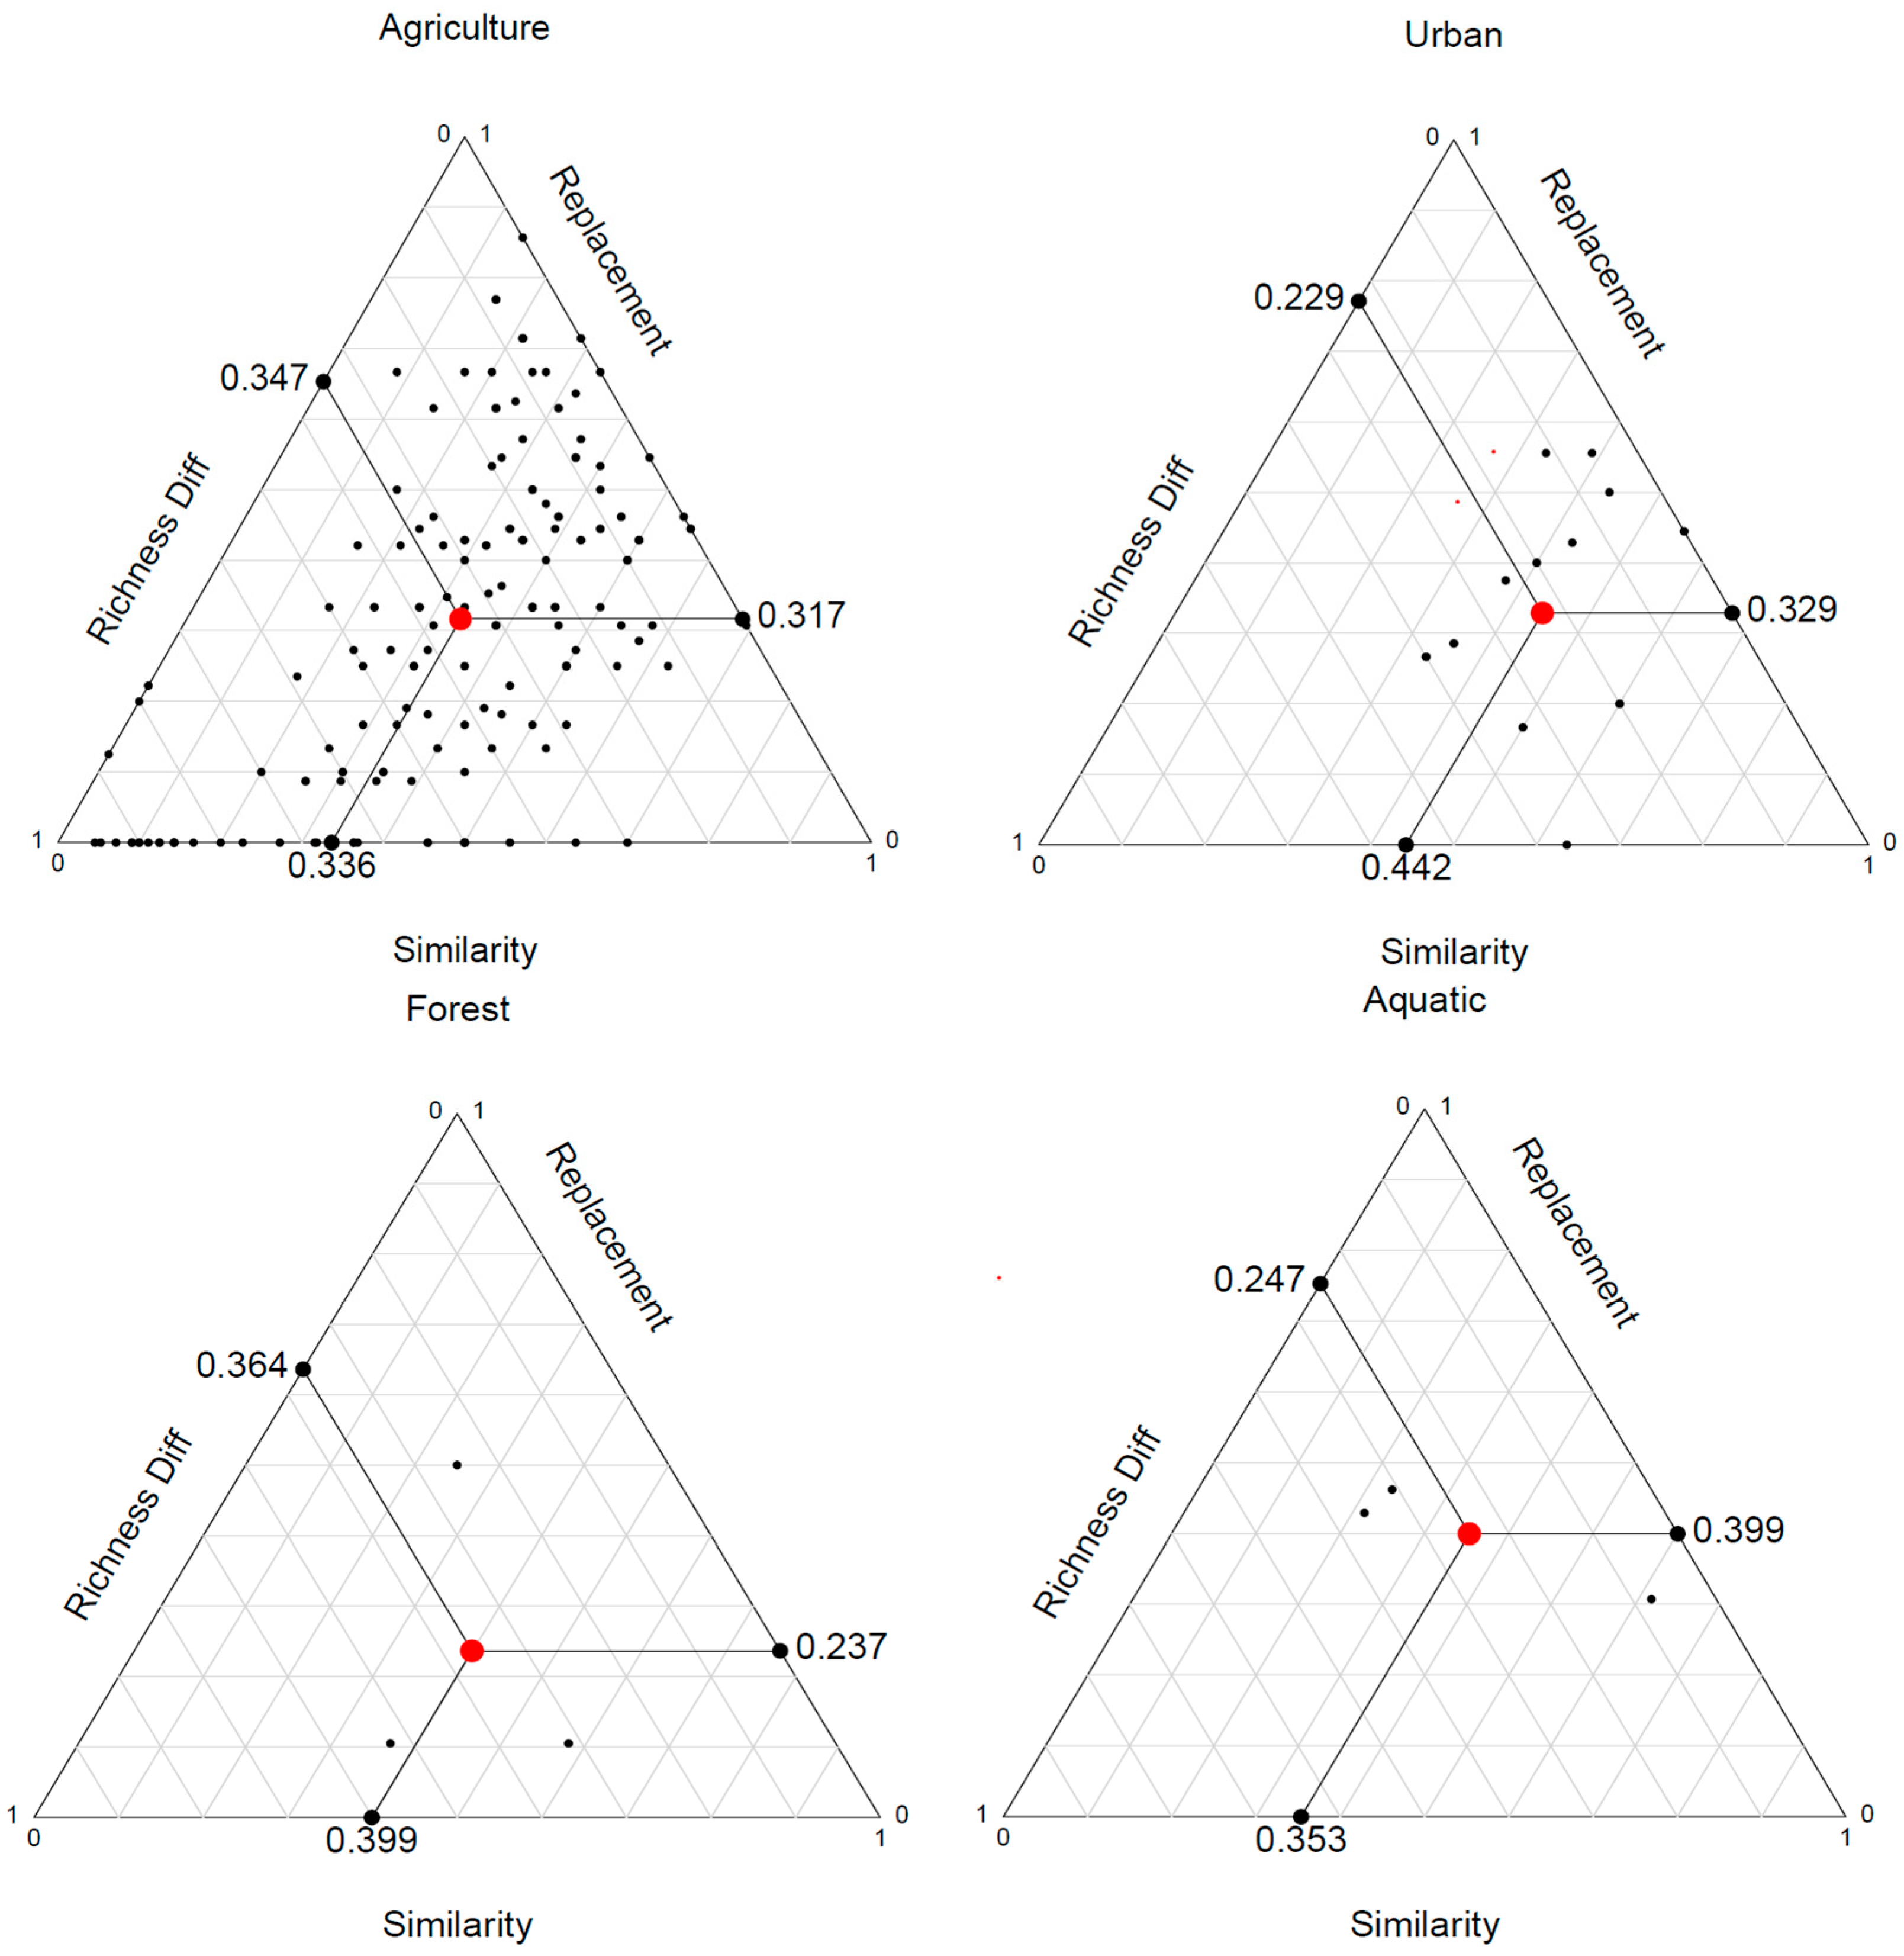
The beta-diversity of the lake set was high 63% (Figure 3) for the species pool, responsible for the dissimilarity. The three components of beta-diversity exhibited comparable magnitudes, indicating a balanced contribution. The similarity component was the highest (36.7%), species turnover (replacement) represented 32.9%, and richness differences led to 30.4% of cladoceran species.
The beta diversity of the land use types showed that common cladocerans shaped the species pool, as evidenced among the different lake types (Figure 4). The similarity component varied the most among urban lakes (44.2%) and the least among agriculture-affected lakes (33.6%). The common species comprised a moderate portion of the cladoceran community in the more natural lakes (those with forest and aquatic land use dominating), with similarity levels of 39.9% and 35.3%, respectively. Replacement components indicated that the species dissimilarities among the different utilisations were as follows: agriculture, 31.7%; urban, 32.9%; forest, 23.7%; and aquatic (open waters and wetlands), 39.9%.
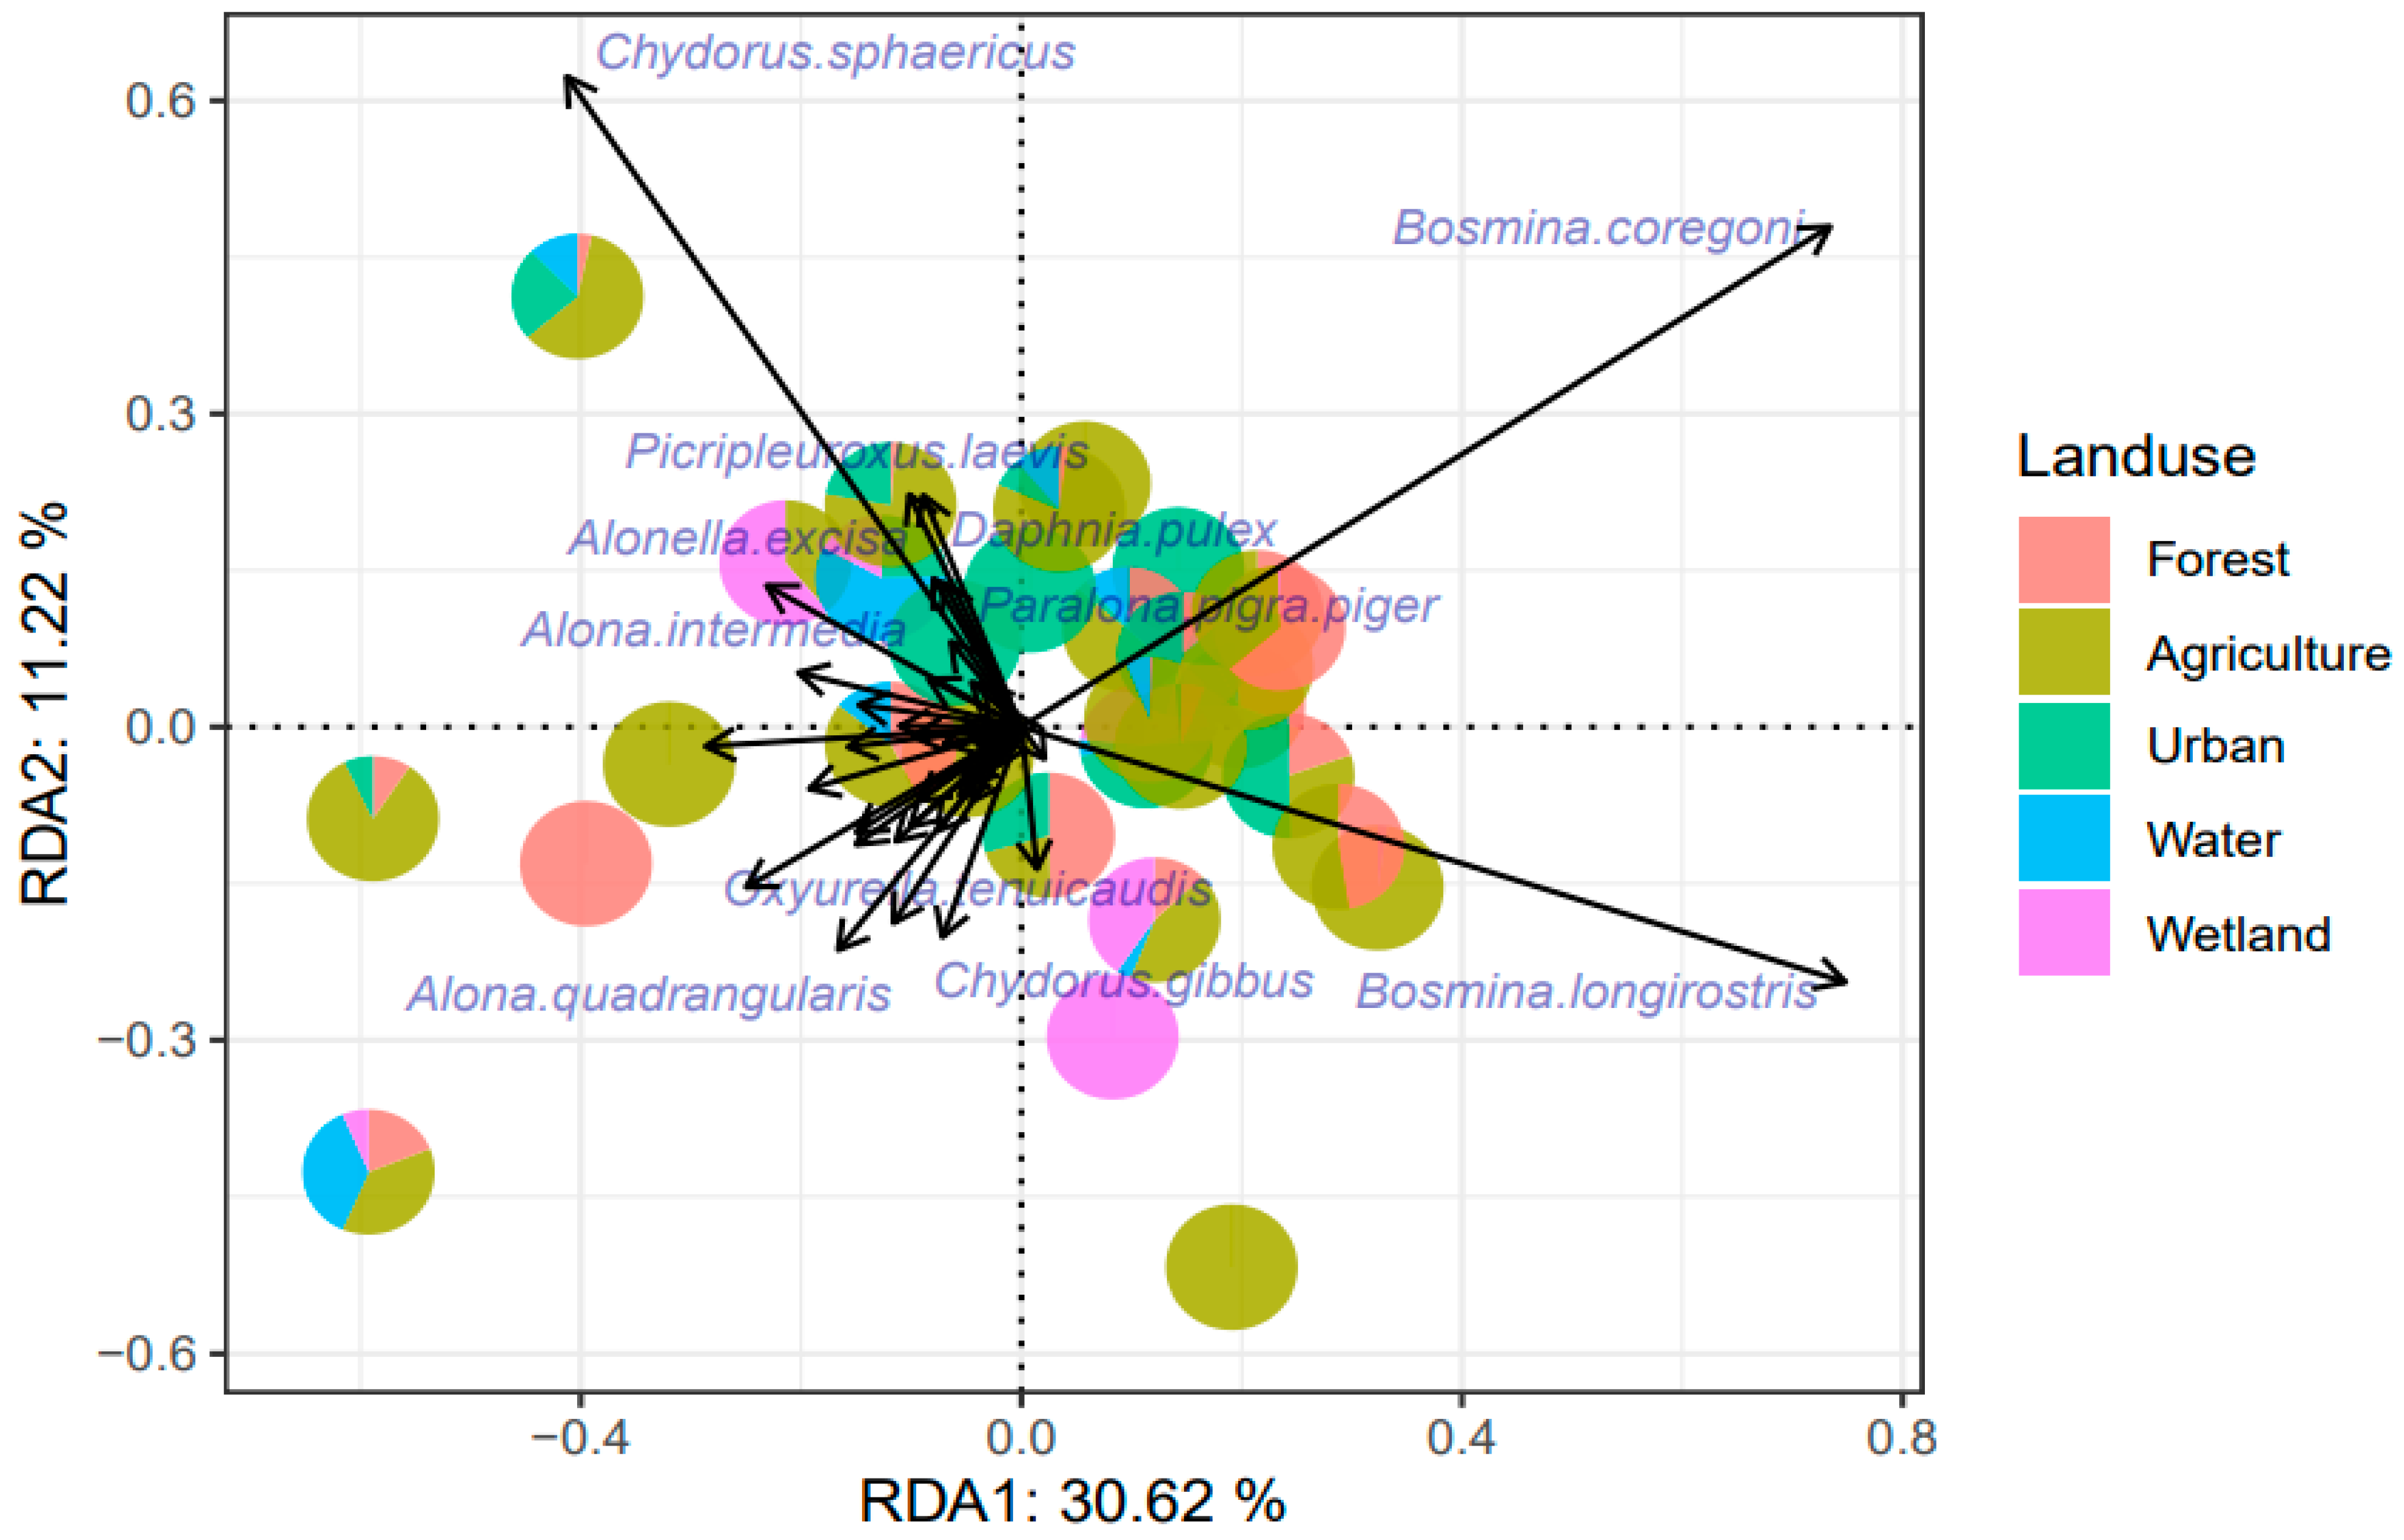
Further RDA (Figure 5) supported this pattern, with three Cladocera species as significant indicators explaining variations in distribution across land use types across including agriculture, urban, forest, wetlands, and open water systems.
Three species were identified, with the highest correlation occurring within the first two constrained variables. In RDA axis 1, B. coregoni and B. longirostris explained 41.84% of the constrained variance in the observed community patterns; in axis 2, this was C. sphaericus (Figure 5).
Next, an RDA was run on cladoceran data and land use coverage, revealing the effect of land use on cladoceran communities (Table 2). The land use accounted for a small part, approximately 20%, of the total variance in the cladoceran data. This slight variance suggested a similarity pattern among cladoceran communities in the lakes, which was also supported by a distance-based permutational multivariate analysis of variance (adonis2: F = 0.1966, p-value = 0.454).
The land use did not significantly explain the variation in the Cladocera community composition. However, agricultural and urban activities were reflected by the dominance of Bosmina spp. and C. sphaericus. Moreover, C. sphaericus was abundant in urban-dominated sites, while bosmids were abundant in agricultural lands (Figure 6).
Since the land use type presented a marginal effect on the cladoceran distribution, we introduced land use as a conditional variable into the partial RDA (Table 3). The carbonate content variable of the lake water presented a high VIF value (39.89), exceeding the limit of 20. Therefore, it was removed from the pRDA.
The partitioning of variances revealed that the land use variables accounted for approximately 20% of the total variance in the cladoceran data, while the water chemistry variables accounted for almost 50%. Residual variance remained high, accounting for 33% of the total variance, for unquantified variables (Table 3).
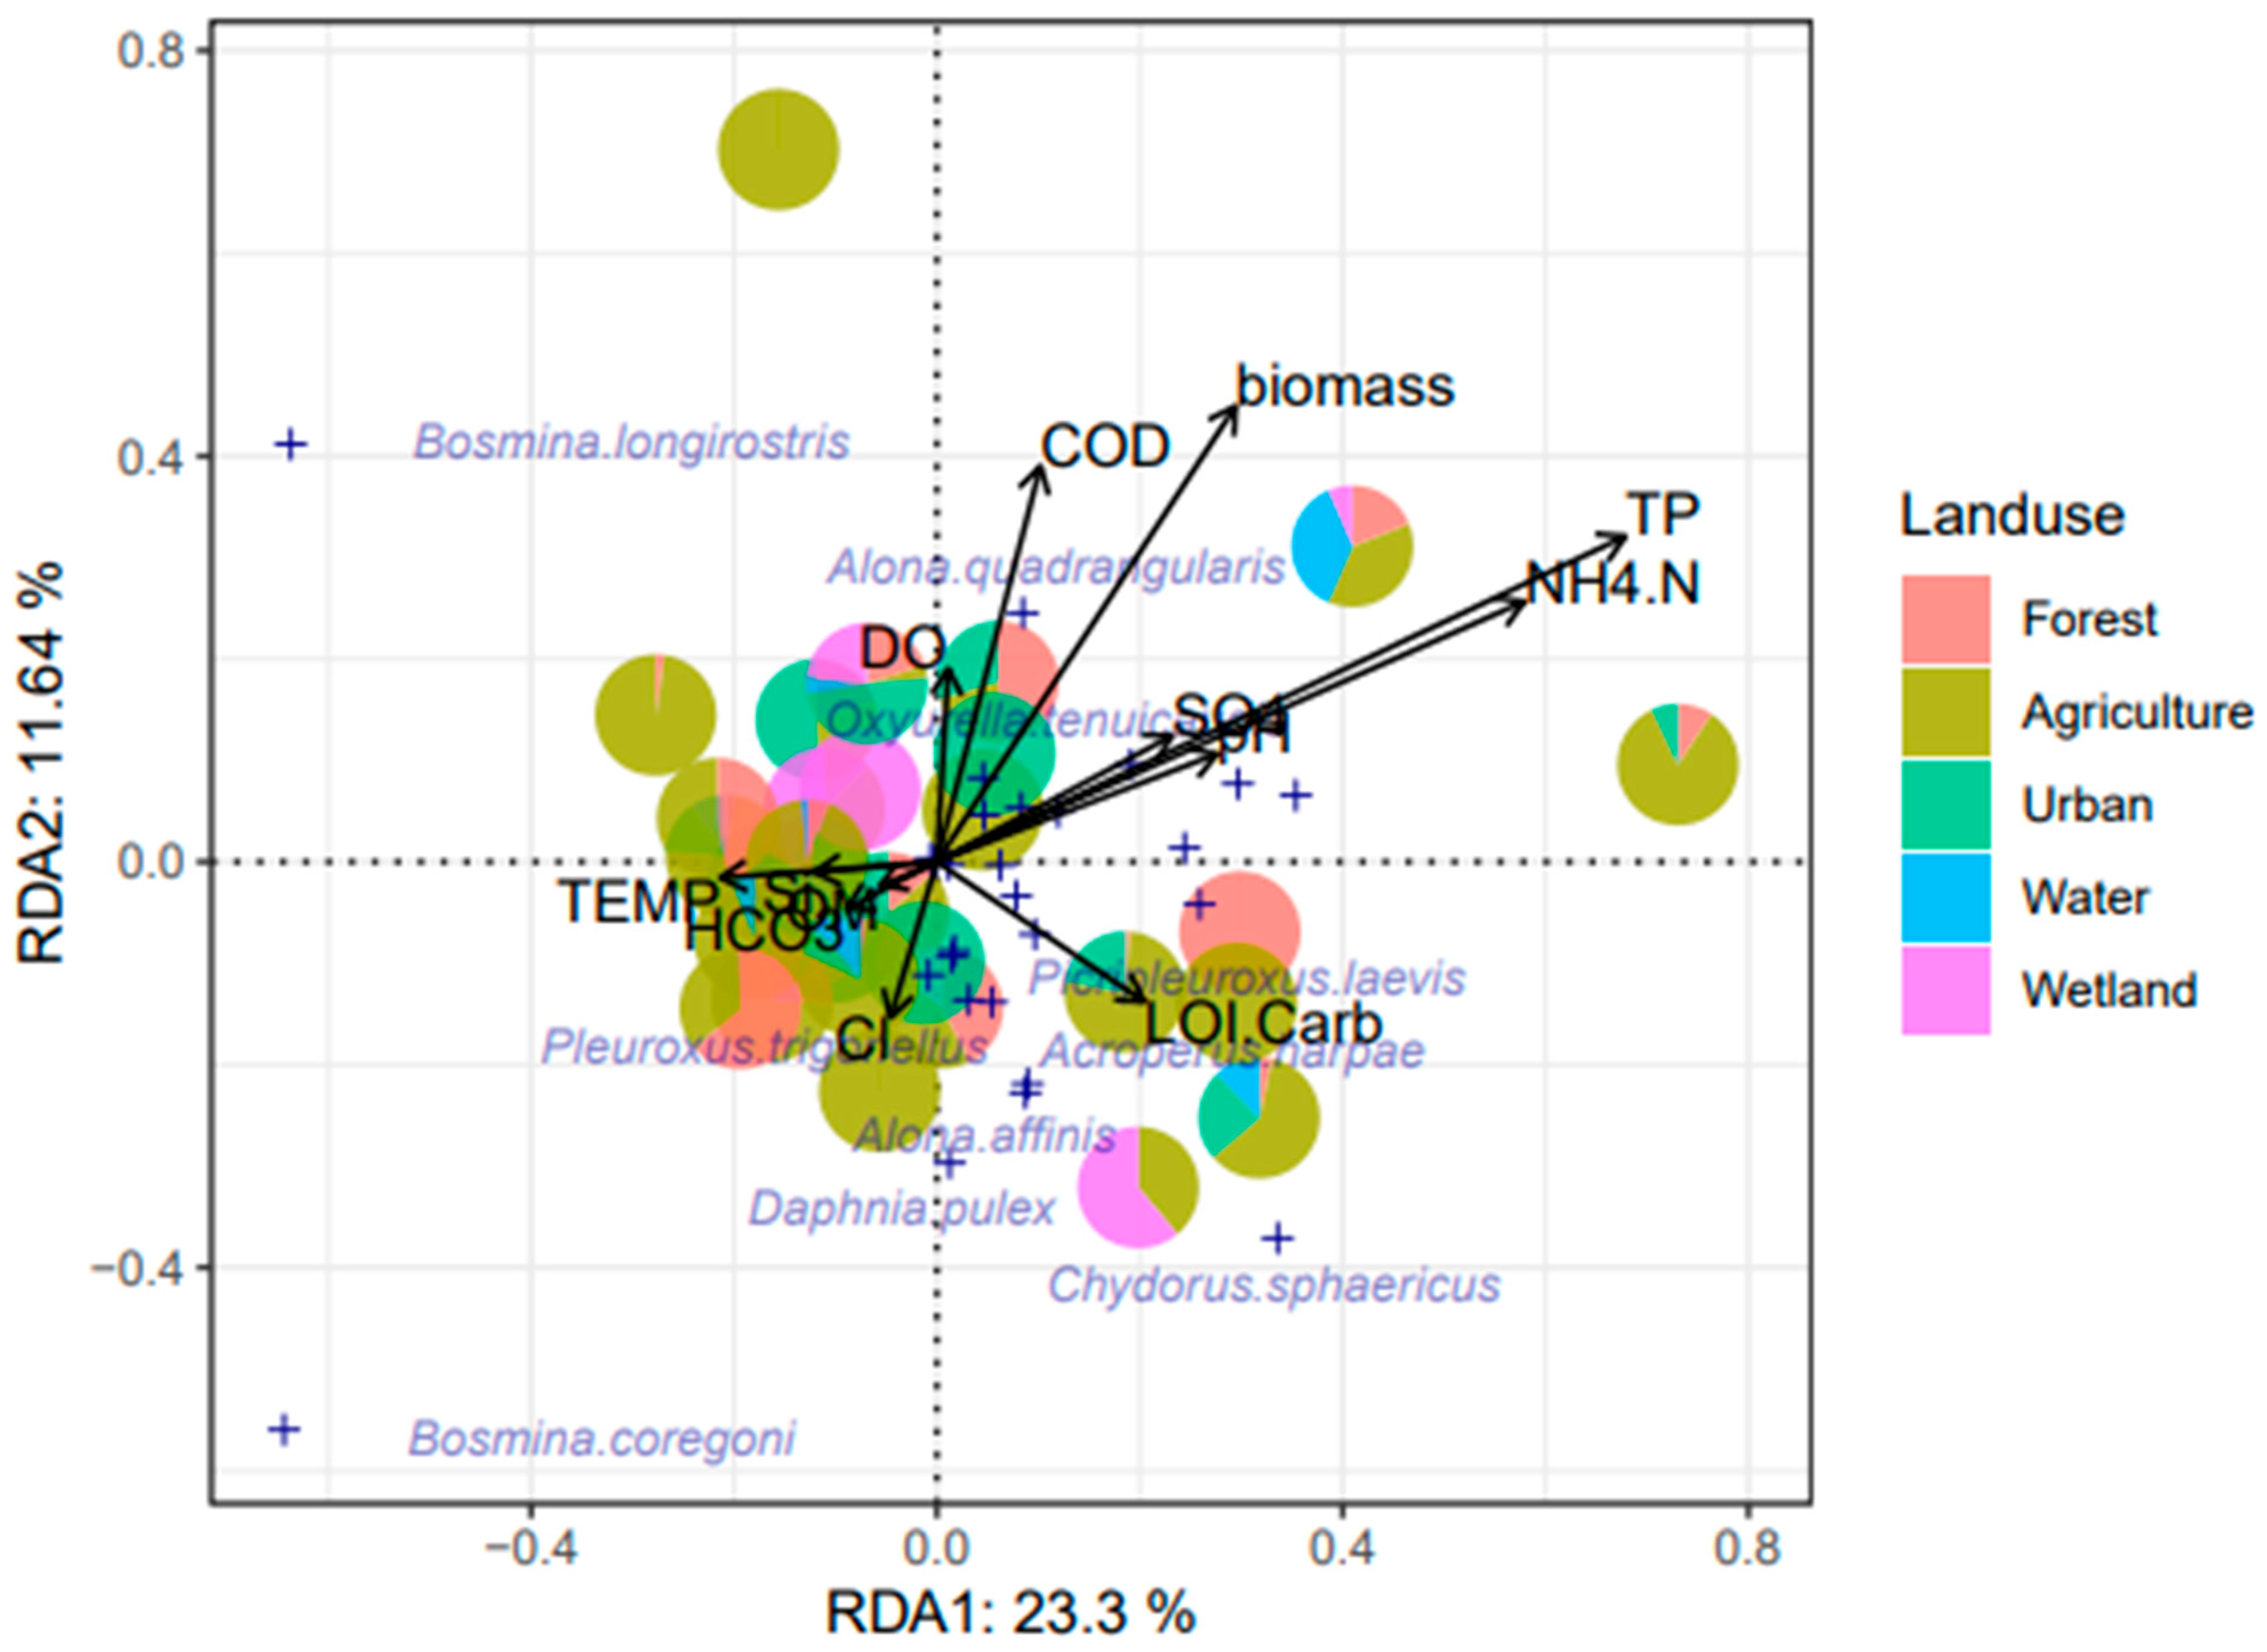
In further analysis, partial RDA identified the most influential water chemistry factors that significantly explained the variation in the Cladocera community data, as shown in Figure 7.
TP, NH4-N, algal biomass and COD were strongly positively associated with the variations in first and second RDA components, while OM and HCO3 were negatively correlated with these components (Figure 7). The variance of the partition and pRDA demonstrated that the land use effects and water chemistry variables collectively explained the cladoceran community. Stepwise selection was applied in the pRDA, revealing the most effective variables in determining cladoceran compositions, with TP identified as the most important driver (Table 4).
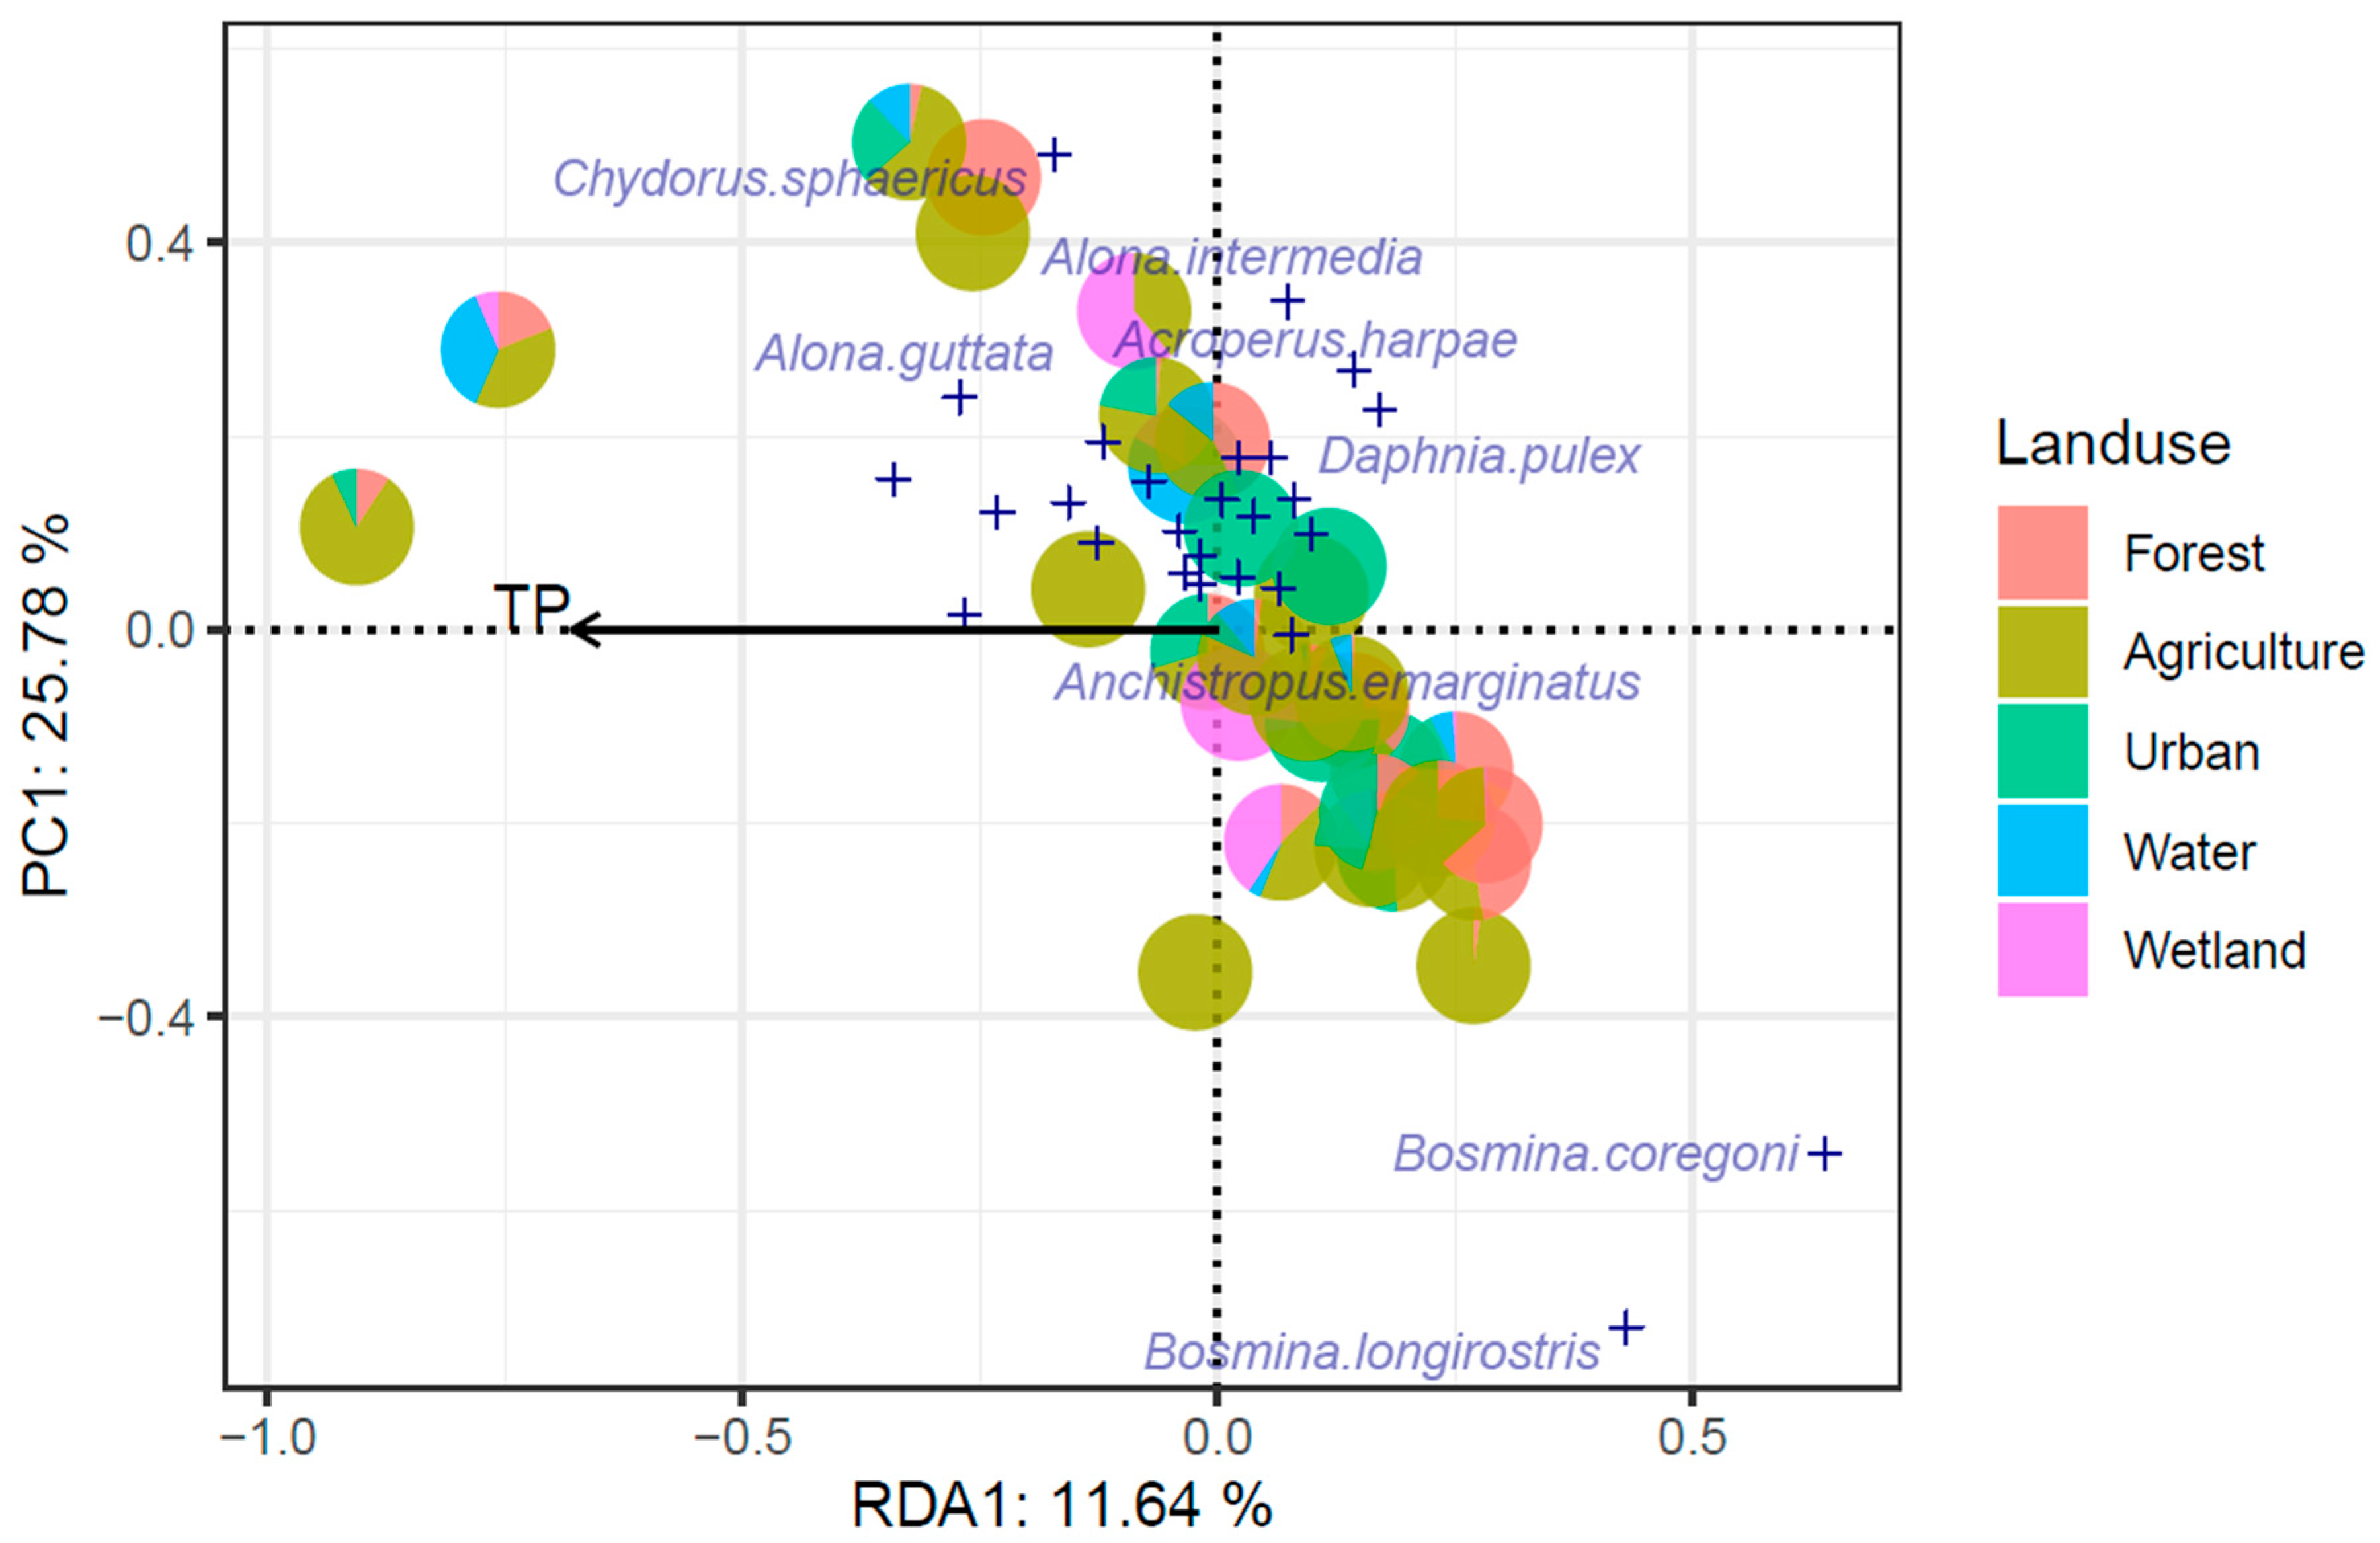
TP, as revealed by the RDA (Figure 8), influenced the distribution of cladocerans, accounting for 11.64% of the variance, while the remaining variance was unconstrained. Two lakes (L57 and L62-ppendix C), which have high TP content (1.02 and 1.49 mg L−1, respectively) were removed. When these lakes were removed from the pRDA, neither of the environmental variables became significant.

3.5. End-Member Mixing Analysis (EMMA) Results

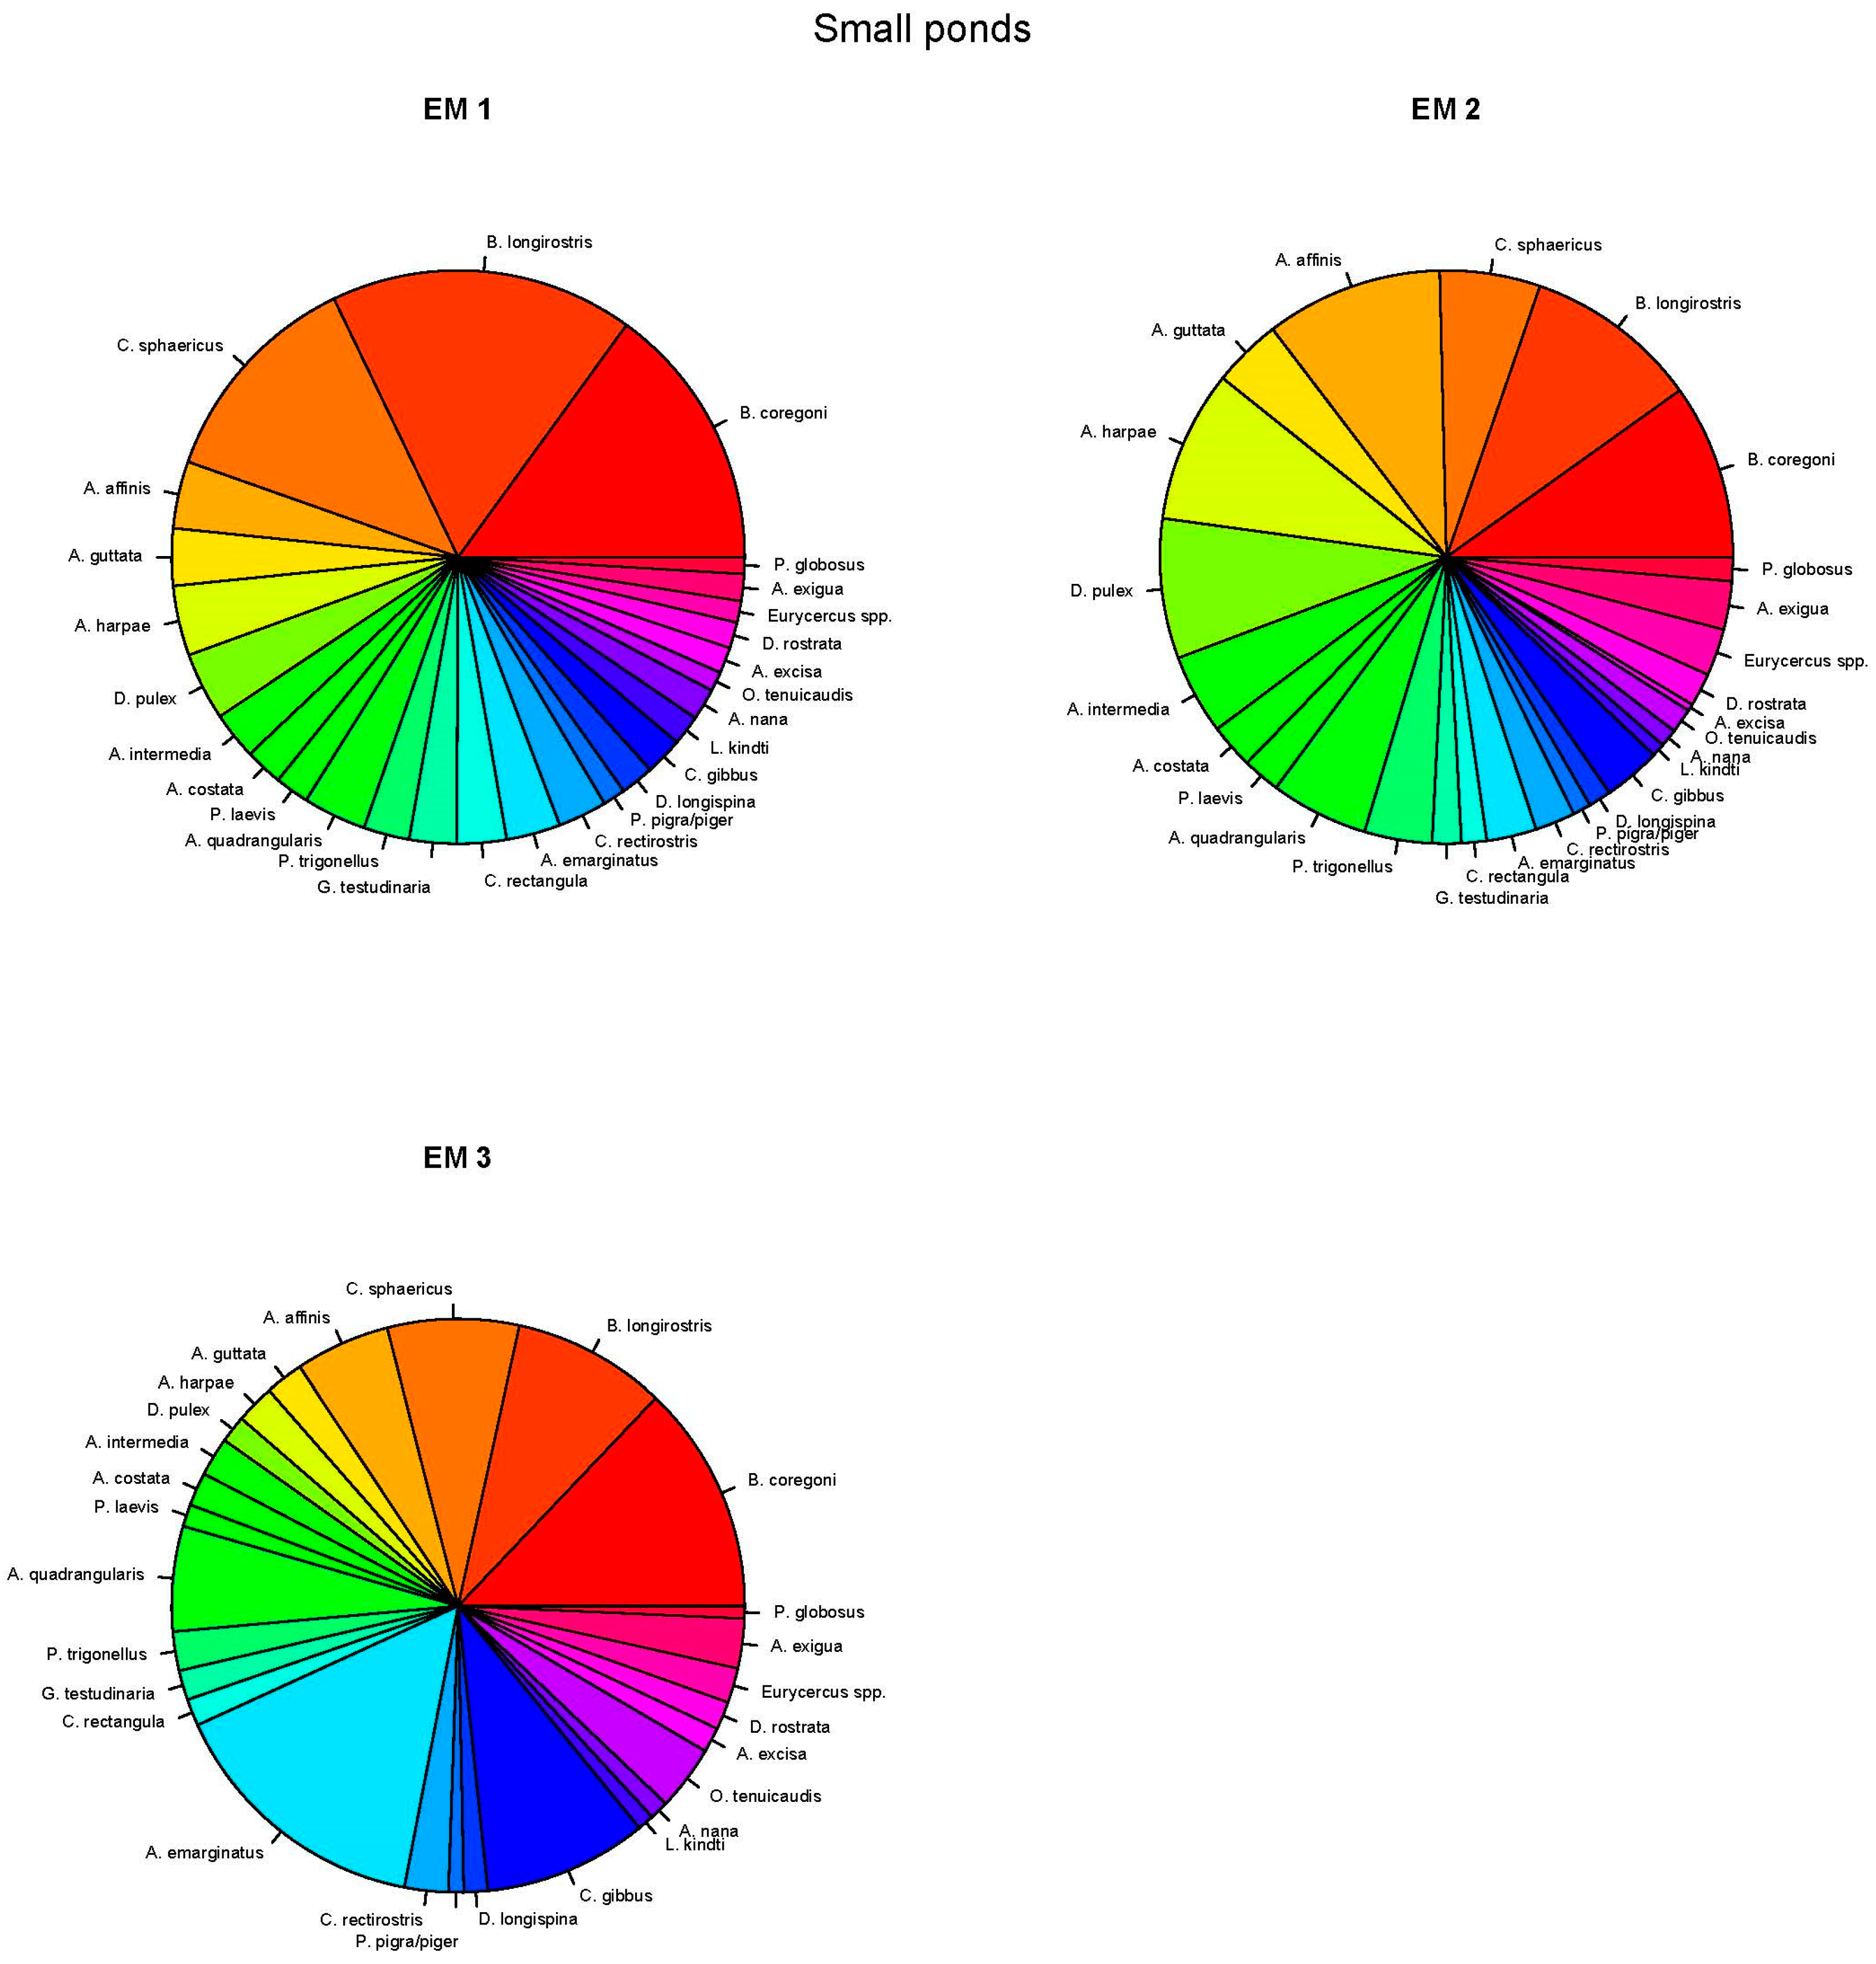
End-member analysis (EMMA) was used to classify the cladoceran communities based on the land use gradients (Figure 9).
Results showed species dominance of B. longirostris, B. coregoni, and C. sphaericus in EM1, EM2, and EM3 (Figure 9). In EM1, the two common bosmids, B. longirostris and B. coregoni, and C. sphaericus dominated in the cladoceran community. These species exhibited strong correlations with agriculture and urban land use, as shown in Figure 5 and Figure 7. EM 2 exhibited balanced species distribution compared to EM 1, with few taxa in dominance. In addition, the prevalence of littoral species such as A. harpae, D. pulex, A. affinis, A. intermedia, A. quadrangularis, P. trigonellus, and C. gibbus also increased. These species were observed and prefer open water. Species composition of EM3 showed a closely similar pattern to that of EM2 but exhibited an increased importance of A. emarginatus and C. gibbus. We compared the Cladocera clustering among the land use gradients at the selected sites (Figure 10).
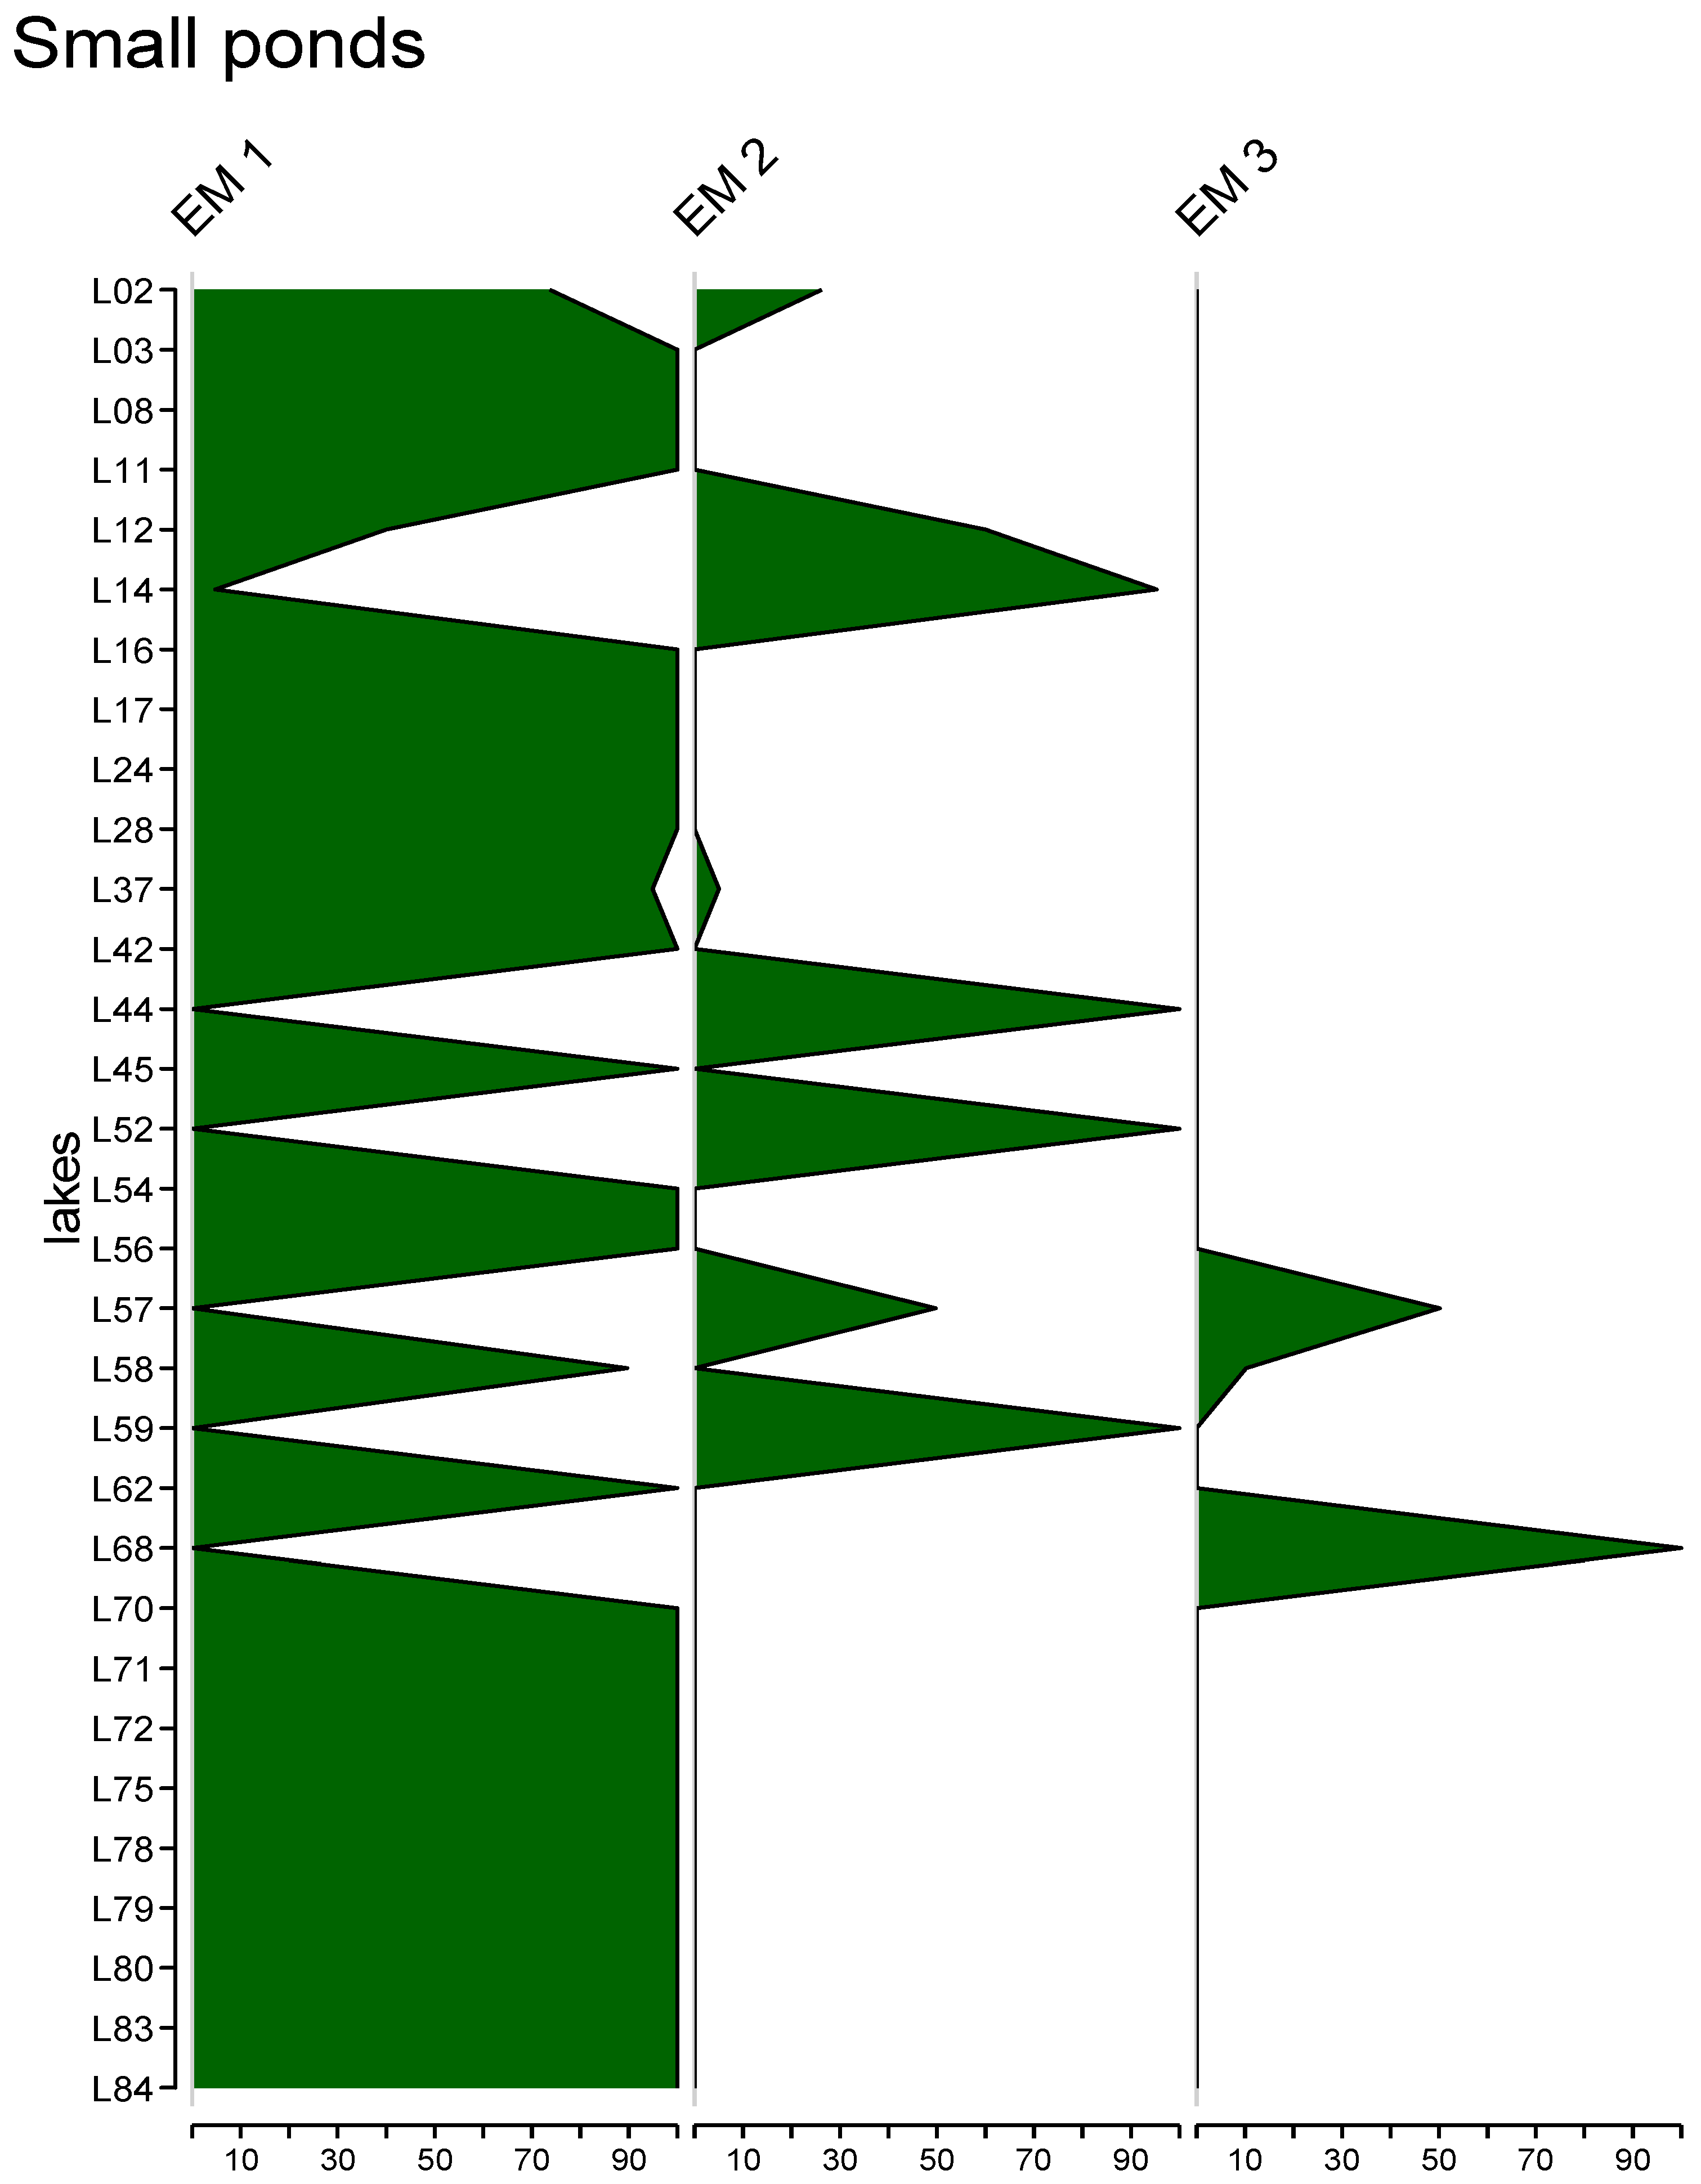
The EM score (Figure 10) reveals land use gradients in the small lakes, where EM1 represents the dominant land use, primarily agriculture and urban use. The land use of these lakes is distributed as follows: agriculture (58.12%), urban use (19.52%), forest (16.30%), water (3.34%), and wetland (2.72%). As expected, high nutrient loads travelled from anthropogenic sources, agriculture, and urban areas into these lakes. EM2 scores denote lakes with balanced distribution across land use types and environmental variables, exhibiting a mixed pattern. Land use distribution of these lakes includes agriculture (27.78%), urban (24.94%), forest (20%), wetland (15.64%), and open water (11.64%). These lakes appeared as intermediate systems, indicating the influence of anthropogenic factors resulting from agricultural and urban use. The EM 3 group indicated lakes with less human impact (agricultural and urbanisation). Wetlands and forests dominated this group. Wetland types (53.26%) were the most dominant, followed by agriculture (18.79%), open water (18.47%), and forest (9.48%) in EM3. No urban-use lakes were identified in this group, and as expected, the lakes indicated low nutrient levels and a low value for aquatic systems.

4. Discussions

4.1. Environmental Variables and Land Use Types

This research examined the impact of land use types on the influence of cladoceran communities in small, shallow, and pond lakes in Hungary. Although our findings showed that the Cladocera assemblage and distribution patterns were minimally influenced by land use activities, with partial RDA explaining 20% of the observed variation, other factors explained the remaining variation. Water chemistry parameters accounted for approximately 50%, while unmeasured variables, fish predation, and additional variables not included in this study contributed the remaining 50%. The RDA revealed that the total phosphorus was the only significant variable factor in shaping the distribution patterns of Cladocera species, comparable to previous studies [17,41,42].
Correlation analyses revealed significant relationships between the key variables of ecological importance. The correlation of nutrients with the conductivity and chloride and bicarbonate ions suggests the common effect of agriculture and urban land use [42,43]. The nutrient enrichment increases primary productivity. During higher primary production, the bicarbonate/carbonate ion content of the lake water increases since the inorganic carbon balance moves to the carbonate side, therefore elevating the pH. Expanding agriculture and urban land use drive nutrients, contributing to eutrophication and degradation of the water quality [44,45].

4.2. Cladocera Analysis and Responses to Land Use Types

Diversity indices revealed no responsiveness of cladoceran communities to land use (Appendix F). Lakes have been found in all land use categories, presenting a high effective number of species. Neither TP nor algal biomass presented a correlation with the true diversity (TP: t = 0.45022, df = 29, p-value = 0.656; algal biomass t = 0.36292, df = 29, p-value = 0.719). Although the alpha and beta diversity of lakes do not seem to depend on the land use, the land use exerts a measurable influence on the substantial variance in Cladocera community composition, reflecting complex interactions among environmental variables, including nutrient availability and algal and other biological dynamics in the lake. In our study, agriculture and urbanisation were considered the primary sources of anthropogenic pollution.
Agriculture (61%) revealed its prevalence in the study sampling areas; it represents a 3.5% contribution to Hungary’s GDP, and 50% of land is under agricultural use, suggesting its vulnerability to agricultural run-off [40]. The first RDA component (Figure 6) linked agricultural and urban areas, through B.longirostris and C. sphaericus, common eutrophication-related Cladocera [46] that are closely linked to agricultural–urbanisation activities. Urbanisation (19%) contributed secondarily to anthropogenic sources of lake pollution. Elevated temperatures in urban lakes are associated with heat island effects, leading to increased algal biomass and bloom [46]. Urban use correlated with C. sphaericus, A. excisa, and A. costata, as shown in Figure 5 and Figure 6. These species are typically found in eutrophic environments. Urbanisation leads to temperature warming, alteration of water pH, and algal growth, which significantly affect the composition of Cladocera species. Our results aligned with other findings, indicating that agriculture and urban activities contribute to the deterioration of lake water quality [47].
Wetlands are well understood for their role in nutrient removal efficiency. The observed correlation between wetlands, open water, and dissolved oxygen (DO) in our analysis indicated biogeochemical conditions. Aquatic macrophytes and phytoplankton, through their photosynthetic and metabolic processes, create elevated dissolved oxygen (DO) levels in the water [48]. However, wetlands under hypoxic conditions in nutrient-rich lakes are detrimental to Cladocera species sensitive to DO [49]. In the vegetated and marshy wetland lakes, A. emarginatus and C. gibbus were observed as dominating. Lakes with open waters clustered with A. affinis and A. intermedia species with a preference for larger lakes and low pH (<6.5). We also noted D. pulex in shallow lakes, indicating lower trophic status and low planktivorous fish density. These findings are consistent with other studies on these species’ ecological preferences and may serve as bioindicators of wetland integrity [50]. In lakes with forest-dominated land use, the abundance of A. harpae indicated a less trophic condition, since A. harpae, a littoral scraper species, correlated with organic material, suggesting the occurrence of organic detritus for its dietary needs [51]. Forests contribute to organic matter through allochthonous inputs of vegetation debris runoff [52].

4.3. End-Member Analysis (EM1)

EM1 grouping analysis clustered lakes under different utilisation, characterised by high nutrient availability and physical–chemical properties. Agricultural and urban lakes showed the highest proportions in EM1, occurring in almost 77.64%, and other watersheds represented up to 22.36%. The bosmids and C. sphaericus were dominant in EM1, with a higher occurrence in eutrophic conditions [53]. Bosmina spp. are filter feeders, and C. sphaericus is benthic, detrital/littoral feeders. These species can adjust to other habitat niches, such as pelagic zones, and quickly colonise habitats under increased productivity [54]. The lakes under EM1 were characterised by a high degree of agriculture–urban land use, with high species dominance and low species diversity. A decline in the dominance of species competitively eliminates other taxa, resulting in a negative relationship between species richness and ecological function. These interactions reduce the resilience and stability of an ecosystem to changes in the environment and other disturbances [55].

4.4. End-Member Analysis (EM2)

The observed patterns in EM2 in Cladocera assemblages highlighted the influence of land use and nutrient conditions on species composition. Lakes under moderate land use and nutrient conditions fell in this category (EM2), including agriculture/urban use (52.72%) and watersheds and forest/wetlands/open water (47.28%). The EM2 group supported habitat partitioning and the coexistence of community heterogeneity. Planktonic taxa included bosmids (B. coregoni, B. longirostris), D. pulex, and Daphnia spp., which are pelagic and require moderately nutrient-rich and stable conditions. In extreme situations, for example, in fish-dominated lakes, Daphnia spp disappear due to predation effects, and the B. longirostris population increases [56]. These species, including A. affinis, A. quadrangularis, A. harpae, A. intermedia, and P. trigonellus, typically associated with dense vegetation and stony bottoms, also occurred in moderate abundance. Littoral scrapers like A. guttata also proved the vast adaptive capacity of the habitat [51]. We also noted high proportions of pollutant-loving species in the EM2 cluster, like C. sphaericus and B. longirostris, which exhibited a less frequent distribution compared to EM1. These lakes provided stable, trophic conditions for Cladocera communities in high trophic status under natural surroundings. The variations in the cladoceran community in EM2 suggested community stability, species tolerance, and transitional phases of the lakes under environmental and anthropogenic pressures [56].

4.5. End-Member Analysis (EM3)

In contrast, the EM3 group represented the lakes with lower nutrient loads and isolated habitat preferences. The predominant land use classification surrounding these lakes included wetlands (53.26%), open waters (18.47%), agriculture (18.79%), and forest (9.48%). No urban land use occurred. Among the dominating species are B. coregoni, B. longirostris, C. sphaericus, A. emarginatus, C. gibbus, and A. quadrangularis. Of relevance, A. emarginatus, a slow-moving species, was found uniquely dominating in this group, usually inhabiting submerged vegetation. C. gibbus relative abundance was also high, with a preference for littoral zones and an absent from small ponds. Other dominating species, A. quadrangularis, also dominated in moderate proportions, indicating the ecological status and variety of vegetated habitats with decreased eutrophication [18]. The coexistence of Bosmina spp. and C. sphaericus dominance patterns in all the EMs indicated compositional levels in terms of impact on nutrient enrichment, reflecting the contributory nutrient loading from agricultural use (18.79%) into this group and revealing the species’ broad range adaptive capacities. These findings also highlight the role of isolated lakes as refugia for specialised species, and the Cladocera assemblage generally displays stronger responses to nutrient levels and sensitive indicators of lake trophic state [23].

5. Conclusions

This research found that the land use attributes contributed to differences in various types of habitats and Cladocera communities’ response to nutrient trophic state in the lakes. According to our findings, TP was the primary environmental variable in shaping the distribution of Cladocera communities. Land use did not significantly influence the distribution of the Cladocera community, but other interactions between ecological variables contributed substantially to the variations. The end-member analysis revealed distinct land use patterns and their impacts on the Cladocera species composition.
Land use analysis provided critical information on Cladocera community dynamics. Agriculture and urban land use correlated with eutrophication indicator species and indicated potential pathways of lake contamination. Nutrient-preferring species significantly revealed the trophic status, with eutrophic sites showing few Cladocera species in dominance; in contrast, in moderate nutrient environments, a more balanced community pattern was observed. Pollutant-avoidant species increased from eutrophic to moderate–low-nutrient lakes in the watershed areas (forests, wetlands, and open waters), revealing that these lakes provided nutrient buffer zones and refuge sites for species.
There were also overlapping elements; generalist species, such as B. longirostris and C. sphaericus, were found in most lakes, demonstrating their ability to adapt to different abiotic conditions. The distribution patterns of the Cladocera community revealed the prevailing limnological conditions attributed to land use types. In conclusion, we identified linkages between land use patterns, water chemistry parameters, and the Cladocera community, which may represent a valuable and efficient method to quantify critical drivers in aquatic dynamics in paleolimnological studies.

Author Contributions

Conceptualization, I.G. and J.K.; data curation, J.K.; formal analysis, I.G. and J.K.; investigation, S.M.A.W., J.J., U.A.K., A.G.S., G.S. and A.B.; methodology, I.G. and J.K. visualisation, I.G., J.K., Z.S., G.S. and S.M.A.W.; A.G.S. writing, original draft preparation, I.G. and S.M.A.W.; writing, review and editing, I.G., J.K., U.A.K., A.G.S., J.J., A.B., Z.S. and S.M.A.W.; supervision, I.G.; project administration, I.G. All authors have read and agreed to the published version of the manuscript.

Funding

Jázmin Jakab was supported by the PhD Excellence Scholarship from the Count István Tisza Foundation for the University of Debrecen and by the EKÖP-24-3 University Research Scholarship Program of the Ministry for Culture and Innovation from the source of the National Research, Development and Innovation Fund. The research presented in the article was carried out within the framework of the Széchenyi Plan Plus, program with the support of the “RRF 2.3.1 21 2022 00008” project. Project no. TKP2021-NKTA-32 was implemented with the support provided by the Ministry of Innovation and Technology of Hungary from the National Research, Development and Innovation Fund, financed under the TKP2021-NKTA funding scheme. The research was carried out within the framework of the National Laboratory for Water Science and Water Security RRF 2.3.1 212,022 00008. János Korponai was supported by National Research Development and Innovation Office (NKFIH 120595), NKFIH KKP 144068. National Laboratory for Climate Change (RRF-2.3.1.-21-2022-00014). Géza Selmeczy was supported by: FK 137979.

Data Availability Statement

The raw data supporting this study will be made available upon request by the authors.

Acknowledgments

We would like to thank the University of Debrecen, Department of Hydrobiology.

Conflicts of Interest

The authors declare that they have no conflicts of interest. The funders had no role in the design of the study, in the collection, analysis, or interpretation of data, in the writing of the manuscript, or in the decision to publish the results.

Appendix A

Table A1. Summary statistics of the environmental parameters.
ParametersNMeanSDMinMaxMedianSkewKurtosis
organic matter (%)3118.2211.581.9644.314.790.33−1.1
carbohydrates3126.0537.850.0191.930.150.83−1.26
temperature (°C)3125.652.5721.131.525.6−0.13−0.57
pH318.51.197.89.998.65−3.4614.25
conductivity (µS cm−1)31684.97528.06129.724104831.592.16
dissolved oxygen319.43.322.5115.248.930.09−0.77
chloride317.311.410.3551.52.752.325.25
COD315.824.370.2518.65.150.890.32
carbonate310.230.3201.0501.240.18
bicarbonate312.361.550.56.851.91.30.94
sulphate3119.3826.881.06128.4112.392.456.52
ammonium-N310.080.130.010.590.022.676.67
nitrite-N3139.03213.10.081187.260.425.0424.19
nitrate-N311.140.80.233.390.91.160.42
total phosphorus31258.67294.9711.31492.18159.542.848.39
silicate3144.14224.57012542.465.0424.18
biomass3115,691.9915,866.4244.3761,750.0212,702.831.220.85
SD = standard deviation; COD = chemical oxygen demand.

Appendix B

Table A2. Environmental variables (with significantly strong variables).
Variable 1Variable 2Correlation (r)p-Value
ClCOND0.879<0.001
NO3-NCOND0.855<0.001
NO3-NCl0.823<0.001
NO3-NHCO30.697<0.001
NH4-NTP0.656<0.001
DOBiomass0.640<0.001

Appendix C

Table A3. Lake use types and GPS coordinates.
Sampling SitesCodeGPS_XGPS_YLand Use
1Törökszentmiklós tóL220.41952147.17156Urban
2Cibakházi Holt-TiszaL320.1715946.95589Agri
3Verba tanya horgásztóL821.779348.02191Agri
4Kengyel tóL1121.3572648.0941Agri
5BányatóL1221.3569148.12721Agri
6Csónakázó-tóL1421.7283748.0038Urban
7Fegyverneki Holt-Tisza, FegyvernekL1620.4695447.25305Agri
8MorotvaL1721.6137648.17478Forest
9Szerencs, Homokos tóL2421.2162948.15429Urban
10Arlói-tóL2820.2685448.16256Forest
11Szelidi-tóL3719.0372346.62177Agri
13VörösmocsárL4419.18394646.4629Wetland
14Csárda-szék magántóL4519.45294846.758252Agri
15Tasskertes halastótelepL4719.0943147.01221Agri
16Hársas-tóL5216.3128146.93279Forest
17Szt. István csatorna-tóL5418.9340446.19504Urban
18Kráter tóL5621.4025647.53836Agri
19Harkai tóL5719.5974246.47481Agri
20Sós-tó, strandL5819.4683346.45547Agri
21Kunfehértó horgásztóL5919.3955246.37941Water
22Szalma-tóL6219.314.69446.683259Agri
23Kolon-tóL6819.33631246.762232Wetland
24Zis-tóL7017.1105846.22813Agri
25Pék-tóL7119.32441446.67826Agri
26Vadkerti-tó, strandL7219.3903146.61083Urban
27Szénaréti tóL7522.1177347.84809Urban
28BSZL7821.69485748.3494Agri
29VISSL7921.49039648.23441Agri
30KBNML8021.59692548.323261Agri
31SulcL8321.68195848.332417Agri

Appendix D

Figure A1. Spearman’s correlation matrix between environmental variables and land use types (* p value < 0.05, ** p value < 0.01, *** p value < 0.001).
Diversity 17 00642 g0a1

Appendix E

Table A4. Species abbreviations and scientific names.
Species AbbreviationsScientific Name
A. harpaeAcroperus harpae
A. guttataAlona guttata
A. quadrangularisAlona quadrangularis
A. affinisAlona affinis
A. intermediaAlona intermedia
A. costataAlona costata
A. rusticaAlona rustica
A. excisaAlonella excisa
A. nanaAlonella nana
A. exiguaAlonella exigua
A. emarginatusAnchistropus emarginatus
B. coregoniBosmina coregoni
B. longirostrisBosmina longirostris
C. rectirostrisCamptocerus rectirostris
C.fennicusCamptocerus fennicus
C. sphaericusChydorus sphaericus
C. gibbusChydorus gibbus
C. rectangulaCoronatella rectangula
C. lilljeborgiCamptocercus lilljeborgi
D. pulexDaphnia pulex
D. longispinaDaphnia longispina
D. brachyurumDiaphanosoma brachyurum
D. rostrataDisparalona rostrata
Eurycercus spp. Eurycercus spp.
G. testudinariaGraptoleberis testudinaria
L. acathocercoidesLeydigia acanthocercoides
L. kindtiiLeptodora kindtii
P. globususPseudochydorus globosus
P. laevisPleuroxus laevis
P. trigonellusPleuroxus trigonellus
P. uncinatusPleuroxus uncinatus
O. tenuicaudisOxyurella tenuicaudis
M. disparMonospilus dispar

Appendix F

Table A5. True diversities (effective number of species).
CodeRichnessShannon’sSimpson
L0274.2983.123
L0373.1612.524
L0883.1492.359
L11125.1063.211
L123017.83013.329
L14126.9085.103
L16105.8574.199
L1792.9942.142
L241710.0307.271
L28157.5244.944
L3783.8062.922
L42105.5094.090
L44119.2888.472
L4511.0001.000
L522518.11413.212
L5473.0122.445
L5674.9484.155
L572217.35713.868
L58116.2484.320
L59118.7917.735
L62107.0435.597
L6875.5154.654
L7062.5732.246
L71127.3035.402
L72106.0274.325
L75144.5502.940
L78148.2456.296
L7962.7272.341
L8084.6703.651
L832415.49311.503
L84115.6663.430

References

  1. Meyer, S.T.; Ebeling, A.; Eisenhauer, N.; Hertzog, L.; Hillebrand, H.; Milcu, A.; Pompe, S.; Abbas, M.; Bessler, H.; Buchmann, N.; et al. Effects of biodiversity strengthen over time as ecosystem functioning declines at low and increases at high biodiversity. Ecosphere 2016, 7, e01619. [Google Scholar] [CrossRef]
  2. Leira, M.; Cantonati, M. Effects of water-level fluctuations on lakes: An annotated bibliography. In Ecological Effects of Water-Level Fluctuations in Lakes Springer Netherlands; Springer: Dordrecht, The Netherlands, 2008; pp. 171–184. [Google Scholar] [CrossRef]
  3. Mitsch, W.J.; Bernal, B.; Nahlik, A.M.; Mander, Ü.; Zhang, L.; Anderson, C.J.; Jørgensen, S.E.; Brix, H. Wetlands, carbon, and climate change. Landsc. Ecol. 2013, 28, 583–597. [Google Scholar] [CrossRef]
  4. Tian, Y.; Zhao, Y.; Zhang, X.; Li, S.; Wu, H. Incorporating carbon sequestration into lake management: A potential perspective on climate change. Sci. Total Environ. 2023, 895, 164939. [Google Scholar] [CrossRef]
  5. Meyers, P.; Teranes, J. Sediment Organic Matter. In Tracking Environmental Change Using Lake Sediments; Kluwer: Dordrecht, The Netherlands, 2006; pp. 239–269. [Google Scholar] [CrossRef]
  6. Schmieder, K. European lake shores in danger-concepts for a sustainable development. Limnologica 2004, 34, 3–14. [Google Scholar] [CrossRef]
  7. Rawcliffe, R.; Sayer, C.D.; Woodward, G.; Grey, J.; Davidson, T.A.; Iwan Jones, J. Back to the future: Using palaeolimnology to infer long-term changes in shallow lake food webs. Freshw. Biol. 2010, 55, 600–613. [Google Scholar] [CrossRef]
  8. Dos Santos, N.G.; Chiarelli, L.J.; Morari, P.H.R.; de Souza, M.E.T.; Calixto, G.; Kato, B.E.D.; Rodrigues, G.L.D.P.; Figueira, L.C.; Castilho-Noll, M.S.M. How land use affects freshwater zooplankton communities: A global overview. Hydrobiologia 2024, 852, 2555–2580. [Google Scholar] [CrossRef]
  9. Allan, J.D. Landscapes and riverscapes: The influence of land use on stream ecosystems. Annu. Rev. Ecol. Evol. Syst. 2004, 35, 257–284. [Google Scholar] [CrossRef]
  10. Oliver, T.H.; Morecroft, M.D. Interactions between climate change and land use change on biodiversity: Attribution problems, risks, and opportunities. Wiley Interdiscip. Rev. Clim. Change 2014, 5, 317–335. [Google Scholar] [CrossRef]
  11. Li, Y.; Xie, P.; Zhao, D.; Zhu, T.; Guo, L.; Zhang, J. Eutrophication strengthens the response of zooplankton to temperature changes in a high-altitude lake. Ecol. Evol. 2016, 6, 6690–6701. [Google Scholar] [CrossRef]
  12. O’Driscoll, M.; Clinton, S.; Jefferson, A.; Manda, A.; McMillan, S. Urbanization effects on watershed hydrology and in-stream processes in the southern United States. Water 2010, 2, 605–648. [Google Scholar] [CrossRef]
  13. Semenova, A.S.; Tchougounov, V.K. The Distribution of Moina micrura Kurz, 1875 (Crustacea: Moinidae) in the Russian Part of the Vistula Lagoon (Baltic Sea). Russ. J. Biol. Invasions 2018, 9, 175–183. [Google Scholar] [CrossRef]
  14. Eggermont, H.; Martens, K. Preface: Cladocera crustaceans: Sentinels of environmental change. Hydrobiologia 2011, 676, 1–7. [Google Scholar] [CrossRef]
  15. Forró, L.; Korovchinsky, N.; Kotov, A.; Petrusek, A. Global diversity of cladocerans (Cladocera; Crustacea) in freshwater. Hydrobiologia 2008, 595, 177–184. [Google Scholar] [CrossRef]
  16. Kotov, A.; Forró, L.; Korovchinsky, N.M.; Petrusek, A. World Checklist of freshwater Cladocera Species; Catalogue of Life: Leiden, The Netherlands, 2020. [Google Scholar] [CrossRef]
  17. Chen, G.; Dalton, C.; Taylor, D. Cladocera as indicators of trophic state in Irish lakes. J. Paleolimnol. 2010, 44, 465–481. [Google Scholar] [CrossRef]
  18. Gyulai, I.; Korponai, J.; Wamugi, S.M.A.; Jakab, J.; Kawu, U.A.; Soltész, A.G.; Karches, T.; Tumurtogoo, U. Cladocera and Geochemical Variables from Core Sediments Show Different Conditions of Hungarian Lakes. Water 2024, 16, 1310. [Google Scholar] [CrossRef]
  19. Shumate, B.C.; Schelske, C.L.; Crisman, T.L.; Kenney, W.F. Response of the cladoceran community to trophic state change in Lake Apopka, Florida. J. Paleolimnol. 2002, 27, 71–77. [Google Scholar] [CrossRef]
  20. Amsinck, S.L.; Jeppesen, E.; Landkildehus, F. Relationships between environmental variables and zooplankton subfossils in the surface sediments of 36 shallow coastal brackish lakes with special emphasis on the role of fish. J. Paleolimnol. 2005, 1, 39–51. [Google Scholar] [CrossRef]
  21. Bjerring, R.; Becares, E.; Declerck, S.; Gross, E.M.; Hansson, L.-A.; Kairesalo, T.; Nykänen, M.; Halkiewicz, A.; Kornijów, R.; Conde-Porcuna, J.M.; et al. Subfossil Cladocera in relation to contemporary environmental variables in 54 PanEuropean lakes. Freshw. Biol. 2009, 54, 2401–2417. [Google Scholar] [CrossRef]
  22. Korhola, A.; Rautio, M. Cladocera and Other Branchiopod Crustaceans. In Tracking Environmental Change Using Lake Sediments; Volume 4: Zoological Indicators; Kluwer Academic Publishers: Dordrecht, The Netherlands, 2006; Volume 4, pp. 5–41. [Google Scholar] [CrossRef]
  23. Jeppesen, E.; Nõges, P.; Davidson, T.A.; Haberman, J.; Nõges, T.; Blank, K.; Lauridsen, T.L.; Søndergaard, M.; Sayer, C.; Laugaste, R.; et al. Zooplankton as indicators in lakes: A scientific-based plea for including zooplankton in the ecological quality assessment of lakes according to the European Water Framework Directive (WFD). Hydrobiologia 2011, 676, 279–297. [Google Scholar] [CrossRef]
  24. Castanho Amaral, D.; de Fátima Bomfim, F.; Amodêo Lansac-Tôha, F. Drivers of zooplankton functional and taxonomic β-diversity in two neotropical floodplains: Implications for conservation. Biodivers. Conserv. 2024, 33, 3905–3922. [Google Scholar] [CrossRef]
  25. Gálvez, Á.; Castillo-Escrivà, A.; Magurran, A.; Alambiaga, I.; Bonilla, F.; Camacho, A.; García-Roger, E.M.; Iepure, S.; Miralles-Lorenzo, J.; Monrós, J.S.; et al. Higher alpha and gamma, but not beta diversity in tropical than in Mediterranean temporary ponds: A multi-taxon spatiotemporal approach. Limnol. Oceanogr. 2023, 68, 2402–2414. [Google Scholar] [CrossRef]
  26. Nevalainen, L.; Luoto, T. Relationship between cladoceran (Crustacea) functional diversity and lake trophic gradients. Funct. Ecol. 2016, 31, 488–498. [Google Scholar] [CrossRef]
  27. Selmeczy, G.B.; Tapolczai, K.; Padisák, J. Catchment land use drivers are weak predictors of lakes’ phytoplankton assemblage structure at functional group level. Hydrobiologia 2023, 850, 2075–2088. [Google Scholar] [CrossRef]
  28. Heiri, O.; Lotter, A.; Lemcke, G. Loss on Ignition as a Method for Estimating Organic and Carbonate Content in Sediments: Reproducibility and Comparability of Results. J. Paleolimnol. 2001, 25, 101–110. [Google Scholar] [CrossRef]
  29. Frey, D.G. The Ecological Significance of Cladoceran Remains in Lake Sediments. Ecology 1960, 41, 684–699. [Google Scholar] [CrossRef]
  30. Szeroczynska, K.; Samaj A-Korj, K.; Szeroczyfiska, K.; Sarmaja-Korjonen, K. Atlas of Subfossil Cladocera from Central and Northern Europe; Friends of the Lower Vistula Society: Swiecie, Polska, 2007. [Google Scholar]
  31. Copernicus Land Monitoring Service. Corine Land Cover (CLC) Datasets. 2018. Available online: https://doi.org/10.2909/71c95a07-e296-44fc-b22b-415f42acfdf0 (accessed on 21 August 2025).
  32. Hill, M.O. Diversity and evenness: A unifying notation and its consequences. Ecology 1973, 54, 427–432. [Google Scholar] [CrossRef]
  33. Jost, L. Partitioning diversity into independent alpha and beta components. Ecology 2007, 88, 2427–2439. [Google Scholar] [CrossRef]
  34. Telford, R.J.; Birks, H.J.B. A novel method for assessing the statistical significance of quantitative reconstructions inferred from biotic assemblages. Quat. Sci. Rev. 2011, 30, 1272–1278. [Google Scholar] [CrossRef]
  35. Legendre, P. Interpreting the replacement and richness difference components of beta diversity. Glob. Ecol. Biogeogr. 2014, 23, 1324–1334. [Google Scholar] [CrossRef]
  36. Podani, J.; Schmera, D. A new conceptual and methodological framework for exploring and explaining pattern in presence-absence data. Oikos 2011, 120, 1625–1638. [Google Scholar] [CrossRef]
  37. R Core Team. A Language and Environment for Statistical Computing; R Foundation for Statistical Computing: Vienna, Austria, 2024. [Google Scholar]
  38. Borcard, D.; Gillet, F.; Legendre, P. Numerical Ecology with R, 2nd ed.; Norsk Institutt for Naturforskning: Trondheim, Norway, 2018. [Google Scholar]
  39. Oksanen, J.; Gavin, L.; Guillaume Blanchet, S.; Kindt, R.; Legendre, P.; Peter, R.; Minchin, R.B.; O’Hara; Peter Solymos, M.; Henry, H.; et al. Ordination Methods, Diversity Analysis, and Other Functions for Community and Vegetation Ecologists. 2016. Available online: https://vegandevs.github.io/vegan/ (accessed on 21 August 2025).
  40. Hungarian Central Statistical Office. Agriculture Database; Hungarian Central Statistical office: Budapest, Hungary.
  41. Zawisza, E.; Zawiska, I.; Correa-Metrio, A. Cladocera Community Composition as a Function of Physicochemical and Morphological Parameters of Dystrophic Lakes in NE Poland. Wetlands 2016, 36, 1131–1142. [Google Scholar] [CrossRef]
  42. Hu, S.; Niu, Z.; Chen, Y.; Li, L.; Zhang, H. Global wetlands: Potential distribution, wetland loss, and status. Sci. Total Environ. 2017, 586, 319–327. [Google Scholar] [CrossRef]
  43. Cheng, L.; Xue, B.; Yao, S.; Liu, J. Response of Cladocera fauna to environmental change based on sediments from Shengjin Lake, a Yangtze River-connected lake in China. Quat. Int. 2020, 536, 52–59. [Google Scholar] [CrossRef]
  44. Keatley, B.E.; Bennett, E.M.; MacDonald, G.K.; Taranu, Z.E.; Gregory-Eaves, I. Land-use legacies are important determinants of lake eutrophication in the anthropocene. PLoS ONE 2011, 6, e15913. [Google Scholar] [CrossRef] [PubMed]
  45. Tong, Y.; Bu, X.; Chen, J.; Zhou, F.; Chen, L.; Liu, M.; Tan, X.; Yu, T.; Zhang, W.; Mi, Z.; et al. Estimation of nutrient discharge from the Yangtze River to the East China Sea and the identification of nutrient sources. J. Hazard. Mater. 2017, 321, 728–736. [Google Scholar] [CrossRef] [PubMed]
  46. Lanka, A.; Dimante-Deimantovica, I.; Saarni, S.; Stivrins, N.; Tylmann, W.; Zawiska, I.; Veski, S. Urbanization-driven Cladocera community shifts in the lake-a case study from Baltic region, Europe. Anthropocene 2024, 46, 100439. [Google Scholar] [CrossRef]
  47. DeSellas, A.M.; Paterson, A.M.; Sweetman, J.N.; Smol, J.P. Cladocera assemblages from the surface sediments of south-central Ontario (Canada) lakes and their relationships to measured environmental variables. Hydrobiologia 2008, 600, 105–119. [Google Scholar] [CrossRef]
  48. Ji, D.; Han, Y.; Long, L.; Xin, X.; Xu, H.; Qiu, S.; Meng, J.; Zhao, X.; Huang, Y.; Liu, D. Hypoxia and its feedback response to algal blooms and CH4 emissions in subtropical reservoirs. Front. Ecol. Evol. 2023, 11, 1297047. [Google Scholar] [CrossRef]
  49. Sarmaja-Korjonen, K.; Hakojärvi, M.; Korhola, A. Subfossil remains of an unknown chydorid (Anomopoda: Chydoridae) from Finland. Hydrobiologia 2000, 436, 165–169. [Google Scholar] [CrossRef]
  50. Norwegian Biodiversity Information Centre. Small Crustaceans in Fresh Waters. March 2017. Available online: https://biodiversity.no/Pages/214484/ (accessed on 21 August 2025).
  51. Ngo Ndje, A.C.N.; Mfayakouo, C.B.; Fadil-Djenabou, S.; Ndjigui, P.D. Multi-method characterization of the recent sediment from the Dibi subsidence lake in the tropical Adamawa region (central Cameroon): Implications for the palaeoenvironmental reconstruction. Int. J. Sediment Res. 2024, 39, 110–130. [Google Scholar] [CrossRef]
  52. Lanka, A.; Poska, A.; Bakumenko, V.; Dimante-Deimantovica, I.; Liiv, M.; Stivrins, N.; Zagars, M.; Veski, S. Subfossil Cladocera as indicators of pH, trophic state and conductivity: Separate and combined effects in hemi boreal freshwater lakes. Ecol. Indic. 2024, 167, 112592. [Google Scholar] [CrossRef]
  53. Bledzki, L.A.; Rybak, J.I. Freshwater Crustacean Zooplankton of Europe: Cladocera & Copepoda (Calanoida, Cyclopoida) Key to Species Identification, with Notes on Ecology, Distribution, Methods and Introduction to Data Analysis; Springer: Cham, Switzerland, 2016. [Google Scholar] [CrossRef]
  54. Creed, R.P.; Cherry, R.P.; Pflaum, J.R.; Wood, C.J. Dominant species can produce a negative relationship between species diversity and ecosystem function. Oikos 2009, 118, 723–732. [Google Scholar] [CrossRef]
  55. Gliwicz, Z.M.; Szymanska, E.; Wrzosek, D. Body size distribution in Daphnia populations as an effect of prey selectivity by planktivorous fish. Hydrobiologia 2010, 643, 5–19. [Google Scholar] [CrossRef]
  56. Zawiska, I.; Correa-Metrio, A.; Rzodkiewicz, M.; Wolski, J. Cladocera assemblages indicate environmental gradients of lake productivity and morphometry in central Europe. Boreas 2025, 54, 258–272. [Google Scholar] [CrossRef]
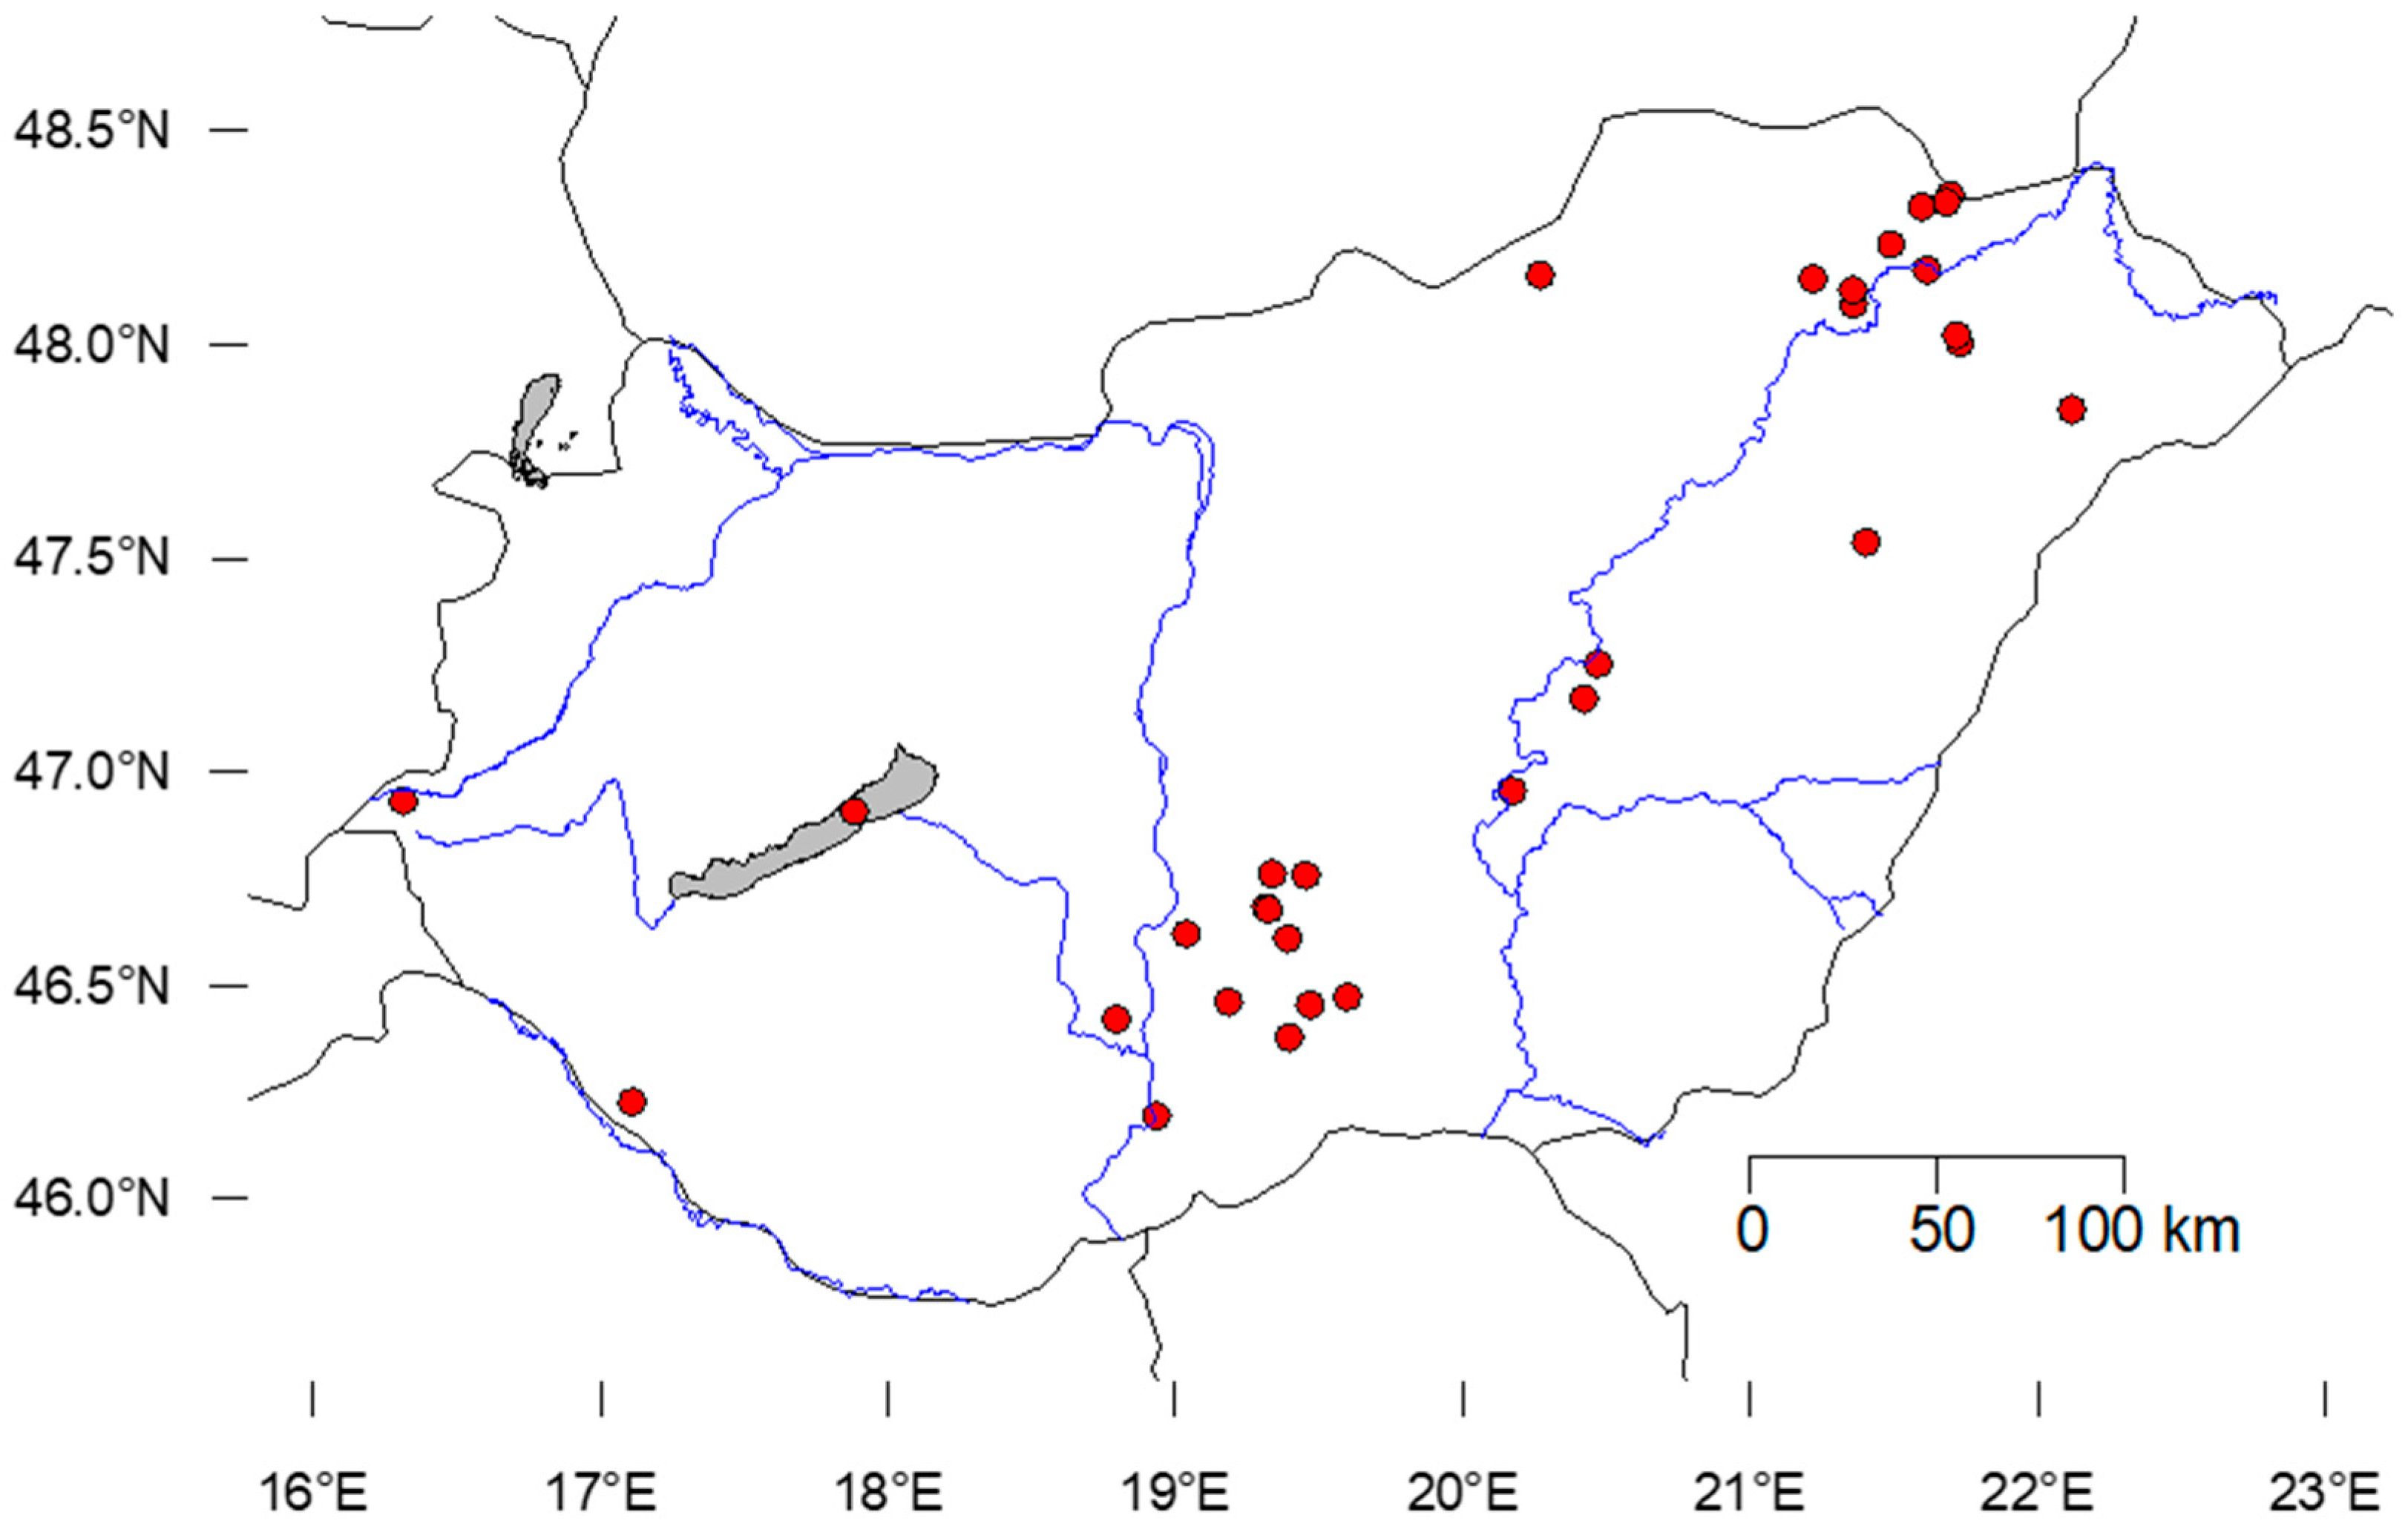
Figure 1. Location of sampling sites (red dots and blue lines indicate sampling points and major rivers in Hungary, respectively).
Diversity 17 00642 g001
Figure 2. Land use types of the surrounding sampling sites (%).
Diversity 17 00642 g002
Figure 3. Beta-diversity components for all the lakes.
Diversity 17 00642 g003
Figure 4. Beta diversity components (similarity, richness differences (diff), and replacement components).
Diversity 17 00642 g004
Figure 5. RDA of cladoceran communities. The colours of the pie charts indicate the proportion of land use types around the lakes. (To avoid crowding the figure, not all species names are plotted.).
Diversity 17 00642 g005
Figure 6. The effect of land use on Cladoceran communities. (The colour of the pie charts indicates the proportion of land use types around the lakes. To avoid crowding the figure, not all species names are plotted).
Diversity 17 00642 g006
Figure 7. Partial redundancy analysis (pRDA) of environmental variables and Cladocera communities. (Black arrows represent the environmental variables with a <20 VIF value; the colour of the pie charts indicates the proportion of land use types around the lakes. To avoid crowding the figure, not all species names are plotted).
Diversity 17 00642 g007
Figure 8. Partial RDA stepwise selected variable. The colour of the pie charts indicates the proportion of land use types around the lakes. To avoid crowding the figure, not all species names are plotted.
Diversity 17 00642 g008
Figure 9. EM scores in cladoceran communities.
Diversity 17 00642 g009
Figure 10. EM scores for land use gradients along the small lakes (%).
Diversity 17 00642 g010
Table 1. Effective number of species.
MinMaxMedianMean
Richness1301012
Shannon’s index11467
Simpson index11845
Table 2. The results of RDA. Partitioning of the variance of cladoceran communities.
InertiaProportion
Total0.34021.0000
Constrained0.06690.1966
Unconstrained0.27330.8034
Table 3. Partitioning of variances (partial RDA).
InertiaProportion
Conditioned0.066870.1966
Constrained0.161920.4759
Unconstrained0.111420.3275
Table 4. Partitioning of variance of the pRDA after stepwise selection.
InertiaProportion
Total0.34021.0000
Constrained0.03960.1164
Unconstrained0.30060.8836
Disclaimer/Publisher’s Note: The statements, opinions and data contained in all publications are solely those of the individual author(s) and contributor(s) and not of MDPI and/or the editor(s). MDPI and/or the editor(s) disclaim responsibility for any injury to people or property resulting from any ideas, methods, instructions or products referred to in the content.