Abstract
Unionid mussel populations in a section of the Clinch River in Virginia, USA, has declined substantially, but the causes of the decline remain unknown. To investigate this zone of decline (ZOD), we deployed juvenile freshwater mussels (Villosa iris in 2012 and Lampsilis fasciola in 2013) in both cages and silos at sites within the Clinch River System. We analyzed mussel tissues for trace element and organic contaminant concentrations, shells for trace elements, and environmental media (total water, dissolved water, particulate sediment, and bedload sediment) for both inorganic and organic contaminants. We found a few differences between mussels deployed in cages and those deployed in silos: survival was slightly lower in cages due to periodic sedimentation. Our results identified the ZOD based on the accumulation of trace elements (notably As, Cu, Fe, Mn, Ni, and Sr), polycyclic aromatic hydrocarbons (PAHs), and δ15N enrichment, with especially high concentrations found in the human-impacted tributaries, Dumps Creek and Guest River. Some correlations were found between environmental media and both mussel tissues and shells. In particular, PAHs and Mn had several significant relationships between bioaccumulated concentrations and environmental concentrations. Finally, Co, Cu, Fe, and V in soft tissues negatively correlated with mussel growth, whereas bioaccumulated PAH concentrations correlated negatively with resident mussel densities.
1. Introduction
Approximately 75% of the nearly 300 native freshwater mussel species found in North America are listed as endangered, threatened, of special concern, or are already extinct [1,2], making mussels one of the most rapidly declining faunal groups on the continent. While declines in mussel populations due to site-specific, catastrophic events have been identified, it is more difficult to find the broader causes of freshwater mussel abundance and diversity loss [3,4,5]. Several anthropogenic stressors associated with human activities have been identified as potential factors, with authors commonly suggesting point and non-point source pollution among them [6,7,8,9]. Due to their unique life cycle, freshwater mussels are at risk of exposure to contaminants from different environmental media at different developmental stages. For instance, sediment and pore water exposures are more important to juvenile mussels due to their burrowing and pedal-feeding, while water column exposure through filter-feeding is more important to adults (reviewed in [7]). Studies have indicated that early mussel life stages, such as the glochidia and juvenile stages, are especially sensitive to some toxicants (e.g., ammonia, copper) when compared to other aquatic species that are routinely tested [6,10]. Therefore, understanding the impacts of contaminants on freshwater mussels requires examination of multiple environmental matrices, with an emphasis on early life stages.
The Clinch River watershed of the upper Tennessee River basin of Virginia and Tennessee, USA, is an example of a watershed that has experienced both known and unknown causes of mussel declines in the past several decades [11]. This watershed supports one of North America’s greatest concentrations of freshwater biodiversity, with 46 extant mussel species, 20 of which are federally endangered, in addition to five federally threatened and endangered fish [12]. Significant declines in both diversity and abundance have been observed in mussel populations in certain reaches of the river. Notably, an 88 km reach of the river from downstream of the town of Carbo, Virginia (USA; river km 431) to Clinchport, Virginia (USA; river km 343) is considered a mussel zone of decline (ZOD; Figure 1; [11,13]). Within the ZOD, mussel densities decreased by more than 70% from 1979 to 2004 [12]. Both upstream and downstream of the ZOD, mussel populations remained stable or were increasing (i.e., numerous adult cohorts and evidence of recent recruitment; [12]) through 2014. Mass mortality events of the Pheasantshell Actinonaias pecterosa began occurring at some sites below the ZOD beginning in 2016, which were linked to pathogens [14,15]. Recent research on suspected mass mortality events from 2016 to 2020 has suggested that some of these events affected a wide range of species and increased in an upstream direction [15]. However, the relationship between mass mortality events and the ZOD remains uncertain.
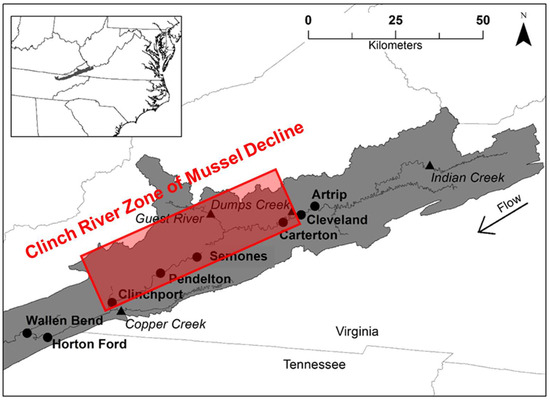
Figure 1.
Study area, the Clinch River of Virginia and Tennessee, USA, and sites where juvenile mussels were deployed. The solid black dots denote the 8 mainstem sampling sites (site names bolded), and black triangles indicate the 4 tributary sites (site names italicized). The zone of decline, downstream of Cleveland to Clinchport, represents a 68 km stretch of river where mussel populations have declined over the past 30 years [12].
Identified stressors associated with the ZOD include several trace elements, with the strongest evidence pointing to the element Mn [11]. Trace elements have often been monitored using bivalve shells [16,17]. The appeal of using shells to monitor contamination lies in acquiring a retroactive, time-integrated signal of bioavailable trace element concentrations that is potentially less variable than soft tissues, easier to process and handle, and can be accessed from archived and archeological specimens [18]. Thus far, this approach has been most successfully applied to bivalves from marine and estuarine systems [19,20], with an emphasis on elements such as Ba, Fe, Mg, Mn, and Sr that can be used as indicators of environmental conditions such as water temperature and primary productivity [21,22]. Currently, the vast majority of prior research using shells to biomonitor trace contaminants in freshwater systems comes from whole-shell analyses [23]. These whole-shell trace element data remain difficult to interpret, due to quirks of shell growth [18], limits of trace element detection [24], and a general dearth of research that connects whole shells to environmental conditions [25]. It is, therefore, apparent that more systematic approaches to whole-shell monitoring are needed, including studies that limit variables, such as caging studies.
The objectives of this study were (1) to determine whether different methods of juvenile mussel deployment affected organism outcomes such as survival, growth, and bioaccumulation; (2) to identify whether spatial variability within contaminant bioaccumulation and other endpoints could be attributed to conditions within the ZOD; (3) to determine to what extent environmental concentrations of contaminants were related to the amounts bioaccumulated by organisms; and (4) to determine whether tissue concentrations of contaminants were related to growth rates and densities of mussels. We approached these questions by deploying mussels in both cages filled with ambient streambed sediment (for exposure to sediment and sediment pore water) and in silos [26] sitting atop the stream bottom (for exposure to the water column). Our deployments included sites upstream, within, and downstream of the ZOD to maximize spatial variability. Environmental concentrations of contaminants of potential concern were analyzed and compared to concentrations in mussel tissues and shells.
2. Materials and Methods
2.1. Study Area
We deployed mussels (Villosa iris in 2012 and Lampsilis fasciola in 2013) at 12 sites within the Clinch River Basin, including 8 in the mainstem and 4 in tributaries (Figure 1). Three sites were upstream of the ZOD [Artrip (ART), Cleveland (CLE), and the tributary Indian Creek (IC)], and 6 sites were within the ZOD [Carterton (CAR), Semones (SEM), Pendleton (PEN), and Clinchport (CLI) in the river mainstem, and the tributaries Dumps Creek (DC) and Guest River (GR)]. The three remaining sites were located downstream of the ZOD [Horton Ford (HF), Wallen Bend (WB), and the tributary Copper Creek (CC)]. These sites are described in more detail by Cope et al. [11]. The upper Guest River (GR) and Dumps Creek (DC) do not support resident mussel populations. Both tributaries have histories of substantial mining-related disturbances within their watersheds. All other sites support resident mussel populations. The site CAR is further notable for being directly downstream of a coal-fired power plant at Carbo, VA, USA.
2.2. Mussel Propagation, Deployment, and Collection
Detailed descriptions of mussel propagation, deployment, and collection can be found in the Supplemental Methods. Briefly, two species (V. iris and L. fasciola) of freshwater mussels were propagated using standard host fish methods [27]. Villosa iris specimens came from one source (Freshwater Mollusk Conservation Center at Virginia Tech, Blacksburg, VA, USA), while L. fasciola specimens came in part from that source, as well as another one (Virginia Department of Wildlife Resources Aquatic Wildlife Conservation Center; Marion, VA, USA). We randomly chose individuals to deploy at our sites, with sediment cages (Supplemental Figure S1A) deployed at mainstem sites only, and water column silos (Supplemental Figure S1B) deployed at mainstem and tributary sites [26]. Cages and silos were deployed in groups of 6 at each site, with similar amounts of biomass for each mussel species per container, resulting in a mean of 18 V. iris per container in 2012 and 11 L. fasciola per container in 2013.
We deployed V. iris on 5–6 June 2012, and L. fasciola on 31 July–1 August 2013. Mussels were deployed later in the second summer due to a series of storms and subsequent high-water levels in the river. Once deployed, the mussels in all cages and silos were monitored monthly throughout the deployment period. We retrieved V. iris from all sites on 23–25 October 2012 and retrieved L. fasciola on 5–7 November 2013. Upon collection, mussels were transported on ice to the laboratory, measured for growth, weighed, dissected, and composited into two samples per deployment type at each site. The composite tissue samples were stored frozen (− 80°C) until chemical analyses were performed.
Resident mussels (Actinonaias pecterosa and V. iris) were collected at all sites where they occurred. Methods for resident mussel collection are found in Cope et al. [11]. For the present study, resident mussels were analyzed for stable isotopes in the same manner as the mussels deployed in cages and silos (Section 2.3). Resident mussels could only be sampled at mainstem sites due to availability.
2.3. Environmental Media Collection, Laboratory Analyses, and Quality Control
Trace elements and organic contaminants in water, sediment, and mussel tissue were collected and analyzed following standard methods in the same manner as described previously [11,28,29]. Briefly, we collected bed sediments using a stainless-steel scoop (August 2012) and suspended sediments using sediment traps (August 2013–February 2014). Surface water samples were collected approximately quarterly, with five sampling events at the mainstem sites and three at the tributary sites. Pore Water was sampled using a stainless-steel pump-sampler twice in 2013. To sample organic contaminants, we deployed polyethylene and universal passive sampling devices. The U.S. EPA Region 3 Laboratory in Fort Meade, MD, USA, analyzed all surface water samples for trace element concentrations according to their standard methods, and RTI International (Research Triangle Park, Durham, NC, USA) analyzed sediment, pore water, and mussel tissue for trace elements. The North Carolina State University Chemical Exposure Assessment Laboratory (Raleigh, NC, USA) performed organic contaminant analyses of all samples. Organic contaminants analyzed in this manner included organochlorine (n = 28) and current use (n = 47) pesticides, polychlorinated biphenyls (PCBs, n = 21), and polycyclic aromatic hydrocarbons (PAHs, n = 42). All analytical results met acceptable ranges of quality control [11]. Pesticides (DDE and DDD alone) were only detected at one site (CC) in 2012, at low concentrations, and were not considered further.
Because silos were present at all sampling sites, we selected sub-samples of shells from mussels deployed at each site. Shells were subdivided into three size classes (small, medium, and large), based on within-sample shell length tertiles for a given year and sampling site. This ensured a representative size distribution for each sample. One shell each for the small and large size classes was randomly selected from samples within each silo to account for the bimodal distribution in L. fasciola shell lengths (2013) and any trends in concentration related to allometry. This resulted in a total of 12 shell samples per site/year combination.
We prepared mussel shell samples via acid digestion and analyzed them by inductively coupled mass spectrometry (Agilent, 7500cx, Santa Clara, CA, USA) in a similar manner as Wilson et al. [23]. Additional details are included in Supplemental Methods. Elements initially analyzed were Al, As, Cd, Co, Cr, Cu, Fe, Hg, Mn, Ni, Pb, Se, V, U, and Zn. Samples had detectable concentrations of several elements, with the percentage of samples with concentrations below the limits of detection ranging from 0.0% (Zn) to 98.6% (Cr). The elements Cr, Cd, Hg, Pb, U, and V were below the method detection limits (MDL) in all samples from a majority of year/site collections. Selenium data had the lowest percentage of values above MDLs (41.7%) while still allowing for robust conclusions. With the exception of low detection rates for Cd, these results were consistent with previous research on freshwater mussel shells [30]. All standard reference material values were in good agreement (within 10%) with certified values, except for Se, which was 31.4% higher than the certified value. This upward deviation in the standards did not appear to have affected the outcomes of our shell Se concentrations, which were mostly below detection.
Mussel tissue samples were sent to the Cornell University Stable Isotope Laboratory (Ithaca, NY, USA) for carbon and nitrogen stable isotope analyses, which were performed on a Thermo Delta V isotope ratio mass spectrometer interfaced to an NC2500 elemental analyzer. The laboratory routinely calibrates in-house standards against international reference materials provided by the International Atomic Energy Association. To ensure the accuracy of analyses, an in-house standard (mink tissue) was analyzed after every 10 samples. For this analytical sample run, the overall standard deviation of the internal standard was 0.13 ‰ for δ 15N and 0.12 ‰ for δ 13C in 2012, and 0.10 ‰ for δ 15N and 0.07 ‰ for δ 13C in 2013. The ability of the instrument to accurately measure samples across a gradient of amplitude intensities was also tested with a methionine standard. Based on these results, δ values obtained between the amplitudes of 400 mV and 22,000 mV for δ 15N had a linearity error of 0.22 ‰, and between 400 mV and 13,000 mV for δ 13C, the error was 0.31‰ in 2012; δ values obtained between the amplitudes of 300 mV and 17,000 mV for δ 15N had an error associated with linearity of 0.31‰, and between 500 mV and 20,000 mV for δ 13C, the error is 0.11‰ in 2013. Isotope corrections were performed with a two-point normalization (linear regression) of all δ 15N and δ 13C values, using two additional in-house standards (CBT, a trout standard, and HCRN, a corn standard).
2.4. Statistical Analyses
2.4.1. Recovery and Survival
We calculated survival as the percentage of mussels recovered alive out of the mussels recovered and used analysis of variance (ANOVA) to compare survival among sites for each deployment method (cages or silos) when parametric and homogeneity of variance assumptions were satisfied. When these assumptions were not met, the Kruskal–Wallis test was used to compare survival among sites. Paired t-tests were used to compare survival between cages and silos (mainstem sites only) for each year.
2.4.2. Growth
Pearson correlation analyses were conducted to determine if spatial trends in growth were similar between mussels in cages and silos deployed at mainstem sites within each year, and if spatial trends were consistent between years, followed by paired t-tests. We performed regression analyses to examine relationships between growth rates and tissue contaminant concentrations (trace metals and PAHs). For these regressions, the dependent variable was the site-specific growth rate, and the independent variable was the site-specific body burdens of individual metals or PAHs.
2.4.3. Trace Element Concentrations in Mussel Shells
Trace element concentrations in mussel shells were analyzed in a manner similar to that employed by Wilson et al. [23,30]. First, we compared shell natural log concentrations of trace elements and allometric variables (shell length, valve mass, and shell thickness index [31]) between years (small, large, and combined size classes) and size classes (2012, 2013, and combined years) for significant differences in means [32]. Despite deploying different species in 2012 and 2013, allometric variables were more consistently significantly (α = 0.05) different between size classes (94% of all comparisons) than between years (46% of comparisons, mostly from large size classes). Because there is precedent for co-occurring unionid species to accumulate similar concentrations of trace elements [23,33], when standardizing trace element concentrations to allometric variables [34], years were pooled together. However, standardizations were only made if size-based relationships were seen in both years, because of the use of different species. Trace element concentrations in shells were also compared to co-occurring concentrations in bed sediment, sediment particulate fraction, dissolved fraction, pore water, and deployed mussel tissues using linear regression. To account for below-detection values in shell concentrations, a non-parametric Kaplan–Meier adjustment was applied to the censored data [35].
2.4.4. Tissue Concentrations of Potential Toxicants
The tissue concentrations of individual toxicants showed relatively few differences between data from cages and silos, so we pooled them for analysis (Supplemental Methods). While most within-site comparisons between years/species were significantly different (74.2%; two-tailed t-tests; α = 0.05), the difference was likely due at least in part to sediment in the gut tissues of the mussels, which were sampled without depuration [33]. Furthermore, spatial patterns appeared to reverse in the different sampling years for most elements (Pearson’s correlation). Because of the uncertainty caused by the potential impact of non-depurated sediment in the guts of the mussels and the inconsistent spatial patterns between years, all concentrations were pooled between years/species in order to produce a conservative analysis of spatial patterns (Supplemental Methods).
Refer to Cope et al. [11] for a description of the statistical methods used for analysis of the mussel tissue concentrations for metals and PAHs in deployed mussels and environmental media. Additional details can also be found in Supplemental Methods.
Finally, we used paired t-tests to compare δ15N and δ13C values between mussels deployed in cages and silos at the same mainstem sites. Likewise, paired t-tests were conducted to test for differences in δ15N and δ13C between deployed and resident mussels. Two-sample t-tests were used to compare tissue values of δ15N and δ13C between tributary and mainstem habitats using silo mussels only. All tests were performed separately by year and isotope.
3. Results
3.1. Differences Between Silos and Cages
Recovery rates for mussels were high overall and similar between cages and silos. In 2012, site-specific recovery rates ranged from 76 to 99% in cages and 95–100% in silos. In 2013, recovery rates ranged from 97 to 100% among sites for both silos and cages. With one exception (caged mussels at CAR), survival was high overall (80–90% in 2012 and nearly 100% in 2013) and exhibited little spatial variability. However, survival was significantly lower in cages than in silos (p = 0.04) (Supplemental Figure S2).
Mussels deployed in cages at mainstem sites grew faster than those in silos in both years (Figure 2), meaning that this result was true for both species deployed. In 2012, the mean difference (± standard error) was highly significant (0.015 ± 0.004 mm d−1 higher in cages; p = 0.006, paired t-test), while in 2013 the mean difference was smaller but also significant (0.008 ± 0.002 mm d−1 higher in cages vs. silos; p = 0.02, paired t-test).
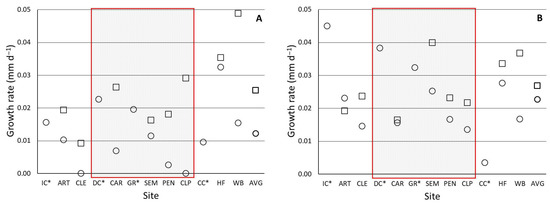
Figure 2.
Average growth in mm d−1 for (A) juvenile Villosa iris deployed in the Clinch River system in 2012 and (B) juvenile Lampsilis fasciola deployed to the same sites in 2013. Open squares represent the growth rate in mussels deployed in cages, and circles represent those deployed in silos. The shaded area represents sites considered to be within the zone of decline. Tributaries to the Clinch River are marked with an asterisk: *.
There were no statistically significant differences in PAH tissue concentrations between silos and cages in either year (p-values > 0.3). Significant differences for trace elements were few and inconsistent (1 of 21 in 2012; 8 of 21 in 2013). Stable isotope values did not differ between mussels deployed in cages vs. silos at the same site, regardless of isotope or year/species, as p-values ranged from 0.12 to 1.0 across all paired t-tests (Figure 3). Therefore, we pooled site-specific cage and silo data for all subsequent analyses.
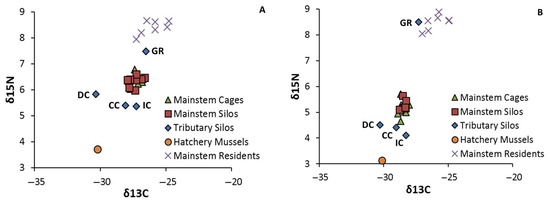
Figure 3.
Stable isotope values (δ15N and δ13C) for (A) juvenile Villosa iris (2012) and (B) juvenile Lampsilis fasciola (2013). Symbols represent the site average of 2–3 composite samples. The tributary sites are identified individually: CC = Copper Creek, DC = Dumps Creek, GR = Guest River, and IC = Indian Creek.
3.2. Spatial Variation in Growth and Survival
Mean site-specific growth rates of mussels deployed in the study ranged from negligible to 0.0489 mm d−1, and we observed spatial variation in growth rates, with some consistencies in trends between years (Figure 2). Growth rates of caged mussels generally increased in a downstream direction, with sites below the ZOD having significantly higher growth rates than those within (p = 0.010) or above (p = 0.004) the ZOD. Because growth rates in silo mussels were significantly higher in 2013 compared to 2012 (a mean of 0.009 mm d−1 higher; p = 0.008), values were not pooled across years, and there were no significant differences between silos above, within, and below the ZOD, or with any comparisons to the tributaries.
Except for caged mussels at CAR, survival was high overall (80–90% in 2012 and nearly 100% in 2013) and exhibited little spatial variability. In 2012, there were no significant differences among sites for either caged mussels (p = 0.10, ANOVA) or those in silos (p = 0.41, ANOVA). In 2013, survival was similar among sites for mussels in silos (p = 0.62, ANOVA), but there was a significant difference among sites for mussels in cages (p = 0.0001, Kruskal–Wallis test), driven by the lower survival at CAR (80%) compared to other sites (100% survival). As in 2012, survival was significantly lower in cages than in silos in 2013 (p = 0.05, paired t-test).
3.3. Spatial Variation in Soft Tissue Concentrations of Trace Elements
Tissue concentrations of trace elements in deployed mussels showed few significant differences between sites (Supplemental Table S1). Only 24 of all 1386 comparisons resulted in a significant difference after pooling years, for an index of discriminating efficiency (IDE; [36]) of 1.7%. The site DC was responsible for the largest number of significant differences between sites for pooled data (14 of 24), while Mn was responsible for the most differences among elements (17 of 24). When pooled by spatial region as well as year/species, the IDE remained the same at 1.4%, with only Mn and V showing any significant differences. In each case, the sites upstream of the ZOD had significantly higher tissue concentrations of the element than the sites downstream of the ZOD.
Distinct clusters differentiated the most upstream (ART and CLE; along with tributary CC) vs. downstream (PEN, CLP, HF, WB) sites in the mainstem in both years (Supplemental Figure S3). Like the site-by-site comparisons, the tributary DC was the most unlike other sites, with relatively high concentrations of As, Ba, Mn, and Sr and low concentrations of Sb and Hg each year (Supplemental Figure S3). The other sites (CAR and SEM within the ZOD and the tributaries IC and GR) did not form clusters with other sites consistently within the two years, although SEM and GR were similar, and SEM is the mainstream site closest to the confluence with GR.
The elements themselves clustered with some predictability, with sediment-associated elements Al, Si, Fe, Co, and Pb clustering in each year (Supplemental Figure S3). Potentially toxic elements, As, Cd, Mn, Se, and Zn, also clustered together in each year, while Hg clustered with no other elements in either year. The elements Cr, Cu, and Ni also stayed together in the same cluster, although the other elements they clustered with changed between years.
3.4. Spatial Variation in Trace Element Concentrations in Shells
Linear regression revealed that allometry routinely correlated with concentrations of certain elements within shells at each site. The percentage of sites with a significant allometric relationship ranged from 8.7% (Co) to 100% (Zn). The elements As, Fe, Se, and Zn had a significant relationship at two-thirds or more of all sites. Length was the allometric variable that explained the most variability for the largest number of element/site combinations, and the elements As, Se, and Zn were explained by length at most sites, whereas Al, Cu, and Fe were explained by a variety of variables. At the relatively few sites with significant relationships to Mn (33% of all sites), the shell thickness index explained the most variability. All of the significant relationships between allometric variables and element concentrations were negative, except for the relationship between Cu and length at one site (IC). This suggests that growth dilution influenced the element concentrations in these shells.
Standardizing shell concentrations to allometry resulted in increased discrimination between sites in most cases. Changes in IDE ranged from a decrease of 1.5% for As to an increase of 21.2% for Al. On average, allometric standardization resulted in a 5.9% increase in IDE. The elements with the highest changes in IDE were Cu (45.5%) and Ni (40.9%), while As (9.1%) and Se (4.5%) showed the lowest change. The change in IDE did not correspond to the number of sites that were standardized. On average, trace element concentrations tended to be higher at the sites DC and GR, which had total IDE values of 42.4% and 55.6%, respectively, indicating the sheer number of significant differences between them and other sites (including each other; Supplemental Figure S4). Other sites within the ZOD, SEM, and PEN had similarly high concentrations of elements such as Al, Co, Cu, Fe, Mn, Ni, and Zn. Two of the upstream sites, CLE and IC, tended to have lower concentrations of elements and had IDEs of 38.4% and 35.4%, respectively. Only Fe significantly correlated between the shells and tissues of deployed mussels (r2 = 0.340; p = 0.047); Figure 4A).
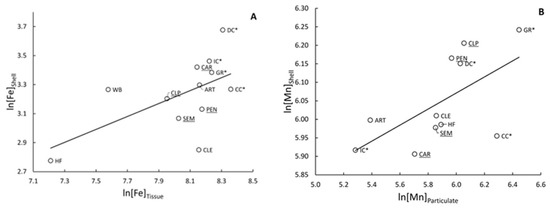
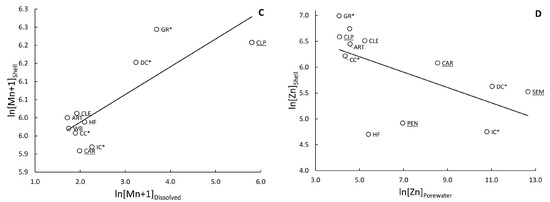
Figure 4.
Significant relationships between natural log-transformed concentrations of trace elements in mussel (Villosa iris and Lampsilis fasciola) shells and concentrations in other matrices. (A) Fe in the soft tissues of the mussels (r2 = 0.340; p = 0.047), (B) Mn in the particulate fraction of sediment (r2 = 0.560; p = 0.008), (C) Mn + 1 in the dissolved fraction of overlying water (r2 = 0.675; p = 0.004), (D) Zn in the pore water (r2 = 0.345; p = 0.046). Sites are labeled, sites within the zone of decline are underlined, and tributaries are marked with an asterisk: *.
3.5. Spatial Variation in Tissue Concentrations of Organic Contaminants
Of the organic compounds analyzed, PAHs were readily detected in mussel tissues. We found high concentrations at the tributary GR in both years. In 2012, total PAH (the sum of all 42 individual PAHs analyzed) tissue concentrations exceeded 5000 ng/g at GR, with the next highest levels observed just downstream of GR at SEM (941 ng/g) and PEN (582 ng/g; Figure 5). Tissue concentrations at the other sites were much lower and ranged from 41 to 386 ng/g, with a mean of 223 ng/g (Figure 5). In 2013, we observed a similar spatial trend. The suite of individual PAHs that contributed to the unique signature of the GR site differed between the years. In 2012, six PAHs (C2, D1, D3, FP2, P3, and P4) were detected only in mussels deployed at the GR, and they comprised a distinct cluster (Supplemental Figure S6A). However, the PAHs contributing to relatively high tissue concentrations at GR were also high at DC (i.e., C1, F1, FP1, N1, N2, N3, and P2; Supplemental Figure S6B).
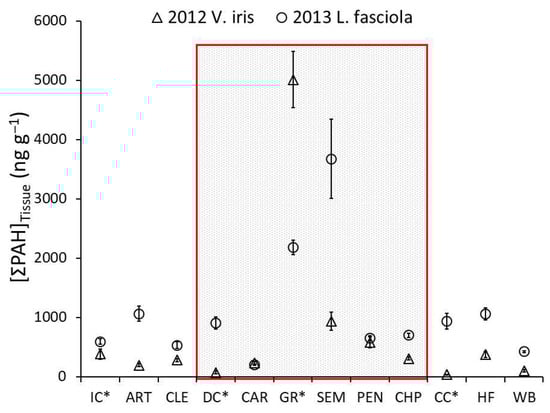
Figure 5.
Spatial comparisons within the Clinch River System of mean (plus or minus standard error) mussel tissue concentrations of total PAH. Open triangles indicate Villosa iris deployed in 2012, and open circles indicate Lampsilis fasciola deployed in 2013. The shaded area represents sites considered to be within the zone of decline. Tributaries are marked with an asterisk: *.
3.6. Spatial Variation in Stable Isotopes
We identified strong differences between the isotopic signatures of deployed and resident mussels, as indicated by the highly significant differences in the paired t-tests (all p-values < 0.0001). Specifically, both δ 15N and δ13C were higher in residents compared to deployed juveniles each year (Figure 3). Baseline mussels from the hatchery showed depleted values of both isotopes compared to deployed and resident mussels. Although fewer in number (n = 4), tributary sites exhibited much greater variability in isotope values than mainstem sites (n = 8). Nitrogen was generally more depleted in tributaries, except at GR, which exhibited the highest δ 15N values of all sites in both 2012 (7.5‰) and 2013 (8.5‰). When GR was excluded from the analysis, t-tests indicated that δ15N was more depleted in the tributaries than the mainstem in each year (2012: p = 0.004; 2013: p = 0.003). Within the tributaries, δ 13C was lowest at DC (−30.3‰) and highest at GR (−27.3 to −26.5‰) across both years. Values of δ13C of the two other tributary sites were generally similar to mainstem sites (~−27‰).
3.7. Comparisons to Environmental Media—Sediment
Tissue concentrations of metals in mussels showed little relation with metal concentrations in the surrounding sediment, with 77% of rs values below 0.3 (Supplemental Table S2). Exceptions for particulate sediment included a positive correlation with mussel tissue for As (rs = 0.74, p = 0.01) and a negative correlation for Ni (rs = −0.58, p = 0.06). For bed sediment, we found positive correlations with tissue concentrations for Al (rs = 0.53, p = 0.08) and Cr (rs = 0.54, p = 0.08), and a negative correlation for Ni (rs = −0.52, p = 0.08). Element concentrations in shells did not correlate in any way with concentrations of the same element in the sediment bed load. For the particulate fraction of sediments, only Mn significantly correlated to concentrations in shells [(r2 = 0.560; p = 0.008); Figure 4B].
PAH concentrations in the soft tissue of deployed mussels generally exhibited weak to moderate positive correlations with sediment PAH concentrations. However, we observed several strong positive PAH tissue-sediment correlations in 2013, more so for the particulate fraction (7 of 11 in 2013) than for bed sediment (1 of 20 in 2012; 4 of 11 in 2013) (Supplemental Table S3). Total PAH concentrations in tissues demonstrated a significant positive relationship with both bed and particulate sediment concentrations in 2013 (Supplemental Table S3).
3.8. Comparisons to Environmental Media—Surface Water
The majority (76%) of correlations between metal concentrations in mussel tissue and those in the water column were not significant. However, deployed mussels exhibited strong positive (rs values > 0.71) and significant (p-values < 0.04) relationships with five of the eight trace elements (Al, Fe, K, Mg, and Mn) that were above detection limits during the September 2013 water-sampling period (Supplemental Table S4). The tissue concentrations of Mn and Mg for deployed mussels also showed significant positive correlations with water column concentrations from October 2012 (rs = 0.680, p = 0.02) and July 2013 (rs = 0.58, p = 0.05). Similarly, shell Mn also positively correlated with average total (r2 = 0.417; p = 0.044) and dissolved (r2 = 0.675; p = 0.004) concentrations of Mn in surface water (Figure 4C).
Nearly half (53 of 105) of the potential correlations between individual PAH concentrations in surface water and mussel tissues could not be calculated due to concentrations below the detection limit. We found no correlation between tissue and water concentrations for each of the five surface water sampling periods for any individual PAH. Of the remaining comparisons that could be analyzed, we found 24 significant (α = 0.05) and 4 marginally significant (0.05 < α < 0.10) positive relationships (Supplemental Table S5). The relationship between PAH concentrations in water and mussel tissue varied over time and among individual PAHs.
3.9. Comparisons to Environmental Media—Pore Water
Concentrations of elements in the tissue of deployed mussels showed correlation to elements in pore water in only a few cases (Supplemental Table S6). Magnesium concentrations in deployed mussels exhibited a significant positive relationship with pore water concentrations in both June (rs = 0.68, p = 0.02) and October (rs = 0.66, p = 0.02) of 2013. In addition, Zn concentrations in mussel tissues showed a marginally significant positive association with pore water concentrations in October (rs = 0.50, p = 0.10), but not in June (rs = −0.36, p = 0.26). Similarly, Zn was the only element significantly related to co-occurring concentrations in shells and pore water (r2 = 0.345; p = 0.046), although this was a negative relationship (Figure 4D).
Mussel tissue concentrations from deployed individuals showed little association with surrounding pore water PAH concentrations. Tissue concentrations only exhibited a significant positive relationship with 1 of 13 PAHs detected (P1 in the June 2013 pore water sample) (Supplemental Table S7). Tissue concentrations showed a significant positive relationship (rs = 0.69) with total PAH concentrations measured in the October 2013 pore water sample, but not the June 2013 sample (Supplemental Table S7).
3.10. Indicators of Toxic Effects and Contaminant Concentrations—Growth
Pooled growth rates of deployed mussels in both cages and silos at mainstem sites were significantly related to tissue concentrations of Co, Cu, Fe, and V (linear regression; p = 0.043, 0.038, 0.016, and 0.028, respectively). Al, Cr, Pb, and Si were marginally correlated with mussel growth (p = 0.058, 0.051, 0.100, and 0.078, respectively). In all cases, the relationships were negative, and in many cases displayed some slight curvature (Figure 6). Curvilinear relationships such as exponential (; Co) and power regression (; Al, Cu, Fe, Pb, V) reduced the sum of squared errors over the linear regression, but no curvilinear relationships significantly reduced error. Therefore, we found insufficient evidence of a threshold effect between trace element accumulation and growth in these deployed mussels.
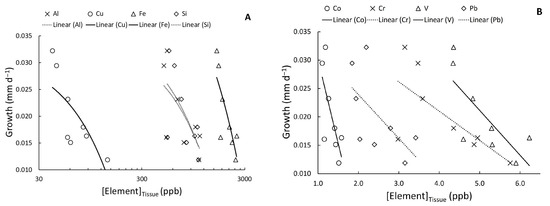
Figure 6.
Linear relationships between mean soft tissue concentrations of trace elements in juvenile mussels and growth rates (mm d−1) of those mussels; (A) Al, Cu, Fe, and Si, and (B) Co, Cr, V, and Pb. Solid lines indicate significant (α = 0.05) relationships, while dotted lines indicate marginally significant (0.05 ≤ α ≤ 0.10) relationships.
For mussel shells, there was no relationship between mean growth at sites and trace element concentrations. However, as discussed previously, there were many significant relationships between these trace element concentrations and shell allometric variables. This suggests that for shells, relationships with growth must be examined on an individual, rather than a site-level basis.
Similarly to shell trace element concentrations, the growth rates of deployed mussels showed little relation to PAH tissue concentrations. The growth rates of caged mussels in 2012 showed a significant negative relationship (r2 of 0.56–0.57, p-values of 0.03) with only 3 of 20 PAHs (BaA, F1, and PER). There were no significant relationships between growth rates and PAH tissue concentrations for mussels deployed in silos or those deployed in cages in 2013.
3.11. Indicators of Toxic Effects and Contaminant Concentrations—Resident Mussel Density
Densities of resident mussels showed little association with tissue element concentrations in deployed mussels (Supplemental Table S8). Mussel density was not correlated with site-specific tissue concentrations of metals in either year, except for K and Sb in 2012 (rs = −0.79, −0.86; p = 0.02 and 0.01, respectively). These should be interpreted with caution, because the 2012 concentrations for these elements were within a much narrower range than those for 2013, when no relationships were seen.
Total PAH concentrations in deployed mussel tissues were not significantly different (paired t-test; p = 0.328) between years; however, the two years were less alike (paired t-test; p = 0.073) at the sites for which there were reliable densities of resident mussels. Whether examining data from 2012, 2013, or the years combined, PAH concentrations in deployed mussels did not significantly correlate with the density of residents (linear regression; p = 0.423, 0.175, 0.345, respectively). There was apparent curvature in the relationships consistent with an exponential decline [y = a (1 − r)x]. Employing this curve reduced the sum of square errors in all cases, but only came close to a significant reduction in error (p = 0.074) in the case of the 2012 data (Figure 7), which resulted in a significant relationship between tissue PAHs and mussel density overall (p = 0.024, r2 = 0.846). The highest and second-highest concentrations of total PAHs in deployed mussels (5014 ng g−1 and 2182 ng g−1 in 2012 and 2013, respectively) came from the Guest River (GR) site, where no resident mussels could be found at the time of deployment. Therefore, these high PAH concentrations could not be included in the analysis, although it is likely that they would have strengthened the relationship.
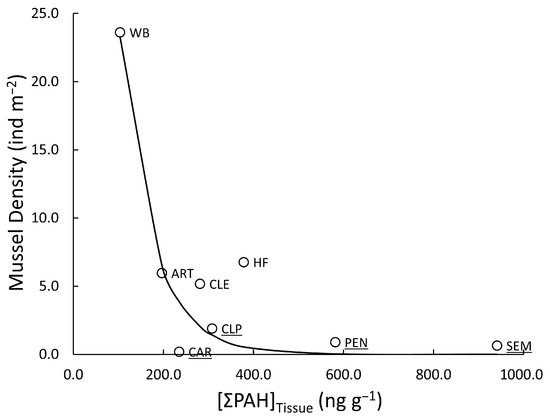
Figure 7.
Density (individuals m−2) of co-occurring freshwater mussels as a function of the total PAH concentrations (ng g−1) accumulated in the tissue of juvenile mussels deployed to those sites in 2012. Sites in the zone of decline are underlined. The curvilinear relationship is described by y = a (1 − r)x (p = 0.024, r2 = 0.846).
4. Discussion
4.1. Mussel Cages Versus Mussel Silos
Reported mean survival rates for mussels deployed in silos typically fall within the 80%–100% range [37,38,39], although lower values for particular sites have been reported [40]. Mean survival rates for mussels deployed in cages have varied more, from nearly 0% to 100% [38,39,40,41]. Our results fall within these ranges. Survival was significantly lower for mussels deployed in cages, a result that has previously been shown for Lampsilis cardium deployed in cages and silos in streams in Kentucky [40]. Haag et al. [40] also found survival in cages to be more variable than in silos, with results consistent with burial from fine sediment, rather than toxicity from water or sediment. In studies that added sediment to silos (thus making them more similar to cages), the addition of sediment either decreased survival [39] or had no effect [38]. Therefore, deploying juvenile mussels in silos appears to result in more consistent, short-term (96–142 d) survival.
Haag et al. [40] found that while survival of deployed mussels related to whether sites had abundant mussels or depauperate fauna, mussel growth rates were more sensitive to environmental conditions. The L. cardium juveniles in their study grew significantly more rapidly in silos than in cages with sediment, although the growth rates were correlated between sites [40]. This result is the opposite of what we observed, with our caged mussels growing significantly more rapidly than silo mussels in both years (i.e., for both V. iris and L. fasciola). Adding sediment into silos deployed in southern Illinois significantly decreased the survival of L. cardium, Lampsilis siliquoidea, and Ligumia recta compared to silos without sediment [39]; however, adding sediment to silos deployed in Northern Ireland did not affect the growth rates of Margaritifera margaritifera [38]. While it has been assumed that juvenile mussels will grow faster in the presence of sediment that provides more opportunities for pedal feeding, it appears that this effect varies by species and deployment. It is likely that growth rates are more strongly affected by environmental factors such as impacts of agriculture, water temperature, and availability of food sources [40,42].
Mussels did not appear to accumulate either PAHs or trace elements differently based on deployment method, and isotopic signatures were likewise not affected by deployment method. Because cages allow mussels to have exposure to sediment and pedal feeding, we expected that bioaccumulation and isotopic fractionation would vary by deployment method. The lack of differences is similar to results from L. cardium deployed in Kentucky [40].
4.2. Spatial Variation and the Zone of Decline—Growth
Based on prior studies in the Clinch River and the existence of the zone of decline (ZOD), we expected clear differences among sites for survival, growth, bioaccumulation, and isotopic signature [11,37]. Only one site, at Carterton (CAR) at the upstream start of the ZOD, demonstrated lower survival in both deployments. Only mussels deployed in cages demonstrated significant differences in growth between sites within the ZOD and downstream sites. This may be an artifact of study design with mussel cages, as previously discussed. Villosa iris and L. fasciola deployed in cages (in 2012 and 2013, respectively) grew at similar rates and could be combined, resulting in more statistical power for cages. Despite the lack of significance for silos, it appears that conditions in the ZOD lead to lower mussel growth rates and possibly some mortality.
Previous research with deployed V. iris in the Clinch River likewise found lower growth rates in the ZOD compared to a downstream site [37]. Johnson et al. [37] found more consistent growth rates, with site means ranging from 0.0276 to 0.0447 mm d−1, compared to our site means, which ranged from negligible to 0.0489 mm d−1 for V. iris (and 0.0034 to 0.0450 mm d−1 for L. fasciola in 2013). This is likely due to their deployment at fewer sites and the exclusion of tributaries. A companion study to the present one also deployed V. iris in silos within the Clinch River from 2012 to 2013 [13] and likewise found significantly lower growth rates within the ZOD compared to upstream and downstream pooled data (termed “zone of stability”). Sites in the ZOD averaged 0.007 mm d−1 growth and within the other sites 0.014 mm d−1, which is at the lower end of our ranges, but includes the winter cessation of growth.
We found reduced growth at sites upstream of the ZOD, as did others, although the trends have not always been statistically significant [13,37]. Temperature is known to affect growth rates, with cooler streams resulting in slower growth [40]. Water temperatures measured by Rogers et al. [13] during our deployment time found significantly higher temperatures within the ZOD compared to other mainstem sites, and the lowest temperatures occurring at sites upstream of the ZOD. This suggests that temperature may have played a role in some of our results. Because mussels deployed in silos could not be pooled across years, we lacked the statistical power to determine whether those deployed in tributaries grew at significantly different rates than the segments of the mainstem.
4.3. Spatial Variation and the Zone of Decline—Trace Elements
Trace element accumulation in the soft tissues of deployed mussels rarely demonstrated statistically significant differences between sites, but the few sites that did should be considered with great interest, because they stand out against otherwise variable and noisy data. Most notably, Mn and Hg varied within the sites, with the mussels deployed at the DC tributary accumulating the highest tissue concentrations of Mn and the lowest concentrations of Hg. Dumps Creek (DC) also did not cluster with other sites when all trace elements were considered together, whereas the related sites GR and SEM remained clustered together but varied between years regarding the other sites they clustered with. The confluence of DC with the Clinch River had previously been suspected of limiting mussel growth and recovery via discharges of Cu and Zn from a coal-fired power plant, and as mentioned previously, it was identified with a significantly lower growth rate in deployed mussels [13]. Similar patterns of Mn accumulation were shown in resident mussels sampled concurrently from the same sites as this study [11]. Sites upstream of the ZOD consistently clustered together in the present study. As with growth, there appeared to be an upstream-to-downstream component to trace element accumulation in soft tissues within the Clinch River, but also a difference above and below the confluence with the coal mine-impacted tributaries, Dumps Creek and Guest River. This is supported by past research, such as tissue concentrations reported by Johnson et al. [37], who found concentrations of several elements (12 of 28; Al, As, Cr, Fe, K, Li, Mg, Ni, Se, Sn, Th, and V) in silo-deployed V. iris tissues varied in an apparent upstream to downstream manner from CLE to HF.
Trace element concentrations in the shells of V. iris and L. fasciola likewise indicated differences occurring within the ZOD, and the DC and GR tributaries. Elements with notably elevated concentrations at certain sites included As (DC, CC), Al (GR), Co (SEM), Cu (DC, SEM), Fe (DC), Mn (DC, GR), Se (PEN), Ni (DC, SEM), and Zn (SEM). With the exception of Cu, all of these elements are enriched in bituminous coal mine drainage [43]. There is also some evidence that a history of surface coal mining contributed to Co and Ni concentrations in freshwater unionid mussel shells from central Illinois [23]. Acid mine drainage also has been linked to concentrations of Co, Cu, Mn, Ni, and Zn in Velusunio angassi shells from northern Australia [25]. However, a wide range of influences have been attributed to the concentrations of trace elements in freshwater bivalve shells, including regional hydrogeochemistry [44], seasonal primary productivity and dissolved oxygen [45,46], agricultural practices and erosion rates [30,47], industrial wastewater inputs [21], and general impacts of industrialization [23,48,49]. Taken together with the data from soft tissues, the shells provided additional evidence of trace element contamination within the ZOD, including elements of concern previously identified in the Clinch River drainage, such as As, Cu, Fe, Mn, and Zn [11,37,50].
4.4. Spatial Variation and the Zone of Decline—PAHs
Concentrations of PAHs in deployed mussels were high at the sites GR and SEM. This is supported by past research with resident mussels, which found high concentrations in resident mussels at the same or nearby mainstem sites, SEM and PEN [11]. Cope et al. [11] also found a negative relationship between PAH and resident mussel density. Because we deployed mussels to tributaries with no resident mussels, our results indicate that the Guest River watershed is a likely source of PAHs to the larger Clinch River system. Our results differ slightly from previous research that found the highest concentrations of PAHs at CAR [28]; nevertheless, it found sediment from the Guest River to be the most toxic to juvenile Epioblasma brevidens [28]. This could reflect different levels of bioavailability for PAHs. PAHs from coal combustion have been shown to have different profiles on different soil particle sizes [51], and mussels are known to selectively feed on smaller particles. Overall, however, our results agree with past work centering higher PAH concentrations in the ZOD and tributaries like the Guest River.
4.5. Spatial Variation and the Zone of Decline—Stable Isotopes
Mussel food resources in the Clinch River system are enriched in both 15N and 13C compared to the diet fed to mussels in the hatchery, as demonstrated by our results showing that most isotope values from deployed mussels fell between those from hatchery mussels and resident mussels. Past studies have found long turnover times for stable isotopes in freshwater mussel tissues, with values of 78 d for stomach glands [52], 85 d for gut contents [52], 113 d for hemolymph [53], and 357 d for muscle tissue [52]. These slow turnover rates support the idea that the deployed mussels were still equilibrating with their new environment over the 99–143 days they were deployed. Mussels in the tributaries had different results than those in the mainstem. In particular, results from GR suggest enrichment in 15N relative to all other deployment sites. Enrichment of both 15N and 13C is an indicator of anthropogenic impacts, particularly from sewage and industrial waste [41], although not all studies agree that sewage enriches 13C within freshwater mussel shells [54]. Therefore, Guest River appears to be the most impacted by human activities [28], which could also explain the lack of resident mussels. Dump’s Creek (DC) also had anomalous results, with 13C-depleted tissues compared to other sites and residents from the mainstem, while the other tributaries (IC and CC) had less enrichment in 15N.
4.6. Biomonitor Relationships with Environmental Compartments
With respect to unionid soft tissue, past studies have found relationships with sediment for Cd [33,55,56], Cu [56,57], Mn [58], Pb [33,55,56,57,59], and Zn [55,57]. Our data indicate a relationship between Zn accumulation in soft tissue and sediment that is supported by the work of past authors, although other authors found no relationship [56,58,59]. Authors in the past have found no such relationship for Al [58], As [56,60], or Cr [59], making our results unique. Our lack of correlation between soft tissue and sediments for elements like Cd and Pb, while not entirely unprecedented [61], is anomalous compared to the results of past investigations.
Unionid soft tissues rarely contain trace element concentrations that correlate with surface water concentrations. Our findings of positive relationships for K, Mg, and Mn are unique, although of those three, we are only aware of studies showing no relationship for Mn [56,58,59,62,63]. Tissue samples from Anodontites trapesialis caged in a mine-impacted stream in southern Brazil showed positive relationships between gill concentrations of Al and Fe and concentrations of overlying water [58], while other studies of resident mussels in lakes and reservoirs demonstrated no relationship [59,62,63]. This could indicate that these elements (Al and Fe) are more likely to correlate with water either when deployed or when sampled from streams, rather than from lentic systems.
When it comes to unionid shells, the evidence for relationships to environmental media is also mixed [23]. The correlation that we found for Mn and sediment has not been supported by past authors [25], while the correlation with water has been relatively well-supported [25,44,64]. Comparing the work of other authors demonstrates little consensus on whether element concentrations in unionid shells correlate to sediment or water concentrations of the same element [25,55,61,64,65], although analysis of intra-annual concentrations in bivalve shells has revealed environmental relationships [18].
Because factors such as depuration period [33], cleaning procedures for shells [30], standardizing concentrations to a geochemically important element such as Al or Fe [25,44,57], and choice of environmental fraction [55] can affect these outcomes, it is not surprising that many studies reach different conclusions. Our results matched with our prior examination of resident mussels at the same sites. For example, the findings supported a link between Mn in soft tissues and water, and a link between Zn in tissues and sediment [11]. Our study further reinforced the relationship between Mn in mussel shells and water [25,30,44,64], and the link between Zn in mussel shells and sediment concentrations [25,55].
We found some relationships between the PAHs in the soft tissue of our deployed mussels and those in water and sediments. Strong relationships with sediment concentrations have been found in previous research using resident mussels in the Clinch River [11] and in other southeastern rivers [29]. The strength of these relationships appears to be dependent on the specific PAH, as well as the sampling period and environmental medium (i.e., bed load sediment, particulate sediment, pore water, or surface water). Other than these studies, field research on bivalve accumulation of PAHs has more frequently used invasive Dreissenid and Corbicula species (i.e., [66]). This is likely because of the status of these bivalves as invasive within much of their range. Recent research has shown that passive sampling devices accurately mimic unionid bioaccumulation of PAHs [29], suggesting that future investigations can use less destructive methods to sample PAH concentrations that are comparable to those accumulated by unionids [11].
4.7. Possible Toxic Effects and Links to Contaminant Concentrations
Because mussel survival rates were uniformly high (80%−100%) at most sites, we did not have the opportunity to analyze this endpoint in detail. However, in 2012, caged V. iris deployed within the ZOD at CAR experienced low survival (52%), and the survival of L. fasciola was at the low end (82%) of our range at this site in 2013. This site is situated just downstream of a coal-fired power plant (Carbo, VA), so mussels there may have experienced a toxicity event. The resident mussel density was also low at CAR [11]. Of course, other factors, such as this site’s higher rate of sediment deposition (documented observations) over the cages, may have led to its low survival. A companion study in this reach of the river found that sites within the ZOD had significantly lower survival rates than mainstem sites up- and downstream of the ZOD [13]. However, they also encountered mortality of caged mussels due to sediment deposition and noted that the site directly downstream of the ZOD (HF) had the highest rates of mortality.
Using the growth of deployed mussels and the density of resident mussels as proxies of toxic effects, we found a few significant relationships with contaminant bioaccumulation in deployed mussels. Trace elements such as Al, Co, Cr, Cu, Fe, Pb, Si, and V were correlated to some extent to mussel growth via tissue concentrations. Of these, Al, Co, Fe, Pb, and Si all tended to cluster together for each species and deployment, perhaps representing elements most closely associated with sediment particles in the gut [25,33,44,57]. While these elements provide some evidence for a link between trace element exposure and inhibition of mussel growth, they exclude Mn, which had been linked to indicators of mussel health within the Clinch River by previous studies that demonstrated toxicity in sediment [28] and water [13]. Similarly, resident mussel densities were lower at locations with higher environmental concentrations of Mn [11,37] and Fe [37]. This is especially confounding because we consistently found significant relationships between Mn bioaccumulated by the mussels and environmental concentrations, and it also varied more between sites than other metals. Mussels in the Guest River accumulated both the highest concentrations of Mn and the most enriched values for 15N. Enrichment of 15N may be related to increased mussel growth [42], suggesting that enriched nutrient loads from human activity in the Guest River watershed may have offset potential growth effects from Mn concentrations.
Allometric variables can account for intra-site growth variability in mussel populations used for biomonitoring [23,30,56,67]. In this study, we found consistent relationships between metal concentrations in shells and allometric variables, possibly owing to the more homogenous starting point for deployed mussels. As, Fe, Se, and Zn had significant relationships at most sites (92%, 67%, 92% and 100%, respectively). On the other hand, Co and Ni, which showed consistent relationships in at least one prior study from the Illinois River [23], were rarely significant. Interestingly, Mn had significant allometric relationships only at the mining-impacted tributaries GR and DC and the two sites directly below the ZOD (HF and WB). While we standardized shell concentrations of these elements to allometric variables, we suggest further research to determine whether element concentrations are influenced by different growth strategies or whether growth inhibition from higher element exposure causes the correlations to occur.
PAH exposure has also been related to a decline in mussel health within laboratory [28,50] and field studies [11]. We found a few relationships between accumulated PAHs and mussel growth. However, we also did not find consistently strong relationships between bioaccumulated concentrations of PAHs in deployed mussels and environmental concentrations, suggesting that either the length of deployments or the manner of deployments was insufficient to observe effects on growth. We found that deployed mussels accumulated higher concentrations of PAHs at sites with lower densities of resident mussels.
5. Conclusions
This study used a comprehensive and multi-faceted approach to analyze the presence, likely causes, and possible effects of chemical stressors within the ZOD on the Clinch River mussel fauna. Our results clearly indicate that the mussel ZOD can be delineated by areas of depressed mussel growth and higher accumulation of some trace elements and PAHs. Specifically, we found that mussels deployed in the Guest River accumulated higher concentrations of PAHs in tissues and elements such as Mn (in shells), along with being enriched in 15N; those deployed in Dumps Creek accumulated higher concentrations of As, Cu, Fe, and Ni in shells, and Mn and Sr in soft tissues. This supports past reports of elevated metal and PAH concentrations from these tributaries or sites downstream of their confluence with the Clinch River [11,37].
In evaluating the direct correlations between deployed mussels and co-occurring environmental media, we found relationships between a variety of media and elements. The strongest evidence for these simple, direct relationships is for Mn in shells (from water), Zn in tissues (from sediment), and Zn in shells (from sediment). Other relationships suffer from a dearth of research that could be used to confirm our results (e.g., Cr, K, and Mg) or produce results that ran counter to previous studies—contradictions that need to be resolved (e.g., Al, As, Fe, Mn, and Pb in tissues). Most organisms used as biomonitors likely accumulate trace elements through complex mechanisms that vary both within and between sites and that cannot always be reduced to direct comparisons with environmental concentrations [56]. Similarly, PAHs accumulated in a manner that correlated with the environmental media, with variation from different compounds, deployment year and species, and environmental media. More research should be conducted to determine how biomonitor data truly connect to environmental exposure and how techniques like shell allometric standardization could improve its usage.
Finally, our results suggest that Mn (and possibly other trace elements) and PAH exposure contribute in part to mussel declines within the Clinch River system. This is supported by reduced growth of deployed mussels and resident mussel densities in proximity to the accumulation of these elements. These findings are supported by a growing body of research that implicates these same factors [11,13,28,50]. By identifying these stressors and their spatial distribution within the Clinch River drainage, natural resource managers can take action more effectively to address the continuing decline of native freshwater mussel populations. Our results demonstrate a need to change environmental conditions to sustain this diverse mussel community, and a necessity to find innovative techniques for remediating these stressors and restoring mussel populations.
Supplementary Materials
The following supporting information can be downloaded at: https://www.mdpi.com/article/10.3390/d17080503/s1. Supplemental Materials and Methods Text; Figure S1. Mussel deployment methods. (A) Cages were constructed from polyethylene industrial containers with mesh sides and base with plastic mesh (6.34 mm) affixed to the inside of the cages on the top, sides, and bottom to contain mussels and allow water to flow through the cages. Cages were deployed in areas with fine and coarse gravel and river substrate was used to fill the cages as they were partially buried to ensure the tops of the cages were flush with the sediment-water interface. (B) Concrete mussel silos were constructed to house mussels in the water column; cylindrical chambers had mesh tops and bottoms to allow water to circulate through the chamber. Figure S2. Adjusted survival (percent of mussels recovered alive out of the mussels recovered) for (A) Villosa iris (2012) and (B) Lampsilis fasciola (2013). Tributary sites are denoted by asterisks. Green bar indicates sites within the ‘Zone of Decline’ (see Figure 1). For sites where survival in each sample was 100%, the standard error (SE) was 0 (no SE bar shown). Figure S3. Two-way dendrogram from cluster analysis of trace element concentrations from soft tissues of (A) juvenile Villosa iris deployed in 2012 and (B) juvenile Lampsilis fasciola deployed in 2013. Relative metal concentrations are indexed by the color gradient as darker red cells indicate higher concentrations of a given metal in the tissues at a particular site. The ‘Information Remaining’ metric is the percent of the total original variation in multivariate distances among all 21 metals that remains after each joining (node) of clusters or sites. Figure S4. Natural log transformed mean concentrations (originally mg kg−1) of trace elements in the shells of Villosa iris and Lampsilis fasciola deployed in silos at sites within the Clinch River System. (A) = As, Se; (B) = Co, Cu, Ni; (C) = Al, Zn; (D) = Fe, Mn. Error bars are standard errors. Means within the same series with the same letters are not significantly different from one another. The shaded area inside the red box represents sites considered to be within the zone of decline. Figure S5. Two-way dendrogram from cluster analysis of PAH concentrations from soft tissues of (A) juvenile Villosa iris deployed in 2012 and (B) juvenile Lampsilis fasciola deployed in 2013. Relative PAH concentrations are indexed by the color gradient as darker red cells indicate higher concentrations of a given metal in the tissues at a particular site. The ‘Information Remaining’ metric is the percent of the total original variation in multivariate distances among all 21 metals that remains after each joining (node) of clusters or sites. Table S1. Mean trace element concentrations in the soft tissues of deployed mussels, pooled for both species/years of deployment (Villosa iris in 2012 and Lampsilis fasciola in 2013) and deployment method (silo or cage). Concentrations with the same superscript letter are not significantly (α = 0.05) from one another. Table S2. Spearman’s rho correlation coefficients for correlations between site-specific bed and particulate sediment and juvenile mussel trace element soft tissue concentrations. Villosa iris were deployed in 2012 and Lampsilis fasciola were deployed in 2013. Bold and Italics with * = significant (p ≤ 0.05); Bold and Italics only = marginal significance (0.05 < p < 0.10). BDL = more than half of samples were below detection limit; therefore, the element was excluded from our analyses. Table S3. Spearman’s rho correlation coefficients for correlations between site-specific bed and particulate sediment and juvenile mussel PAH tissue concentrations. Villosa iris were deployed in 2012 and Lampsilis fasciola were deployed in 2013. Bold and Italics with * = significant (p ≤ 0.05); Bold and Italics only = marginal significance (0.05 < p < 0.10). BDL = more than half of samples were below detection limit; therefore, the compound was excluded from our analyses. Table S4. Spearman’s rho correlation coefficients for correlations between site-specific surface water concentrations of trace elements (by sampling event) and juvenile mussel soft tissue concentrations. Bold and Italics with * = significant (p ≤ 0.05); Bold and Italics only = marginal significance (0.05 < p < 0.10). BDL = more than half of samples were below detection limit; therefore, the metal was excluded from our analyses. Sampling events were as follows: Q1 = 21–23 August 2012 (mainstem only); Q2 = 24–25 October 2012 (tributaries) and 15–16 November 2012 (mainstem); Q4 = 18–19 July 2013 (mainstem) and 5–6 August 2013 (tributaries); Q5 = 18–20 September 2013 (mainstem only). Juvenile mussels deployed from 5–6 June 2012 to 24–25 October 2012 and 31 July–1 August 2013 to 5–7 November 2013. Table S5. Spearman’s rho correlation coefficients for correlations between site-specific surface water concentrations of PAHs (by passive diffusion sampler deployment period) and deployed mussel PAH tissue concentrations. Bold and Italics with * = significant (p ≤ 0.05); Bold and Italics only = marginal significance (0.05 < p < 0.10). BDL = more than half of samples were below detection limit; therefore, the PAH was excluded from our analyses. Seasonal deployments of PSDs were as follows: 2012 summer = 18 July–21 August; 2012 fall = 27 September–24 October; 2013 spring = 7 May–5 June; 2013 summer = 30 July–26 August; 2013 fall = 8 October–5 November. Juvenile mussels deployed from 5–6 June 2012 to 24–25 October 2012 and from 31 July–1 August 2013 to 5–7 November 2013. Table S6. Spearman’s rho correlation coefficients for correlations between site-specific June and October 2013 pore water metal concentrations and 2013 juvenile mussel trace element soft tissue concentrations. Bold and Italics with * = significant (p ≤ 0.05); Bold and Italics only = marginal significance (0.05 < p < 0.10). BDL = more than half of samples were below detection limit; therefore, the metal was excluded from analyses. Table S7. Spearman’s rho correlation coefficients for correlations between site-specific June and October 2013 pore water PAH concentrations and 2013 juvenile mussel PAH tissue concentrations. Bold and Italics with * = significant (p ≤ 0.05); Bold and Italics only = marginal significance (0.05 < p < 0.10). BDL = more than half of samples were below detection limit; therefore, the metal was excluded from analyses. Table S8. Results from correlation analyses of site-specific mean total mussel density vs. metal concentrations measured in deployed mussel tissues in 2012 and 2013. rs is the Spearman rho correlation coefficient. Bold and Italics with * = significant (p ≤ 0.05); Bold and Italics only = marginal significance (0.05 < p < 0.10). Mussel densities were based on quantitative quadrat surveys conducted intermittently over the years 2005–2014.
Author Contributions
Conceptualization, W.G.C., J.J. and B.B.; methodology, W.G.C. and J.J.; formal analysis, W.A.W., C.B., J.A., J.U., D.S., P.R.L. and J.L.C.; investigation, W.A.W., C.B., J.A., P.R.L. and J.J.R.; resources, B.B., J.J.R. and D.S.; data curation, W.A.W. and C.B.; writing—original draft preparation, W.A.W. and C.B.; writing—review and editing, C.B., J.A., J.U., J.J., D.S. and W.G.C.; visualization, W.A.W., C.B. and J.A.; supervision, W.G.C. and J.J.; project administration, W.G.C.; funding acquisition, W.G.C. and J.J. All authors have read and agreed to the published version of the manuscript.
Funding
This research was funded by the U.S. Geological Survey (USGS) through the U.S. Fish and Wildlife Service (USFWS) Science Support Partnership (SPP) Program via Research Work Order No. 197, administered through the USGS North Carolina and Virginia Cooperative Fish and Wildlife Research Units. The participation of Jason Unrine in this study was made possible by a U.S. Department of Agriculture, National Institute of Food and Agriculture Project (KY006133A) and a National Institute of Environmental Health Sciences Grant (P30ES026529). The participation of W. Gregory Cope in this study was made possible by the Research Capacity Fund (Hatch) project award no. 7007359 from the U.S. Department of Agriculture’s National Institute of Food and Agriculture.
Institutional Review Board Statement
Not applicable.
Data Availability Statement
The data presented in this study are available on request from the corresponding author. The data are not publicly available due to lack of mandate.
Acknowledgments
We thank Brian Evans and Steve Alexander of the USFWS for their contributions to the design, management, and execution of the study. We especially thank Matt Johnson, Jeremy Leonard, Andrew Phipps, Angela White, Amanda Weberg, Caitlin Carey, Megan Bradley, Dan Hua, and Brett Ostby for field, laboratory, mussel propagation, and database assistance. Megan Charlton performed sample processing for mussel shell analysis. Bill Henley, Tom Kwak, Mark Ford, Brad Kreps, Roberta Hylton, Susan Lingenfelser, Cindy Kane, the U.S. Environmental Protection Agency Laboratory in Fort Meade Maryland, the Virginia Department of Environmental Quality, the Tennessee Department of Environmental Conservation, and the Steering Committee of the Clinch-Powell Clean Rivers Initiative provided logistical and stakeholder support for this project. The views expressed in this article are those of the author(s) and do not necessarily represent the views or policies of the USFWS. Any use of trade, firm, or product names is for descriptive purposes only and does not imply endorsement by the U.S. Government.
Conflicts of Interest
The authors declare no conflicts of interest.
References
- Williams, J.D.; Warren, M.L.; Cummings, K.S.; Harris, J.L.; Neves, R.J. Conservation status of freshwater mussels of the United States and Canada. Fisheries 1993, 18, 6–22. [Google Scholar] [CrossRef]
- Haag, W.R.; Williams, J.D. Biodiversity on the brink: An assessment of conservation strategies for North American freshwater mussels. Hydrobiologia 2014, 735, 45–60. [Google Scholar] [CrossRef]
- Bogan, A.E. Freshwater bivalve extinctions (Mollusca: Unionoida): A search for causes. Am. Zool. 1993, 33, 599–609. [Google Scholar] [CrossRef]
- Lydeard, C.; Cowie, R.H.; Ponder, W.F.; Bogan, A.E.; Bouchet, P.; Clark, S.A.; Cummings, K.S.; Frest, T.J.; Gargominy, O.; Herbert, D.G.; et al. The global decline of nonmarine mollusks. Bioscience 2004, 54, 321–330. [Google Scholar] [CrossRef]
- Strayer, D.L.; Downing, J.A.; Haag, W.R.; King, T.L.; Layzer, J.B.; Newton, T.J.; Nichols, S.J. Changing perspectives on pearly mussels, North America’s most imperiled animals. Bioscience 2004, 54, 429–439. [Google Scholar] [CrossRef]
- Augspurger, T.; Keller, A.E.; Black, M.C.; Cope, W.G.; Dwyer, F.J. Water quality guidance for protection of freshwater mussels (Unionidae) from ammonia exposure. Environ. Toxicol. Chem. 2003, 22, 2569–2575. [Google Scholar] [CrossRef]
- Cope, W.G.; Bringolf, R.B.; Buchwalter, D.B.; Newton, T.J.; Ingersoll, C.G.; Wang, N.; Augspurger, T.; Dwyer, F.J.; Barnhart, M.C.; Neves, R.J.; et al. Differential exposure, duration, and sensitivity of unionoidean bivalve life stages to environmental contaminants. J. N. Am. Benthol. Soc. 2008, 27, 451–462. [Google Scholar] [CrossRef]
- Downing, J.A.; Van Meter, P.; Woolnough, D.A. Suspects and evidence: A review of the causes of extirpation and decline in freshwater mussels. Anim. Biodivers. Conserv. 2010, 33, 151–185. [Google Scholar] [CrossRef]
- Richter, B.D.; Braun, D.P.; Mendelson, M.A.; Master, L.L. Threats to imperiled freshwater fauna. Conserv. Biol. 1997, 11, 1081–1093. [Google Scholar] [CrossRef]
- Milam, C.D.; Farris, J.L.; Dwyer, F.J.; Hardesty, D.K. Acute toxicity of six freshwater mussel species (glochidia) to six chemicals: Implications for daphnids and Utterbackia imbecillis as surrogates for protection of freshwater mussels (Unionidae). Arch. Environ. Contam. Toxicol. 2005, 48, 166–173. [Google Scholar] [CrossRef]
- Cope, W.G.; Bergeron, C.M.; Archambault, J.M.; Jones, J.W.; Beaty, B.; Lazaro, P.R.; Shea, D.; Callihan, J.L.; Rogers, J.J. Understanding the influence of multiple pollutant stressors on the decline of freshwater mussels in a biodiversity hotspot. Sci. Total Environ. 2021, 773, 144757. [Google Scholar] [CrossRef]
- Jones, J.; Ahlstedt, S.; Ostby, B.; Beaty, B.; Pinder, M.; Eckert, N.; Butler, R.; Hubbs, D.; Walker, C.; Hanlon, S.; et al. Clinch River freshwater mussels upstream of Norris Reservoir, Tennessee and Virginia: A quantitative assessment from 2004 to 2009. J. Am. Water Resour. Assoc. 2014, 50, 820–836. [Google Scholar] [CrossRef]
- Rogers, J.J.; Henley, W.F.; Weberg, A.G.; Jones, J.W.; Cope, W.G. Assessment of growth, survival, and organ tissues of caged mussels (Bivalvia: Unionidae) in a river-scape influenced by coal mining in the southeastern USA. Sci. Total Environ. 2018, 645, 1273–1286. [Google Scholar] [CrossRef] [PubMed]
- Richard, J.C.; Leis, E.; Dunn, C.D.; Agbalog, R.; Waller, D.; Knowles, S.; Putnam, J.; Goldberg, T.L. Mass mortality in freshwater mussels (Actinonaias pectorosa) in the clinch River, USA, linked to a novel densovirus. Sci. Rep. 2020, 21, 36–56. Available online: https://www.nature.com/articles/s41598-020-71459-z.pdf (accessed on 16 July 2025). [CrossRef] [PubMed]
- Neto, J.G.D.S. Investigating Freshwater Mussel Disease and Mortality in the Clinch River Within a Population Ecology Framework. Ph.D. Thesis, University of Tennessee, Knoxville, TN, USA, 2025. Available online: https://trace.tennessee.edu/utk_graddiss/12359 (accessed on 16 July 2025).
- Imlay, M. Use of shells of freshwater mussels in monitoring heavy metals and environmental stresses: A review. Malacol. Rev. 1982, 15, 1–14. [Google Scholar]
- Zuykov, M.; Pelletier, E.; Harper, D.A.T. Bivalve mollusks in metal pollution studies: From bioaccumulation to biomonitoring. Chemosphere 2013, 93, 201–208. [Google Scholar] [CrossRef]
- Schöne, B.R.; Krause, R.A. Retrospective environmental biomonitoring–Mussel Watch expanded. Glob. Planet. Change 2016, 144, 228–251. [Google Scholar] [CrossRef]
- Holland, H.A.; Schöne, B.R.; Lipowsky, C.; Esper, J. Decadal climate variability of the North Sea during the last millennium reconstructed from bivalve shells (Arctica islandica). Holocene 2014, 24, 771–786. [Google Scholar] [CrossRef]
- Lavaud, R.; Thébault, J.; Lorrain, A.; van der Geest, M.; Chauvaud, L. Senilia senilis (Linnaeus, 1758), a biogenic archive of environmental conditions on the Banc d’Arguin (Mauritania). J. Sea Res. 2013, 76, 61–72. [Google Scholar] [CrossRef]
- Geeza, T.J.; Gillikin, D.P.; Goodwin, D.H.; Evans, S.D.; Watters, T.; Warner, N.R. Controls on magnesium, manganese, strontium, and barium concentrations recorded in freshwater mussel shells from Ohio. Chem. Geol. 2019, 526, 142–152. [Google Scholar] [CrossRef]
- Kelemen, Z.; Gillikin, D.P.; Bouillon, S. Relationship between river water chemistry and shell chemistry of two tropical African freshwater bivalve species. Chem. Geol. 2019, 526, 130–141. [Google Scholar] [CrossRef]
- Wilson, W.A.; Fritts, A.K.; Fritts, M.W.; Unrine, J.M.; Tweedy, B.N.; Casper, A.F. Freshwater mussel shells (Unionidae) describe anthropogenic changes to trace element cycling within a North American river. Sci. Total Environ. 2018, 616, 1066–1076. [Google Scholar] [CrossRef]
- Green, R.H.; Bailey, R.C.; Hinch, S.G.; Metcalfe, J.L.; Young, V.H. Use of freshwater mussels (Bivalvia: Unionidae) to monitor the nearshore environment of lakes. J. Gt. Lakes Res. 1989, 15, 635–644. [Google Scholar] [CrossRef]
- Markich, S.J.; Jeffree, R.A.; Burke, P.T. Freshwater bivalve shells as archival indicators of metal pollution from a copper-uranium mine in tropical northern Australia. Environ. Sci. Technol. 2002, 36, 821–832. [Google Scholar] [CrossRef]
- Barnhart, M.C.; Fobian, T.B.; Whites, D.W.; Ingersoll, C.G. Mussel silos: Bernoulli flow devices for caging juvenile mussels in rivers. In Proceedings of the 5th Biennial Symposium of the Freshwater Mollusk Conservation Society, Little Rock, AR, USA; 2007; p. 107. [Google Scholar]
- Barnhart, M.C. Buckets of muckets: A compact system for rearing juvenile freshwater mussels. Aquaculture 2006, 254, 227–233. [Google Scholar] [CrossRef]
- Archambault, J.M.; Bergeron, C.M.; Cope, W.G.; Lazaro, P.R.; Leonard, J.A.; Shea, D. Assessing toxicity of contaminants in riverine suspended sediments to freshwater mussels. Environ. Toxicol. Chem. 2017, 36, 395–407. [Google Scholar] [CrossRef]
- Archambault, J.M.; Prochazka, S.T.; Cope, W.G.; Shea, D.; Lazaro, P.R. Polycyclic aromatic hydrocarbons in surface waters, sediments, and unionid mussels: Relation to road crossings and implications for chronic mussel exposure. Hydrobiologia 2018, 810, 465–476. [Google Scholar] [CrossRef]
- Wilson, W.A.; Fritts, A.K.; Fritts, M.W.; Unrine, J.M.; Casper, A.F. Freshwater mussel (Unionidae) shells document the decline of trace element pollution in the regional watersheds of Chicago (Illinois, USA). Hydrobiologia 2018, 816, 179–196. [Google Scholar] [CrossRef]
- Roper, D.S.; Hickey, C.W. Population structure, shell morphology, age and condition of the freshwater mussel Hydridella menziesi (Unionacea, Hydriidae) from 7 lake and river sites in the Waikato River System. Hydrobiologia 1994, 284, 205–217. [Google Scholar] [CrossRef]
- Knezevic, A. Overlapping Confidence Intervals and Statistical Significance; StatNews Cornell University: Ithaca, NY, USA, 2008; Stat. Consult. Unit 73, p.3; Available online: https://rpubs.com/bbolker/overlapCI (accessed on 29 May 2025).
- Angelo, R.T.; Cringan, M.S.; Chamberlain, D.L.; Stahl, A.J.; Haslouer, S.G.; Goodrich, C.A. Residual effects of lead and zinc mining on freshwater mussels in the Spring River Basin (Kansas, Missouri, and Oklahoma, USA). Sci. Total Environ. 2007, 384, 467–496. [Google Scholar] [CrossRef] [PubMed]
- Luoma, S.N.; Dagovitz, R.; Axtmann, E. Temporally intensive study of trace metals in sediments and bivalves from a large river, estuarine system—Suisun Bay Delta in San-Francisco Bay. Sci. Total Environ. 1990, 97, 685–712. [Google Scholar] [CrossRef]
- Helsel, D. Statistics for Censored Environmental Data Using Minitab and R, 2nd ed.; Wiley: Hoboken, NJ, USA, 2012; p. 344. [Google Scholar]
- Kwan, K.H.M.; Chan, H.M.; De Laftonaine, Y. Metal contamination in zebra mussels (Dreissena polymorpha) along the St. Lawrence River. Environ. Monit. Assess. 2003, 88, 193–219. [Google Scholar] [CrossRef] [PubMed]
- Johnson, G.C.; Krstolic, J.L.; Ostby, B.J.K. Influences of water and sediment quality and hydrologic processes on mussels in the Clinch River. J. Am. Water Resour. Assoc. 2014, 50, 878–897. [Google Scholar] [CrossRef]
- Kyle, R.; Reid, N.; O’Connor, N.; Roberts, D. Development of release methods for captive-bred freshwater pearl mussels (Margaritifera margaritifera). Aquat. Conserv. Mar. Freshw. Ecosyst. 2017, 27, 492–501. [Google Scholar] [CrossRef]
- Seidel, D. Evaluating the Use of Mussel Silos for Reintroducing Hatchery-Reared Juvenile Mussels in Two Central Illinois Watersheds. Master’s Thesis, Southern Illinois University, Edwardsville, IL, USA, 2019. [Google Scholar]
- Haag, W.R.; Culp, J.J.; McGregor, M.A.; Bringolf, R.; Stoeckel, J.A. Growth and survival of juvenile freshwater mussels in streams: Implications for understanding enigmatic mussel declines. Freshw. Sci. 2019, 38, 753–770. [Google Scholar] [CrossRef]
- Martel, P.; Kovacs, T.; Voss, R.; Megraw, S. Evaluation of caged freshwater mussels as an alternative method for environmental effects monitoring (EEM) studies. Environ. Pollut. 2003, 124, 471–483. [Google Scholar] [CrossRef]
- Fritts, A.K.; Fritts, M.W.; Haag, W.R.; DeBoer, J.A.; Casper, A.F. Freshwater mussel shells (Unionidae) chronicle changes in a North American river over the past 1000 years. Sci. Total Environ. 2017, 575, 199–206. [Google Scholar] [CrossRef]
- Cravotta, C.A. Dissolved metals and associated constituents in abandoned coal-mine discharges, Pennsylvania, USA. Part 1: Constituent quantities and correlations. Appl. Geochem. 2008, 23, 166–202. [Google Scholar] [CrossRef]
- Bolotov, I.N.; Pokrovsky, O.S.; Auda, Y.; Bespalaya, J.V.; Vikhrev, I.V.; Gofarov, M.Y.; Lyubas, A.A.; Viers, J.; Zouiten, C. Trace element composition of freshwater pearl mussels Margaritifera spp. across Eurasia: Testing the effect of species and geographic location. Chem. Geol. 2015, 402, 125–139. [Google Scholar] [CrossRef]
- Langlet, D.; Alleman, L.Y.; Plisnier, P.D.; Hughes, H.; Andre, L. Manganese content records seasonal upwelling in Lake Tanganyika mussels. Biogeosciences 2007, 4, 195–203. [Google Scholar] [CrossRef]
- Soldati, A.L.; Jacob, D.E.; Schone, B.R.; Bianchi, M.M.; Hajduk, A. Seasonal periodicity of growth and composition in valves of Diplodon chilensis patagonicus (D’orbigny, 1835). J. Molluscan Stud. 2009, 75, 75–85. [Google Scholar] [CrossRef]
- Risk, M.J.; Burchell, M.; De Roo, K.; Nairn, R.; Tubrett, M.; Forsterra, G. Trace elements in bivalve shells from the Río Cruces, Chile. Aquat. Biol. 2010, 10, 85–97. [Google Scholar] [CrossRef]
- Binkowski, Ł.J.; Błaszczyk, M.; Przystupińska, A.; Ożgo, M.; Massanyi, P. Metal concentrations in archaeological and contemporary mussel shells (Unionidae): Reconstruction of past environmental conditions and the present state. Chemosphere 2019, 228, 756–761. [Google Scholar] [CrossRef] [PubMed]
- Schettler, G.; Pearce, N.J.G. Metal pollution recorded in extinct Dreissena polymorpha communities, Lake Breitling, Havel Lakes system, Germany: A laser ablation inductively coupled plasma mass spectrometry study. Hydrobiologia 1996, 317, 1–11. [Google Scholar] [CrossRef]
- Wang, N.; Ingersoll, C.G.; Kunz, J.L.; Brumbaugh, W.G.; Kane, C.M.; Evans, R.B.; Alexander, S.; Walker, C.; Bakaletz, S. Toxicity of sediments potentially contaminated by coal mining and natural gas extraction to unionid mussels and commonly tested benthic invertebrates. Environ. Toxicol. Chem. 2013, 32, 207–221. [Google Scholar] [CrossRef]
- Yang, Y.; Ligouis, B.; Pies, C.; Grathwohl, P.; Hofmann, T. Occurrence of coal and coal-derived particle-bound polycyclic aromatic hydrocarbons (PAHs) in a river floodplain soil. Environ. Pollut. 2008, 151, 121–129. [Google Scholar] [CrossRef]
- Raikow, D.F.; Hamilton, S.K. Bivalve diets in a midwestern US stream: A stable isotope enrichment study. Limnol. Oceanogr. 2001, 46, 514–522. [Google Scholar] [CrossRef]
- Gustafson, L.; Showers, W.; Kwak, T.; Levine, J.; Stoskopf, M. Temporal and spatial variability in stable isotope compositions of a freshwater mussel: Implications for biomonitoring and ecological studies. Oecologia 2007, 152, 140–150. [Google Scholar] [CrossRef]
- Ollard, I.; Ballantyne, R.; Aldridge, D.C. Freshwater mussel (Unio pictorum) shells reveal hydrological and environmental change from 1300 BC to the present day. Glob. Change Biol. 2024, 30, e17532. [Google Scholar] [CrossRef]
- Gundacker, C. Comparison of heavy metal bioaccumulation in freshwater molluscs of urban river habitats in Vienna. Environ. Pollut. 2000, 110, 61–71. [Google Scholar] [CrossRef]
- Shoults-Wilson, W.A.; Unrine, J.M.; Rickard, J.; Black, M.C. Comparison of metal concentrations in Corbicula fluminea and Elliptio hopetonensis in the Altamaha River System, Georgia, USA. Environ. Toxicol. Chem. 2010, 29, 2026–2033. [Google Scholar] [CrossRef]
- Tessier, A.; Campbell, P.G.C.; Auclair, J.C.; Bisson, M. Relationships between the partitioning of trace metals in sediments and their accumulation in the tissues of the freshwater mollusk Elliptio complanata in a mining area. Can. J. Fish. Aquat. Sci. 1984, 41, 1463–1472. [Google Scholar] [CrossRef]
- Oliveira, L.F.D.; Cabral, M.T.; Vieira, C.E.D.; Antoniazzi, M.H.; Risso, W.E.; Martinez, C.B.D.R. Metals bioaccumulation and biomarkers responses in the Neotropical freshwater clam Anodontites trapesialis: Implications for monitoring coal mining areas. Sci. Total Environ. 2016, 571, 983–991. [Google Scholar] [CrossRef]
- Rzymski, P.; Niedzielski, P.; Klimaszyk, P.; Poniedziałek, B. Bioaccumulation of selected metals in bivalves (Unionidae) and Phragmites australis inhabiting a municipal water reservoir. Environ. Monit. Assess. 2014, 186, 3199–3212. [Google Scholar] [CrossRef] [PubMed]
- Hickey, C.; Roper, D.; Buckland, S. Metal concentrations of resident and transplanted freshwater mussels Hyridella menziesi (Unionacea: Hyriidae) and sediments in the Waikato River, New Zealand. Sci. Total Environ. 1995, 175, 163–177. [Google Scholar] [CrossRef]
- Ganjali, S.; Mortazavi, S. The Swan Mussel (Anodonta cygnea) in Anzali Wetland of Iran, a potential biomonitor for Cd and Pb. Bull. Environ. Contam. Toxicol. 2014, 93, 154–158. [Google Scholar] [CrossRef] [PubMed]
- Ravera, O.; Beone, G.M.; Cenci, R.; Lodigiani, P. Metal concentrations in Unio pictorum mancus (Mollusca, Lamellibranchia) from of 12 Northern Italian lakes in relation to their trophic level. J. Limnol. 2003, 62, 121–138. [Google Scholar] [CrossRef]
- Ravera, O.; Beone, G.M.; Trincherini, P.R.; Riccardi, N. Seasonal variations in metal content of two Unio pictorum mancus (Mollusca, Unionidae) populations from two lakes of different trophic state. J. Limnol. 2007, 66, 28–39. [Google Scholar] [CrossRef]
- Klishko, O.K.; Berdnikov, N.V.; Bogan, A.E.; Vinarski, M.V. Shells of pearlmussels, Margaritifera dahurica (Bivalvia: Margaritiferidae), as a biogeochemical indicator of the background (Holocene) and current major and trace elements content in riverine waters of Transbaikalia (southeast Siberia). Ecol. Indic. 2022, 134, 108482. [Google Scholar] [CrossRef]
- Dermott, R.M.; Lum, K.R. Metal concentrations in the annual shell layers of the bivalve Elliptio complanata. Environ. Pollut. Ser. B Chem. Phys. 1986, 12, 131–143. [Google Scholar] [CrossRef]
- Teunen, L.; De Jonge, M.; Malarvannan, G.; Covaci, A.; Belpaire, C.; Focant, J.-F.; Blust, R.; Bervoets, L. Effect of abiotic factors and environmental concentrations on the bioaccumulation of persistent organic and inorganic compounds to freshwater fish and mussels. Sci. Total Environ. 2021, 799, 149448. [Google Scholar] [CrossRef]
- Metcalfe-Smith, J.L.; Green, R.H.; Grapentine, L.C. Influence of biological factors on concentrations of metals in the tissues of freshwater mussels (Elliptio complanata and Lampsilis radiata radiata) from the St Lawrence River. Can. J. Fish. Aquat. Sci. 1996, 53, 205–219. [Google Scholar] [CrossRef]
Disclaimer/Publisher’s Note: The statements, opinions and data contained in all publications are solely those of the individual author(s) and contributor(s) and not of MDPI and/or the editor(s). MDPI and/or the editor(s) disclaim responsibility for any injury to people or property resulting from any ideas, methods, instructions or products referred to in the content. |
© 2025 by the authors. Licensee MDPI, Basel, Switzerland. This article is an open access article distributed under the terms and conditions of the Creative Commons Attribution (CC BY) license (https://creativecommons.org/licenses/by/4.0/).