Article

Ecoacoustic Baseline of a Successional Subarctic Ecosystem Post-Glaciation Amidst Climate Change in South-Central Alaska

1
Kenai Fjords National Park, U.S. National Park Service, Seward, AK 99664, USA
2
Bureau of Land Management, Department of the Interior, Phoenix, AZ 85004, USA
3
Department of Pure and Applied Sciences, Urbino University, 61029 Urbino, Italy
*
Author to whom correspondence should be addressed.
Diversity 2025, 17(7), 443; https://doi.org/10.3390/d17070443
Submission received: 29 April 2025 / Revised: 15 June 2025 / Accepted: 18 June 2025 / Published: 23 June 2025
(This article belongs to the Special Issue Wildlife in Natural and Altered Environments)

Abstract

As climate change alters subarctic ecosystems and human activities in Alaska, ecological baselines are critical for long-term conservation. We applied an ecoacoustic approach to characterize the ecological conditions of a rapidly deglaciating region in Kenai Fjords National Park, Alaska. Using automated recording units deployed at increasing distances from a road, we collected over 120,000 one-minute audio samples during the tourist seasons of 2021 and 2022. Ecoacoustic indices—Sonic Heterogeneity Index (SHItf), Spectral Sonic Signature (SSS), Weighted Proportion of Occupied Frequencies (wPOF), and Normalized Difference Sonic Heterogeneity Index (NDSHI)—were used to measure spatio-temporal patterns of the sonoscape. Results revealed higher sonic heterogeneity near the road attributed to technophony (vehicles) and geophony (wind) that spanned across the frequency spectrum, masking mid-high frequency biophony. Seasonal phenology and diel variations reflected ecological and human rhythms, including biophony from the dawn chorus from May–June, technophony from vehicle-based tourism from July–September, and decreased sonic activity in the form of geophonic ambience in October. Low-frequency geophonies were prevalent throughout the sonoscape with more natural sounds at greater distances from the road. Our findings demonstrate the benefits of using ecoacoustic methods to assess ecosystem dynamics for establishing ecological baselines useful for future comparisons in rapidly changing environments.

1. Introduction

The subarctic region of south-central Alaska exemplifies one of Earth’s most rapidly transforming environments, experiencing substantial climate-driven changes that are projected to continue for decades into the future [1]. Over the past century, mean annual ocean temperatures in the region have increased by 0.7 °C, while winter terrestrial temperatures in January and February have risen by 1.7 °C [2]. The Kenai Peninsula’s major ice masses, including the Harding Icefield and Grewingk-Yalik Glacier Complex, have undergone significant degradation since the 1950s [3,4]. Many of the lake-, tidewater-, and land-terminating glaciers that stem from these ice masses are exhibiting accelerated surface velocities and calving rates [5], with more than half of those studied showing increased retreat rates between 1984 and 2021, resulting in approximately 42 km2 of ice loss [6].
Climate projections through 2099 indicate continued warming across all months, with July and August temperatures predicted to rise by 1.5 °C (https://uaf-snap.org) accessed on 15 October 2024. Precipitation patterns are expected to concomitantly shift during fall (September–October) and winter (November–March), while remaining stable during spring (April–May) and summer (June–August). Wind events lasting ≥1 h are projected to decrease by approximately 10% within the next 15 years. By 2060, the duration of winter conditions with mean monthly temperatures ≤0 °C is expected to contract from five months (November–March) to two months (December–January), accompanied by diminishing snowpack. Even now, shorter winters are extending the summer tourist season [1,7], coinciding with a broader global rise in tourism [8]. Consequently, such effects introduce additional environmental pressures to plant and animal communities already experiencing shifting phenological patterns [9,10,11,12,13].
Climate-related changes like these have significant implications for both human activities and ecological systems. To assess their severity, conservationists and resource managers require reliable and robust ecological baselines rooted in the concepts of systems ecology [14]. In the absence of comparable baselines, non-invasive automated methods and analytical tools are essential for efficiently collecting and processing broad-scale geophysical, biological, and anthropogenic data.

1.1. Sonic Indicators of Ecological Change: An Ecoacoustics Approach

Many ecological elements undergoing change in the subarctic—such as wind, rain, animal behavior, and human activities—generate vibrations in the environment in the form of sonic waves. While soundscapes are defined by the predetermined categories of geophony, biophony, and anthropophony, sonoscapes reflect the complex relationships among all sonic waves that arise from interacting geophysical, biological, and anthropogenic processes within a landscape [15]. Conceptually, ecologists can study the patterns and diversity of the sonoscape to gain more holistic insights into the ecological processes and conditions of ecosystems.
The field of ecoacoustics has developed a theoretical and applied framework for this approach based on the fundamentals of ecology, biosemiotics, bioacoustics, and evolution [16]. According to ecoacoustics theory, a sonoscape can serve as a single emergent variable as the collection of all sonic waves that possess the measurable properties of intensity and frequency that occur over time at a receiver’s location. Imbedded in the sonoscape are the coded patterns of interacting soniferous geophysical, biological, and anthropogenic processes that are affected by and influential to environmental change.
In this way, ecoacoustics applies a biosemiotic strategy analogous to that used by sound-dependent organisms by decoding and interpreting the sonoscape as an indicator of current and changing environmental conditions. Recent research on sonoscapes has revealed how they exhibit distinct spatio-temporal characteristics and behaviors with dynamic temporal patterns over diel, seasonal, and annual scales, shaped by both natural and anthropogenic processes across diverse landscapes and spatial extents [17]. As the study of sonoscapes continues to develop, ecoacoustics provides a unique and novel approach to understanding ecological relationships and characterizing the geophysical, biological, and anthropogenic processes that respond to environmental change.

1.2. Ecoacoustic Baselines Amidst Climate Change

Protected land preserves popularized by tourism offer unique opportunities to study how ecosystems respond to the complex interactions between climate change and human activities. Alaska’s national parks have experienced significantly greater climate-related impacts than those in the contiguous United States [18], coupled with a burgeoning tourist industry (https://irma.nps.gov/Stats/) accessed on 2 February 2025, that are dramatically transforming these magnificent subarctic landscapes within a human lifetime [19]. These circumstances position Alaska’s national parks as natural living laboratories for investigating the impacts of environmental change and human-ecological dynamics.
As Alaska’s national parks continue to undergo ecological transformation amidst climate change, the urgency of acquiring robust, contemporary data has never been greater. Unfortunately, baseline studies that empirically characterize the ecological dimensions of Alaska’s sonoscapes—particularly in remote and climatically vulnerable regions—remain limited in scope and availability [12,20,21]. The growing effectiveness and reliability of ecoacoustic methods position the sonoscape as a compelling new frontier for investigating ecological processes and ecosystem responses to environmental change. Through the deployment of automated recording devices across representative landscapes, the sonoscape can be captured as digital audio data (e.g., WAV files), which can then be transformed into robust and dependable ecoacoustic indices [22] using advanced automated processing tools [23]. The results offer valuable insights for characterizing and interpreting ecological processes affected by climate change, serving as a powerful tool to establish useful and repeatable baselines.
Based on this premise, our objectives were to:
  • Record ambient sounds during the tourist season at distances from a road where tourist vehicle numbers are counted within a highly visited region of an Alaskan national park effected by climate change,
  • Calculate ecoacoustic indices from these recordings to quantify the sonoscape as an indicator of the geophysical, biological, and anthropogenic activities in this study area,
  • Determine whether there is a measurable spatial difference of ecoacoustic indices at interval distances from the road, and
  • Visualize the temporal patterns of the sonoscape at annual, monthly, daily, and hourly timescales as an ecoacoustic baseline for future comparisons.
We expected our results to reveal how this subarctic sonoscape is currently characterized spatially and temporally in reference to a moderately trafficked road that bisects a successional plant community born from the moraine of a glacier that has rapidly retreated over the last 200 years.

2. Materials and Methods

2.1. Study Area

We conducted our investigation in Kenai Fjords National Park (KEFJ), located along the eastern coastline of the Kenai Peninsula in south-central Alaska (Figure 1). Our study area was focused on the Exit Glacier Developed Area (EGDA) as the only region of KEFJ accessible to motor vehicles by means of Exit Glacier Road, a 2.4 km long, two-lane paved route with a 56 km/h (35 mph) speed limit that funnels over 100,000 people into the EGDA every year (Figure 1). Park staff count the number of vehicles entering the EGDA on an annual basis when the park’s gate is open to motor vehicles between May and October (see [24] for details).
Although the EGDA only features a small number of trails and amenities, it has experienced an average annual increase in visitation of 4.35% since 2010, catering to roughly 153,690 visitors/year on average. Visitors are primarily drawn to the EGDA to see Exit Glacier as one of Alaska’s most accessible and rapidly shrinking glaciers, having retreated approximately 50 m/year since 2010 (Figure 2) [25]. The EGDA lies within the deglaciated moraine of Exit Glacier, possessing a dynamic hydrological landscape with Exit Creek fed by melting glacial ice, snowmelt from the surrounding Kenai Mountains, and rainwater. The forest interior features various small, ephemeral streams as remnants of the historical Exit Creek.
Our sample sites were specifically located within the subarctic maritime rainforest that has emerged after Exit Glacier’s retreat dating back to 1815. The forest of the Exit Glacier moraine is comprised of a transitional successional plant community that includes a forb-grass-fern-lichen understory, a mid-story of Sitka alder (Alnus viridis ssp. sinuata), devil’s club (Oplopanax horridus), and willow (Salix sp.), and a canopy of Kenai birch (Betula kenaica), black cottonwood (Populus balsamifera ssp. trichocarpa), Sitka spruce (Picea sitchensis), and mountain hemlock (Tsuga mertensiana). Common wildlife in the area includes 20 species of birds, black bears (Ursus americanus), brown bears (Ursus arctos), moose (Alces alces), wolves (Canis lupus), wolverines (Gulo gulo), martens (Martes americana), coyotes (Canis latrans), lynx (Lynx canadensis), snowshoe hares (Lepus americanus), and porcupines (Erethison dorsatum).

2.2. Sample Design

We intended to deploy sound recording stations in replicates of two at interval distances from Exit Glacier Road in reference to the propagation of technophony generated from vehicle traffic on Exit Glacier Road (Figure 1). However, we did not have a known sound level of sonic intensity or attenuation for vehicle traffic directly measured from Exit Glacier Road to select our sample distances. Instead, we estimated the sound pressure level from known vehicle traffic counts to select sample distances to maintain an ecoacoustic context. Because visitor numbers were unprecedently low in 2020 due to travel restrictions associated with the COVID-19 pandemic [25], we referenced data from 2019 when vehicle counts were consistent with previous years of monitoring.
Vehicle counts in 2019 were highest in July and predominantly occurred between the hours of 0800 and 2100. We took the average vehicle counts/day entering and exiting the EGDA (1264 vehicles/day) for the month of July 2019 and divided that number by 13 h/day, giving us an average traffic volume of 97 vehicles/h. We used this volume as a liberal estimate for calculating the maximum A-weighted sound pressure level (dBA) of traffic technophony/h at 10 m from the road using the following formula based on standard reference measures in the U.S.A. [26]:
L A e q = L A r e f + 10 · L o g 10 v + 20 · L o g 10 s s r e f 10 · L o g 10 d d r e f
where L A e q is the equivalent continuous A-weighted sound level (dBA), L A r e f is the standard reference dBA for passenger vehicles (i.e., 50 dBA), v is the known volume of vehicle traffic (i.e., 97 vehicles/h), s is the estimated speed (i.e., 56 km/h), s r e f is the estimated standard reference speed (i.e., 50 km/h), d is distance from the center lane to the assumed receiver (i.e., 10 m, the known road-forest edge), and d r e f is the standard reference distance (i.e., 15 m). This resulted in an estimate of 73 dBA (rounded to the nearest whole number), which we used as a starting point to calculate an approximate attenuation for technophony at interval distances from the road using the inverse-square law, as follows:
I 2 = I 1 20 · L o g 10 ( d 2 d 1 )
where I 1 is the sound pressure estimate (i.e., 73 dBA) at its calculated distance from the road d 1 (i.e., 10 m), and I 2 is the desired dBA estimate with new distance from the road d 2 . We acknowledge that the attenuation of road technophony was likely greater due to confounding environmental conditions [27].
We deferred to these results simply as a reference for selecting sound recording sites with an expected decrease in sound intensity with increasing distance from the road. We also took into account how field work could be accomplished safely considering the risk of injury from a combination of dense, spine-laden vegetation, uneven terrain, low visibility, and the high prevalence of brown and black bears in this area.
Therefore, we deployed recorders at 60 m from the road to capture edge technophony where sound pressure levels were estimated to be 57 dBA at six times the distance from our starting estimate. We deployed recorders at 180 m from the road at three times the previous distance based on recommendations for sound recording independence [23] with sound pressure levels estimated to be 48 dBA. We deployed recorders at 2.5 times the distance from the previous interval at 450 m from the road where the sound levels were estimated at 40 dBA and road technophony was unlikely to be detected [28,29]. Finally, we deployed recorders 1.5 times the distance from the previous interval at 675 m from the road where sound levels were estimated to be 36 dBA. These sites included replicate samples of sonic activity exclusively located outside the EGDA within KEFJ’s eligible wilderness, which is managed to minimize anthropogenic impacts to natural processes under the guidance the Wilderness Act of 1964 (Figure 1). We confirmed that the sound pressure levels estimated at 450 and 675 m were consistent with those measured by the National Park Service in 2008 at comparable distances from Exit Glacier Road, where exceedance events ranged from 37 to 45 dBA approximately 425 m west of the road and 35 to 40 dBA around 600 m to the north [30].
Each recorder was deployed at their respective distances along transects positioned at 344° NNW from Exit Glacier Road starting at half the distance between KEFJ’s eastern boundary and the campground (i.e., recording stations ROAD01—04), and perpendicular to the campground entrance (i.e., recording stations CAMP01—04) (Figure 1). The exact placement of recorders was slightly modified (±5 m) due to the challenging density of vegetation and the varying availability of adequate mounting locations. The distance between replicate sample sites was approximately 880 m (Figure 1).

2.3. Sound Sampling

We sampled the sonoscape using SM4 Song Meters (Wildlife Acoustics, Inc., Maynard, MA, USA) in right-channel, mono-aural, at a sample rate of 22,050 Hz with 10 dB gain, 26 dB preamplification, and without a filter or compression. Microphones were calibrated to the default sound pressure level of 94 dB based on manufacturer settings. Sound recorders were mounted to the trunks of trees or alders at approximately 2 m above the ground. Microphones were positioned in a way to prevent obstruction from all sides. The standard stock foam microphone covers were used to reduce direct wind disturbance to the microphone’s surface, which we assumed to be negligible due to the density of the surrounding vegetation and a previous experience conducting ecoacoustic studies at Exit Glacier.
Sound data were saved to 32 GB SD cards in WAV audio format and archived in KEFJ’s sound database. We visited all eight sound recorders on a single day every 2–3 weeks to exchange batteries and SD cards. We consistently brought 2–3 replacement recorders on each visit in case any recorder was tampered with or destroyed by bears.
We recorded the ambient sonoscape for 1 min every 30 min between the hours of 0000 and 2330 from 11 May to 30 October 2021 and 2022 for a total of 48 recordings per day over 172 consecutive days per sample year. Each 1 min recording served as an independent sample of the collective sonoscape as it existed for a 1 min moment in time. Ecoacoustic sampling methods of this kind have proven useful at sufficiently characterizing soundscapes [31,32], which differs from some bioacoustic methods that sample for longer recording periods with a focus on capturing discrete bird calls to study biodiversity and animal behaviors [12,33]. We ensured recorders were synchronized to the nearest second in order to collect samples of the sonoscape simultaneously at their respective distances.

2.4. Ecoacoustic Indices

2.4.1. Sonic Heterogeneity Index

We utilized Sonic Heterogeneity Indices (SHItf), also known as Acoustic Complexity Indices (ACItf) [34] to process the short-term Fourier transform (STFT) matrices obtained by WAV files using the SonoScape™ 1.1.0426 software with a clumping parameter set to 0 [23]. The SHItf is based on the Canberra distance metric and operates on a frequency magnitude obtained from the STFT [34].
Because SHItf is based on a normalized difference between adjacent sample points, the normalization constrains the values to a range between 0 and 1. Consequently, low-intensity signals can disproportionately inflate SHItf values even when the absolute difference is small. To prevent this, we applied a filtering threshold of 0.01 to exclude low-level signals that did not reflect meaningful environmental sounds [23].
The SHItf calculates the difference in contiguous intensities of each frequency bin along a temporal interval, so that:
S H I t f = j = 1 n | x i , j x i , j + 1 | ( x i , j + x i , j + 1 )
where SHItf is the total sonic heterogeneity of the ith frequency bin along a time interval j, xi,j and xi,j+1 are two contiguous values of intensity along a specific frequency bin i, and n is the number of temporal STFT intervals considered (segmented into 507 frequency bins 21.533 Hz in width). We compared SHItf using 95% confidence intervals (CI) between sample years and sampled distances from the road.

2.4.2. Spectral Sonic Signature

A spectral sonic signature (SSS) refers to the unique arrangement of SHItf within the frequency spectrum that emerges from soniferous geophysical, biological, and anthropogenic phenomena within an environment at a particular space in time [35]. We quantified the SSS by averaging the total SHItf as the quantitative measure of sonic activity for each frequency bin (001–507 bins) within the focal frequency spectrum of 129–11,025 Hz that occurred at each sample site [34]. We further calculated the SSS at each distance over monthly timeframes. This calculation describes the frequential change of SHItf graphically across the frequency spectrum as:
S S S = S H I t f
We visualized the SSS across the frequency spectrum at each distance when years were combined and compared SSS among distances between years and years combined using 95% CI.

2.4.3. Weighted Proportion of Occupied Frequencies

By definition, the SSS possesses a distinct arrangement of frequency bins that are either occupied or unoccupied by soniferous activities, reflecting the unique sonic characteristics of the sonoscape at a specific period of time. To characterize which frequency bins contributed to the uniqueness of SSS and how those contributions varied across temporal scales, we normalized the distribution of sonic energy for each recording by dividing the SHItf value of each frequency bin by the average SHItf across all 507 frequency bins. This standardization yielded a unitless index with a mean centered at 1.002, where values ≥ 1.0 represented frequency bins with above-average SHItf, likely indicative of prominent sonic activity. Based on this distribution, we classified frequency bins with SHItf ≥ 1.0 as occupied (assigned a value of 1) and SHItf < 1.0 as unoccupied (assigned a value of 0). To confirm that this classification would not inadvertently exclude low-energy recordings or quiet sound events, we calculated the proportion of sound recordings with an average SHItf < 1.0. As a result, only 0.1% of all recordings fell below this threshold, supporting the validity of our classification to ensure inclusivity of both prominent and quiet sonic events that contributed to SSS.
We then calculated the weighted proportion of occupied frequencies (wPOF) by adding the total number of occupied frequencies and dividing that by the total number of recording events that we collected at each sample distance for each month (wPOFm; May–October), Julian day (11 May = 131—30 October = 303) (wPOFd), and time of day (wPOFt; 0–2330). We visualized wPOFm for each frequency bin (001–507) for all six months of our sample period to highlight the most important frequency bins contributing to the sonoscape at each sample distance and to visualize how sonic activity across the frequency spectrum changed from month to month. We also visualized the patterns of wPOFd and wPOFt, highlighting days and times when >50% of the frequency spectrum was occupied by sonic activity. We expected these results would show how the diversity of sonic activity across the frequency spectrum fluctuated over daily and hourly time intervals. Analyzing SSS through the empirical perspectives wPOFm, wPOFd, and wPOFt allowed us to characterize how the frequency spectrum of the sonoscape behaved over coarse and fine temporal scales in relation to sampled distances.

2.4.4. Normalized Difference Sonic Heterogeneity Index

To further interpret the temporal nature of SSS and wPOF, we evaluated the values of low-frequency SHItf < 2000 Hz (129–1981 Hz) and mid-high-frequency SHItf > 2000 Hz (2003–11,025 Hz) (Gage and Axel (2014)). Although this categorical separation of the frequency spectrum is often applied in soundscape studies to represent technophony (<2000 Hz) and biophony (>2000 Hz) [31,32,36], in subarctic soundscapes, these frequency categories often include information about the sonic contributions and patterns of various geophonies—such as low-frequency (LF) hydrological processes and wind events and mid-high-frequency (MHF) rain events [37]. Consequently, comparing these frequency categories can provide more detailed insights into how the sonoscape reflects the relative contributions and temporal dynamics of geophysical, biological, and anthropogenic processes within subarctic ecosystems, especially when applied with the Normalized Difference Sonic Heterogeneity Index (NDSHI) [38].
The NDSHI is conceptually similar to the Normalized Difference Soundscape Index (NDSI) [31], but instead of using power spectral density (i.e., normalized watts/kHz), it uses SHItf, which has demonstrated greater sensitivity to sonic complexity [22]. Accordingly, NDSHI is calculated using the following formula:
N D S H I = X ¯ S H I t f > 2   k H z X ¯ S H I t f < 2   k H z X ¯ S H I t f > 2   k H z + X ¯ S H I t f < 2   k H z
where X ¯ SHItf>2 kHz and X ¯ SHItf<2 kHz are average values of SHItf across their respective frequency categories (LF < 2000 Hz and MHF > 2000 Hz). The formula produces a value between −1 and 1 that represents the dynamic relationship and sonic contribution of LF and MHF sonic events in the sonoscape where negative values (−1 < 0) indicate a predominance of LF sounds and positive values (0 < 1) indicate a predominance of MHF sounds. Values closer to 0 represent a more even sonic contribution from LF and MHF sonic activity at a specified space in time. We compared the average and 95% CI values of NDSHI for each sample distance between sample years and years combined. We visualized NDSHI over sample days and time of day as a relative index to interpret notable LF and MHF sonic activity that contributed to the wPOF of the SSS at each sample distance.

3. Results

3.1. Annual Spatio-Temporal Patterns of SSS and NDSHI

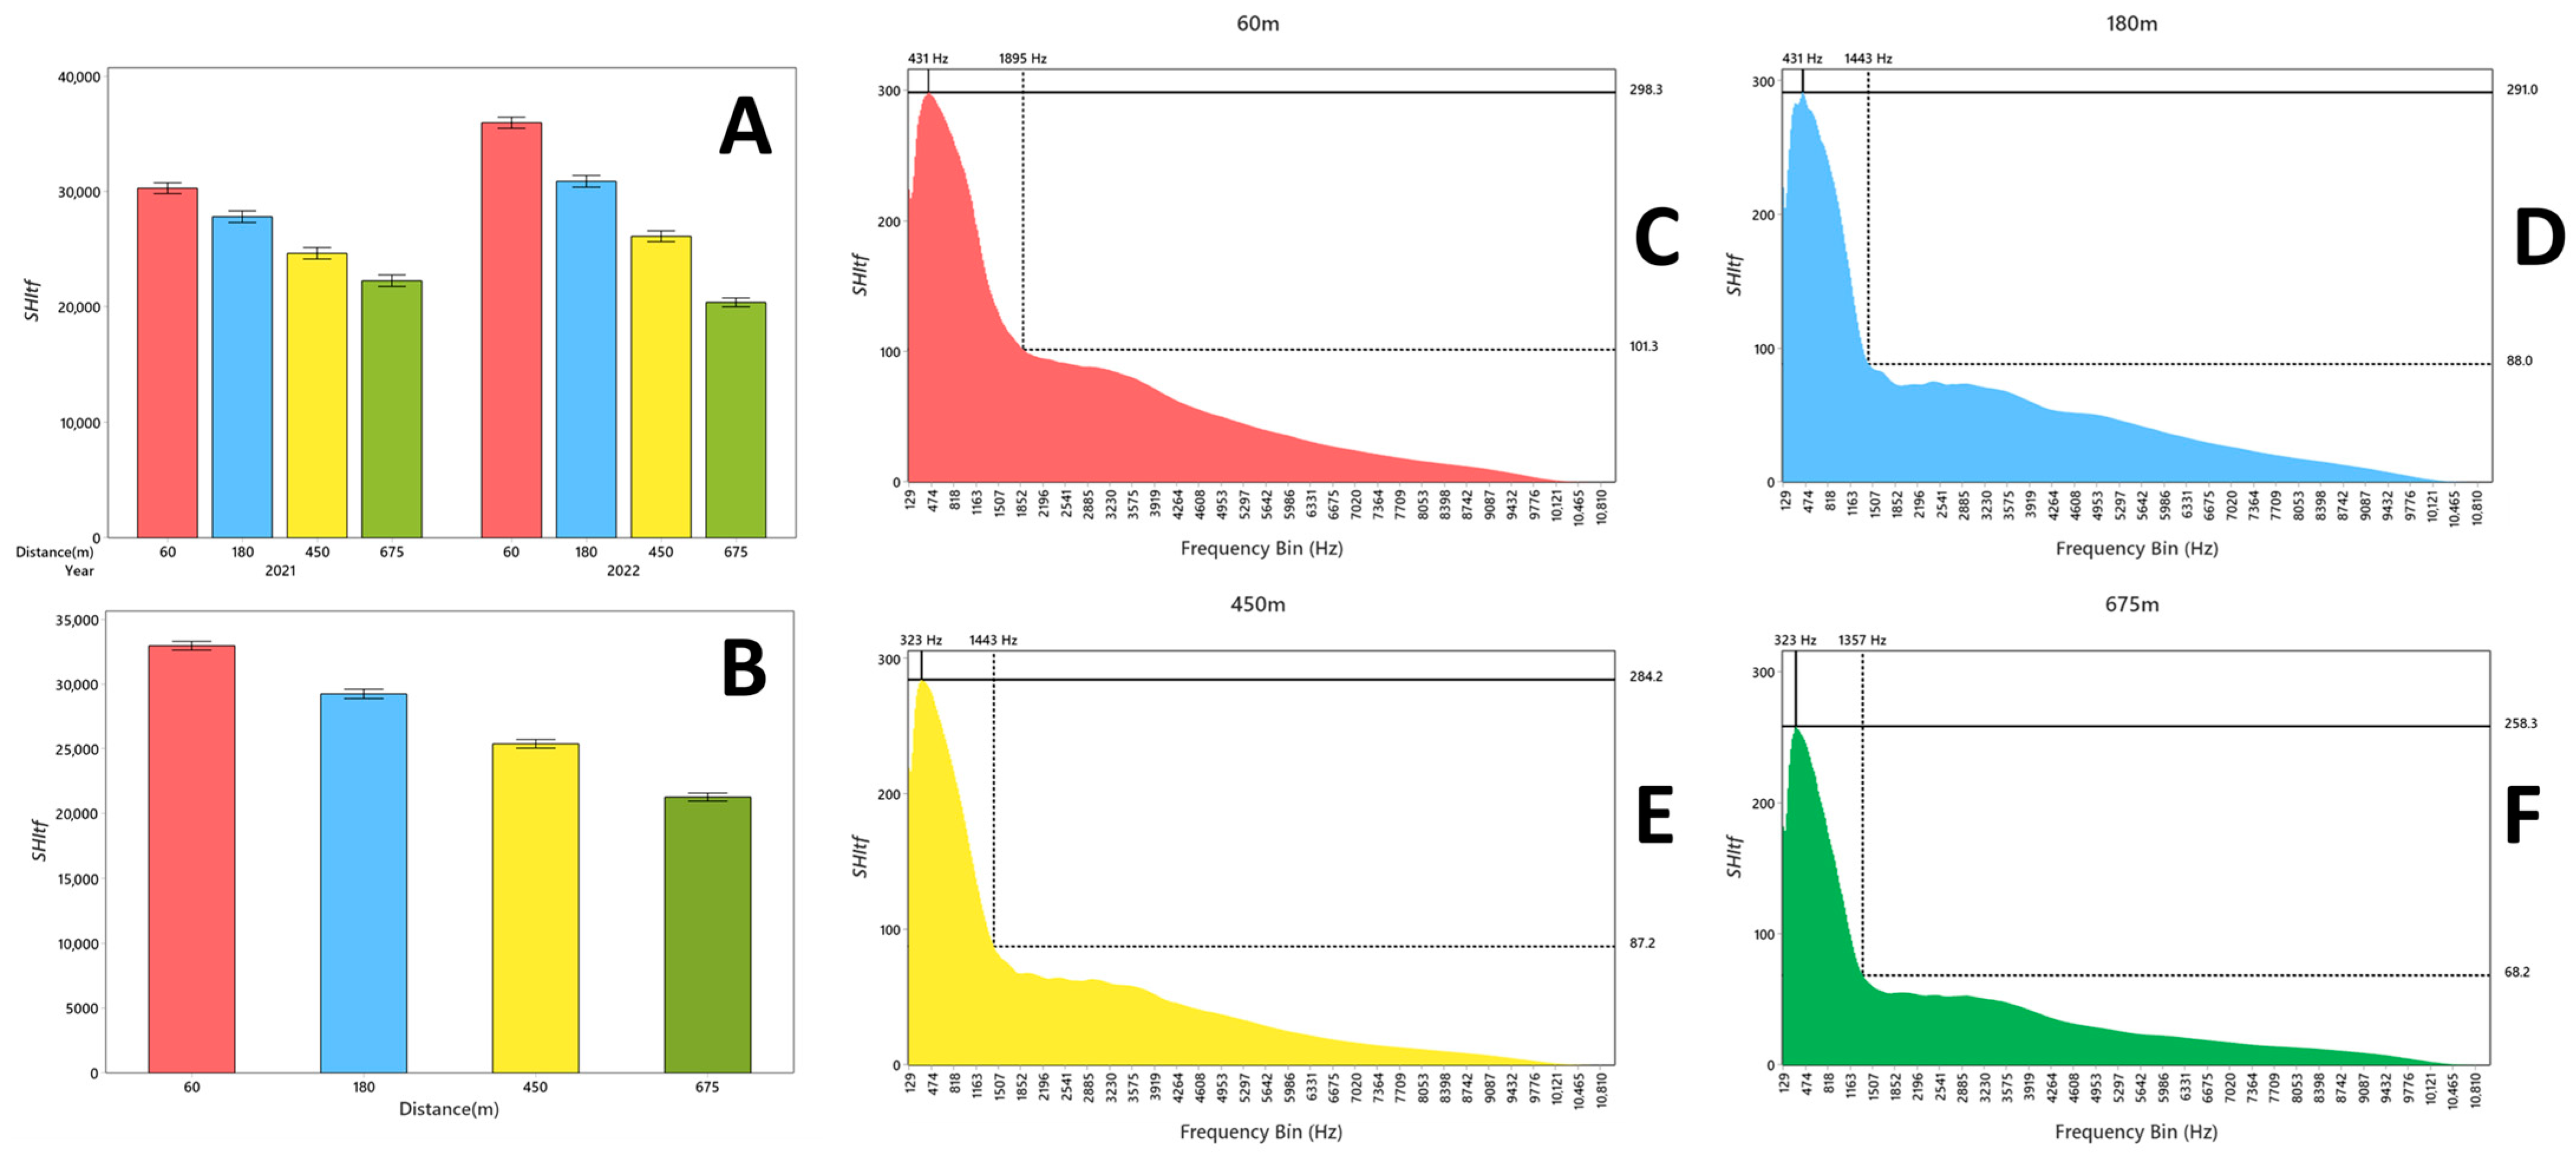
We obtained 60,713 recordings from 2021 and 59,290 from 2022 for a total of 120,003 1 min recordings, across all eight sound recorders. Although no data were lost due to battery failure or full SD card capacity, a small number of recorders were destroyed by bears and were subsequently replaced. These unavoidable events resulted in a 9.2% loss of data from the total 132,096 possible recording events. Average SHItf across all recorders and all sample years was 27,327.3 (SD = 30,193.1). The sonoscape displayed interannual variation with SHItf notably lower in 2021 ( X ¯   = 26,485.9; 95% CI: 26,238.5–26,733.3) than 2022 ( X ¯   = 28,0188.5; 95% CI: 27,953.4–28,423.5). Sonic activity was also differentially expressed spatially, exhibiting successively declining values of SHItf with increasing distance from the road when analyzed between years and years combined (Figure 3A,B).
Sonic activity displayed the highest values of SHItf at LF < 2000 Hz ( X ¯   = 14,919.1; 95% CI: 14,873.2–14,965.0) than MHF > 2000 Hz ( X ¯   = 13,068.4; 95% CI: 12,923.5–13,213.4) when all samples were combined. The distinct prevalence and high values of LF SHItf consistently characterized the sonoscape across all distances (Figure 3C–F). Taking a closer look, we observed that the highest levels of sonic activity among distances when years were combined occurred at 431 Hz at 60 m ( X ¯   = 298.3; 95% CI: 297.5–299.1) and 180 m ( X ¯   = 291.0; 95% CI: 290.2–291.9), and 323 Hz at 450 m ( X ¯   = 284.2; 95% CI: 283.3–285.1) and 675 m ( X ¯   = 258.3; 95% CI: 257.4–259.2). Sonic activity dramatically decreased with increasing frequency for each respective distance creating an inverse “hockey stick” profile (Figure 3C). However, the angle of this decline was variable between sample distances and years creating slight but distinct differences in the shape of their respective SSS (Figure 3C–F).
The precipitous drop in SHItf from its respective peak to the more graduated decrease in sonic activity at higher frequencies began at 1895 Hz at 60 m (SHItf = 101.3; 95% CI: 100.0–102.6) (Figure 3C), 1443 Hz at 180 m (SHItf = 88.0; 95% CI: 86.8–89.3) (Figure 3D) and 450 m (SHItf = 87.2; 95% CI: 85.7–88.6) (Figure 3E), and 1357 Hz at 675 m (SHItf = 68.2; 95% CI: 67.0–69.4) (Figure 3F). Sonic activity was uniformly low for all sample years and distances at frequencies 10,056–11,025 Hz (Figure 3C–F).
The spectral sonic signature (SSS) at sample distances expressed distinctive differences when compared between years and years combined (Table 1). Sample sites at 60 m exhibited the highest SSS values compared to all other distances when compared between years and years combined (Table 1). The SSS of 60 and 675 m displayed opposing values when compared between years with 60 m having a greater SSS value in 2022 than in 2021, while at 675 m, the SSS value was greater in 2021 than in 2022 (Table 1).
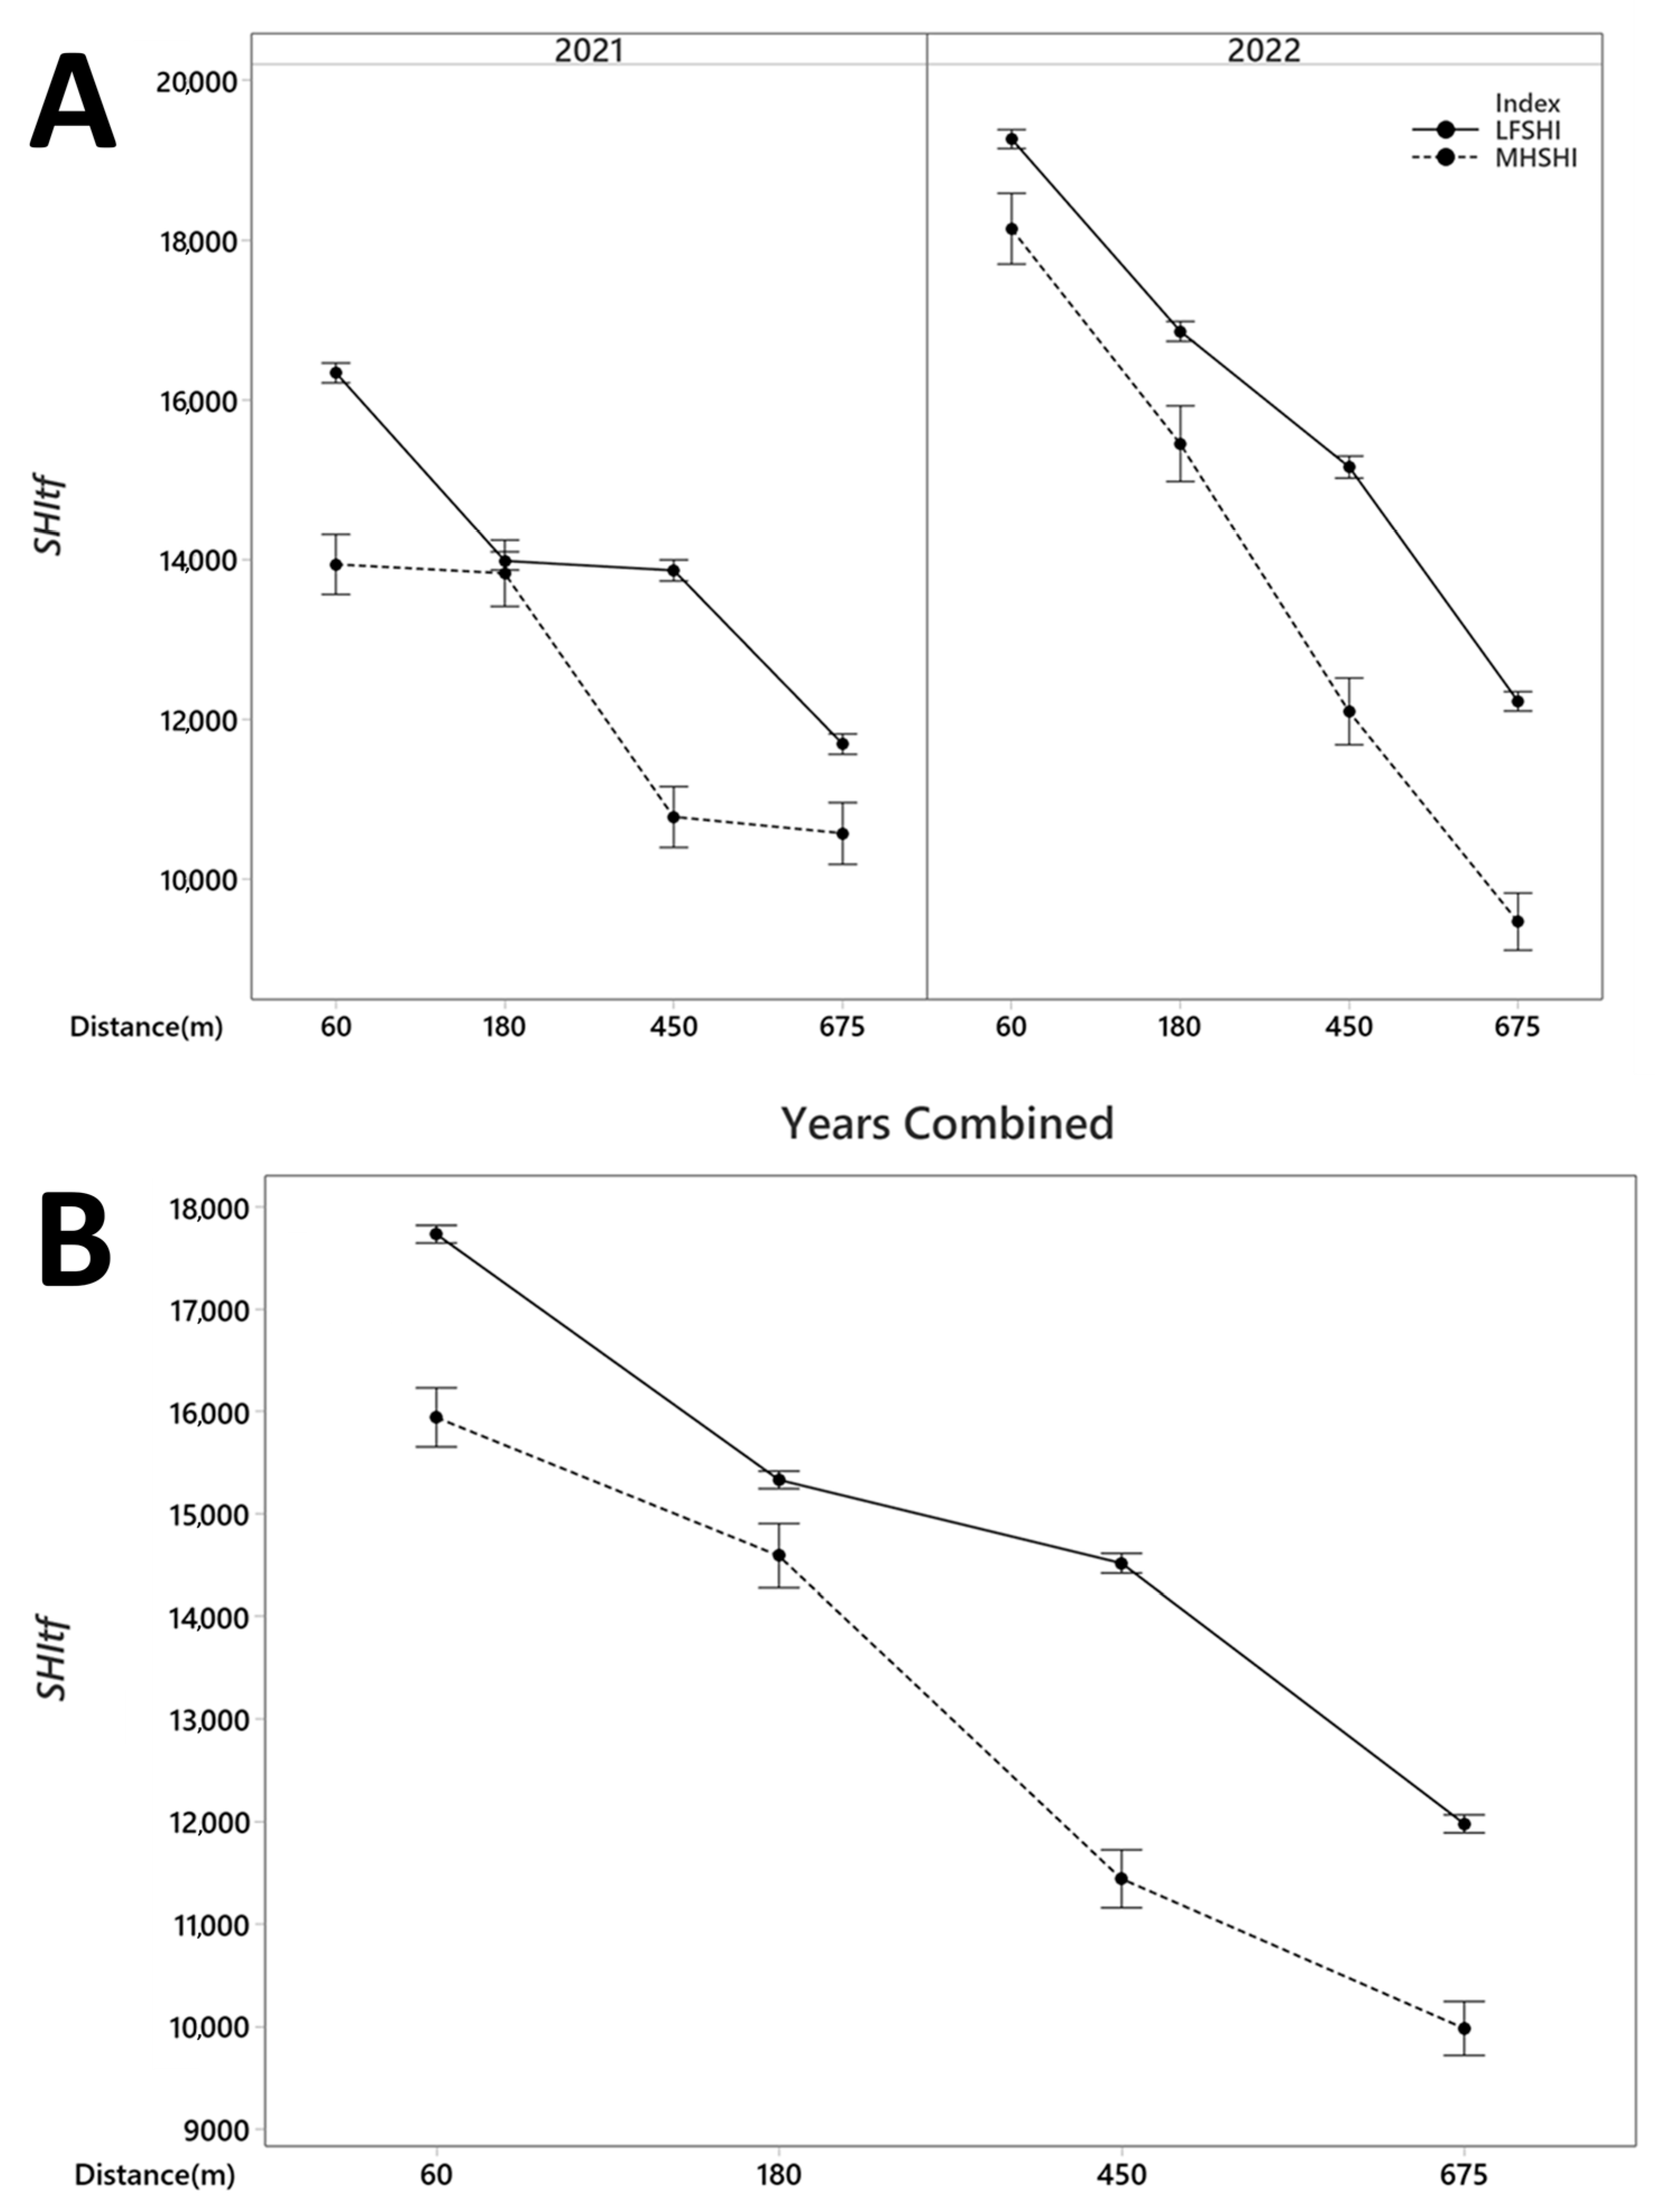
Variation in SSS at sample distances over the sample period was further contextualized by examining the contributions of LF and MHF SHItf. Notable differences in LF and MHF SHItf values emerged across distances when visualized between years and years combined (Figure 4A,B). In both 2021 and years combined, LF indices were consistently greater than MHF indices at most distances (Figure 4A,B). However, in 2021, LF and MHF indices were similar at sites 180 m from the road (Figure 4A). In contrast, in 2022 and years combined, LF and MHF indices gradually declined with increasing distances, indicating a spatial gradient in sonic activity (Figure 4A,B). Interestingly, in 2021, LF indices were relatively consistent between 180 and 450 m distances (Figure 4A), while MHF indices showed stronger similarity between 60 and 180 m and a marked drop in values at 450 and 675 m, where SHItf values were also similar to each other (Figure 4A). Although LF and MHF showed distinct spatial patterns across years, the difference between LF and MHF was most pronounced at 450 m and least pronounced at 180 m, suggesting site-specific interactions between frequency-specific sonic activities (Figure 4B).
Given that SHItf values were remarkably high in the LF range, its contribution to the sonoscape at all distances outweighed that of MHF events between years and years combined. This was evident in the predominantly negative NDSHI values for all sample distances and sample years (Table 2). Furthermore, at this broad scale of analysis, NDSHI indicated clearly that LF sounds contributed more to the sonoscape with increasing distances from the road (Table 2), albeit at lower intensities, as can be observed in Figure 4 when LF and MHF are separated. However, such a coarse summary of sonic activity at the annual temporal scale does not take into account the nuanced patterns of sonic activity by month, day, and time of day.

3.2. Monthly Spatio-Temporal Patterns of wPOFm and NDSHI

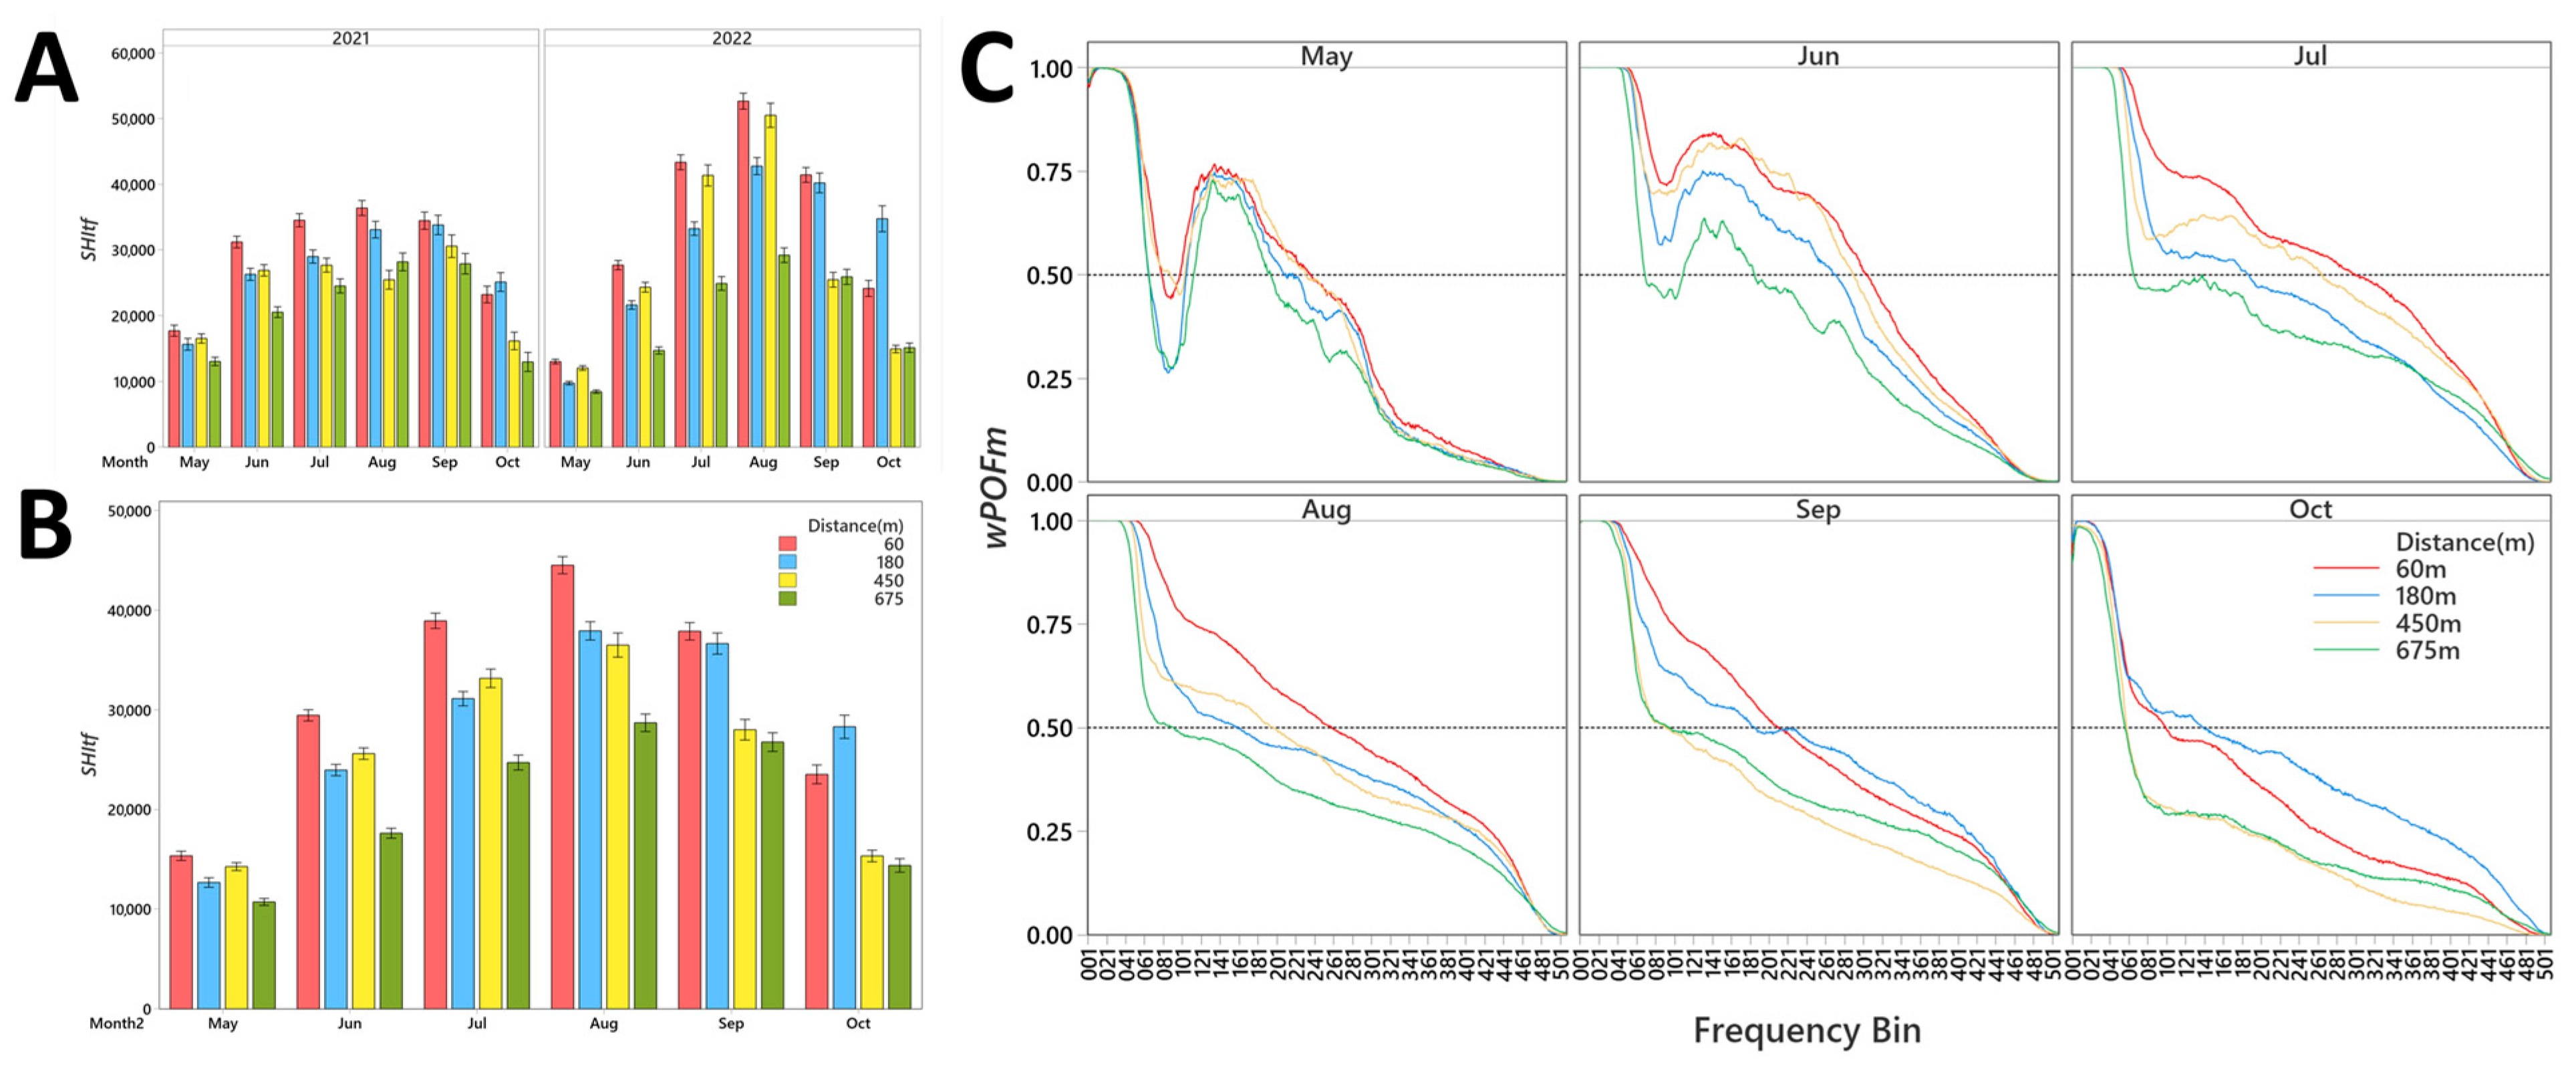
The Exit Glacier sonoscape exhibited dynamic and differential patterns of sonic activity over monthly timeframes. In general, sonic activity displayed an asymptotic pattern with May and October having notably lower values, with a progressive rise in June and July, peaking in August and gradually declining in September for all distances (Figure 5A,B). When years were combined, sonic activity at 60 m from the road was much greater than all other distances across all six months of sampling with the exception of September when SHItf values were more similar between sample sites at 60 and 180 m (Figure 5B). Similarities between sample distances were also noticeable within sample years but were not consistent between years except between 60 and 180 m in the month of September (Figure 5A).
Additional similarities were also notable when sample years were combined. For instance, SHItf indices were comparable between sample sites at 180 and 450 m in August, while indices at 450 and 675 m were similar in September and October (Figure 5B). Indices were all comparably different across all distances in May, June, and July when years were combined (Figure 5B). Sonic indices at all respective distances were generally lower in May at the start of the tourist season than at the end of the season in October (Figure 5A,B).
When interpreting these monthly patterns through the analysis of occupied frequencies, it is evident that the wPOFm differed according to distance from the road and across monthly timeframes when years were combined (Figure 5C). While the pattern of wPOFm at all sample distances differed by month, its patterns within months were relatively similar (Figure 5C). Specifically, the first 50 frequency bins (129–1184 Hz) were clearly occupied across all recording events in all months. It was also apparent how wPOFm exhibited more similar values across all distances in May than any other month (Figure 5C). Interestingly, mid-frequency bins between 110 and 190 (2476–4199 Hz) were distinctively prominent in May and June at all distances compared to subsequent months (Figure 5C). An unusually low wPOFm was evident within frequency bins 071–091 (1637–2037 Hz) during May and June at all distances, that visually created a dramatic dip in wPOFm between LF bins 001–050 (129–1184 Hz) and mid-frequency bins 110–190 (2476–4199 Hz) where occupancy was higher (Figure 5C). This spectral pattern decreased in prominence in July when wPOFm values at mid-frequencies noticeably decreased, becoming only marginally expressed at 450 m.
It is notable to highlight that wPOFm across the frequency spectrum at 60 m was comparatively greater than at all other distances in July and August at the height of the tourist season (Figure 5). Interestingly, patterns of wPOFm at 180 m behaved more similarly to wPOFm at 675 m during May–August and then increased its spectral distribution in September, eventually surpassing the wPOFm of all other distances in October (Figure 5C). The wPOFm at 450 m also fluctuated considerably over months, at times having similar spectral occupancy to 60 m sites from May to June, to 180 m sites in August, and to 675 m sites in September and October (Figure 5C). The wPOFm at 675 m was lower than all other distances across all months but October (Figure 5C). Overall, the wPOFm at sample sites displayed lower values at mid-high frequencies at greater distances from the road (Figure 5C).

3.3. Daily Spatio-Temporal Patterns of wPOFd and NDSHI

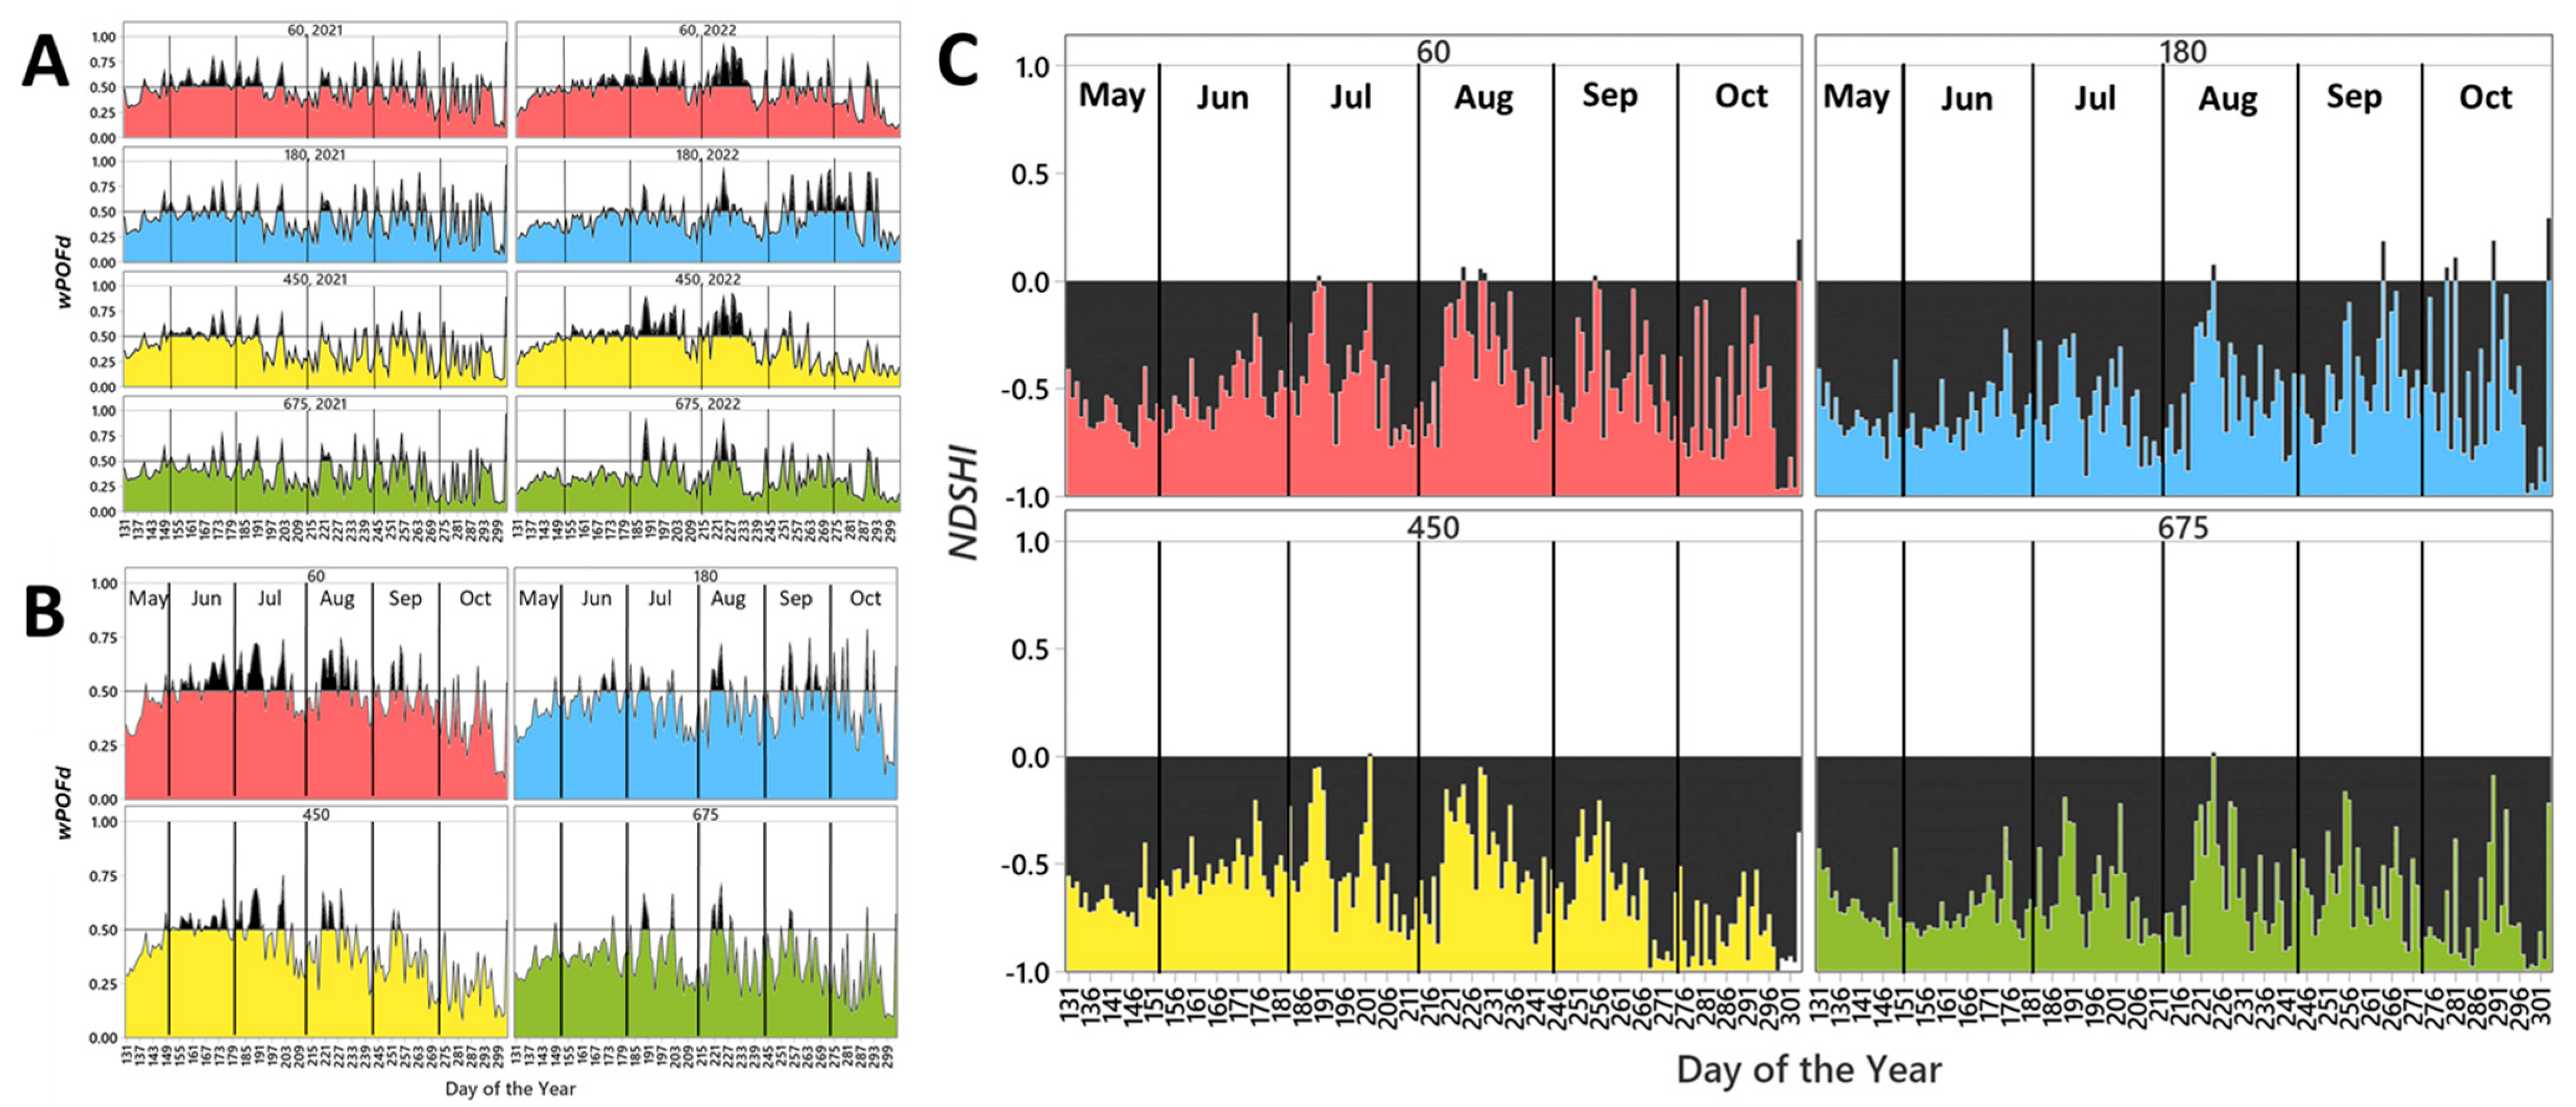
Sonic activity across distances exhibited daily variations (11 May = 131; 30 October = 303) between years (Figure 6A), displaying more distinct patterns when years were combined (Figure 6B). There was a noticeable rise in wPOFd from day 131–140 for all sample distances, between years, and years combined. Sample sites 60 m from the road displayed a greater number of days with wPOFd >50% than all other distances making up 45–46% of all sample days between 2021 and 2022, respectively (Figure 6A) (Table 3). Subsequent sample distances from the road generally displayed a decreasing number of days with wPOFd >50%. Sample sites at 675 m notably expressed the least number of sample days with wPOFd >50% between years (Figure 6A) and years combined (Figure 6B) making up only 16–17% of the sample period between 2021 and 2022, respectively (Figure 6A) (Table 3). Regardless of distance, the shoulder seasons of May, September, and October exhibited the least number of days with wPOFd >50% (Table 3). However, the greatest number of sample days with wPOFd >50% was evident at sample sites at 60 m compared to sample sites over the same time period at farther distances from the road where they were marginally similar to one another (Figure 6A,B) (Table 3).
Sonic contributions to the daily patterns of the sonoscape across sample distances were predominantly LF sounds indicated by negative NDSHI values visualized across the entire sample period. It was evident how prominent LF sonic activity was to the daily sonoscape when only six days expressed NDSHI > 0 at 60 and 180 m and one day at sample sites 450 and 675 m (Figure 6C).

3.4. Hourly Spatio-Temporal Patterns of wPOFt and NDSHI

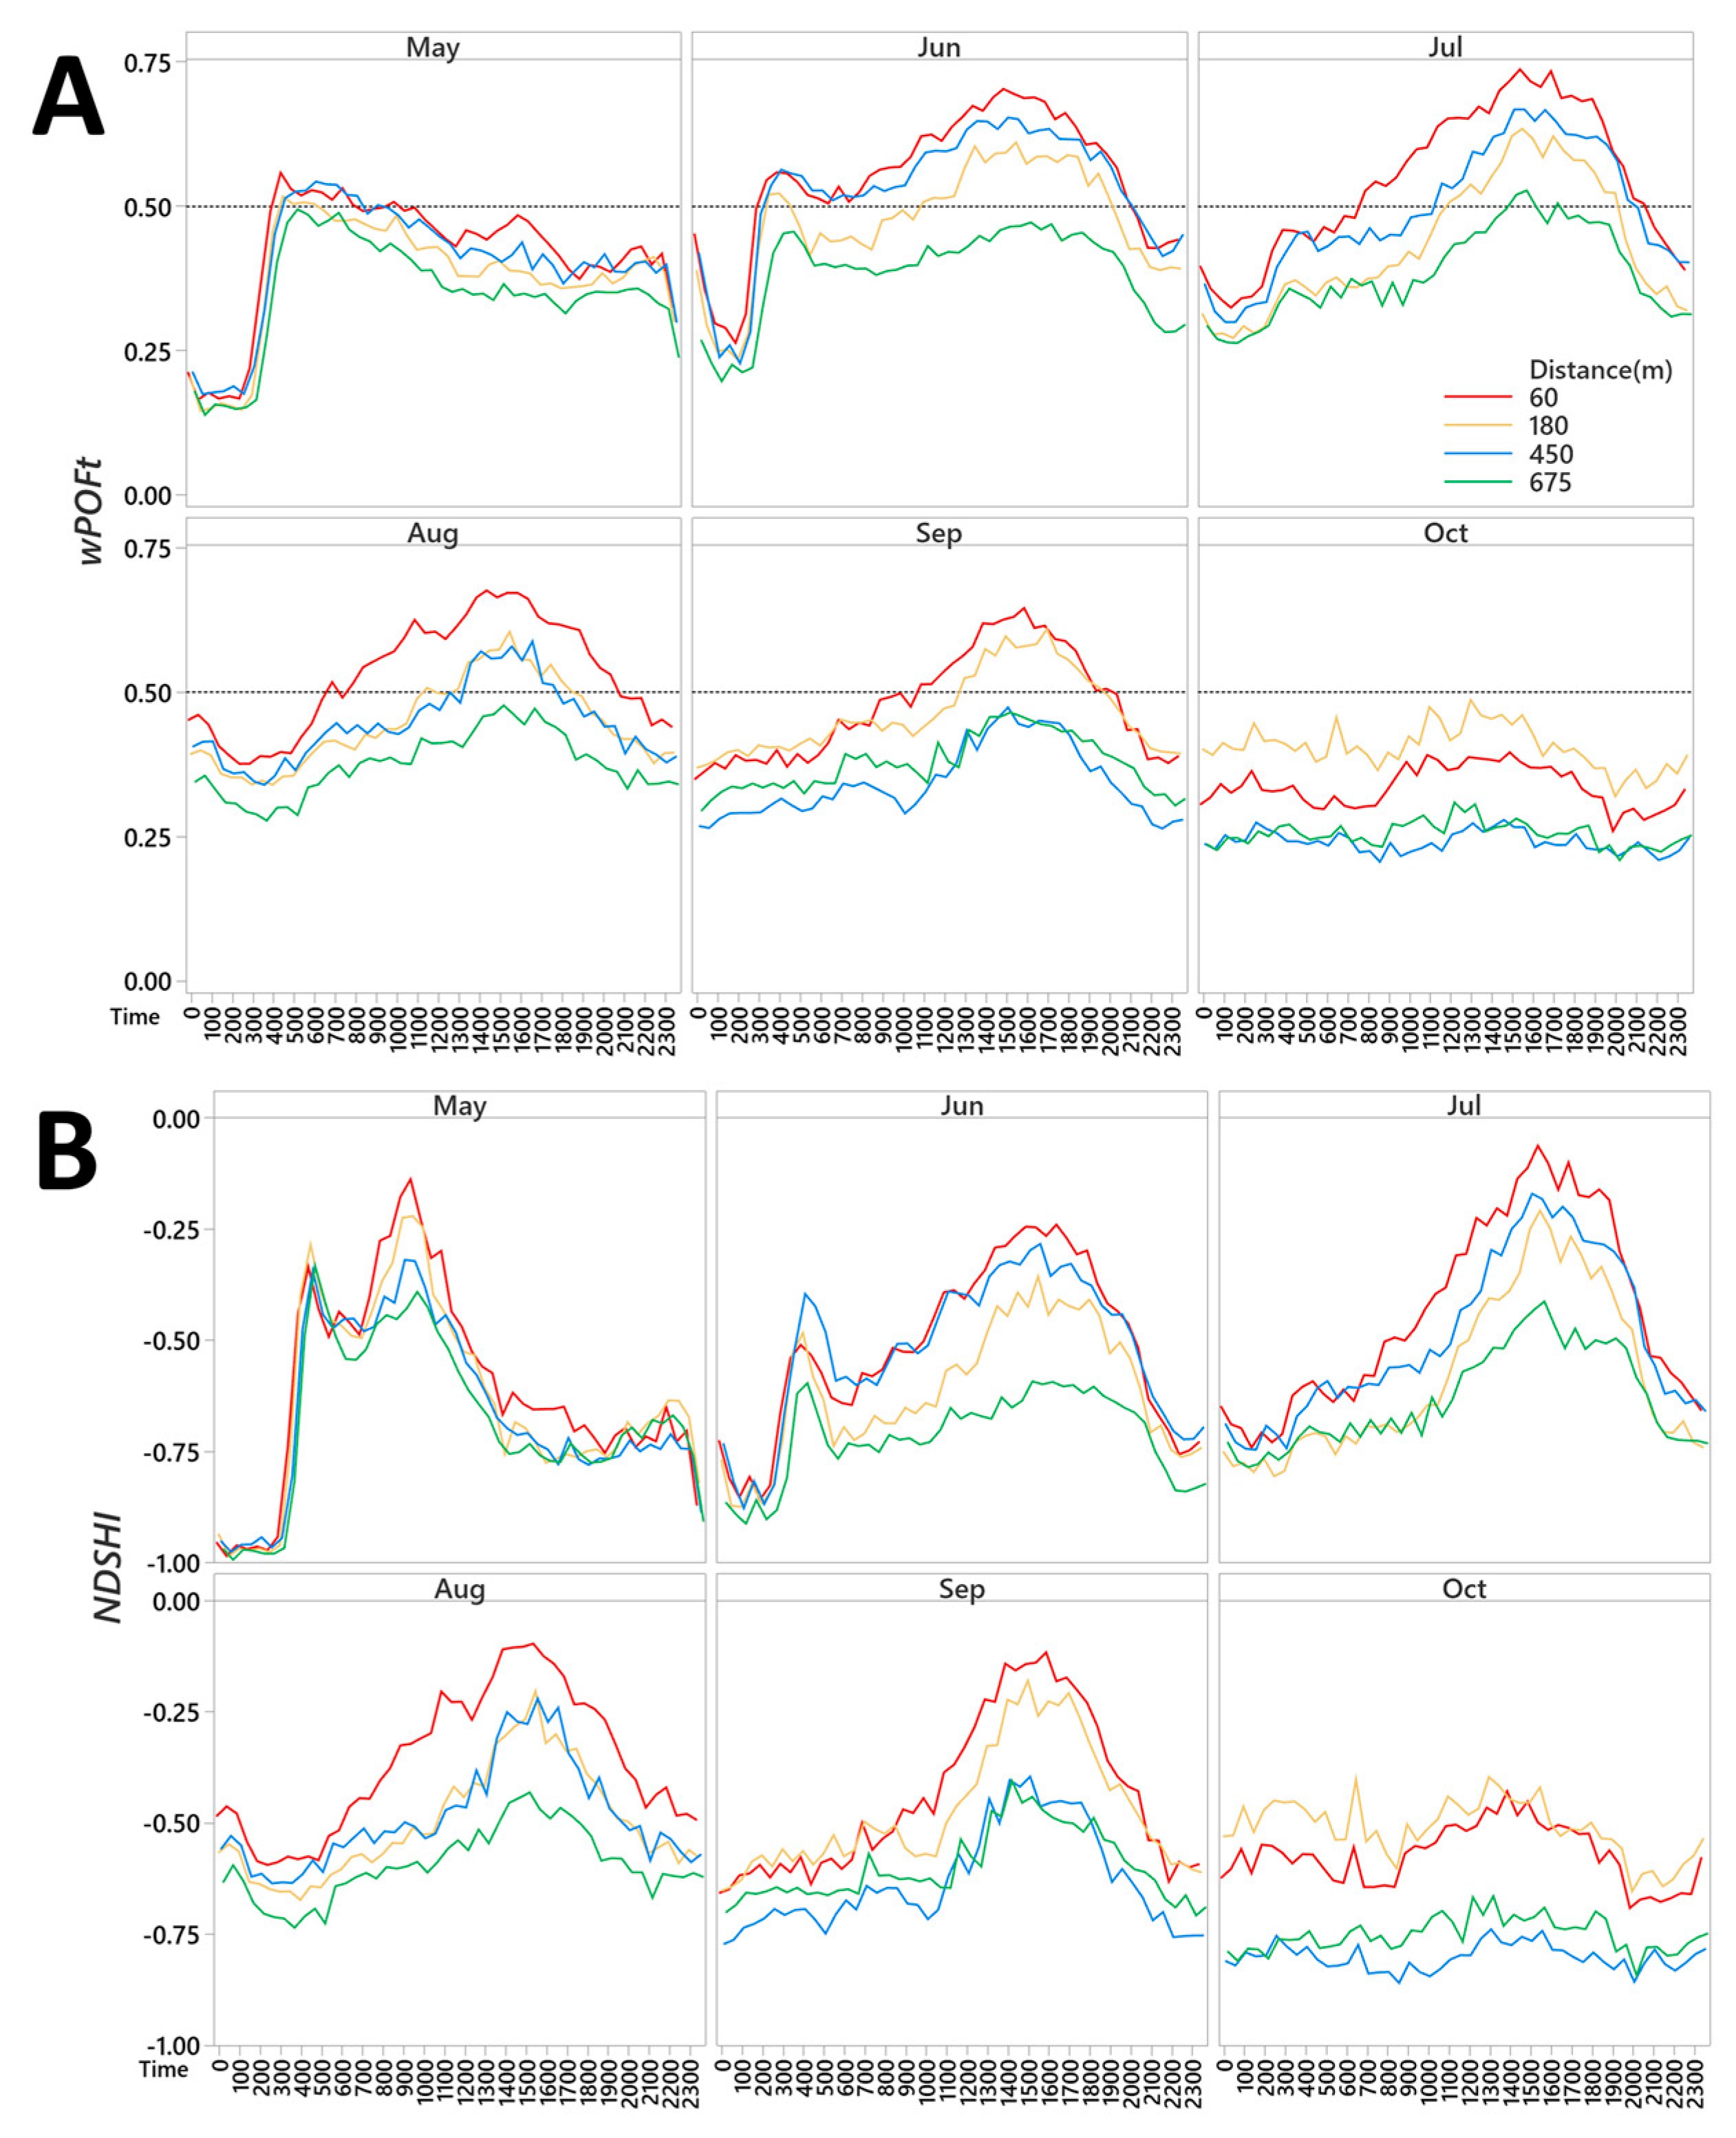
Temporal daily patterns of wPOFt and NDSHI were best visualized when years were combined. Accordingly, we found the sonoscape displayed distinct synchronous patterns at hourly intervals. Despite differences in wPOFt values, the hourly patterns of wPOFt that emerged were generally similar across sample sites when partitioned by month (Figure 7A). The lowest wPOFt was uniquely evident between 0100 and 0300 in May followed by a dramatic rise in wPOFt at 0300–1100 then falling gradually over the course of the day (Figure 7A). Although June expressed a similar pattern of fewer occupied frequencies between 0200 and 0300 and a successive increase in the wPOFt between 0300 and 0500, the wPOFt successively expressed an asymptotic increase between 0600 and 1900, peaking at 1500 (Figure 7A). Subsequently, the early morning peak in wPOFt between 0300 and 0500 decreased in June, followed by a more prominent rise in wPOFt between 0800 and 1900 and successive decrease at 2000. By August and September, early morning peaks in wPOFt were absent but continued to express similar asymptotic patterns during the day that had begun in June. In October, fewer than 50% of frequency bins were occupied over the course of the day, contrasting sharply with previous months (Figure 7A). Interestingly, October also exhibiting notably low wPOFt at 450 and 675 m throughout the day, comparable to those observed in the early mornings of May and June (Figure 7A).
The wPOFt at hourly intervals was consistently greater at 60 m than other sample distances, except in October when wPOFt was greater at 180 m (Figure 7A). Hourly intervals of wPOFt at 450 m were the most inconsistent when compared over monthly timeframes. For instance, in May, June, and July, wPOFt at 450 m was more similar to that at 60 and 180 m, but more similar to 180 m in August and then more similar to 675 m in September and October (Figure 7A). Unlike other sites, samples at 675 m from the road never possessed ≥50% of occupied frequency bins over hourly intervals over the sample period with the exception of 1500 in July (Figure 7A). While ≥50% occupied frequencies were prevalent from June to September, May and October expressed the least wPOFt at hourly intervals across all distances than those between June and September (Figure 7A). Patterns of wPOFt across hourly intervals in context to frequency contributions were further interpretable with NDSHI. As expected, given the predominance of LF sonic activity we observed at coarser time scales, NDSHI remained consistently below zero across all hourly intervals over the sample period (Figure 7B). However, distinct temporal patterns were clearly evident when the NDSHI was visualized across months with years combined (Figure 7B). Despite variations in NDSHI magnitudes, the general patterns across hourly intervals were broadly consistent among distances within months (Figure 6B).
In May, NDSHI values and patterns were more similar across distances than all other months (Figure 7B). During this period, LF activity completely dominated between 0000 and 0300 h, indicating a complete absence of MHF activity (Figure 7B). However, two notable spikes in NDSHI followed at 0400–0500 and 0800–1100 that can only be attributed to an increase in MHF activity. Following these peaks, MHF contributions gradually declined until 2100, where a smaller but distinct rise in NDSHI synonymous with MHF sonic events occurred between 2100 and 2300 before returning to near-complete LF dominance in the early morning hours.
In June, the NDSHI indicated that LF was most dominant between 0100 and 0200, preceded by a slight increase in the NDSHI between 2300 and 0000 (Figure 6B). A pronounced spike in the NDSHI reemerged between 0300 and 0500 with an increase in MHF activity. Subsequently, the NDSHI declined sharply, followed by a gradual increase between 0700 and 1900 where it peaked around 1600 before declining again after 2000 (Figure 7B).
Between June and September, the pronounced early morning MHF spikes observed in May and June had diminished. Instead, an asymptotic pattern in the NDSHI emerged, characterized by relatively lower values in the early morning followed by a gradual rise in MHFs between 0600 and 1900, peaking again around 1600 across all distances (Figure 6B).
By October, NDSHI displayed the least variation across hourly intervals compared to previous months (Figure 6B), consistent with the patterns observed in wPOFt (Figure 7A). Nevertheless, a moderate increase in MHF between 0600 and 1900 was still evident at sampled distances closer to the road, while sample sites farthest from the road maintained notably lower NDSHI values throughout the day, comparable to values only displayed in the late evenings and early mornings of June–August (Figure 7B). A spatial distinction was clearly evident between similar NDSHI values and patterns at 60 and 180 m that were greater than similar NDSHI values and patterns at 450 and 675 m (Figure 7B).

4. Discussion

Our study revealed the complex and dynamic nature of a sonoscape in south-central Alaska within a subarctic forest community in succession, born from the Exit Glacier moraine as a result of a warming climate. Through systematic analyses of ecoacoustic indices, we captured distinct spatial and temporal patterns that provide novel insights into how geophysical, biological, and anthropogenic processes interact in this changing environment.

4.1. Spatial Variation of the Sonoscape

The prominent spatial variation we observed, with decreasing sonic heterogeneity at greater distances from the road, demonstrates how vehicle-based tourism creates a distinct sonic gradient from Exit Glacier Road and the forest edge into the forest interior and surrounding wilderness. These results support an ecoacoustics hypothesis suggesting that a sonic gradient within a sonoscape can exist between one sonic patch (i.e., sonotope) and another, creating a sonic ecotone (i.e., sonotone) analogous to physical ecotones between ecotopes [15]. Evidence that a sonotone exists in the Exit Glacier sonoscape was apparent when visualizing changes in distinct spectral sonic signatures (SSS) between recording sites (i.e., sonotopes) at interval distances from the road (Figure 3 and Table 1). We revealed how the spatial characteristics of these sonotones and sonotopes were dynamic in ways similar to other sonoscapes when observed over seasonal and diel timescales (Figure 4, Figure 5 and Figure 6) [17].
The Exit Glacier sonoscape displayed a distinct “hockey stick” profile for each SSS observed across all sample distances (Figure 3B). This was explained by the predominance and intensity of low-frequency (LF) geophony that is prevalent in sonic environments across the Kenai Peninsula [37]. Although SHItf values varied between distances, we saw peak concentrations of LF sounds occurring at the same frequency bins between sites closer to the road (i.e., 431 Hz at 60 m and 180 m) and similar frequency bins at sites farther from the road (i.e., 323 Hz at 450 m and 675 m) (Figure 3B). We suspect these results indicate a subtle, but likely important, geophonic characteristic specific to the sonic properties of sonotopes near the road compared to more distant and natural wilderness sonotopes.
The spatial and sonic characteristics of sonotopes at sample distances were also evident when SHItf values were compared between LF (<2000 Hz) and mid-high-frequency (MHF, >2000 Hz) categories. When displayed graphically, spatial patterns emerged with distance from the road due to the interplay between LF and MHF sonic activities that varied between sample years (Figure 4A). When years were combined, it was clear how LF and MHF sonic activity played distinct roles in the sonoscape at interval distances from the road (Figure 4B). These results provide insights into how sonotopes were composed and arranged along a dynamic sonic gradient that evidently decreased in intensity with increasing distance (Figure 4).
When ecoacoustic indices by distance were visualized over temporal timeframes, we saw notably higher values of SHItf and wPOF across all distances midsummer, coinciding with peak vehicle-based tourist activity (July and August, 0900–1900) (Figure 5A and Figure 7A). Upon further investigation of spectrograms during these time periods, we found higher index values at 60 and 180 m were indicators of technophony from passing vehicles combined with geophonies (wind and rain), creating high-intensity sounds that spread across the frequency spectrum. These results are consistent with other studies that have observed the propagation of technophony from roads into forested areas up to 350 m [28,29,39,40]. Conversely, at the 450 and 675 m sites, the frequency spectrum was largely saturated with similar but lower intensity geophonies and, occasionally, songbird biophony in the absence of technophony. This likely explains why indices farther from the road were notably lower than those closer to the road.
Our results reflect the ecological relationships between human impacts on natural processes in the sonic domain that exists in proximity to a moderately trafficked road used by tourists, contrasted against the ecological processes of the interior forest community and wilderness settings that unfold in the absence of human mechanized activities that have been observed in other parts of the Kenai Peninsula [41].

4.2. Temporal Dynamics and Sonophenology

The temporal patterns we observed offer compelling evidence of seasonal sonophenology in this subarctic ecosystem. The asymptotic monthly pattern—with low sonic activity in May and October and peak activity from July to August—aligns with the seasonal patterns of biological activities and tourism in the EGDA (Figure 5) [24]. Similar seasonal patterns have been documented in Glacier Bay National Park and Preserve [12], where biophonies express a seemingly punctuated period of activity in the spring just before an increase in tourist activities, then gradually subside with a decrease in human visitors to their near absence in the fall. This short window and the unique temporal interplay of these sound-dependent biological activities may set the stage for increased vulnerability to phenological shifts caused by a changing climate [12,13] and conflicts with technophony as shorter winters and warmer springs create a more accessible and attractive shoulder season for vehicle-based tourism [1].
Our data also revealed more supporting evidence of Exit Glacier’s sonophenology when we looked at the behavior of the frequency spectrum with the wPOFm index. For instance, frequency bins 110–190 (2476–4199 Hz) were uniquely prominent during May and June, equating its presence to the activity spectrum of biophonies (Figure 5C and Figure 7B). However, by July, that distinct range of frequencies was no longer prevalent, and instead, the frequency spectrum began to take on a more progressively declining shape in occupied frequencies, with sites farther from the road exhibiting the least number of occupied frequencies over the course of the season (Figure 5C). By October, frequencies >2000 Hz were at their minimum occupancy (Figure 5C). These patterns are likely attributed to the phenology of geophysical, biological, and anthropogenic activities that are intimately related to astronomical cycles, seasonal climate, human and societal behaviors, and the adaptive strategies of species that have developed in response to these forcing functions [24].
This could be further explained through our daily analyses where the sonoscape exhibited a diversity of daily variation in occupied frequencies over our sample period (Figure 6). Particularly, we found that the wPOFd being distinctively greater on some days than others indicated days when >50% of frequencies bins were occupied. It is interesting to note that days with greater wPOFd were consistent across all sample distances (Figure 6A,B). Upon further analysis of spectrograms on these particular days, similarities in peak wPOFd coincided with MHF geophony from rain combined with the spectral saturation of low-mid-frequency wind geophony at 180, 450, and 675 m. At 60 m, these geophonies combined with vehicle-based technophony. These results give evidence of how ecoacoustic investigations can provide insights into geophysical patterns and processes due to the prominent role geophonies play in the sonoscape [42].
The hourly patterns we analyzed provide the finest temporal resolution of this sonoscape (Figure 7). As we refined our temporal analysis to finer scales, we found that the complexity and processes of this sonoscape, and embedded sonotopes, did not depreciate. Rather, the sonoscape expressed additional complexity and insight into the ecological processes that play out at finer timescales across sample distances. This depth of temporal analysis provides a detailed look into the intricate and dynamic rhythms of the Exit Glacier sonoscape.
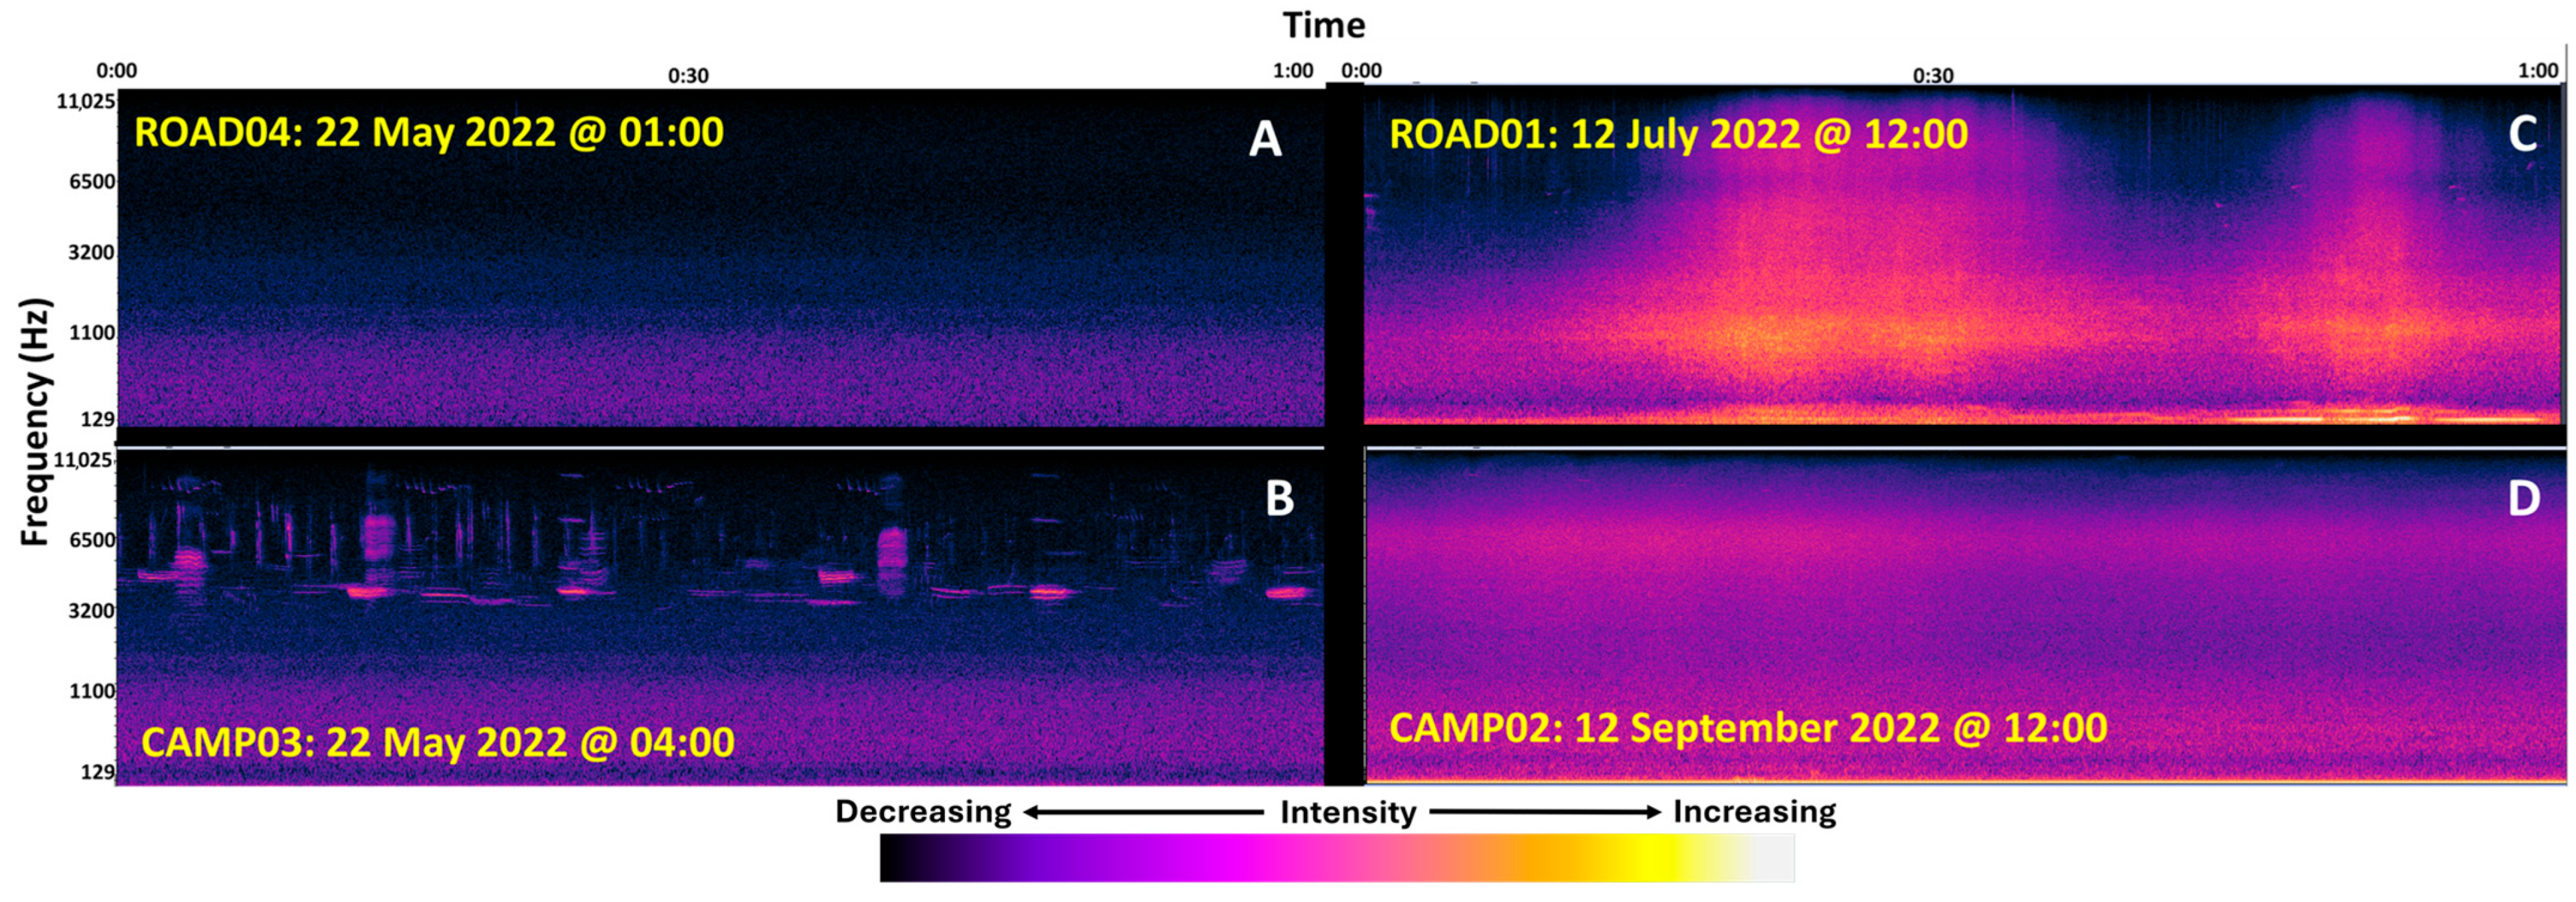
In May, wPOFt and NDSHI appeared to display similar values and patterns over hourly intervals present across all sample distances (Figure 7). However, by June, index values of wPOFt and NDSHI by distance began to diverge while largely keeping their diel patterns throughout the day. Yet, the prominence of sonic activity between 0300 and 0500 in May and June subsequently subsided, while the prevalence of sonic activity shifted to higher index values during midday (Figure 7). Through inspection of spectrograms representative of these time periods, we found that the punctuated period of MHF in the morning hours of May and June were uniquely songbird biophony (Figure 6 and Figure 7B). This reflected the prominence of the dawn chorus and indicated how the behavior of songbirds during May and June at this time of day was uniform across all distances in the sonoscape.
Comparatively, between June and September, the wPOFt at MHF and higher NDSHI values during the day were largely attributed to strong wind and rain events that energetically spread across the frequency spectrum recorded at 180, 450, and 675 m (Figure 8D). However, over the same time frame at 60 m, these geophonies were coupled with a range of spectral saturation caused by the masking effects of vehicle technophony and wind geophony (Figure 8C). Biophonies during these time periods appeared sporadically, interspersed during recording periods when technophony and geophony at MHF were not as intense at MHF. Based on these findings, it is important to note that, in this subarctic ecosystem, the frequency spectrum cannot be accurately interpreted into two categories of LF technophony (<2000 Hz) and MHF biophony (>2000 Hz) commonly applied in other parts of the world [31,32,36]. In the Exit Glacier ecosystem, greater or positive NDSHI values were not reliably attributable to biophonic activity.

4.3. Geophonic Ambience and Silent Acoustic Niches

An often-overlooked aspect of ecoacoustic studies is a quintessential characteristic of sonoscapes inherent to the Kenai Peninsula that emerged from our investigation. The month of May especially, and June to a lesser extent, displayed a distinct period in the early morning between 0100 and 0300, just before the dawn chorus, when the predominance of LF geophony resided over the sonoscape (Figure 8A). In ecoacoustics, this LF, low-energy phenomenon is referred to as “geophonic ambience” [42]. We found in October that the geophonic ambience was more uniformly distributed throughout the day, especially at distances farther from the road (Figure 7B). This notable decline in sonic activity in the fall is indicative of the evanescence of the spring and summer sonophases that gradually lead to prolonged periods of geophonic ambience over winter months [37]. These findings present preliminary support for the subarctic sonophenology hypothesis [24].
Unfortunately, geophonic ambience has not yet gained much scientific interest. However, the conservation of “natural quiet “—the combination of geophonic ambience and subtle biophonies in the absence of technophony—has come to be a critical priority in land management and human experiences in U.S. national parks [43,44]. Alaska’s wilderness settings, in particular, embody this unique sonic characteristic and are considered to serve as natural quiet refugia where ecological processes and human visitors can carry out their activities in the absence of the mechanized noise created from a modern developed society [41].
From an ecological perspective, geophony has formed the fundamental sonic backdrop for the evolution of biophonies and anthropophonies throughout the Earth’s history. Consequently, geophony serves as an ecological constant in natural selection to the structure of acoustic niches and the evolution of communication, orientation, and habitat selection [42]. Periods of time when biophonies and technophonies are absent, and the sonic intensity of geophonies subsides, the geophonic ambience presents the innate vibration of the Earth (visualized in Figure 6B and Figure 7A). At these quiet moments, the sonic indicators of resource availability, threats, and organismal activities enter into a state of rest. Evidence suggests that quiet time reduces stress and serves as a vital time period for rest and rejuvenation [45,46]. Conversely, any sonic event that occurs during this time is punctuated against the geophonic ambience, becoming a significant disruption that likely poses as an important event that deserves one’s attention. This effect is one of the primary reasons why the sonic conflict with technophony and noise in nature preserves exists [41].
The prevalence of geophonic ambience in our study area has additional implications to the sonoscape. In particular, during these quiet periods, the MHF bins that can and are often occupied during the day between May and September were void of sonic activity within the sensitivity of our Wildlife Acoustics SM4 sound recorders and microphones (Figure 8A). While the role these “silent acoustic niches” play within this ecosystem is not self-evident, the fact that they exist without the effects of species extinction or habitat destruction suggests that these temporary vacancies are an intrinsic property of this system’s sonoscape and every bit as important as the natural sounds of geophony and biophony.

4.4. Climate Change Implications

Our findings establish critical baselines for understanding how climate change may alter the sonoscape of this subarctic ecosystem. The distinctive sonophenological patterns we observed are likely to shift as warming temperatures alter the timing of biological events and extend the tourist season [1,7]. The projected contraction of winter conditions from five months to two months by 2060 (https://uaf-snap.org) accessed on 15 October 2024 will inevitably transform the sonic signatures we have documented, profoundly affecting the intrinsic qualities of the geophonic ambience and other natural processes, like those dependent on the dawn chorus. Our methods and results provide a detailed baseline to test these hypotheses in the future.
The ecoacoustic approach we employed provides useful insights into the spatial and temporal patterns of the Exit Glacier sonoscape and offers particular value for monitoring climate-driven changes in this and similar subarctic systems. We submit that Exit Glacier’s accessibility and comparable reference to other glacially influenced subarctic systems provides an excellent living laboratory to study how climate change is holistically affecting glacier retreat, plant and animal phenology, community succession, hydrological processes, and tourism. Baseline studies like the one we have presented provide an important foundation to the future. We encourage the accumulation of ecoacoustic baselines throughout Alaska and other fragile ecosystems in the subarctic.

5. Conclusions

Our study establishes an important ecoacoustic baseline for the Exit Glacier area during a period of unprecedented environmental change. The distinctive spatial and temporal patterns we documented reflect the complex interplay of natural processes and human activities that shape this subarctic landscape. Yet, we understand there are additional sonic variables that may also be useful. In particular, we acknowledge the efforts Kenai Fjords National Park has made to establish the baseline acoustic conditions of the Exit Glacier area in the summer and winter months between 2008 and 2009 using sound pressure levels, exceedance events, and the percentage of time various biophonies, geophonies, and technophonies are audible to human listeners [30]. While the results of these efforts were not applicable to the focus of our work, they did provide confirmation that our dBA estimates for establishing sample distances were comparable. Given the expertise and advanced skillsets of bioacousticians in Alaska’s national park region, acquiring sound pressure level readings in the EGDA that coincide spatially and temporally with our study design would be exceptionally useful for extending the baseline knowledge of Exit Glacier’s sonoscape.
Here, we provide evidence of how our ecoacoustic approach demonstrates the value of the sonoscape as an integrative measure of ecosystem condition that captures both natural dynamics and human influences. By continuing to monitor how these sonic patterns shift in response to warming temperatures, changing visitor patterns, and ecological transformations, scientists and resource managers alike can gain valuable insights into the health and resilience of these treasured landscapes. As climate change continues to transform Alaska’s national parks and other protected areas in the subarctic, these baseline data will provide useful reference points for understanding ecological responses and informing adaptive management strategies for desired conditions.

Author Contributions

Conceptualization, T.C.M.; methodology, T.C.M. and A.F.; software, A.F.; validation, T.C.M. and A.F.; formal analysis, T.C.M. and A.F.; investigation, T.C.M.; resources, T.C.M. and A.F.; data curation, T.C.M.; writing—original draft preparation, T.C.M.; writing—review and editing, T.C.M. and A.F.; visualization, T.C.M.; supervision, T.C.M.; project administration, T.C.M.; funding acquisition, T.C.M. All authors have read and agreed to the published version of the manuscript.

Funding

This research was internally funded by Kenai Fjords National Park base operational funds as part of T.C.M.’s responsibilities as the staff Ecologist.

Institutional Review Board Statement

Not applicable.

Data Availability Statement

Data derived for this study’s analyses and presentation are available upon request via email to the lead and corresponding author T.C.M. at tcmullet76@gmail.com.

Acknowledgments

We acknowledge and appreciate the support of B. Pister and J. Carrol for believing in the value of KEFJ’s sonoscape and allocating park funds to support our work. We give a very special thank you to our incredible seasonal biotechs, M. Petschauer who assisted in 2020 and S. Kirlin-Wilhelm who assisted in 2021–2022, and the great company and assistance from KEFJ’s law enforcement, Ranger A. Dermish. We appreciate the support from C. Kriedeman (KEFJ retired) and D.H. Betchkal (Natural Sounds and Nightskies Program, Denali NPP) as part of our small community of sonic ecologists in Alaska. The findings and conclusions in this article are those of the authors and do not necessarily represent the views of any government agencies. Any use of trade, product, or firm names is for descriptive purposes only and does not imply endorsement by the U.S. government.

Conflicts of Interest

The authors declare no conflict of interest.

References

  1. Hayward, G.D.; Colt, S.; McTeague, M.L.; Hollingsworth, T.N. Climate Change Vulnerability Assessment for the Chugach National Forest and the Kenai Peninsula; Gen. Tech. Rep. PNW-GTR-950; USDA Forest Service, Pacific Northwest Research Station: Portland, OR, USA, 2017. [Google Scholar]
  2. Shulski, M.; Wendler, G. The Climate of Alaska; University of Alaska Press: Fairbanks, AK, USA, 2007; p. 208. [Google Scholar]
  3. VanLooy, J.; Forster, R.; Ford, A. Accelerating thinning of Kenai Peninsula glaciers, Alaska. Geophys. Res. Lett. 2006, 33. [Google Scholar] [CrossRef]
  4. Yang, R.; Hock, R.; Kang, S.; Shangguan, D.; Guo, W. Glacier mass and area changes on the Kenai Peninsula, Alaska, 1986–2016. J. Glaciol. 2020, 66, 603–617. [Google Scholar] [CrossRef]
  5. Yang, R.; Hock, R.; Kang, S.; Guo, W.; Shangguan, D.; Jiang, Z.; Zhang, Q. Glacier surface speed variations on the Kenai Peninsula, Alaska, 2014–2019. J. Geophys. Res. Earth Surf. 2022, 127, e2022JF006599. [Google Scholar] [CrossRef]
  6. Black, T.; Kurtz, D. Maritime glacier retreat and terminus area change in Kenai Fjords National Park, Alaska, between 1984 and 2021. J. Glaciol. 2023, 69, 251–265. [Google Scholar] [CrossRef]
  7. Yu, G.; Schwartz, Z.; Walsh, J.E. Effects of climate change on the seasonality of weather for tourism in Alaska. Arctic 2009, 62, 443–457. [Google Scholar] [CrossRef]
  8. Lenzen, M.; Sun, Y.Y.; Faturay, F.; Ting, Y.P.; Geschke, A.; Malik, A. The carbon footprint of global tourism. Nat. Clim. Chang. 2018, 8, 522–528. [Google Scholar] [CrossRef]
  9. Stone, R.S.; Dutton, E.G.; Harris, J.M.; Longenecker, D. Earlier spring snowmelt in northern Alaska as an indicator of climate change. J. Geophys. Res. Atmos. 2002, 107, ACL-10. [Google Scholar] [CrossRef]
  10. Adam, J.C.; Hamlet, A.F.; Lettenmaier, D.P. Implications of global climate change for snowmelt hydrology in the twenty-first century. Hydrol. Process. 2009, 23, 962–972. [Google Scholar] [CrossRef]
  11. Wipf, S.; Stoeckli, V.; Bebi, P. Winter climate change in alpine tundra: Plant responses to changes in snow depth and snowmelt timing. Clim. Change 2009, 94, 105–121. [Google Scholar] [CrossRef]
  12. Buxton, R.T.; Brown, E.; Sharman, L.; Gabriele, C.M.; McKenna, M.F. Using bioacoustics to examine shifts in songbird phenology. Ecol. Evol. 2016, 6, 4697–4710. [Google Scholar] [CrossRef]
  13. Oliver, R.Y.; Ellis, D.P.; Chmura, H.E.; Krause, J.S.; Pérez, J.H.; Sweet, S.K.; Gough, L.; Wingfield, J.C.; Boelman, N.T. Eavesdropping on the Arctic: Automated bioacoustics reveal dynamics in songbird breeding phenology. Sci. Adv. 2018, 4, eaaq1084. [Google Scholar] [CrossRef] [PubMed]
  14. Jorgensen, S.E. Introduction to Systems Ecology; CRC Press: Boca Raton, FL, USA, 2016. [Google Scholar]
  15. Farina, A.; Li, P. An introduction to ecoacoustics. In Methods in Ecoacoustics: The Acoustic Complexity Indices; Springer International Publishing: Cham, Switzerland, 2022; pp. 1–29. [Google Scholar]
  16. Sueur, J.; Farina, A. Ecoacoustics: The ecological investigation and interpretation of environmental sound. Biosemiotics 2015, 8, 493–502. [Google Scholar] [CrossRef]
  17. Farina, A.; Mullet, T.C.; Bazarbayeva, T.A.; Tazhibayeva, T.; Polyakova, S.; Li, P. Sonotopes reveal dynamic spatio-temporal patterns in a rural landscape of Northern Italy. Front. Ecol. Evol. 2023, 11, 1205272. [Google Scholar] [CrossRef]
  18. Gonzalez, P.; Wang, F.; Notaro, M.; Vimont, D.J.; Williams, J.W. Disproportionate magnitude of climate change in United States national parks. Environ. Res. Lett. 2018, 13, 104001. [Google Scholar] [CrossRef]
  19. Thompson, L.M.; Lynch, A.J.; Beever, E.A.; Engman, A.C.; Falke, J.A.; Jackson, S.T.; Krabbenhoft, T.J.; Lawrence, D.J.; Limpinsel, D.; Magill, R.T.; et al. Responding to ecosystem transformation: Resist, accept, or direct? Fisheries 2021, 46, 8–21. [Google Scholar] [CrossRef]
  20. Stinchcomb, T.R.; Brinkman, T.J.; Betchkal, D. Extensive aircraft activity impacts subsistence areas: Acoustic evidence from Arctic Alaska. Environ. Res. Lett. 2020, 15, 115005. [Google Scholar] [CrossRef]
  21. Haver, S.M.; Gustafson, K.B.; Gabriele, C.M. Rapid assessment of vessel noise events and quiet periods in Glacier Bay National Park and Preserve using a convolutional neural net. Environ. Data Sci. 2023, 2, e14. [Google Scholar] [CrossRef]
  22. Xie, J.; Hu, K.; Zhu, M.; Guo, Y. Data-driven analysis of global research trends in bioacoustics and ecoacoustics from 1991 to 2018. Ecol. Inform. 2020, 57, 101068. [Google Scholar] [CrossRef]
  23. Farina, A.; Li, P. Methods in Ecoacoustics; Springer International Publishing: Cham, Switzerland, 2021. [Google Scholar]
  24. Mullet, T.C.; Farina, A.; Morton, J.M.; Wilhelm, S.R. Seasonal sonic patterns reveal phenological phases (sonophases) associated with climate change in subarctic Alaska. Front. Ecol. Evol. 2024, 12, 1345558. [Google Scholar] [CrossRef]
  25. National Park Service. Frontcountry Management Plan and Environmental Assessment. Kenai Fjords National Park. Available online: https://npshistory.com/publications/kefj/fmp-ea-2024.pdf (accessed on 15 October 2024).
  26. Federal Highway Administration. Noise Measurement Handbook; Final Report; U.S. Department of Transportation: Washington, DC, USA, 2018; p. 205. [Google Scholar]
  27. Davis, M.J.M.; Tenpierik, M.J.; Ramírez, F.R.; Perez, M.E. More than just a Green Facade: The sound absorption properties of a vertical garden with and without plants. Build. Environ. 2017, 116, 64–72. [Google Scholar] [CrossRef]
  28. Pocock, Z.; Lawrence, R.E. How Far into a Forest Does the Effect of a Road Extend? Defining Road Edge Effect in Eucalypt Forests of South-Eastern Australia. 2005. Available online: https://escholarship.org/uc/item/4q576877 (accessed on 15 October 2024).
  29. Munro, J.; Williamson, I.; Fuller, S. Traffic noise impacts on urban forest soundscapes in south-eastern Australia. Austral Ecol. 2018, 43, 180–190. [Google Scholar] [CrossRef]
  30. National Park Service. Kenai Fjords National Park: Acoustic Monitoring Report 2008–2009; Natural Resource Technical Report NPS/NRSS/NRTR-2013/798; U.S. Department of the Interior, National Park Service: Washington, DC, USA, 2013; p. 50. [Google Scholar]
  31. Gage, S.H.; Axel, A.C. Visualization of temporal change in soundscape power of a Michigan lake habitat over a 4-year period. Ecol. Inform. 2014, 21, 100–109. [Google Scholar] [CrossRef]
  32. Fuller, S.; Axel, A.C.; Tucker, D.; Gage, S.H. Connecting soundscape to landscape: Which acoustic index best describes landscape configuration? Ecol. Indic. 2015, 58, 207–215. [Google Scholar] [CrossRef]
  33. Lellouch, L.; Pavoine, S.; Jiguet, F.; Glotin, H.; Sueur, J. Monitoring temporal change of bird communities with dissimilarity acoustic indices. Methods Ecol. Evol. 2014, 5, 495–505. [Google Scholar] [CrossRef]
  34. Farina, A. The acoustic complexity index (ACI): Theoretical foundations, applied perspectives and semantics. Oikos 2025, 2025, e10760. [Google Scholar] [CrossRef]
  35. Blondel, P.; Dell, B.; Suriyaprakasam, C. Acoustic signatures of shipping, weather and marine life: Comparison of NE Pacific and Arctic Soundscapes. In Proceedings of the Meetings on Acoustics, Online, 5–9 October 2020; AIP Publishing: Melville, NY, USA, 2020; Volume 40. [Google Scholar]
  36. Sangermano, F. Acoustic diversity of forested landscapes: Relationships to habitat structure and anthropogenic pressure. Landsc. Urban Plan. 2022, 226, 104508. [Google Scholar] [CrossRef]
  37. Mullet, T.C.; Gage, S.H.; Morton, J.M.; Huettmann, F. Temporal and spatial variation of a winter soundscape in south-central Alaska. Landsc. Ecol. 2016, 31, 1117–1137. [Google Scholar] [CrossRef]
  38. Kasten, E.P.; Gage, S.H.; Fox, J.; Joo, W. The remote environmental assessment laboratory’s acoustic library: An archive for studying soundscape ecology. Ecol. Inform. 2012, 12, 50–67. [Google Scholar] [CrossRef]
  39. Morton, E.S. Ecological sources of selection on avian sounds. Am. Nat. 1975, 109, 17–34. [Google Scholar] [CrossRef]
  40. Terraube, J.; Archaux, F.; Deconchat, M.; Van Halder, I.; Jactel, H.; Barbaro, L. Forest edges have high conservation value for bird communities in mosaic landscapes. Ecol. Evol. 2016, 6, 5178–5189. [Google Scholar] [CrossRef] [PubMed]
  41. Mullet, T.C.; Morton, J.M.; Gage, S.H.; Huettmann, F. Acoustic footprint of snowmobile noise and natural quiet refugia in an Alaskan wilderness. Nat. Areas J. 2017, 37, 332–349. [Google Scholar] [CrossRef]
  42. Farina, A.; Mullet, T.C.; Bazarbayeva, T.A.; Tazhibayeva, T.; Bulatova, D.; Li, P. Perspectives on the ecological role of geophysical sounds. Front. Ecol. Evol. 2021, 9, 748398. [Google Scholar] [CrossRef]
  43. Mace, B.L.; Bell, P.A.; Loomis, R.J. Visibility and natural quiet in national parks and wilderness areas: Psychological considerations. Environ. Behav. 2004, 36, 5–31. [Google Scholar] [CrossRef]
  44. Manning, R.; Valliere, W.; Hallo, J.; Newman, P.; Pilcher, E.; Savidge, M.; Dugan, D. From landscapes to soundscapes: Understanding and managing natural quiet in the national parks. In Proceedings of the 2006 Northeastern Recreation Research Symposium, Bolton Landing, NY, USA, 9–11 April 2006; Burns, R., Robinson, K., Eds.; Comps.; Gen. Tech. Rep. NRS-P-14. U.S. Department of Agriculture, Forest Service, Northern Research Station: Newtown Square, PA, USA, 2007; Volume 14, pp. 601–606. [Google Scholar]
  45. Harvey, J. (Ed.) The Quiet Mind: Techniques for Transforming Stress; Himalayan Institute Press: Honesdale, PA, USA, 1988. [Google Scholar]
  46. Riemer, H.C.; Mates, J.; Ryan, L.; Schleder, B.J. Decreased stress levels in nurses: A benefit of quiet time. Am. J. Crit. Care 2015, 24, 396–402. [Google Scholar] [CrossRef]
Figure 1. Exit Glacier moraine in Kenai Fjords National Park, Alaska, featuring Exit Glacier Developed Area (white polygon), natural and human development features, and sound recording sites positioned at 60 m (ROAD01, CAMP01), 180 m (ROAD02, CAMP02), 450 m (ROAD03, CAMP03), and 675 m (ROAD04, CAMP04) north of Exit Glacier Road.
Diversity 17 00443 g001
Figure 2. Photographic comparison of Kenai Fjords National Park’s iconic Exit Glacier on 6 June 2018, 11 June 2022, and 1 June 2023 clearly showing how it has rapidly retreated and shrunk in size over a few years’ time. Photographs taken by T. Mullet, NPS.
Diversity 17 00443 g002
Figure 3. Spatial comparison of average SHItf and 95% CI across sample distances (m) from Exit Glacier Road, within Kenai Fjords National Park, Alaska, (A) between sample years (2021 and 2022) and (B) sample years combined. Spectral sonic signature (SSS), represented by the average total SHItf across 507 frequency bins (129–11,025 Hz), is shown with sample years combined at distances of (C) 60 m, (D) 180 m, (E) 450 m, and (F) 675 m from the road. In panels (CF), solid black lines indicate the peak SHItf values (x-axis) at each frequency bin (y-axis), while dotted black lines highlight the frequency bins where SHItf values notably shift between low and mid-high frequency ranges.
Diversity 17 00443 g003
Figure 4. Spatial distribution of average SHItf and 95% CI in the categories of low frequency (<2000 Hz) (LFSHI) and mid-high frequency (>2000 Hz) (MHSHI) at interval distances from Exit Glacier Road within Kenai Fjords National Park, Alaska, compared (A) between years and (B) years combined.
Diversity 17 00443 g004
Figure 5. Temporal comparison of average SHItf and 95% CI across monthly timeframes in context to sample distances (m) from Exit Glacier Road within Kenai Fjords National Park, Alaska, (A) between sample years 2021 and 2022 and (B) years combined in relation to (C) the weighted proportion of occupied frequencies by month (wPOFm) across 507 frequency bins (001 = 297 Hz; 507 = 11,025 Hz) of years combined.
Diversity 17 00443 g005
Figure 6. Temporal patterns of the weighted proportion of occupied frequencies for sample days (wPOFd) in context to sample distances (m) from Exit Glacier Road within Kenai Fjords National Park, Alaska, (A) between sample years 2021 and 2022 and (B) years combined in relation to (C) the Normalized Difference Sonic Heterogeneity Index (NDSHI) indicating the sonic contribution of low (<2000 Hz) and mid-high frequency (>2000 Hz) sounds by sample days and distances with years combined. Black peaks in (A,B) indicate sample days when >50% of frequency bins were occupied by sonic activity. Black peaks above zero in (C) indicate days when mid-high-frequency sounds were predominant.
Diversity 17 00443 g006
Figure 7. Temporal patterns of (A) the weighted proportion of occupied frequencies by time of day (wPOFt) and (B) the Normalized Difference Sonic Heterogeneity Index (NDSHI) in context to month and sample distances (m) from Exit Glacier Road within Kenai Fjords National Park, Alaska. The dotted black line along the y-axis indicates 50% of occupied frequency bins.
Diversity 17 00443 g007
Figure 8. Spectrograms of (A) low-frequency geophonic ambience and “silent acoustic niches” at mid-high frequencies in the early morning of May at 675 m from Exit Glacier Road within Kenai Fjords National Park, Alaska, (B) mid-high frequency biophonies of the dawn chorus and low frequency geophonic ambience at 450 m from the road in spring, (C) full-spectrum technophony from tourist vehicles at 60 m from the road during peak tourist season, and (D) full-spectrum geophony from wind at 180 m from the road in September.
Diversity 17 00443 g008
Table 1. Spectral sonic signature (SSS) for the frequency range of 129 to 11,025 Hz recorded at sample sites located 60, 180, 450, and 675 m from Exit Glacier Road within Kenai Fjords National Park, Alaska, between 11 May and 30 October 2021 and 2022.
Spectral Sonic Signature
Distance (m)All Years20212022
60247.1239.4255.5
(245.5–248.6)(237.2–241.6)(253.3–257.7)
180220.7220.1221.4
(219.1–222.3)(217.8–222.4)(219.1–223.7)
450207.7206.4209
(206.0–209.4)(204.0–208.8)(206.6–211.4)
675181.2139.5170.5
(179.6–182.8)(191.1–195.9)(168.4–172.6)
Table 2. Normalized Difference Spectral Heterogeneity Index (NDSHI) and 95% CI at sample sites located at interval distances from Exit Glacier Road within Kenai Fjords National Park, Alaska, between 11 May and 30 October 2021 and 2022.
NDSHI
Distance (m)All Years20212022
60−0.517−0.439−0.48
(−0.525–−0.509)(−0.447–−0.431)(−0.486–−0.474)
180−0.556−0.547−0.552
(−0.564–0.548)(−0.556–−0.538(−0.558–−0.546)
450−0.604−0.589−0.596
(−0.612–−0.596)(−0.597–−0.580)(−0.602–−0.590)
675−0.627−0.685−0.658
(−0.635–−0.619)(−0.692–−0.678)(−0.663–−0.653)
Table 3. Number of sample days for each month of sampling when the weighted proportion of occupied frequencies (wPOFd) consisted of >50% of frequency bins occurring at sample distances from Exit Glacier Road within Kenai Fjords National Park, Alaska, over 172 days in 2021 and 172 days in 2022 between 11 May and 30 October.
2021
Month60 m180 m450 m675 m
May05040401
June26142105
July14080704
August10080508
Sepetember12100708
October11100304
Total78544730
2022
May01000200
June19072000
July23072208
August22122109
September11130508
October05110003
Total81507028
Years Combined
May02010101
June24090501
July21070406
August17090806
September11140804
October06070402
Total81473020
Disclaimer/Publisher’s Note: The statements, opinions and data contained in all publications are solely those of the individual author(s) and contributor(s) and not of MDPI and/or the editor(s). MDPI and/or the editor(s) disclaim responsibility for any injury to people or property resulting from any ideas, methods, instructions or products referred to in the content.