Abstract
Biodiversity conservation plays a pivotal role in achieving sustainable development and fostering harmonious coexistence between humans and nature. This study identifies avian conservation priority areas across China by analyzing multi-dimensional biodiversity, incorporating species diversity, functional diversity, and phylogenetic diversity. Through systematic conservation planning using Zonation version 4 software, we delineated priority areas across these diversity dimensions. Our results demonstrate a distinct south-to-north diversity gradient in China’s avifauna, with functional and phylogenetic diversity hotspots concentrated in Yunnan Province, the Hengduan Mountains, Hainan Island, Taiwan Island, and southeastern coastal regions. The identified priority conservation areas cover 14.6% of China’s terrestrial territory, protecting 89.8% of the country’s bird species—including 93.5% of endemic species and 88.9% of critically endangered species. Notably, existing nature reserves encompass merely 8.1% of these priority areas, revealing substantial conservation gaps within the current protection framework. Building upon China’s 3C Zoning Framework (Cities and farms, Shared landscapes, and Large wild areas), we propose zone-specific conservation strategies, with particular emphasis on strengthening protected area networks in the eastern coastal regions and the middle-lower Yangtze River basin, where urbanization pressures are most acute. These findings highlight the critical importance of incorporating multi-dimensional diversity in conservation planning and offer novel perspectives for optimizing China’s protected area system.
1. Introduction
Biodiversity and sustainable human development are fundamentally interconnected, with the protection of biodiversity being essential for achieving harmonious coexistence between humans and nature [1]. As a recognized biodiversity hotspot, China has implemented extensive conservation initiatives since ratifying the Convention on Biological Diversity in 1992, demonstrating a strong commitment to biodiversity protection and sustainable development [2,3]. Among these efforts, the establishment of protected areas (PAs) has been a cornerstone for in situ conservation, supporting species survival, population expansion, and ecosystem services [4]. By 2019, China had established over 11,800 protected areas, covering 18% of its terrestrial area and 4.1% of its maritime jurisdiction [5]. Nature reserves dominate this system, with 2750 reserves accounting for approximately 14.8% of the terrestrial area by 2018 [6]. These efforts have enabled China to meet the Aichi Biodiversity Target of protecting 17% of terrestrial areas by 2020 [3]. However, the Kunming-Montreal Global Biodiversity Framework, adopted at the 15th Conference of the Parties (COP15) in 2022, sets a new target of protecting 30% of global terrestrial areas by 2030 [7,8], posing new challenges for China’s protected area network. Identifying priority conservation areas, addressing coverage gaps, and enhancing biodiversity and ecosystem service benefits are now critical research focuses.
Traditional methods for identifying priority conservation areas have relied on metrics such as species richness, endemism, or threat levels [9,10,11]. However, these approaches often focus solely on species diversity, overlooking unique functional traits and evolutionary lineages influenced by ecological and evolutionary processes [12,13,14]. Consequently, strategies based solely on species richness are insufficient. Recent studies advocate for integrated approaches that incorporate multiple dimensions of diversity, including species, functional, and phylogenetic diversity [15,16]. Functional diversity reflects species interactions and ecosystem functions [17,18], while phylogenetic diversity reveals biogeographic and historical information. The relationships between these diversity dimensions vary across studies, necessitating case-by-case analysis [19].
Birds, as species-rich and abundant components of terrestrial ecosystems, play vital roles in maintaining ecosystem processes and functions. They are key indicators of ecosystem health and biodiversity levels [20]. China’s vast territory, with its rich avian diversity, provides an excellent model for studying large-scale biodiversity patterns. Previous studies on threatened plants and terrestrial vertebrates have identified scattered hotspots not covered by existing nature reserves [16,21]. This study integrates multiple dimensions of diversity to identify priority conservation areas for Chinese birds, exploring the relationships between species, functional, and phylogenetic diversity. It also aims to identify gaps in the current nature reserve system, offering new perspectives for optimizing China’s protected area network with a focus on avian diversity.
2. Materials and Methods
2.1. Calculation of Diversity Indices
Species richness (SR) was used to measure species diversity, based on a database of bird species distribution in China, comprising distribution maps of 1324 bird species from the Laboratory of Wildlife Ecology and Conservation at Peking University.
Functional traits relevant to resource acquisition, survival, reproduction, and population dispersal were selected for analysis, including body mass [22], diet [22], clutch size [23], distribution range (number of provinces) [22], nestling type (https://birdsoftheworld.org/bow/home, accessed on 8 June 2024), nest type (https://birdsoftheworld.org/bow/home, accessed on 8 June 2024), and nocturnality [22]. These seven traits were used as indicators in the analysis. Missing trait values were imputed using the missForest [24] R package in R 3.6.1 [25]. The trait data for body mass, clutch size, and the number of provinces were subjected to log10 transformation and subsequently standardized using z-transformation. Functional diversity (FD) was assessed by constructing a functional dendrogram and calculating the total branch length of species within each geographical unit on the dendrogram, with the total branch length serving as an index of functional diversity [26]. Initially, a functional trait matrix was generated. The Gower distance, which is capable of handling both continuous and discrete data, was employed to convert the trait matrix into a similarity matrix, thereby quantifying the distances between species [27]. Subsequently, hierarchical clustering was applied to the species based on the similarity matrix to generate a functional dendrogram. All calculations were performed using the picante [28] R package in R 3.6.1 [25].
The global phylogeny database, A Global Phylogeny of Birds (http://www.birdtree.org, accessed on 17 September 2020), constructs a comprehensive phylogenetic tree that encompasses all bird species globally [29]. The tree-building approach integrates well-supported phylogenies based on relaxed molecular clocks with framework trees that incorporate fossil calibrations to represent each branch. In this study, we matched the species names from the third edition of the Checklist of Chinese Birds to the classification system provided by this database. We selected the “Hackett All Species: a set of 10,000 trees with 9993 OTUs each” option from the global bird phylogeny database and input the matched 1369 bird species. Subsequently, we downloaded 5000 phylogenetic trees for further analysis. TreeAnnotator v1.10.4 software from the BEAST package was employed to construct the phylogenetic tree of Chinese birds [30]. The target tree type was set to the maximum clade credibility tree, and node heights were calculated using the mean node heights option. This approach allowed for the generation of a robust phylogenetic tree that reflects the evolutionary relationships among species. The resulting phylogenetic tree was visualized using FigTree v1.4.4 software [31], which facilitated the interpretation and presentation of the tree structure. Based on this phylogenetic tree, the index of phylogenetic diversity was subsequently calculated (Figure A1).
Phylogenetic diversity (PD) was assessed using Faith’s PD index as a measure of phylogenetic diversity [13]. The PD index represents the total length of all phylogenetic branches within a community, with higher values indicating a greater cumulative branch length encompassing the species. Regions with higher phylogenetic diversity are typically associated with greater productivity and ecosystem stability, thereby holding higher conservation value [32,33]. The PD index was calculated using the picante [28] R package in R 3.6.1 [25]. The selection of these diversity indices reflects the representation of different dimensions of diversity in terms of richness, aiming to explore the current status of various diversity types at the level of “richness” and to identify conservation priority areas [34]. All indices were calculated and analyzed at a spatial resolution of 10 km.
2.2. Conservation Priority Area Analysis
Our study identifies conservation priority areas for birds in China across different dimensions of biodiversity using the systematic conservation planning software Zonation version 4 [35]. Zonation software assigns hierarchical priority rankings to input raster cells by analyzing the provided data from the perspectives of landscape and habitat connectivity, considering representativeness and complementarity. It iteratively removes raster cells that have the least impact on biodiversity features across the entire area, i.e., those with the smallest marginal loss, until no cells remain. The sequence of raster removal serves as the basis for hierarchical ranking and is used to assign a conservation value to each raster cell, ranging from 0 to 1. A value of 0 indicates that the cell is removed first and has the lowest conservation value, whereas a value of 1 indicates that the cell is removed last and represents the highest conservation value area. This method, which considers both biodiversity cores and landscape structure, plays a significant role in optimizing spatial layout and selecting conservation priority areas at large scales [35,36]. We used raster data for each biodiversity index and selected the core-area zonation (CAZ) algorithm as the rule for raster removal to obtain priority rank maps for different dimensions of biodiversity, with values ranging from 0 to 1. We assessed the consistency of priority rank maps across different dimensions of biodiversity by calculating Kendall’s rank correlation coefficient, using the stats R package in R 3.6.1 [25]. We then extracted the top 2.5%, 5%, 10%, 17%, and 30% of raster cells from each priority rank map and projected them into the Asia North Albers Equal Area Conic coordinate system in ArcGIS 10.5, with a spatial resolution of 10 km, for visualization.
To identify priority areas for the conservation of avian biodiversity in China, we considered two conservation target scenarios: 17% and 30% conservation area targets. The 17% target scenario was based on the standard of protecting 17% of terrestrial areas as outlined in the “Aichi Biodiversity Targets”. We selected the top 17% of raster cells (with conservation values ≥ 0.83) from each biodiversity priority rank map and overlaid these cells. The proportion of the overlaid area relative to the total terrestrial area was then calculated. The 30% target scenario was based on the “30 × 30 goal” proposed in the Kunming-Montreal Global Biodiversity Framework, which was released at the 15th Conference of the Parties (COP15) to the Convention on Biological Diversity. This goal aims to protect at least 30% of the global terrestrial area by 2030 [37]. For this scenario, we selected the top 30% of raster cells (with conservation values ≥ 0.7) from each biodiversity priority rank map and overlaid them for visualization.
2.3. Gap Analysis
Our study identifies avian conservation priority areas in China by analyzing the top 17% overlapping regions derived from species diversity, functional diversity, and phylogenetic diversity priority rank maps. These overlapping regions are then superimposed onto the current distribution map of nature reserves in China (obtained from the Wildlife Ecology and Conservation Laboratory of Peking University) to conduct a conservation gap analysis. Our aim is to determine whether the existing protected areas under the current conservation framework effectively cover the priority regions for avian conservation and to identify any gaps in coverage. For regions with identified conservation gaps for avian protection, this study further integrates the Chinese “3C” zoning map [38] to delineate the zoning conditions of these gaps, which include Zone 1 (C1) “cities and farms”, Zone 2 (C2) “shared landscapes”, and Zone 3 (C3) “large wild areas”. The potential conservation mechanisms under different zoning conditions are further explored.
3. Results
3.1. Spatial Patterns of Multi-Dimensional Biodiversity and Conservation Priority Areas
We obtained spatial distribution maps of avian species diversity, functional diversity, and phylogenetic diversity indices across China. The results indicated that the overall spatial patterns of the three diversity indices generally exhibited a gradient of high values in the south and low values in the north, with some local variations (Figure 1). For functional diversity, high values were concentrated in western Yunnan, the eastern edge of the Hengduan Mountains, the southeastern coastal regions, and western Taiwan (Figure 1B). For phylogenetic diversity, high values were found in central and southwestern Yunnan, the eastern edge of the Hengduan Mountains, Hainan Island, western Taiwan Island, and the southeastern coastal regions (Figure 1C).
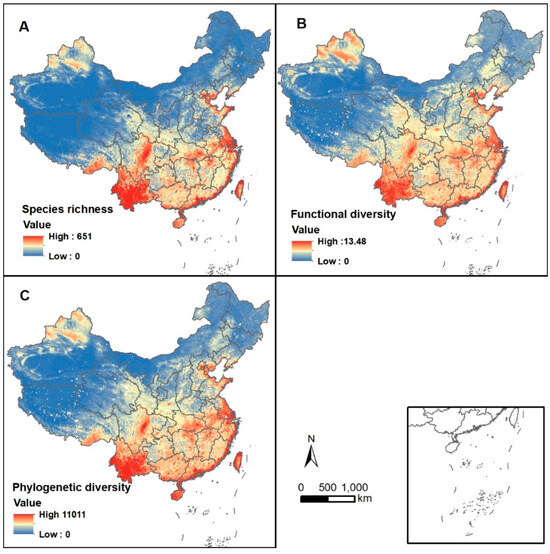
Figure 1.
Spatial distribution of the index of each of the three diversity dimensions of birds in China: (A) species diversity, (B) functional diversity, and (C) phylogenetic diversity. Resolution is 10 km. The map was projected by the Albers equal area projection.
After analysis using the Zonation software, we obtained the estimated distribution maps of conservation priority for Chinese birds across the three dimensions (Figure 2). The results of the correlation analysis, based on the conservation value ranking layers provided by the Zonation software, revealed high spatial consistency among the estimated conservation priorities across the different dimensions of diversity. Under varying priority thresholds, the identified high-priority regions differed among the dimensions of diversity: Compared with species diversity and functional diversity, phylogenetic diversity exhibited higher priority values in the southern Yunnan–Guizhou Plateau and Hainan Island. At the top 30% priority threshold, high-priority regions across all dimensions of diversity were predominantly concentrated in the northwestern part of Xinjiang and south of the Qinling–Huaihe line (Figure 2).
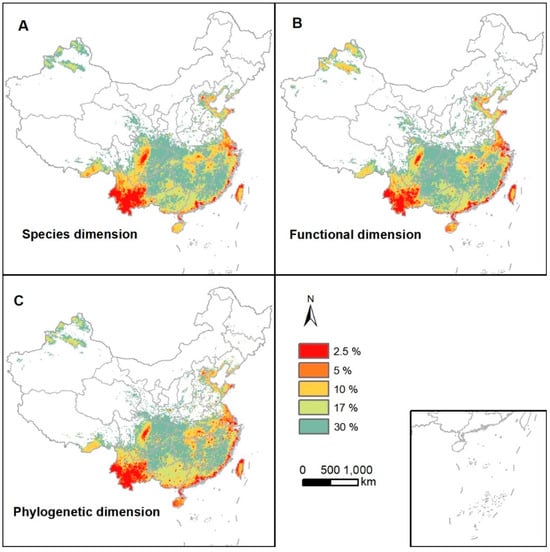
Figure 2.
The distribution of assessed prioritization values of birds in China under each of the three diversity dimensions: (A) species diversity, (B) functional diversity, and (C) phylogenetic diversity. The top 2.5%, 5%, 10%, 17%, and 30% ranks of all grids displayed.
Areas that were ranked in the top 17% of priority across all three dimensions of diversity were identified as priority areas for avian conservation in China, comprising 13,992 grid cells (approximately 1.40 × 10⁶ km2), which account for 14.6% of China’s terrestrial area (Figure 3A,B). These priority areas encompass 1298 bird species (representing 89.8% of the total bird species in China), including 87 endemic species (93.5% of the total endemic bird species in China). Among them, 16 species are classified as Critically Endangered (88.9% of China’s Critically Endangered bird species), 44 as Endangered (89.8% of China’s Endangered bird species), and 73 as Vulnerable (92.4% of China’s Vulnerable bird species) according to the China Biodiversity Red List: Vertebrates (Volume II: Birds) [39]. Spatially, these identified priority areas for avian conservation are primarily concentrated in parts of the Tianshan and Altai Mountains in northwestern Xinjiang, Yunnan, southeastern Tibet, the eastern Hengduan Mountains, the southern Yunnan–Guizhou Plateau, southern Guangxi, western Guangdong, the middle and lower reaches of the Yangtze River Plain, the Bohai Rim region, the southeastern coastal areas, Hainan Island, and Taiwan Island (Figure 3A).
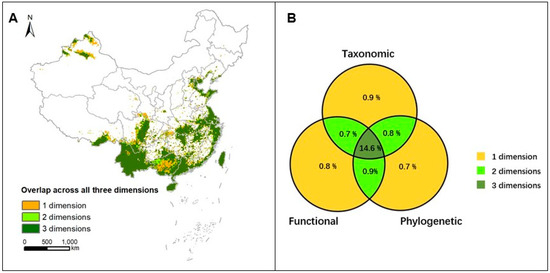
Figure 3.
Priority areas of bird diversity from three dimensions in China. (A) Overlap areas of the top 17% rank grids from three diversity dimensions and (B) the Venn diagram shows the proportion of land surface overlapping areas in the top 17% of priority areas in the three dimensions.
Furthermore, areas ranked within the top 17% priority for two diversity dimensions cover approximately 2.4% of China’s terrestrial territory. Separately, areas ranked in the top 17% for just one diversity dimension account for another 2.4% of the land area (Figure 3B).
When considering the conservation target scenario of 30% protected area, there are 29,081 grid cells (approximately 2.90 × 10⁶ km2) where the priority is assessed to be in the top 30% across all three dimensions of diversity. These areas are mainly concentrated in the northwestern Xinjiang, the Bohai Rim region, southern China, and southeastern Tibet (Figure 4).
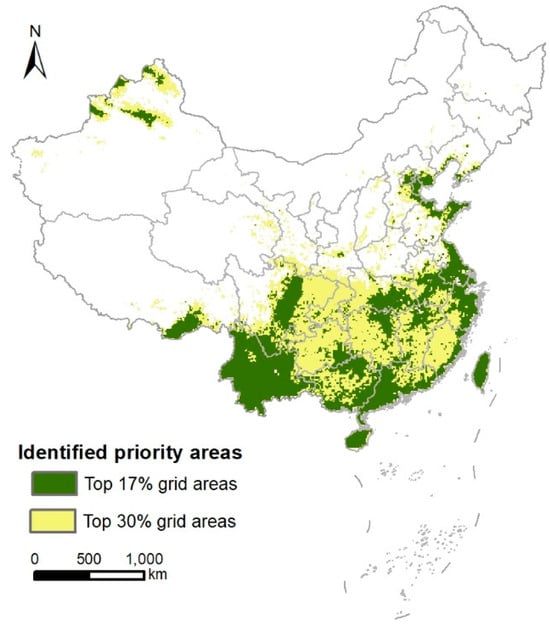
Figure 4.
The identified priority areas under different conservation area targets under three diversity dimensions of birds in China. Overlap of the top 17% grid areas of the three diversity priorities (i.e., the green part in Figure 3A) (green) and overlap of the top 30% grid areas of the three diversity priorities (yellow).
3.2. Conservation Gaps Based on Bird Conservation Priority Areas
The spatial distribution of current nature reserves in China and the distribution of multi-dimensional bird diversity priority areas (regions with overlapping top 17% priority) show relatively significant differences (Figure 5). Among the identified bird conservation priority areas, 1129 grid cells (approximately 1.13 × 10⁵ km2) are covered by existing nature reserves, accounting for about 1.2% of China’s terrestrial area and approximately 8.1% of the multi-dimensional top 17% priority areas.
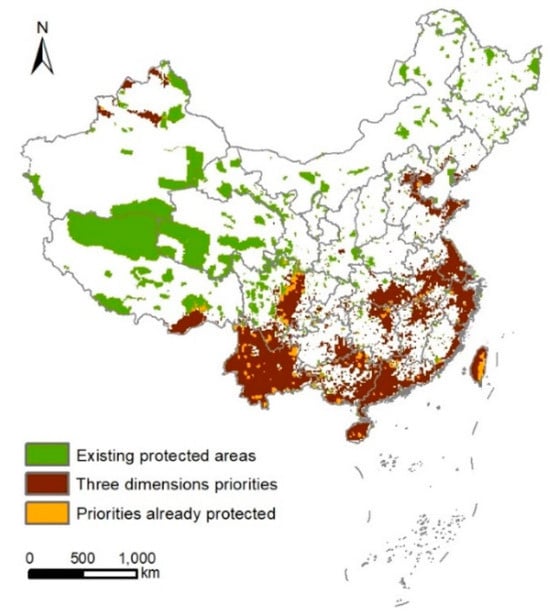
Figure 5.
Comparison of multi-dimensional diversity conservation priority areas of birds in China with current nature reserves. The current network of protected areas (green), overlapping across the top 17% priority areas for species diversity, phylogenetic diversity, and functional diversity (brown), and areas of overlap that are already protected (orange).
In terms of spatial distribution, the overlapping regions between the current nature reserves and the priority conservation areas identified in this study are predominantly located in the southwestern region of China (e.g., the Ertan Bird Nature Reserve; most of the existing reserves in Yunnan, such as the Baima Snow Mountain National Nature Reserve, Gaoligong Mountain National Nature Reserve, and Chayu Cibagou National Nature Reserve in Tibet), the southern region (e.g., some reserves in Guangxi, Guangdong, and Hainan), and the central region (e.g., overlapping areas in the middle and lower reaches of the Yangtze River Plain, including the Dongting Lake Nature Reserve, Poyang Lake National Nature Reserve, and Anqing Yangtze River Wetland Nature Reserve). Additionally, there are sporadic overlapping areas in the northern region (e.g., Tianjin Ancient Coast and Wetland National Nature Reserve), the eastern region (e.g., Shandong Yellow River Delta National Nature Reserve, Jiangsu Yancheng Wetland Rare Bird National Nature Reserve, and Yushan National Park in Taiwan’s Central Mountain Range), and the northwestern region (e.g., Bogda Peak National Nature Reserve).
The bird conservation priority areas that are not covered by the current nature reserves, namely, the conservation gaps, are primarily concentrated in southeastern Tibet, Yunnan, central Sichuan, the South China mountains, the middle and lower reaches of the Yangtze River Plain, the eastern coastal region, and the islands of Taiwan and Hainan, with the eastern coastal region having the lowest coverage by nature reserves. Additionally, there are some conservation gaps in the Tianshan and Altai Mountains in the northwestern region (Figure 5).
In terms of China’s “3C Zoning Framework”, the conservation gaps are mostly located in the C1 (cities and farms) and C2 (shared landscapes) zones (Figure 6). Specifically, the C1 zone contains 5827 grid cells (approximately 5.83 × 10⁵ km2), accounting for about 45.3% of the total area of the identified conservation gaps. The C2 zone contains 6953 grid cells (approximately 6.95 × 10⁵ km2), accounting for about 54.1% of the total conservation gap area. Only 79 grid cells (approximately 7900 km2) are located in the C3 (large wild areas) zone, representing about 0.6% of the total conservation gap area (Figure 6).
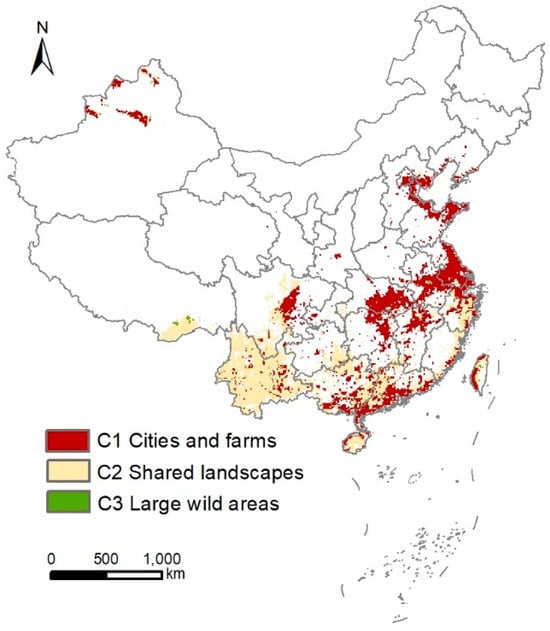
Figure 6.
Map of the three conditions of the bird conservation gap area in China: C1 cities and farms (red), C2 shared landscapes (light yellow), and C3 large wild areas (green).
4. Discussion
4.1. Multidimensional Diversity Research
From a conservation perspective, functional diversity and phylogenetic diversity are both considered important aspects of biodiversity, representing the functions and services of species in ecosystems and their evolutionarily valuable histories, respectively [12,40]. The diversity patterns obtained in this study show that the pattern of functional diversity is generally similar to that of species diversity. The hotspots of high functional diversity include southern Yunnan, the Hengduan Mountains, and the eastern coastal regions, where a variety of birds that provide ecological functions and services reside. These areas possess stronger ecosystem functions and hold high conservation value.
The hotspots of phylogenetic diversity, such as southeastern Tibet, Hainan Island, and Taiwan Island, are characterized by natural geographic barriers. The microhabitats formed within these regions can mitigate environmental disturbances, which facilitates the protection and survival of relict lineages. In Yunnan, the suitable hydrothermal conditions and stable climate facilitate speciation and promote the aggregation of recently diverged lineages. These hotspot regions may simultaneously act as both a “cradle” and a “museum” for species. The loss of species in these areas would imply the loss of unique evolutionary information, and thus, they should be prioritized in conservation efforts.
Previous studies have categorized indices of species diversity, phylogenetic diversity, and functional diversity into three aspects of diversity characteristics: richness, divergence, and regularity [18,41]. The selection and calculation of multi-dimensional diversity indices should be determined based on the actual research questions. This study focuses more on the conservation of diversity. The indices selected are commonly used in conservation biology and are capable of representing the richness of different types of diversity, thus holding significant conservation value. Building upon previous research that has primarily focused on and conserved areas with high species richness, this study extends its scope to regions with high richness in other types of diversity. This represents an extension in different dimensions within the same conservation direction. The functional diversity index used in this study is derived from functional dendrograms, allowing it to be consistent with the phylogenetic diversity index within the same research framework [34]. In addition to the indices used in this study, future research could employ other metrics to describe different aspects of diversity. For instance, functional dispersion (Fdis), mean pairwise distance (MPD), and mean nearest taxonomic distance (MNTD) can be used to quantify the divergence of diversity patterns. Functional evenness (FEve), variance in pairwise distance (VPD), and variance in nearest taxonomic distance (VNTD) can be used to describe the regularity of diversity patterns. These indices can be utilized to elucidate community assembly mechanisms from functional and phylogenetic perspectives [42,43,44]. For instance, in addition to conserving areas with high richness, regions with high divergence should also be considered for conservation. Areas with high functional diversity can provide more ecological niches for species and offer a greater range of ecosystem services, thus holding conservation significance.
Regarding the spatial congruence of species diversity, phylogenetic diversity, and functional diversity, some studies have revealed spatial mismatches among different types of diversity. This phenomenon has been observed in global studies of birds [15], freshwater fishes [45], and mammals [14], emphasizing the importance of integrating multidimensional diversity in biodiversity conservation [46,47]. In this study, the priority area analysis based on the core removal rule showed that the conservation values of species diversity, phylogenetic diversity, and functional diversity of birds are positively correlated with each other, and the spatial congruence of priority areas is relatively high. To some extent, this is related to the indices selected in this study, which are calculated based on species richness while considering different dimensions of diversity. Moreover, this study highlights the importance of areas where the three types of diversity overlap. These overlapping regions are not only rich in bird species but also contain unique and narrowly distributed genetic information. They are inhabited by bird species with diverse functional traits that may play important roles and provide essential services in ecosystems. Such areas deserve particular attention from conservationists. For instance, the Hengduan Mountains are a well-known biodiversity hotspot and also a hotspot for bird functional diversity. The complex and diverse habitats provide niches for different bird species, while the “refugia” within this region harbor unique evolutionary information. Regions where all types of diversity are advantageous, like the Hengduan Mountains, are undoubtedly key areas for conservation focus. In future studies, the analysis of multidimensional diversity can be further refined within different bird groups. For instance, considering the endemism aspect across multiple dimensions, one could select endemic bird species from the species diversity dimension, functionally unique species from the functional dimension, and evolutionarily unique species from the phylogenetic dimension. Integrating endemism across different dimensions in research can reveal regions with unique ecological representation, providing additional perspectives for biodiversity conservation.
4.2. Conservation Implications
Hu et al. (2017) utilized birdwatching data to identify conservation hotspots for threatened birds in China, including the Bohai Bay, the Yellow Sea coast, the southern North China Plain, and the middle and lower reaches of the Yangtze River region. They revealed that the conservation efforts in these hotspots are insufficient, with less than 2% of these areas covered by existing nature reserves. Future actions are urgently needed to enhance conservation in these regions [48]. Results from this study indicate that the current nature reserve network in China also inadequately covers the priority areas for bird conservation based on species, phylogenetic, and functional dimensions. Although the current protected areas have achieved the 17% coverage target set by Aichi Target 11, significant conservation gaps remain when considering bird conservation priority areas, with only 8.1% of these priority areas covered by nature reserves. China’s protected area network, designed primarily around flagship species like the giant panda, demonstrates limited conservation effectiveness for other taxa (including avifauna) [49]. This system exhibits preferential protection of intact forest ecosystems while inadequately covering fragmented habitats critical for many forest-dependent birds, such as secondary growth forests [50]. The Kunming–Montreal Global Biodiversity Framework aims to protect 30% of terrestrial areas, while the “Half Earth” and “Nature Needs Half” initiatives advocate for the protection of half of the Earth’s land. The increase in protected area targets poses higher demands for conservation efforts, necessitating the exploration of how to select priority and representative areas for protection when expanding the coverage.
The conservation management framework based on the 3C Zoning Framework was first proposed by Locke et al. (2019) [51]. This approach, which relies on land cover types and the human footprint index, aims to provide tailored conservation strategies for different zones. Results from this study indicate that the conservation gaps for birds in China are primarily located in Zone 1 (C1, cities and farms) and Zone 2 (C2, shared landscapes). Based on these findings, this study recommends the development of context-specific, landscape-scale conservation strategies for different zones, as detailed below:
In the southwestern region of China, bird conservation priority areas are relatively concentrated and have a higher degree of coverage, particularly in central Sichuan, Yunnan, and southeastern Tibet. From the perspective of the 3C Zoning Framework, these conservation gaps are mainly located in Zone 2 (shared landscapes). This study suggests strengthening protected area establishment in these regions to cover more bird conservation priority areas. For instance, nature reserves in central Sichuan and Yunnan already harbor higher bird diversity and have a greater number of existing protected areas. Priority should be given to enhancing conservation efforts and investment in these regions, expanding the area of existing protected areas, and leveraging existing conservation advantages to form more systematic conservation zones. Additionally, by utilizing the conservation effects of existing nature reserves, other effective area-based conservation measures (OECMs) should be implemented to promote sustainable resource use, increase public education and outreach in the surrounding areas of protected areas, enhance public awareness of bird conservation, and expand the impact of conservation efforts.
Currently, some relatively remote or scattered bird conservation priority areas are not covered by existing protected areas, such as the northwestern region of Xinjiang and the middle and lower reaches of the Yangtze River. From the perspective of the 3C Zoning Framework, these conservation gaps are mainly located in Zone 1 (C1, cities and farms). It is recommended to establish additional protected areas in the northwestern region of Xinjiang to maintain natural habitats and provide suitable breeding and wintering grounds for birds. The middle and lower reaches of the Yangtze River are characterized by abundant water resources and a dense river network, with diverse aquatic biota in the lake and marsh areas that provide a variety of food sources for birds. However, this region is also a densely populated area with highly intensive land use, representing a hotspot of biodiversity stress. It faces challenges such as biodiversity loss, habitat fragmentation, and conflicts between agricultural and ecological spaces [52,53]. As a region that serves simultaneously as a vital avian biodiversity hotspot and a focal point of China’s urbanization, achieving coexistence between socioeconomic development and biodiversity conservation here represents a critical challenge. To bridge the conservation gaps identified in this study, we propose expanding protected area networks while enhancing ecological connectivity through strategic corridor development, coupled with sustained improvements in environmental protection capacity. Beyond these measures, the implementation of other effective area-based conservation measures (OECMs) should be prioritized to develop inclusive biodiversity policies that harmonize conservation objectives with sustainable resource use through active public engagement. Efforts should be made to actively address various ecological issues, such as the impacts of water pollution, air pollution, and soil degradation on bird habitats and breeding, and to promote the development of environmentally friendly agriculture to ensure the sustainable development of agricultural and ecological spaces [54].
China’s nature reserves are generally distributed in the western regions with lower population density and well-preserved natural habitats, while being sparsely distributed in the eastern regions (Figure 5). Bird conservation priority areas along the eastern coast have a relatively low level of protection. Existing protected areas include the Chongming Dongtan National Bird Nature Reserve, the Xiangshan Jieshan Archipelago National Marine Ecological Nature Reserve, and the Nanpeng Archipelago National Nature Reserve, which are scattered and have relatively small coverage areas. The eastern coastal region is an important industrial base and economic center, with well-developed industry and agriculture. It is a strategic core area for national economic development and also a primary region for new-type urbanization in the country [55]. However, under the long-term extensive economic development model, coastal cities have become sensitive areas where ecological and environmental problems are concentrated and exacerbated [56]. Located on the East Asian–Australasian Flyway, the eastern coastal region serves as an important stopover site for many migratory birds [57,58]. In recent years, land reclamation activities in the eastern coastal region have led to the degradation and loss of wetlands and mudflats. Additionally, invasive species, aquaculture, chemical pollution, and tourism development have severely impacted the population maintenance of birds, necessitating targeted conservation efforts [59,60].
The results of this study indicate that species diversity, phylogenetic diversity, and functional diversity of birds are all relatively high in the eastern coastal region. Previous studies have identified priority areas for coastal waterbird conservation [61], key habitats for shorebird waterbirds [62], and important stopover sites for migratory waterbirds [63], all of which fall within the conservation priority areas identified in this study along the eastern coast. Wang et al. (2022) found significant differences in bird species composition among 14 stopover sites in the Yellow Sea and Bohai Sea region, highlighting the importance and irreplaceability of these stopover sites for maintaining bird communities [64]. From the perspective of the 3C Zoning Framework, both Zone 1 (C1, cities and farms) and Zone 2 (C2, shared landscapes) are present in this region. Therefore, this study recommends increasing the number of protected areas in the shared landscape zones of the eastern coastal conservation gap areas to build a conservation network, effectively protect migratory routes for birds, and gradually improve the current situation of fragmented and localized protected areas, forming a trans-regional and integrated conservation network. For existing protected areas, it is suggested to further expand the protection coverage of coastal wetlands by incorporating surrounding mudflats into the existing protection system. Local governments should strengthen the management of wetland resources, strictly restrict the reclamation of coastal natural wetlands, optimize the construction of protected area systems, and implement feasible conservation actions to maintain bird diversity and their ecological functions. There are already successful conservation cases in China’s eastern coastal region, demonstrating that the negative impacts of socio-urban development on biodiversity can be gradually reversed through conservation actions. For instance, the Tiaozini Wetland in Yancheng, Jiangsu Province, is an important area on the East Asian–Australasian Flyway. As part of the first phase of the Yellow Sea–Bohai Sea Migratory Bird Habitat, it was inscribed on the World Heritage List in 2019, marking the first World Natural Heritage site in China’s densely populated and highly developed eastern coastal region. Over the past few years, 22 new bird species have been recorded in the Tiaozini Wetland, bringing the total number of bird species to 410 [54]. Therefore, conservation efforts should prioritize the implementation of ecological restoration measures along China’s eastern coastline to restore and enhance bird diversity in coastal wetlands.
Author Contributions
Conceptualization, F.D. and S.L.; methodology, F.D. and S.L.; software, S.Z. and X.S. (Xiaoyun Shi); validation, S.L.; formal analysis, F.D.; data collection, X.S. (Xiaoyun Shi) and F.D.; resources, S.Z.; data curation, F.D.; writing—original draft preparation, F.D.; writing—review and editing, F.D., X.S. (Xiaoli Shen) and S.L.; visualization, F.D.; supervision, S.L.; project administration, S.L.; funding acquisition, F.D. All authors have read and agreed to the published version of the manuscript.
Funding
This study was supported by the Beijing Government and the BJAST Budding Talent Program (Grant No. 25CE-BGS-11).
Institutional Review Board Statement
This study does not involve the use of animals or humans, so the IRBS is not applicable.
Data Availability Statement
The data that support the findings of this study are available in https://figshare.com/s/dd642a32d7fd7d288297 (accessed on 14 May 2025).
Acknowledgments
We thank Zongzhuang Liu for his help in collecting the trait data.
Conflicts of Interest
The authors declare no conflicts of interest.
Appendix A
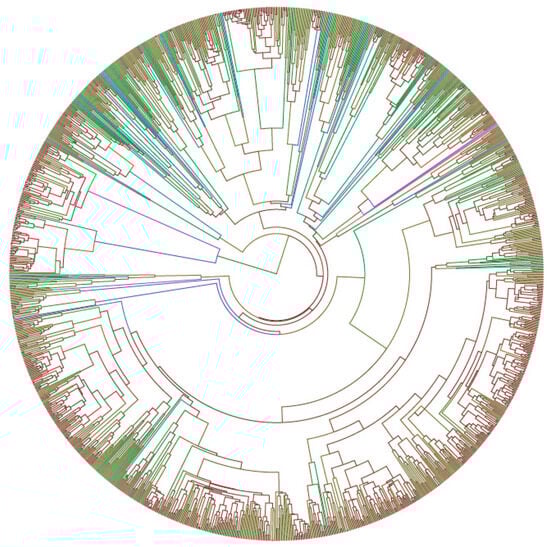
Figure A1.
A phylogenetic tree of birds in China was constructed in this study. Different colors represent different branch length gradients; brown represents shorter branch length, and blue represents longer branch length. The value range is approximately 0.1 to 75.2 million years (Ma). Species n = 1369.
References
- Mace, G.M.; Norris, K.; Fitter, A.H. Biodiversity and Ecosystem Services: A Multilayered Relationship. Trends. Ecol. Evol. 2012, 27, 19–26. [Google Scholar] [CrossRef]
- Cao, M.T.; Peng, L.; Liu, S.Q. Analysis of the Network of Protected Areas in China Based on a Geographic Perspective: Current Status, Issues and Integration. Sustainability 2015, 7, 15617–15631. [Google Scholar] [CrossRef]
- Wang, W.; Li, J.S. In-Situ Conservation of Biodiversity in China: Advances and Prospects. Biodivers. Sci. 2021, 29, 133–149. [Google Scholar] [CrossRef]
- Pecl, G.T.; Araujo, M.B.; Bell, J.D.; Blanchard, J.; Bonebrake, T.C.; Chen, I.C.; Clark, T.D.; Colwell, R.K.; Danielsen, F.; Evengard, B.; et al. Biodiversity Redistribution under Climate Change: Impacts on Ecosystems and Human Well-Being. Science 2017, 355, eaai9214. [Google Scholar] [CrossRef] [PubMed]
- Online, People’s Daily. National Forestry and Grassland Administration: China Has Established 11,800 Protected Areas. Available online: https://www.gov.cn/xinwen/2019-10/31/content_5446931.htm (accessed on 31 October 2019).
- Gao, J.X.; Xu, M.J.; Zou, C.X. Development Achievement of Natural Conservation in 70 Years of New China. J. Environ. Manag. 2019, 11, 25–29. [Google Scholar]
- Luo, M.F.; Guo, Y.F.; Ma, K.P. A Brief Introduction to the Negotiations of the Post-2020 Global Biodiversity Framework. Biodivers. Sci. 2022, 30, 22654. [Google Scholar] [CrossRef]
- Yu, S.X.; Deng, L.C.; Wu, Q.; Wang, Z. The Review Mechanism of the Convention on Biological Diversity: Status, Challenges and Prospects. Biodivers. Sci. 2021, 29, 238–246. [Google Scholar] [CrossRef]
- Brooks, T.M.; Mittermeier, R.A.; da Fonseca, G.A.B.; Gerlach, J.; Hoffmann, M.; Lamoreux, J.F.; Mittermeier, C.G.; Pilgrim, J.D.; Rodrigues, A.S.L. Global Biodiversity Conservation Priorities. Science 2006, 313, 58–61. [Google Scholar] [CrossRef]
- Jenkins, C.N.; Pimm, S.L.; Joppa, L.N. Global Patterns of Terrestrial Vertebrate Diversity and Conservation. Proc. Natl. Acad. Sci. USA 2013, 110, 2602–2610. [Google Scholar] [CrossRef]
- Wilson, K.A.; McBride, M.F.; Bode, M.; Possingham, H.P. Prioritizing Global Conservation Efforts. Nature 2006, 440, 337–340. [Google Scholar] [CrossRef]
- Diaz, S.; Lavorel, S.; de Bello, F.; Quétier, F.; Grigulis, K.; Robson, T.M. Incorporating Plant Functional Diversity Effects in Ecosystem Service Assessments. Proc. Natl. Acad. Sci. USA 2008, 104, 20684–20689. [Google Scholar] [CrossRef] [PubMed]
- Faith, D.P. Conservation Evaluation and Phylogenetic Diversity. Biol. Conserv. 1992, 61, 1–10. [Google Scholar] [CrossRef]
- Mazel, F.; Guilhaumon, F.; Mouquet, N.; Devictor, V.; Gravel, D.; Renaud, J.; Cianciaruso, M.V.; Loyola, R.D.; Diniz-Filho, J.A.; Mouillot, D.; et al. Multifaceted Diversity-Area Relationships Reveal Global Hotspots of Mammalian Species, Trait and Lineage Diversity. Glob. Ecol. Biogeogr. 2014, 23, 836–847. [Google Scholar] [CrossRef] [PubMed]
- Devictor, V.; Mouillot, D.; Meynard, C.; Jiguet, F.; Thuiller, W.; Mouquet, N. Spatial Mismatch and Congruence between Taxonomic, Phylogenetic and Functional Diversity: The Need for Integrative Conservation Strategies in a Changing World. Ecol. Lett. 2010, 13, 1030–1040. [Google Scholar] [CrossRef] [PubMed]
- Xu, Y.; Shen, Z.; Ying, L.; Wang, Z.; Huang, J.; Zang, R.; Jiang, Y. Hotspot Analyses Indicate Significant Conservation Gaps for Evergreen Broadleaved Woody Plants in China. Sci. Rep. 2017, 7, 1859. [Google Scholar] [CrossRef]
- Huang, S.; Stephens, P.R.; Gittleman, J.L. Traits, Trees and Taxa: Global Dimensions of Biodiversity in Mammals. Proc. R. Soc. B Biol. Sci. 2012, 279, 4997–5003. [Google Scholar] [CrossRef]
- Pavoine, S.; Bonsall, M.B. Measuring Biodiversity to Explain Community Assembly: A Unified Approach. Biol. Rev. 2011, 86, 792–812. [Google Scholar] [CrossRef]
- Brum, F.T.; Graham, C.H.; Costa, G.C.; Hedges, S.B.; Penone, C.; Radeloff, V.C.; Rondinini, C.; Loyola, R.; Davidson, A.D. Global Priorities for Conservation across Multiple Dimensions of Mammalian Diversity. Proc. Natl. Acad. Sci. USA 2017, 114, 7641–7646. [Google Scholar] [CrossRef]
- Sekercioglu, C.H. Increasing Awareness of Avian Ecological Function. Trends. Ecol. Evol. 2006, 21, 464–471. [Google Scholar] [CrossRef]
- Quan, Q.; Che, X.L.; Wu, Y.J.; Wu, Y.C.; Zhang, Q.; Zhang, M.; Zou, F.S. Effectiveness of Protected Areas for Vertebrates Based on Taxonomic and Phylogenetic Diversity. Conserv. Biol. 2018, 32, 355–365. [Google Scholar] [CrossRef]
- Wilman, H.; Belmaker, J.; Simpson, J.; de la Rosa, C.; Rivadeneira, M.M.; Jetz, W. Eltontraits 1.0: Species-Level Foraging Attributes of the World’s Birds and Mammals. Ecology 2014, 95, 2027. [Google Scholar] [CrossRef]
- Zhao, Z.J. The Avifauna of China; Jilin Science and Technology Press: Changchun, China, 2001. [Google Scholar]
- Stekhoven, D.J.; Buhlmann, P. Missforest—Non-Parametric Missing Value Imputation for Mixed-Type Data. Bioinformatics 2011, 28, 112–118. [Google Scholar] [CrossRef] [PubMed]
- R Foundation for Statistical Computing. R: A Language and Environment for Statistical Computing. R Foundation for Statistical Computing: Vienna, Austria. Available online: http://www.R-project.org/ (accessed on 1 October 2020).
- Petchey, O.L.; Gaston, K.J. Functional Diversity (Fd), Species Richness and Community Composition. Ecol. Lett. 2002, 5, 402–411. [Google Scholar] [CrossRef]
- Gower, J.C. A General Coefficient of Similarity and Some of Its Properties. Biometrics 1971, 27, 857–871. [Google Scholar] [CrossRef]
- Kembel, S.W.; Cowan, P.D.; Helmus, M.R.; Cornwell, W.K.; Morlon, H.; Ackerly, D.D.; Blomberg, S.P.; Webb, C.O. Picante: R Tools for Integrating Phylogenies and Ecology. Bioinformatics 2010, 26, 1463–1464. [Google Scholar] [CrossRef] [PubMed]
- Jetz, W.; Thomas, G.H.; Joy, J.B.; Hartmann, K.; Mooers, A.O. The Global Diversity of Birds in Space and Time. Nature 2012, 491, 444–448. [Google Scholar] [CrossRef]
- Bouckaert, R.; Heled, J.; Kuhnert, D.; Vaughan, T.; Wu, C.H.; Xie, D.; Suchard, M.A.; Rambaut, A.; Drummond, A.J. Beast 2: A Software Platform for Bayesian Evolutionary Analysis. PLoS Comput. Biol. 2014, 10, e1003537. [Google Scholar] [CrossRef]
- Rambaut, A Figtree V1.4.4. Institute of Evolutionary Biology, University of Edinburgh, Edinburgh. 2018. Available online: http://tree.bio.ed.ac.uk/software/figtree/ (accessed on 18 March 2020).
- Cadotte, M.W. Experimental Evidence That Evolutionarily Diverse Assemblages Result in Higher Productivity. Proc. Natl. Acad. Sci. USA 2013, 110, 8996–9000. [Google Scholar] [CrossRef]
- Cadotte, M.W.; Dinnage, R.; Tilman, D. Phylogenetic Diversity Promotes Ecosystem Stability. Ecology 2012, 93, 223–233. [Google Scholar] [CrossRef]
- Mammola, S.; Carmona, C.P.; Guillerme, T.; Cardoso, P. Concepts and Applications in Functional Diversity. Funct. Ecol. 2021, 35, 1869–1885. [Google Scholar] [CrossRef]
- Lehtomaki, J.; Moilanen, A. Methods and Workflow for Spatial Conservation Prioritization Using Zonation. Environ. Modell. Softw. 2013, 47, 128–137. [Google Scholar] [CrossRef]
- Moilanen, A.; Anderson, B.J.; Eigenbrod, F.; Heinemeyer, A.; Roy, D.B.; Gillings, S.; Armsworth, P.R.; Gaston, K.J.; Thomas, C.D. Balancing Alternative Land Uses in Conservation Prioritization. Ecol. Appl. 2011, 21, 1419–1426. [Google Scholar] [CrossRef] [PubMed]
- CBD (Convention on Biological) Cop15: Nations Adopt Four Goals, 23 Targets for 2030 in Landmark Un Biodiversity Agreement. 2022. Available online: https://www.cbd.int/article/cop15-cbd-press-release-final-19dec2022 (accessed on 19 December 2022).
- Guo, H.D. Big Earth Data in Support of the Sustainable Development Goals (2020): China Report; Science Press: Beijing, China, 2021. [Google Scholar]
- Zhang, Y.Y.; Zheng, G.M. China Biodiversity Red List: Vertebrates (Volume Ii: Birds); Science Press: Beijing, China, 2021. [Google Scholar]
- Knapp, S.; Kühn, I.; Schweiger, O.; Klotz, S. Challenging Urban Species Diversity: Contrasting Phylogenetic Patterns across Plant Functional Groups in Germany. Ecol. Lett. 2008, 11, 1054–1064. [Google Scholar] [CrossRef]
- Tucker, C.M.; Cadotte, M.W.; Carvalho, S.B.; Davies, T.J.; Ferrier, S.; Fritz, S.A.; Grenyer, R.; Helmus, M.R.; Jin, L.S.; Mooers, A.O.; et al. A Guide to Phylogenetic Metrics for Conservation, Community Ecology and Macroecology. Biol. Rev. 2017, 92, 698–715. [Google Scholar] [CrossRef]
- Butchart, S.H.M.; Bird, J.P. Data Deficient Birds on the Iucn Red List: What Don’t We Know and Why Does It Matter? Biol. Conserv. 2010, 143, 239–247. [Google Scholar] [CrossRef]
- Cai, H.; Lyu, L.; Shrestha, N.; Tang, Z.; Su, X.; Xu, X.; Dimitrov, D.; Wang, Z.; Proença, V. Geographical Patterns in Phylogenetic Diversity of Chinese Woody Plants and Its Application for Conservation Planning. Divers. Distrib. 2020, 27, 179–194. [Google Scholar] [CrossRef]
- Quan, Q. Study on the Patterns of Bird Diversity in Eastern Eurasia. Doctoral Dissertation, University of Chinese Academy of Sciences, Beijing, China, 2015. [Google Scholar]
- Strecker, A.L.; Olden, J.D.; Whittier, J.B.; Paukert, C.P. Defining Conservation Priorities for Freshwater Fishes According to Taxonomic, Functional, and Phylogenetic Diversity. Ecol. Appl. 2011, 21, 3002–3013. [Google Scholar] [CrossRef]
- Rodrigues, A.S.L.; Grenyer, R.; Baillie, J.E.M.; Bininda-Emonds, O.R.P.; Gittlemann, J.L.; Hoffmann, M.; Safi, K.; Schipper, J.; Stuart, S.N.; Brooks, T. Complete, Accurate, Mammalian Phylogenies Aid Conservation Planning, but Not Much. Philos. Trans. R. Soc. Lond. B Biol. Sci. 2011, 366, 2652–2660. [Google Scholar] [CrossRef] [PubMed]
- Sobral, F.L.; Jardim, L.; Lemes, P.; Machado, N.; Loyola, R.; Cianciaruso, M.V. Spatial Conservation Priorities for Top Predators Reveal Mismatches among Taxonomic, Phylogenetic and Functional Diversity. Nat. Conserv. 2014, 12, 150–155. [Google Scholar] [CrossRef]
- Hu, R.; Gu, Y.; Luo, M.; Lu, Z.; Wei, M.; Zhong, J. Shifts in Bird Ranges and Conservation Priorities in China under Climate Change. PLoS ONE 2020, 15, e0240225. [Google Scholar] [CrossRef]
- Li, B.B.V.; Pimm, S.L. China’s Endemic Vertebrates Sheltering under the Protective Umbrella of the Giant Panda. Conserv. Biol. 2016, 30, 329–339. [Google Scholar] [CrossRef]
- Guo, Z.; Li, Z.; Cui, G. Effectiveness of National Nature Reserve Network in Representing Natural Vegetation in Mainland China. Biodivers. Conserv. 2015, 24, 2735–2750. [Google Scholar] [CrossRef]
- Locke, H.; Ellis, E.C.; Venter, O.; Schuster, R.; Ma, K.; Shen, X.; Woodley, S.; Kingston, N.; Bhola, N.; Strassburg, B.B.N.; et al. Three Global Conditions for Biodiversity Conservation and Sustainable Use: An Implementation Framework. Natl. Sci. Rev. 2019, 6, 1080–1082. [Google Scholar] [CrossRef] [PubMed]
- Liu, J.G.; Diamond, J. China’s Environment in a Globalizing World. Nature 2005, 435, 1179–1186. [Google Scholar] [CrossRef] [PubMed]
- Liang, X.Y.; Jin, X.B.; Zhu, F.W.; He, J.; Zhang, X.L.; Zhang, M.Z.; Fan, Y.P.; Hu, J.; Zhou, Y.K. Reflection on Delimiting Ecological Protection Red Line (Eprl) in Middle-Lower Yangtze Plain: A Case Study of Jiangsu Province. Acta Ecol. Sin. 2020, 40, 5968–5979. [Google Scholar]
- Sun, B.; Lu, Y.; Yang, Y.; Yu, M.; Yuan, J.; Yu, R.; Bullock, J.M.; Stenseth, N.C.; Li, X.; Cao, Z.; et al. Urbanization Affects Spatial Variation and Species Similarity of Bird Diversity Distribution. Sci. Adv. 2022, 8, eade3061. [Google Scholar] [CrossRef]
- Ren, Y.F.; Fang, C.L.; Lin, X.Q. Evaluation of Ecological Efficiency of the Four Major Urban Agglomerations in the Eastern Coastal Region of China. Acta Geogr. Sin. 2017, 72, 2047–2060. [Google Scholar]
- Fang, C.L. Progress and the Future Direction of Research into Urban Agglomeration in China. Acta Geogr. Sin. 2014, 69, 1130–1144. [Google Scholar]
- Barter, M. Shorebirds of the Yellow Sea: Importance, Threats and Conservation Status; Wetlands International Global Series 9; International Wader Studies 12; Wetlands International: Canberra, Australia, 2002. [Google Scholar]
- Murray, N.J.; Clemens, R.S.; Phinn, S.R.; Possingham, H.P.; Fuller, R.A. Tracking the Rapid Loss of Tidal Wetlands in the Yellow Sea. Front. Ecol. Environ. 2014, 12, 267–272. [Google Scholar] [CrossRef]
- Chan, Y.C.; Peng, H.B.; Han, Y.X.; Chung, S.S.W.; Li, J.; Zhang, L.; Piersma, T. Conserving Unprotected Important Coastal Habitats in the Yellow Sea: Shorebird Occurrence, Distribution and Food Resources at Lianyungang. Glob. Ecol. Conserv. 2019, 20, e00724. [Google Scholar] [CrossRef]
- Xia, S.X.; Yu, X.B.; Millington, S.; Liu, Y.; Jia, Y.F.; Wang, L.Z.; Hou, X.Y.; Jiang, L.G. Identifying Priority Sites and Gaps for the Conservation of Migratory Waterbirds in China’s Coastal Wetlands. Biol. Conserv. 2017, 210, 72–82. [Google Scholar] [CrossRef]
- Duan, H.L.; Yu, X.B.; Shi, J.B.; Lei, J.Y.; Xia, S.X. Identifying Conservation Priority Sites and Gap for the Waterbirds Habitat Along Coastal Wetlands in Mainland China. Acta Ecol. Sin. 2021, 41, 9574–9580. [Google Scholar]
- Conklin, J.; Verkuil, Y.; Smith, B. Prioritizing Migratory Shorebirds for Conservation Action on the East Asian-Australasian Flyway. WWF Hong Kong. 2014. Available online: http://awsassets.wwfhk.panda.org/downloads/wwf_prioritization_finalpdf.pdf (accessed on 19 December 2022).
- Bai, Q.Q.; Chen, J.Z.; Chen, Z.H.; Dong, G.T.; Dong, J.T.; Dong, W.X.; Fu, V.W.K.; Han, Y.X.; Lu, G.; Li, J.; et al. Identification of Coastal Wetlands of International Importance for Waterbirds: A Review of China Coastal Waterbird Surveys 2005–2013. Avian Res. 2015, 6, 12. [Google Scholar] [CrossRef]
- Wang, X.; Chen, Y.; Melville, D.S.; Choi, C.-Y.; Tan, K.; Liu, J.; Li, J.; Zhang, S.; Cao, L.; Ma, Z. Impacts of Habitat Loss on Migratory Shorebird Populations and Communities at Stopover Sites in the Yellow Sea. Biol. Conserv. 2022, 269, 109547. [Google Scholar] [CrossRef]
Disclaimer/Publisher’s Note: The statements, opinions and data contained in all publications are solely those of the individual author(s) and contributor(s) and not of MDPI and/or the editor(s). MDPI and/or the editor(s) disclaim responsibility for any injury to people or property resulting from any ideas, methods, instructions or products referred to in the content. |
© 2025 by the authors. Licensee MDPI, Basel, Switzerland. This article is an open access article distributed under the terms and conditions of the Creative Commons Attribution (CC BY) license (https://creativecommons.org/licenses/by/4.0/).