Article

Modeling Wolf, Canis lupus, Recolonization Dynamics to Plan Conservation Actions Ahead: Will the “Big Bad Wolves” Howl Again in Slavonia, Croatia?

1
EKONERG—Energy Research and Environmental Protection Institute Ltd., Koranska 5, 10000 Zagreb, Croatia
2
BIOTA Ltd., Maksimirska Cesta 129/5, 10000 Zagreb, Croatia
3
Croatian Institute of Biodiversity, Maksimirska Cesta 129/5, 10000 Zagreb, Croatia
4
Department of Biology, Faculty of Science, University of Zagreb, Rooseveltov trg 6, 10000 Zagreb, Croatia
5
Ethology Unit, Department of Biology, University di Pisa, Via Luca Ghini 13, 56126 Pisa, Italy
6
Faculty of Veterinary Medicine, University of Calgary, Calgary, AB T2N 4Z6, Canada
7
CNRS 6249 Chrono-Environnement, Université Marie et Louis Pasteur, 25030 Besançon, France
*
Author to whom correspondence should be addressed.
Diversity 2025, 17(7), 461; https://doi.org/10.3390/d17070461
Submission received: 1 June 2025 / Revised: 23 June 2025 / Accepted: 25 June 2025 / Published: 28 June 2025
(This article belongs to the Special Issue Wildlife in Natural and Altered Environments)

Abstract

A century ago, wolves ranged throughout Croatia but were eradicated from Slavonia—a region that could serve as a crucial corridor connecting the Carpathian and Dinaric–Balkan wolf populations. Such a corridor would promote genetic exchange and help maintain ecosystem stability. Recent wolf sightings in Slavonia indicate that natural recolonization may be possible. Understanding how this process unfolds under different management scenarios is essential for minimizing conflicts and supporting successful recolonization. In this study, we modeled wolf population dynamics in Slavonia and surrounding areas using 11 scenarios, grouped into three categories: adverse events, increased carrying capacity, and population supplementation. These scenarios encompassed various management strategies, including a baseline scenario and others designed to address system uncertainties. Our results show that scenarios involving corridor construction and wolf translocation have the lowest probability of extinction. In contrast, adverse events carry a high risk of extinction, and simply expanding suitable habitats is not enough to ensure population viability. These findings underscore the importance of integrated conservation strategies that combine habitat corridors, population management, and conflict mitigation. Long-term planning is critical, as differences in outcomes become more pronounced over time. Connectivity with stable neighboring populations is vital for the long-term survival of wolves in the region. Future research should investigate whether protected areas alone are sufficient to sustain wolves as apex predators or if large-scale ecosystem restoration—including trophic rewilding—is necessary for successful recolonization.

1. Introduction

Forecasting the spatiotemporal dynamics of recolonizing species presents a formidable challenge, made even more complex by the wide array of diverse and intricate factors that can influence species during the recolonization process [1]. Predicting the trajectory of species recovery—specifically recolonization—is especially difficult, as it is shaped by a multitude of factors, ranging from indirect uncertainties to direct management interventions [2,3,4]. These influences include changes in habitat conditions, such as shifts in land-use [5] or climate patterns [6]. Additionally, direct impacts on the abundance of various animal taxa may also result from interspecific competition [7], the spread of diseases [8,9], fluctuations in immigration or emigration rates [10,11], and active management actions [12]. Nevertheless, population projections remain a valuable tool for assessing how uncertainties affect species recolonization, supporting managers in their efforts to restore populations and clarify legal status [13]. Ecological studies [14,15,16] have identified several key factors linked to wolf occupancy and pack persistence, including increased forest cover, lower human population density, higher elk density, and reduced sheep density. Despite ongoing difficulties in defining the spatial and temporal dimensions of species recolonization, investigating the potential for their return is essential for developing effective management strategies [17]. This is particularly important for preparing local communities for the possible return of species [18], especially large carnivores that have long been absent from the area. Moreover, analyzing the spatial and temporal aspects of recolonization supports the creation of action plans and conflict resolution strategies while also helping communities understand and adapt to coexistence with returning species [18]. Around the world, successful wolf recolonization initiatives have utilized a variety of approaches, including traditional methods such as livestock guarding dogs and range riders [19], community-based conservation promoting sustainable resource use [20], and technical solutions like timed calving and electric fencing [21]. These efforts have been further strengthened by integrated approaches that combine stakeholder engagement and compensation programs [22], cultural integration through religious leadership [23], and structured dialogue projects for effective wolf management [24]. Together, these examples illustrate the effectiveness of combining technical solutions (e.g., guard dogs and fencing), economic incentives (compensation), social engagement (community involvement and education), cultural integration (religious and cultural values), and communication strategies (dialogue facilitation). Drawing on these global experiences in wolf conservation and recolonization, we assessed the potential for wolf recolonization in Croatia, where the species has experienced a complex history of decline and partial recovery across various regions.
Three of the four European large carnivore species are found in Croatia: the gray wolf (Canis lupus), the brown bear (Ursus arctos), and the Eurasian lynx (Lynx lynx). Wolf populations in Croatia began to decline in the late 19th century. Hunting records from 1894 show that at least one wolf was killed in each county that year, indicating that wolves once inhabited the entire territory of what is now the Republic of Croatia [25]. By the early 1990s, however, wolves survived only in Gorski Kotar and Lika [26], which together account for just 11% of Croatia’s land area (Figure 1). After the 1990s, wolf numbers increased, most likely due to reduced hunting pressure [25]. In 2001, wolves recolonized southern Croatia (Dalmatia) and occasionally appeared further north on the southern slopes of the Velebit mountain range, as well as in the Peripannonian region, including Sisak-Moslavina County [27]. Between 2001 and 2008, wolves established populations in central Croatia (the Banovina region) and in Karlovac County, but they did not return to the eastern part of the country (the Slavonia region, the Croatian segment of the Pannonian Basin), where they were historically present [25].
Slavonia encompasses extensive semi-natural habitats that remain in relatively good ecological condition, characterized by abundant prey for wolves, major rivers, the Slavonian Highlands, and a low human footprint resulting from post-war abandonment. Although the Slavonian Highlands are isolated and surrounded by human-modified open landscapes that wolves typically avoid, the expansion of areas undergoing ecological succession is creating new, potentially suitable habitats for wolf recolonization [28]. Habitat suitability modeling has also identified several areas in Slavonia as highly suitable for large carnivores [29], and wolf sightings reported in Slavonia during 2020 (unpublished data from Papuk Nature Park) further support these predictions.
Based on this evidence, we hypothesized that Slavonia could be a suitable region for the establishment of a stable wolf population [29]. To test this, we aimed to predict wolf recolonization trends in the area by the following methods: (i) applying an existing wolf population dynamics model to estimate potential recolonization outcomes under 11 different management and land-use scenarios; (ii) comparing scenario outcomes over 10, 30, and 100 years; and (iii) identifying potential conservation actions to reduce the risk of local extinction in recolonized areas.

2. Materials and Methods

2.1. Study Area

The Pannonian Basin, also referred to as the Pannonian Plain or Carpathian Basin, is a vast and relatively flat landform in Central Europe. This geomorphological unit extends across several countries, including Hungary, Croatia, Serbia, Slovakia, Austria, and Romania. In this study, the focus is on the Croatian portion of the Pannonian Basin and the adjacent Peripannonian area, which encompasses the region of Slavonia and parts of its neighboring territories (Figure 2). For the purposes of this research, the study area is designated as Slavonia. This region is bordered by the Drava River to the north, the Danube River to the east, the Sava River to the south, and the Moslavačka Gora hills to the west, covering approximately 15,000 km2. Slavonia includes 12 Special Protection Areas (SPAs) established under the Bird Directive (2009/147/EC), 63 Sites of Community Importance (SCIs) under the Habitats Directive (92/43/EEC), and 52 areas protected by the Croatian Nature Protection Act (“Official Gazette” No. 80/13, 15/18, 14/19, 127/19). The dominant habitats in this area are agricultural and forested landscapes, interspersed with patches of anthropogenic peri-urban environments (Figure 2). The forests are primarily composed of temperate broadleaf species, including mixed oak–hornbeam (Quercus robur, Carpinus betulus) forests, pure hornbeam (Carpinus betulus) stands, Central European acidophilic cypress oak forests with common birch (Betula pendula) and Turkey oak (Quercus cerris), floodplain Hungarian oak (Quercus frainetto) forests, as well as mesophilic and neutrophilic pure beech (Fagus sylvatica) forests.
There are currently no documented permanent wolf packs in the study area; however, researchers from the Papuk Nature Park Public Institution (unpublished data) have recorded the presence of at least one individual. The medium-sized carnivore guild in the region includes the golden jackal (Canis aureus), red fox (Vulpes vulpes), and badger (Meles meles [30]. Potential prey for wolves consists of roe deer (Capreolus capreolus), red deer (Cervus elaphus), fallow deer (Dama dama), wild boar (Sus scrofa), and European hare (Lepus europaeus) [30]. In addition, several domestic species—such as cattle, horses, donkeys, goats, sheep, and pigs—are present; while these animals are not free-roaming, they graze in the area and may occasionally become prey for wolves.
To assess anthropogenic disturbance within the study area, changes in anthropogenic habitats—including residential and industrial zones (such as villages, cities, non-industrial, and industrial areas)—were evaluated using Croatia’s habitat maps from 2004 [31] and 2016 [32] through GIS analysis in QGIS software (version 3.32.3).

2.2. Projection Model

We employed a combination of modeling approaches for the Population and Habitat Viability Assessment [33], with a primary focus on stochastic modeling techniques, supplemented by spatially explicit, demographic, catastrophic, and management models [1]. Key components of the stochastic models used in this research include the following: (i) Spatially Explicit Models: These models identify key habitats, assess habitat suitability for the species, and evaluate the impacts of habitat fragmentation and land-use changes. (ii) Demographic Models: These capture demographic variability at the population level, representing the structure and dynamics of the population based on characteristics such as age-specific survival and reproduction rates. (iii) Management and Conservation Models: These models evaluate scenarios involving harvesting, supplementation (such as translocations and reintroductions), habitat management, and other conservation interventions. (iv) Catastrophe Models: These simulate the frequency, severity, and types of catastrophic events (e.g., natural disasters and disease outbreaks) and their effects on the population. Importantly, our modeling approach is individual-based, meaning each animal in the population is simulated separately, with attributes such as age and sex. Genetic models were not included in this research due to insufficient available data. All simulations were conducted using VORTEX software, version 10.6.0 [34].
Vortex enables model parameterization and extinction probability prediction across 13 categories reflecting species ecology and management strategies: Scenario Settings, Species Description, State Variables, Reproductive System, Reproductive Rates, Mortality Rates, Catastrophes, Mate Monopolization, Initial Population Size, Carrying Capacity, Harvest, Supplementation, and Genetics. Parameters related to baseline population dynamics—Species Description, Reproductive System, Reproductive Rates, and Mortality Rates—were sourced from the existing literature (see Supplementary Materials S1—References [27,35,36,37,38,39]). The remaining parameters, including Scenario Settings, Catastrophes, Initial Population Size, Carrying Capacity, Harvest, and Supplementation, were assigned predefined values for simulation purposes. For each scenario, estimates of population growth and extinction probability were generated, focusing primarily on changes in habitat carrying capacity while also incorporating variations modeled through the Vortex categories of Catastrophes, Harvest, and Supplementation. A detailed explanation of how these category values were defined and the specific scenarios in which they were applied is provided in the scenario description below. All parameter values are reported in Supplementary Materials S1.

2.3. Scenarios

In this study, we modeled 11 different scenarios: a baseline scenario and 10 alternative scenarios, which were organized into three groups (Table 1). Although there are no records of permanent wolf packs in the study area and only a single individual wolf has been observed, we set the initial population size as a pair for all scenarios. The categories State Variables, Mate Monopolization, and Genetics were not explicitly modeled and were instead left at their default settings in all scenarios. For the Scenario Settings category, each simulation consisted of 1000 replicates and was run over three distinct timeframes: 10, 30, and 100 years.
The baseline scenario simulated the wolf population based solely on the carrying capacity of the modeled area. The remaining 10 scenarios were parameterized to reflect variations in catastrophes, carrying capacity, harvest levels, and supplementation efforts.
The first group of three scenarios represented adverse events—situations that could lead to a population decline relative to the baseline scenario. The second group comprised three scenarios involving an increased carrying capacity. The third group included four scenarios focused on supplementing the wolf population. Of the ten alternative scenarios depicting changes in population size, seven were designed as management interventions, while the remaining three addressed system uncertainty. All spatial analyses were performed using GIS in QGIS software (version 3.32.3).

2.4. Statistical Analysis

To compare results across our modeled scenarios, we analyzed the number of simulations in which populations went extinct (calculated as the inverse of survival rates) from 1000 replicates over three time periods (10, 30, and 100 years). Data were generated annually for all 11 scenarios. First, we tested the extinction counts for normality using the Shapiro–Wilk test. Since the data violated parametric assumptions, non-parametric alternatives were employed [40]. We used the Kruskal–Wallis test followed by Dunn’s post hoc tests to determine whether recolonization success (inverse of extinction counts) differed significantly between scenarios. These analyses were conducted for four datasets: the 10-year model, 30-year model, 100-year model, and a combined dataset incorporating all timeframes. Additionally, Principal Component Analysis (PCA) with a covariance matrix was performed on the combined dataset to identify potential groupings among scenarios based on extinction patterns [41]. This approach allowed us to reduce complex data into principal components, revealing which scenarios and timeframes contributed most significantly to species conservation. PCA was applied separately to the 10-year, 30-year, and 100-year datasets, as well as the combined dataset.
All analyses were performed using Past software (version 2024.5.0.2), while result visualizations were created with Microsoft Excel (version 365) and Statistica (version 13.3).

3. Results

This section is divided into three subsections, each corresponding to simulation results over 10-year, 30-year, and 100-year periods. Each subsection follows a consistent structure: to facilitate comparison, results for the baseline scenario are presented first, followed by outcomes for the remaining simulated scenarios. Comprehensive results and output summaries for all scenarios across all three timeframes are available in Supplementary Materials S2–S4. Figure 3 displays a box plot illustrating the distribution of the number of simulations in which populations became extinct across the 11 different scenarios.

3.1. The 10-Year Simulation Period

In the baseline scenario, the extinction probability was 0.26 (SE = 0.01, SD = 1.82), with a mean time to first extinction of 2.6 years (SE = 0.11, SD = 1.82). Surviving populations maintained an average of 14.1 individuals (SE = 0.13, SD = 3.58), consisting of 7 males and 7.1 females. Prior to reaching the carrying capacity limits, the mean population growth rate—expressed as the proportional increase—was 0.238 (SE = 0.003, SD = 0.271).
Among scenarios in the “Adverse Events” group, Scenario 2 (“Disease”) showed the highest extinction probability across all scenarios at 0.32 (SE = 0.01, SD = 2.25). Scenarios 3 (“Removals”) and 4 (“Illegal Hunting”) shared identical extinction probabilities of 0.29 (SE = 0.01, SD = 2.13). The mean time to first extinction ranged from 2.7 years (“Illegal Hunting”, SE = 0.13, SD = 2.14) to 3 years (“Disease”, SE = 0.13, SD = 2.25). Surviving populations maintained an average of 13.5–13.8 individuals, with the lowest count in “Illegal Hunting” (SE = 0.12, SD = 3.25) and the highest in “Disease” (SE = 0.14, SD = 3.79). Sex ratios varied, with males numbering 6.3 (“Removals”) to 6.9 (“Disease”), and females numbering 6.8 (“Illegal Hunting”) to 7.5 (“Removals”). Prior to reaching the carrying capacity limits, the mean population growth rate in the baseline scenario spanned 0.194 (“Illegal Hunting”, SE = 0.03, SD = 0.28) to 0.226 (“Disease”, SE = 0.003, SD = 0.28).
For scenarios in the “Carrying Capacity” group, all three scenarios (5: “Succession”, 6: “Forest Management”, and 7: “Hunting Management”) showed nearly identical extinction probabilities. Scenarios 5 and 6 had an extinction probability of 0.27, while Scenario 7 (“Hunting Management”) had a slightly higher probability of 0.28. The mean time to first extinction ranged from 2.8 years (“Forest Management”, SE = 0.12, SD = 1.93) to 3.1 years (“Succession”, SE = 0.14, SD = 2.29). Surviving populations maintained an average of 14.9–16.4 individuals, with the lowest count in “Forest Management” (SE = 0.14, SD = 3.88) and the highest in “Hunting Management” (SE = 0.16, SD = 4.41). Sex ratios varied, with males numbering 7.5 (“Forest Management”) to 8.2 (“Hunting Management”) and females numbering 7.6 (“Forest Management”) to 8.2 (“Hunting Management”). Prior to reaching the carrying capacity limits, the baseline scenario’s mean growth rate ranged from 0.224 (“Succession”, SE = 0.003, SD = 0.28) to 0.24 (“Hunting Management”, SE = 0.003, SD = 0.27).
Within the “Population Supplementation” group, extinction probabilities ranged from 0 (in Scenario 9: Corridor Construction and Scenario 11: Translocation) to 0.28 (in Scenario 10: Two-Region Corridor Enhancement). In Scenario 9 (“Corridor Construction”), 18 simulations experienced extinction at least once, but each was followed by a successful recolonization, with no further extinction occurring thereafter. In Scenario 11 (“Translocation”), 15 simulations went extinct at least once, but 19 recolonizations were recorded, followed by four additional extinction events. The mean time to first extinction in this group ranged from 2.6 years for “Two-Region Corridor Enhancement” (SE = 0.11, SD = 1.88) to 2.9 years for “One-Region Corridor Enhancement” (SE = 0.17, SD = 2.03). The mean number of individuals in extant populations varied from 14.4 in “Two-Region Corridor Enhancement” (SE = 0.12, SD = 3.23) to 16.9 in “Corridor Construction” (SE = 0.04, SD = 1.36), with the number of males ranging from 7.2 to 8.5 and females from 7.2 to 8.4, depending on the scenario. When analyzing the entire period prior to reaching the carrying capacity, the mean population growth rate ranged from 0.23 in “Two-Region Corridor Enhancement” (SE = 0.003, SD = 0.27) to 0.32 in “Corridor Construction” (SE = 0.003, SD = 0.3).

3.2. The 30-Year Simulation Period

In the baseline scenario, the extinction probability was 0.29 (SE = 0.01), with a mean time to first extinction of 3.3 years (SE = 0.18, SD = 3.05). Surviving populations maintained an average of 15.7 individuals (SE = 0.06, SD = 1.56), comprising 7.8 males and 7.9 females. Prior to reaching the carrying capacity limits, the mean population growth rate—expressed as a proportional increase—was 0.2 (SE = 0.001, SD = 0.2).
Within the “Adverse Events” group, the “Disease” scenario showed the highest probability of extinction among all scenarios at 0.32 (SE = 0.01). The “Removals” and “Illegal Hunting” scenarios followed with extinction probabilities of 0.28 (SE = 0.11) and 0.27 (SE = 0.01), respectively. The mean time to first extinction ranged from 3.1 years for “Illegal Hunting” (SE = 0.15, SD = 2.50) to 3.7 years for “Removals” (SE = 0.21, SD = 3.59). Surviving populations maintained an average of 14.9–15.4 individuals, with the lowest count in “Illegal Hunting” (SE = 0.06, SD = 1.51) and the highest in “Disease” (SE = 0.08, SD = 2.11). Sex ratios varied, with males numbering 6.5 (“Removals”) to 7.8 (“Disease”) and females numbering 7.4 (“Illegal Hunting”) to 8.6 (“Removals”). Prior to reaching the carrying capacity limits, the baseline scenario’s mean growth rate spanned 0.09 (“Illegal Hunting”, SE = 0.001, SD = 0.2) to 0.2 (“Disease”, SE = 0.001, SD = 0.23).
Within the “Carrying Capacity” group, all three scenarios exhibited nearly identical extinction probabilities: 0.29 for “Succession” (SE = 0.01, SD = 0.22) and “Forest Management” (SE = 0.01, SD = 0.24) and 0.25 for “Hunting Management” (SE = 0.01, SD = 0.26).
The mean time to first extinction ranged from 3.2 years (“Succession”, SE = 0.17, SD = 2.85) to 3.5 years (“Forest Management”, SE = 0.21, SD = 3.55). Surviving populations averaged 16.7–18.8 individuals, with the lowest count in “Forest Management” (SE = 0.06, SD = 1.67) and the highest in “Hunting Management” (SE = 0.06, SD = 1.60). Sex ratios varied slightly, with males numbering 8.3 (“Forest Management”) to 9.4 (“Hunting Management”) and females numbering 8.4 (“Forest Management”) to 9.4 (“Hunting Management”). Prior to reaching the carrying capacity limits, the baseline scenario’s mean growth rate spanned 0.213 (“Forest Management”, SE = 0.0014, SD = 0.2092) to 0.219 (“Hunting Management”, SE = 0.001, SD = 0.2).
Within the “Population Supplementation” group, extinction probabilities ranged from 0, as seen in both the “Corridor Construction” and “Translocation” scenarios, to 0.29 in the “Two-Region Corridor Enhancement” scenario. In the “Corridor Construction” scenario, there were 16 simulations in which extinction occurred at least once; however, these were followed by 20 recolonizations, with 4 subsequent re-extinctions. In the “Translocation” scenario, 27 simulations experienced extinction at least once, but 28 recolonizations occurred, followed by 1 additional re-extinction. The mean time to first extinction in this group ranged from 2.9 years in the “One-Region Corridor Enhancement” scenario (SE = 0.17, SD = 2.20) to 3.6 years in the “Corridor Construction” scenario (SE = 0.64, SD = 2.55). The mean number of individuals in extant populations varied from 15.7 in the “Two-Region Corridor Enhancement” scenario (SE = 0.06, SD = 1.71) to 16.9 in the “Corridor Construction” scenario (SE = 0.04, SD = 1.40), with the number of males ranging from 7.9 to 8.4 and females ranging from 7.8 to 8.5, depending on the scenario. When analyzing the entire period before reaching carrying capacity truncation, the mean population growth rate ranged from 0.21 in the “Two-Region Corridor Enhancement” scenario (SE = 0.001, SD = 0.21) to 0.24 in the “Corridor Construction” scenario (SE = 0.001, SD = 0.21).

3.3. The 100-Year Simulation Period

In the baseline scenario, the extinction probability was 0.29 (SE = 0.01, SD = 7.29), with a mean time to first extinction of 3.9 years (SE = 0.46, SD = 7.74). Surviving populations maintained an average of 15.8 individuals (SE = 0.06, SD = 1.58), distributed as 7.8 males and 7.9 females. Prior to reaching the carrying capacity limits, the mean population growth rate—expressed as a proportional increase—was 0.20 (SE = 0.001, SD = 0.18).
Within the “Adverse Events” group, the “Removals” scenario showed the highest probability of extinction across all scenarios at 0.35 (SE = 0.02). The “Disease” and “Illegal Hunting” scenarios followed with identical extinction probabilities of 0.32 (SE = 0.01). The mean time to first extinction ranged from 4.1 years (“Illegal Hunting”, SE = 0.50, SD = 9.01) to 6.9 years (“Disease”, SE = 0.83, SD = 14.84). Surviving populations maintained an average of 14.8–15.5 individuals, with the lowest count in “Illegal Hunting” (SE = 0.06, SD = 1.64) and the highest in “Disease” (SE = 0.08, SD = 2.11). Sex ratios varied, with males numbering 6.5 (“Removals”) to 7.8 (“Disease”) and females numbering 7.3 (“Illegal Hunting”) to 8.7 (“Removals”). Prior to reaching the carrying capacity limits, the baseline scenario’s mean growth rate spanned 0.06 (“Illegal Hunting”, SE = 0.001, SD = 0.17) to 0.2 (“Disease”, SE = 0.001, SD = 0.20).
Within the “Carrying Capacity” group, extinction probabilities ranged from 0.26 (“Forest Management”, SE = 0.01, SD = 0.31) to 0.30 (“Succession”, SE = 0.01, SD = 0.2). The mean time to first extinction spanned 3.2 years (“Succession”, SE = 0.18, SD = 3.05) to 3.7 years (“Forest Management”, SE = 0.34, SD = 5.52). Surviving populations maintained an average of 16.8–18.9 individuals, with the lowest count in “Forest Management” (SE = 0.06, SD = 1.65) and the highest in “Hunting Management” (SE = 0.05, SD = 1.43). Sex ratios varied slightly, with males numbering 8.3 (“Forest Management”) to 9.5 (“Hunting Management”) and females numbering 8.5 (“Forest Management”) to 9.4 (“Hunting Management”). Prior to reaching the carrying capacity limits, the baseline scenario’s mean growth rate ranged from 0.21 (“Forest Management”, SE = 0.001, SD = 0.18) to 0.214 (“Hunting Management”, SE = 0.001, SD = 0.17).
Within the “Population Supplementation” group, extinction probabilities ranged from 0 in both the “Corridor Construction” and “Translocation” scenarios to 0.29 in the “Two-Region Corridor Enhancement” scenario. In the “Corridor Construction” scenario, 16 simulations experienced extinction at least once, but these were followed by 19 recolonizations, with three subsequent re-extinctions. The “Translocation” scenario saw 19 simulations go extinct at least once, followed by 22 recolonizations and three additional re-extinctions. The mean time to first extinction ranged from 3.1 years in the “Translocation” scenario (SE = 0.34, SD = 1.49) to 3.9 years in the “Corridor Construction” scenario (SE = 1.35, SD = 5.39). The mean number of individuals in extant populations varied from 15.7 in the “Two-Region Corridor Enhancement” scenario (SE = 0.06, SD = 1.62) to 17.0 in the “Corridor Construction” scenario (SE = 0.04, SD = 1.32), with the number of males ranging from 7.9 to 8.6 and females ranging from 7.8 to 8.5, depending on the scenario. When analyzing the entire period before reaching carrying capacity truncation, the mean population growth rate ranged from 0.21 in the “Two-Region Corridor Enhancement” scenario (SE = 0.001, SD = 0.17) to 0.22 in the “Corridor Construction” scenario (SE = 0.001, SD = 0.18).

3.4. Statistics

The Kruskal–Wallis test results revealed three distinct scenario groupings based on their impact on population extinction across 10-year, 30-year, and 100-year simulation periods, as well as in the combined dataset. Specifically, Scenarios 9 (“Corridor Construction”) and 11 (“Translocation”) exhibited the lowest extinction rates (0.00). Scenarios 1–7 showed similar patterns, with extinction occurring in 250–300 simulations on average, while Scenario 8 displayed intermediate values (mean ≈ 130 simulations) (Figure 3). This distribution pattern persisted across all timeframes—10-year, 30-year, 100-year, and combined models—with scenario groupings remaining consistent regardless of temporal scale, as illustrated in Figure 3. Statistical analysis confirmed significant differences between scenarios in general across all model durations: 10-year (H(10, N = 121) = 53.71, p < 0.001), 30-year (H(10, N = 341) = 227.70, p < 0.001), 100-year (H(10, N = 1111) = 963.89, p < 0.001), and combined models (H(10, N = 1573) = 1082.17, p < 0.001), consistently showing the same pattern of scenario groupings regardless of the modeling timeframe. Dunn’s post hoc tests highlighted significant differences (p < 0.05) between Scenarios 9/11 and all other scenarios, while no significant differences emerged among other scenario pairs.
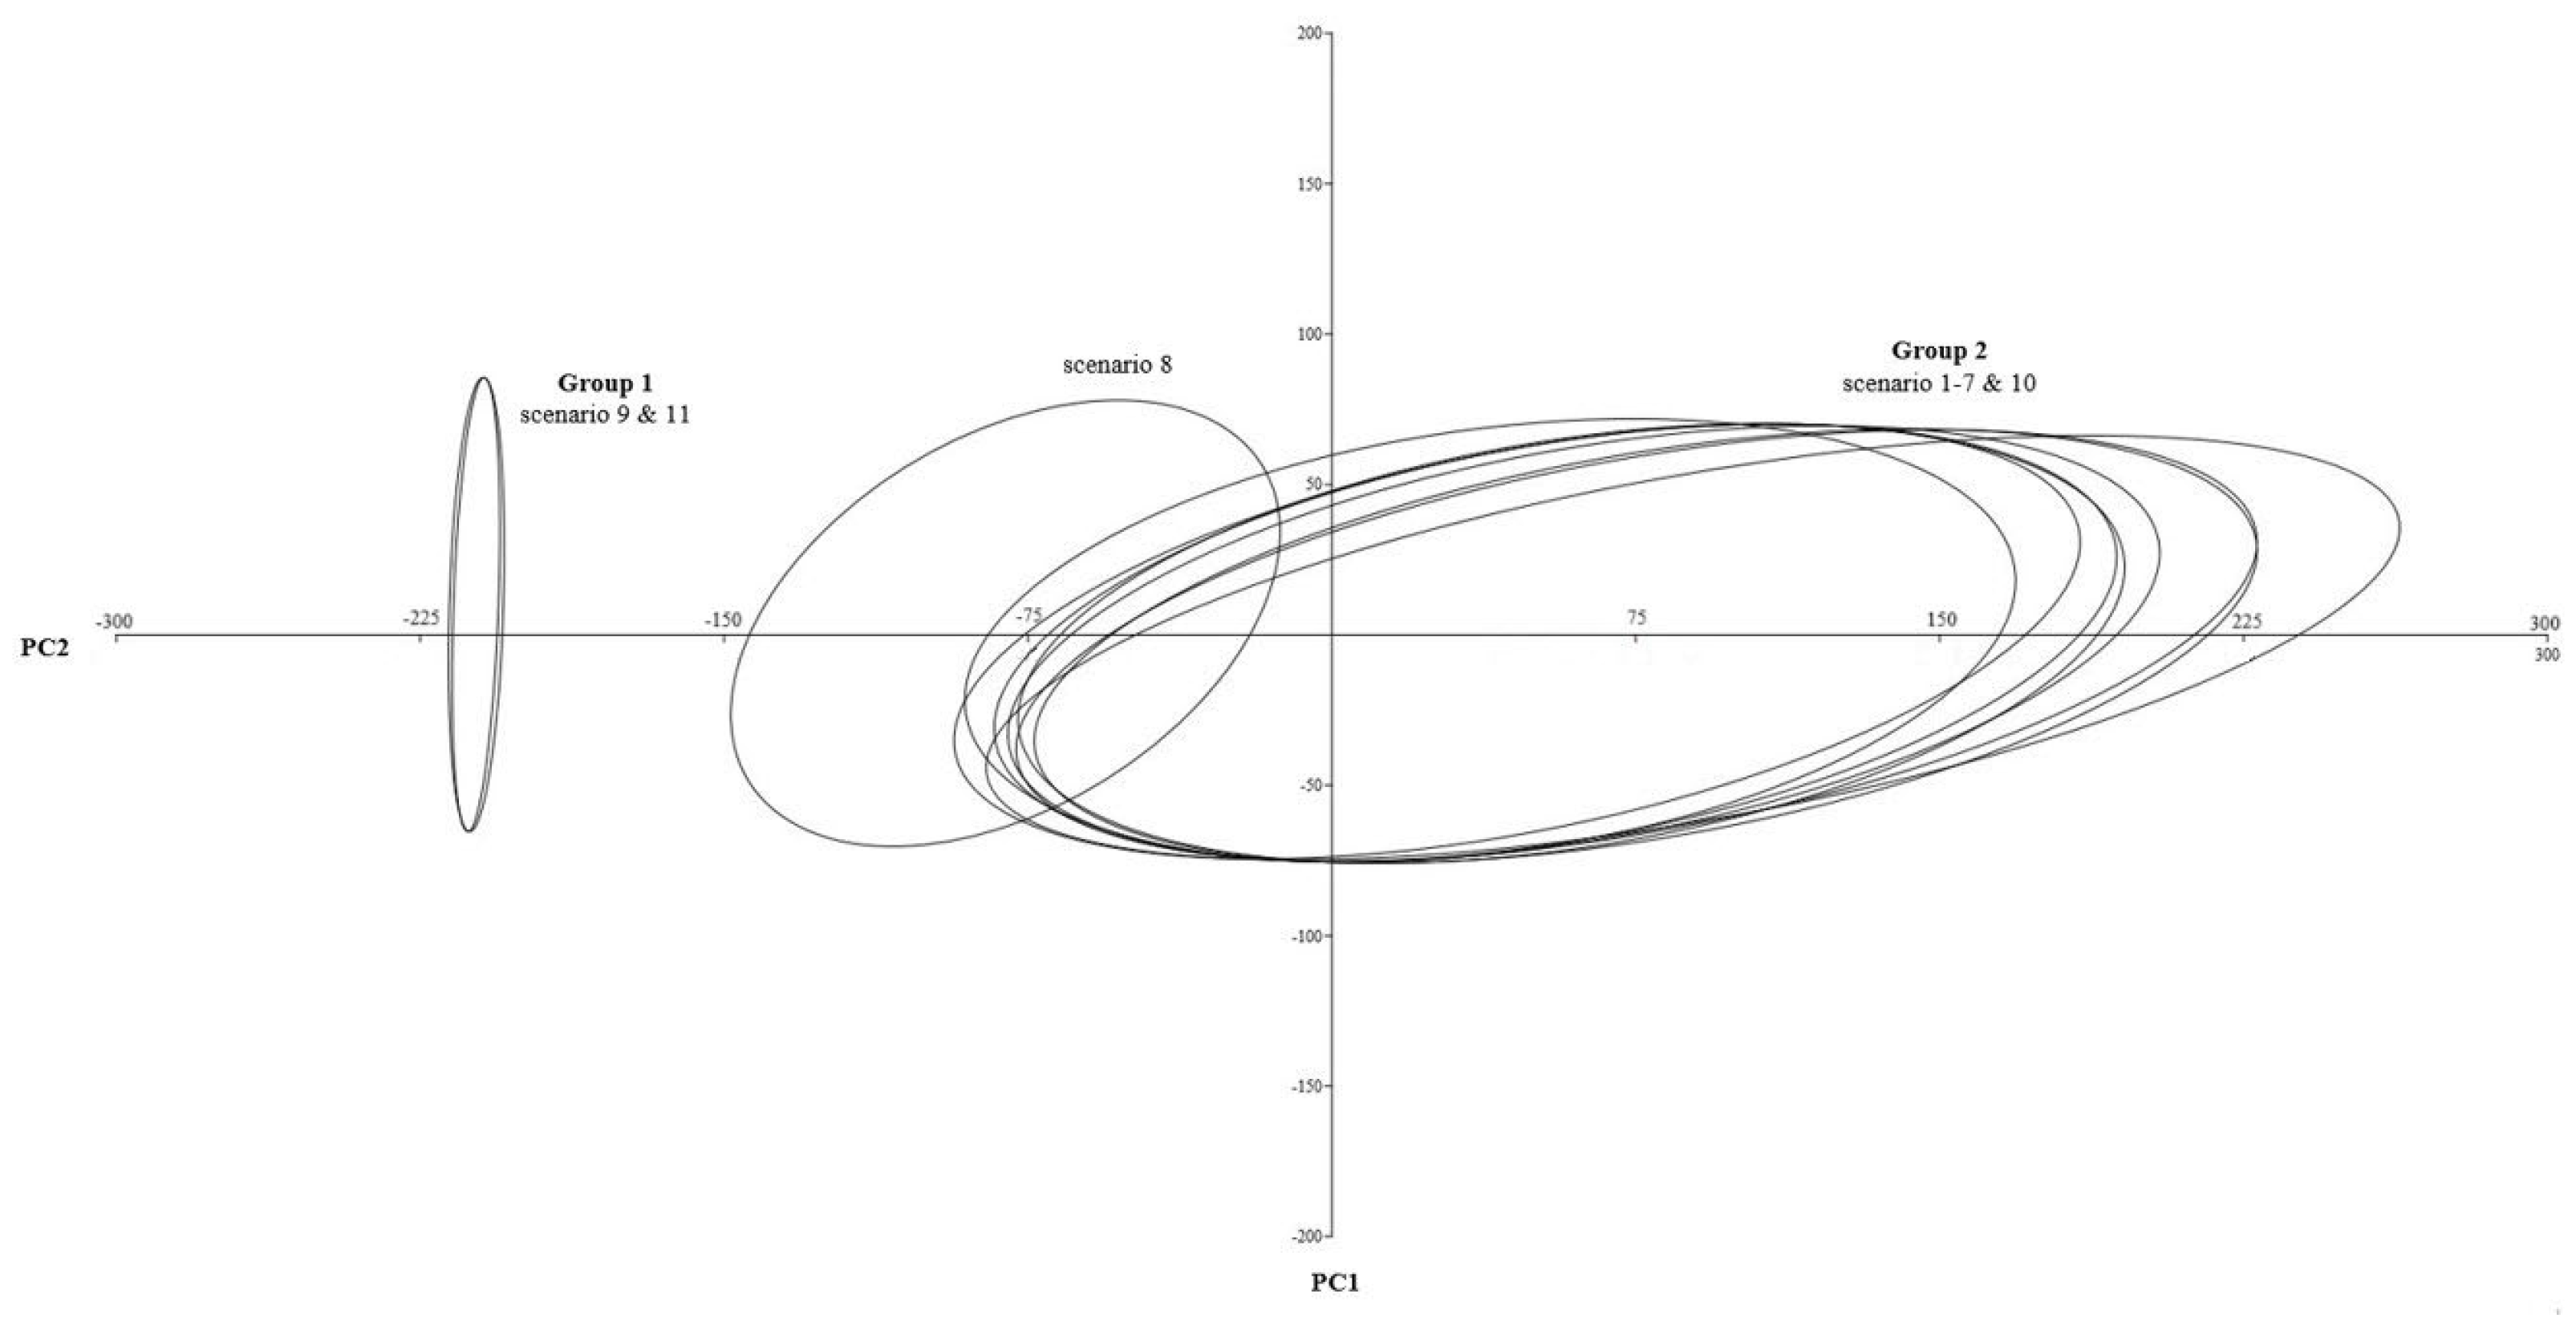
Principal Component Analysis (PCA) was conducted to assess the relationships between scenarios, years, the number of simulations in which populations became extinct, and the mean size of extant populations, across four datasets: the 10-year, 30-year, and 100-year models, as well as the combined dataset of all the models. Detailed results are provided in Supplementary Materials S5. The analysis resulted in three principal components for each dataset. The first two components (PC1 and PC2) together explained more than 99% of the variability across all time periods, while PC3 accounted for less than 0.1% of the variance. The loading matrix indicated that the number of extinct populations had the highest loading on PC1 (0.999), whereas the year variable had the highest loading on PC2 (0.997), demonstrating that these two variables were primarily responsible for the grouping of scenarios. The visualization of the PCA results for the combined dataset of all models revealed a clear clustering of scenarios into three distinct groups: scenarios 9 and 11 formed one cluster, Scenario 8 appeared as an isolated group, and the remaining scenarios clustered together. This pattern of scenario grouping remained consistent across all three individual datasets (10-, 30-, and 100-year models), as illustrated in Figure 4.

4. Discussion

We explored 11 different scenarios to evaluate the recolonization potential of wolves in Slavonia, considering habitat changes, immigration, translocation, harvest, and disease—within both managed and unmanaged contexts—using an existing population projection framework for wolves [1].
The analyses showed that corridor construction and translocation contributed to optimal population viability, with zero recorded extinctions across all timeframes (10, 30, and 100 years). In contrast, the remaining scenarios exhibited significantly higher extinction risks, averaging over 27%—suggesting that passive or limited interventions may be inadequate for ensuring long-term persistence. Without corridor construction, only translocation consistently prevented extinction, while even other habitat-focused measures (e.g., increased carrying capacity) failed to do so. This underscores how habitat fragmentation constrains recolonization success and amplifies the impact of adverse events such as disease, illegal hunting, and human–wolf conflict. These findings highlight the critical importance of proactive, connectivity-enhancing strategies and point to the urgent need for more data on ecological, demographic, and health-related factors that shape recolonization dynamics. We acknowledge that certain model parameters—such as adjustments to carrying capacity and translocation success rates—were based on expert judgment due to limited empirical data, introducing uncertainty that may affect the precision of long-term projections. To improve model reliability and support more informed conservation decisions, future empirical studies should aim to validate and refine these parameters. In the following discussion, we analyze each scenario group in greater detail, examining their underlying assumptions, outcomes, and implications for conservation planning.
While the model produced various outputs, including survival rates and population sizes, extinction risk was considered the most relevant metric for assessing population viability and guiding conservation strategies. This is because recovery criteria inevitably involve normative decisions—such as defining what level of extinction risk is acceptable [42]. Although neither U.S. nor EU legislation provides explicit quantitative thresholds for what constitutes an “acceptable” extinction risk, this study adopted a 10% threshold, consistent with recent approaches in species conservation planning [43]. Statistical analyses in this study revealed that extinction risk was the lowest—i.e., within an “acceptable” range—for two scenarios: Scenario 9 (Corridor Construction) and Scenario 11 (Translocation). A third scenario, Scenario 8 (One-Region Corridor Enhancement), approached the default threshold but did not match the performance of the top scenarios. Notably, Scenarios 9 and 11 exhibited statistically significant reductions in extinction events across all three modeled time periods (10, 30, and 100 years) when compared to other scenarios. The consistent effectiveness of these two scenarios over time underscores their robustness and long-term sustainability, positioning them as best-practice strategies for future management plans with the highest potential for ensuring wolf population persistence. Although Scenario 8 demonstrated a positive trend, further adjustments are needed for it to achieve outcomes comparable to the leading scenarios. Additionally, as the modeled time horizon increased, a greater number of scenarios showed statistically significant differences favoring population survival. This indicates that conservation measures tend to be more effective over extended periods. These findings underscore the importance of long-term implementation, with the most favorable outcomes occurring in the medium- (30 years) and long-term (100 years) projections. According to the literature, wolf populations in different regions have exhibited varying recovery timeframes following protection or reintroduction measures: 5–10 years in Yellowstone [44], 10–15 years in Poland [45] and the American Southwest [46], 15–20 years in Scandinavia [47], and 20–30 years in the Apennines [48]. Therefore, the effects of planned conservation measures require time to manifest. Future research should aim to establish standardized extinction risk thresholds across legislative frameworks and to identify key factors influencing corridor enhancement in order to improve the effectiveness of Scenario 8 and align its outcomes with those of the more successful Scenarios 9 and 11.
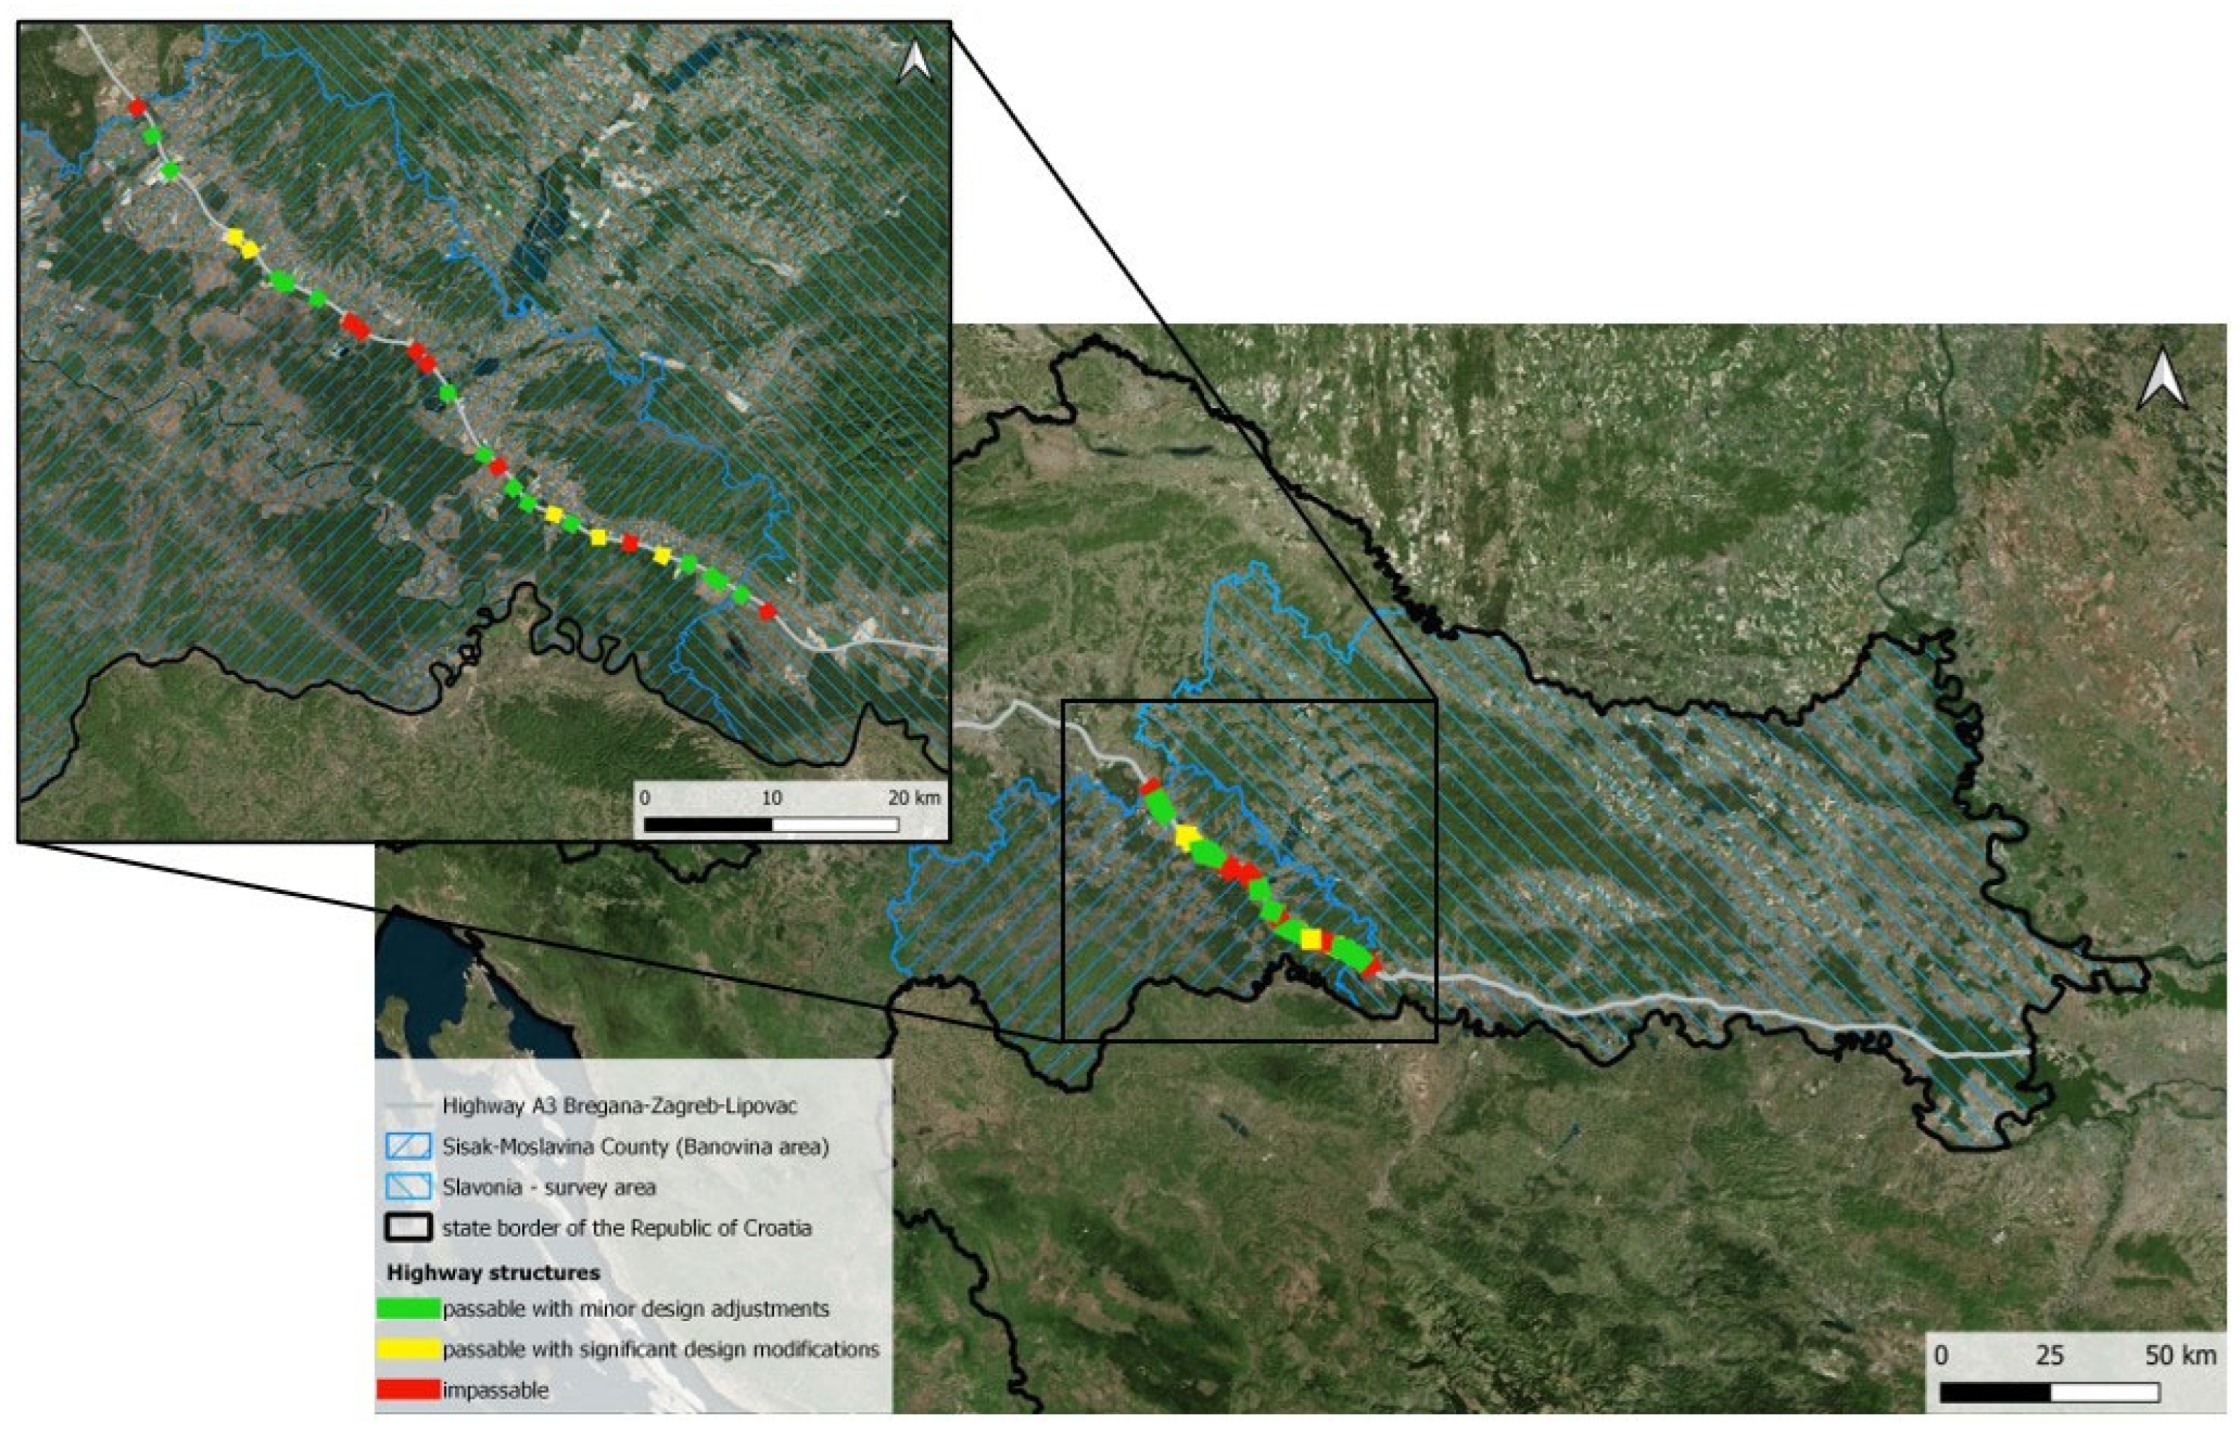
The time required to observe significant changes in wolf populations following recolonization efforts depends on various factors, including habitat quality, prey availability, human–wildlife interactions, and management strategies. As Scenarios 9 (“Corridor Construction”) and 11 (“Translocation”) involved the improvement and expansion of ecological corridors, the results suggest that habitat connectivity plays a crucial role in the successful recolonization of wolves within the study area. Habitat connectivity facilitates movement between suitable habitats, supports the maintenance of genetic diversity within populations [48,49], and enhances survival and range expansion by providing access to essential resources such as prey and shelter [50,51]. In the study area, the primary barrier to habitat connectivity is the highway. However, spatial analysis conducted in this study identified 27 existing highway structures (e.g., underpasses) that could facilitate wolf recolonization from the Banovina region toward Slavonia (Figure 5). Among these, eight highway structures are likely passable for wolves in their current state with only minor design adjustments, while an additional five could become suitable with more substantial modifications. Although baseline scenario modeling indicates that the study area has the capacity to support a wolf population for a limited period, there is currently no established population in Slavonia, as wolves were historically extirpated from the region [25]. A likely reason for the absence of natural recolonization is the presence of highways, which are not fully passable for wolves due to inadequate infrastructure. These highways have effectively isolated the Slavonia region (the modeled area) from Banovina, where a stable wolf population currently exists. Additional contributing factors may include illegal hunting, competition with other predators (likely golden jackals [52]), limited prey availability, and broader human–wildlife conflicts. As an initial step, it is essential to modify existing highway structures to function as wildlife passages. Such interventions could mitigate the effects of habitat fragmentation and create the conditions necessary for wolf recolonization in adjacent habitats. The most plausible dispersal route for wolves would likely originate in Banovina, potentially serving as a source population for establishing new packs in Slavonia. In subsequent phases of this research, in addition to recommending modifications to existing highway infrastructure, it will be crucial to assess the entire potential corridor between Banovina and Slavonia. This assessment should aim to identify and enhance specific areas or habitat features that may currently act as barriers to the wolf movement. Particular attention should be given to the availability of small, forested patches that can serve as resting sites, which have been shown to facilitate long-distance wolf dispersal [53]. In line with our findings and the identification of 27 existing highway structures (Figure 5), we recommend prioritizing a detailed spatial analysis to determine the most suitable sites for the construction or adaptation of wildlife crossings. Although eight of these structures appear potentially suitable with only minor modifications, selecting strategic locations—based on criteria such as proximity to core habitats, existing landscape permeability, and minimal human disturbance—is critical for effective mitigation planning. Accordingly, future research should focus on developing a corridor suitability model that incorporates landscape connectivity metrics and on mapping priority sites for crossing enhancement or new construction. This spatial planning effort should be accompanied by updated maps highlighting high-potential dispersal zones and key crossing points. Such visual tools would not only guide infrastructure adaptations but also support evidence-based conservation policymaking and implementation at national and regional levels. On the other hand, population supplementation through translocation can enhance genetic diversity [54,55], facilitate population recovery by enabling wolves to recolonize their historical range more rapidly [51,54], and compensate for natural losses caused by mortality, dispersal (emigration), and inter-pack competition [56]. Given Slavonia’s potential connectivity with the Banovina wolf population, mitigating habitat fragmentation—particularly caused by highways—should be prioritized over direct translocation efforts. Establishing a continuous habitat link between these two suitable areas would allow for ongoing population renewal and genetic exchange without the need for active animal translocation. The findings of this study align with the principles of trophic rewilding and reflect successful wolf recolonization patterns observed across North America and Europe [57,58,59,60].
The remaining seven scenarios modeled in this study exhibited extinction risks exceeding 27%. Diseases can not only cause direct mortality but also indirectly reduce recolonization rates, particularly among juveniles [61,62]. Additionally, research from Minnesota indicates that natural wolf mortality rates are significantly lower than human-caused mortality [63]. Illegal wolf hunting results in ecosystem disruption, the fragmentation of family groups, interference with reproduction, and reduced population growth [64,65]. Wolves inhabiting German military training areas demonstrated higher survival rates compared to those in similar habitats outside these areas [66], suggesting that illegal killings may be influenced by land ownership, with hunting practices potentially functioning as population regulators. If this pattern continues, the future distribution and abundance of European wolves may be driven more by mortality-related source–sink dynamics than by habitat availability alone. The removal of a dominant wolf during human–wildlife conflicts destabilizes packs, causing increased stress, territorial instability, and decreased reproductive success [64,67]. In Croatia and Bosnia and Herzegovina, 96.5% of wolf deaths between 1986 and 2001 were human-caused, primarily from shooting (91.6%) and traffic incidents (8.4%)—predominantly affecting young individuals, with an average age at death of only 1.9 years. Only a single case (1.2%) was attributed to natural causes (intraspecific aggression), and two cases (2.3%) remained of unknown cause [27]. In wolf populations that are not heavily impacted by human activities, up to 65–70% of wolf mortality is due to intraspecific aggression [68,69], suggesting that mortality patterns in Croatia deviate significantly from natural dynamics. Therefore, future research should focus on identifying effective measures to reduce wolf mortality caused by human activities.
Beyond direct human-caused mortality, additional emerging threats to wolf survival have been documented. In Italy, widespread exposure to anticoagulant rodenticides has been detected in wolf carcasses, posing a significant conservation concern [70]. Similarly, parasitic infections should not be overlooked. Studies from France and Italy suggest that parasite invasions in wolves may be linked to environmental contamination from domestic dog feces, as well as factors such as diet composition and wolf population density [71]. These conditions can facilitate the transmission of pathogens or parasites, such as Echinococcus or Toxocara, especially in areas with high densities of free-ranging dogs or substantial human disturbance. Furthermore, our model does not incorporate genetic variability or inbreeding dynamics due to limited empirical data. Nevertheless, genetic threats—including wolf–dog hybridization—pose significant risks to the genetic integrity and long-term viability of wolf populations in the region. A Croatian study [72] using microsatellites, mitochondrial DNA, and Y-chromosome markers combined with phenotypic data found that 2.8% of the tested wild canids were confirmed hybrids. All hybrids were detected in Dalmatia—an area characterized by high anthropogenic disturbance and recent wolf recolonization. These hybrids are the result of mating between female wolves and male dogs. Notably, hybrids tend to be more synanthropic and are more prone to attacking livestock, potentially exacerbating human–wildlife conflicts [73]. Although toxicological, parasitological, and genetic data are currently lacking for Croatia, including the Slavonia region, these issues should be addressed in future necropsy and monitoring protocols. Given the likelihood of similar ecological interactions being observed in neighboring countries—such as environmental pollution, proximity to human settlements, and the presence of free-ranging dogs, future research should not only monitor dispersal and habitat connectivity but also systematically assess body condition, causes of mortality, parasite loads, toxicological exposure, and signs of hybridization in recolonizing individuals. While no hybrid cases have yet been recorded in Slavonia, the risk persists due to shared ecological conditions and the absence of a stable wolf population. Therefore, ongoing genetic monitoring is essential to prevent hybrid establishment, safeguard the species’ genetic integrity, and inform long-term conservation and recolonization strategies. Integrative health and genetic assessments are critical for accurately evaluating population viability and should be prioritized alongside spatial and demographic analyses. Although adverse scenarios predict high extinction risks, even habitat enlargement scenarios (i.e., increased carrying capacity) entail significant extinction risks. Despite changes in hunting regulations, forest management, or natural succession—all contributing to expanded wolf habitats compared to the baseline scenario—the risk of extinction remains unacceptably high. This aligns with previous findings showing that a limited habitat size increases resource competition, reduces prey availability, and restricts space for breeding [74]. Therefore, it can be concluded that the presence and spatial arrangement of wolf habitats—characterized by a minimal poaching risk and sufficient size to support breeding territories connected by corridors—are likely critical for population persistence.
Beyond the impacts identified in this study, research by Carricondo-Sanchez [75] has highlighted several additional significant factors that could influence the success of wolf recolonization, including altered prey behavior and human-related activities. Deer, as a primary prey species, may become more cautious and avoid areas frequently used by wolves. Such behavioral changes can substantially affect the spatial distribution and movement patterns of prey populations, thereby influencing wolf recolonization dynamics [76]. Anthropogenic factors, such as human activities and landscape modifications, also play a crucial role in shaping wolf behavior and distribution. Understanding how human presence impacts wolves is essential for developing effective conservation and recolonization strategies. In the context of the study area, further urbanization and the abandonment of rural lands are expected. Given that wolves have been absent from the region for approximately a century and that livestock farms are currently not adapted to predator presence, an increase in human–wolf conflicts can be anticipated once wolves begin to recolonize the area. Therefore, preparing local communities through education and inclusive engagement is vital to mitigate potential conflicts and promote coexistence. Additionally, it is important to acknowledge the growing focus within the scientific community on climate change-driven impacts. Changes in habitat suitability and prey availability due to climate change pose significant challenges for wolf recolonization [33]. Predictions for the Slavonia region indicate shifts in forest ecosystems [77], suggesting a transition from one forest type to another. Nonetheless, forests—a critical habitat for wolves—are expected to remain prevalent within the study area.
Lastly, it is important to discuss the crucial factors for the successful recolonization of wolves: sociopolitical factors including human–wolf conflict, public perception, and policy interventions. While this aspect could not be directly modeled in this research, the authors emphasize that effectively managing people’s attitudes and implementing adaptive policy interventions are indispensable for successful recolonization efforts when planning wolf recolonization in an area [78]. Human–wolf conflicts arise from various factors, including livestock predation, competition for game species, and concerns about potential direct attacks on humans [79]. Media coverage and outreach campaigns play a significant role in shaping public opinion. Bišćan and Damjanović [80] analyzed media portrayals of wolves in the Croatian daily press from 2012 to 2022. Their findings showed that 56% of the coverage depicted wolves negatively, while only 39% included input from large-animal experts. This raises important questions about why wolves are often portrayed negatively and how many reported incidents are genuinely attributable to wolves. Furthermore, a comprehensive analysis [81] of 5440 large carnivore attacks worldwide from 1950 to 2019 reveals that the socioeconomic context significantly influences the occurrence of such incidents. In high-income countries, recreational activities are the primary risk factor, whereas in low-income countries, attacks are more often linked to livelihood activities. Their findings highlight the predominance of bear attacks in Europe, while wolf attacks remain rare and typically involve scenarios with dogs or injured animals. While acknowledging the potential risks associated with wolf encounters, it is important to put the data into context. In Europe and North America, only eleven recorded wolf attacks resulting in two fatalities occurred over an 18-year period. Given the estimated populations of approximately 60,000 wolves in North America and 15,000 in Europe coexisting with hundreds of millions of people, the risk of a wolf attack, although present, is statistically negligible [82]. In Montana, USA, wolf populations grew from 2007 to 2020 before stabilizing, while incidents of livestock predation by wolves remained minimal throughout this period [83]. Moreover, understanding local coexistence narratives is crucial for developing effective management plans for wolf recolonization. Pettersson et al. [18] identified three key discourses: the wolf protectionist discourse, which prioritizes wolf autonomy through the strict regulation of human activities; the traditional use discourse, emphasizing human-centered control over wolf populations; and the pragmatic discourse, which advocates balancing conservation goals with local priorities and the equitable sharing of costs and benefits. Integrating these perspectives is essential, as spatial and temporal models underscore the importance of collaboration, trust-building, and inclusive strategies. Educating communities about the ecological role of wolves and proactively mitigating conflicts remain vital in areas with potential wolf recolonization. Equally important are stakeholder involvement and adaptive management strategies, which complement ecological data to ensure long-term success.

5. Conclusions

This study utilized spatially and temporally detailed projection models to assess the potential for wolf recolonization in the Croatian segment of the Pannonian Basin. The results consistently showed that scenarios involving corridor construction and translocation had the lowest extinction probabilities across all modeled timeframes, with scenario outcomes diverging more distinctly over longer periods, underscoring the importance of long-term conservation planning. Moreover, spatial analysis identified 27 existing highway structures that could facilitate wolf movement between Banovina and Slavonia, highlighting the vital role of habitat connectivity in successful recolonization. Scenarios categorized as “adverse events”, including disease outbreaks, illegal hunting, and human–wolf conflicts, presented high extinction risks, while habitat expansion alone was insufficient, emphasizing the necessity of an integrated approach combining corridors, population management, and conflict mitigation. Future research should aim to optimize corridor effectiveness, explore sociopolitical factors influencing conservation success, and develop strategies to expand trophic rewilding efforts across diverse geographic regions. Additionally, the systematic monitoring of wolf presence and active stakeholder engagement, especially with livestock farmers and hunters, will be essential for achieving successful long-term conservation outcomes.

Supplementary Materials

The following supporting information can be downloaded at: https://www.mdpi.com/article/10.3390/d17070461/s1. References [27,35,36,37,38,39] in Tables S1–S5 are cited in the Supplementary Material.

Author Contributions

Conceptualization, M.B. and D.J.; methodology, M.B., D.J. and I.M.; software, M.B., D.J. and I.M.; investigation, M.B.; formal analysis, M.B., D.J. and I.M.; validation, M.B., D.J., I.M. and A.M.; writing—original draft preparation, M.B.; writing—review and editing, D.J., I.M. and A.M.; visualization, M.B., D.J. and I.M.; supervision, D.J., I.M. and A.M.; project administration, M.B. All authors have read and agreed to the published version of the manuscript.

Funding

This research received no external funding.

Institutional Review Board Statement

Not applicable.

Data Availability Statement

All data generated or analyzed during this study are included in this published article.

Acknowledgments

The first author would like to thank EKONERG—Energy Research and Environmental Protection Institute Ltd. for their support. This research is part of the first author’s PhD project. We would like to thank Adam Peter Maguire for English language revision.

Conflicts of Interest

Author Matko Bišćan was employed by the company EKONERG—Energy Research and Environmental Protection Institute Ltd. Author Dušan Jelić was employed by the company BIOTA Ltd. The remaining authors declare that the research was conducted in the absence of any commercial or financial relationships that could be construed as a potential conflict of interest..

Abbreviations

The following abbreviations are used in this manuscript:
PCAPrincipal Component Analysis
SCISites of Community Importance
SDStandard Deviation
SEStandard Error
SPAsSpecial Protection Areas

Appendix A

Appendix A offers a detailed description of each simulation scenario, outlining the assumptions, parameter adjustments, and the rationale behind their design.
Baseline scenario (S1)
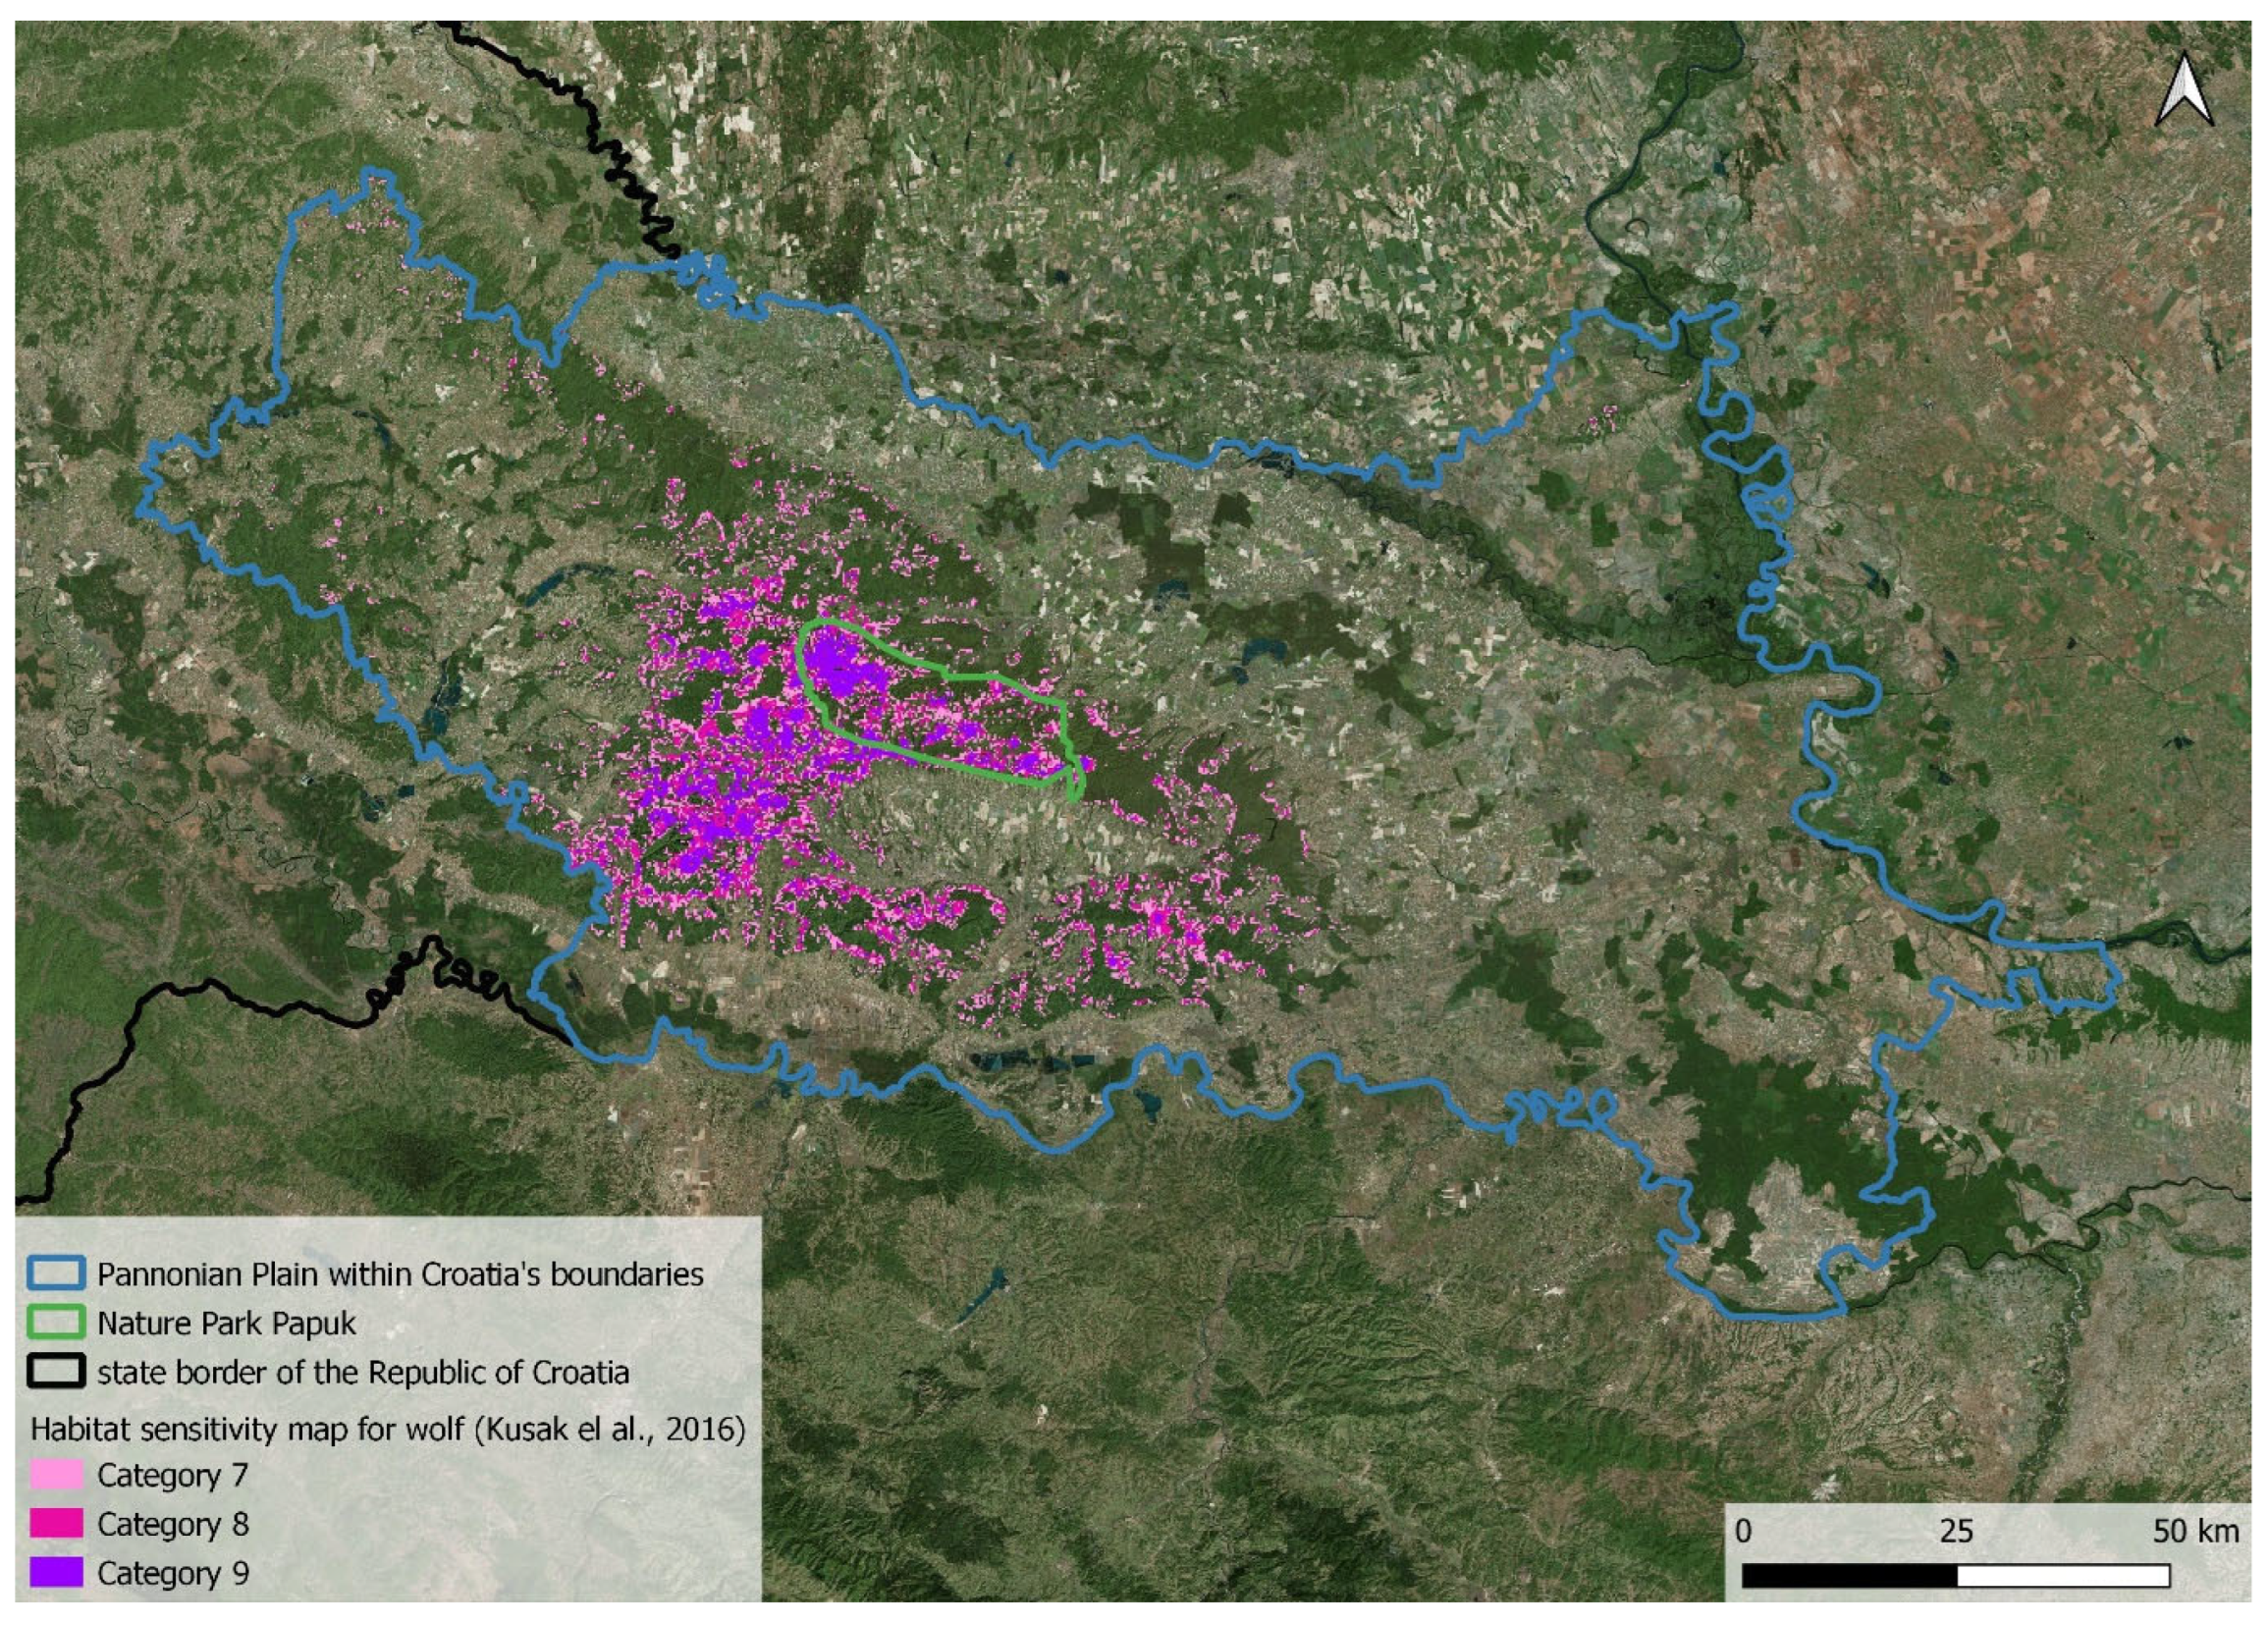
The baseline scenario (Scenario 1) modeled the wolf population according to the carrying capacity of the study area. This carrying capacity estimate was based on a habitat suitability map for wolves [29], which classified areas into categories 7, 8, and 9—where category 9 represents the highest suitability (Figure A1). Within the study area, these combined categories cover a total of 1076 km2. Based on the literature [84], we calculated the baseline carrying capacity for wolves in this area to be 16 individuals, which was used as the initial population size to start the model.
Figure A1. Habitat suitability map for wolves in Slavonia. The study area is outlined by the Republic of Croatia’s state border (black line) and the Slavonia survey area (blue line). Habitat suitability categories [29] are shown in ascending order of habitat quality: category 7 (light pink), category 8 (medium pink), and category 9 (dark purple). Nature Park Papuk is also indicated.
Diversity 17 00461 g0a1
Group 1—Adverse events scenarios (S2–S4)
The first group of modeled scenarios (Scenarios 2–4) represents adverse events that could reduce the population compared to the baseline scenario. For all these scenarios, the carrying capacity remained the same as in the baseline—16 individuals. Scenario 2 (“Disease”) anticipated a 50% population reduction. This scenario maintained the baseline carrying capacity but incorporated the risk of a catastrophic disease outbreak, with a survival rate of 0.5. Disease outbreaks, such as those caused by canine parvovirus or distemper, were assumed to occur randomly between year 1 and the end of the simulation. Based on the literature [85], the modeled frequency was 14% per generation, corresponding to a 0.14 probability over a 100-year period. Scenario 3 (“Removals”) involved the annual removal of one individual (harvest = 1 animal per year) to simulate removals resulting from livestock attacks, settlement intrusions, aggressive behavior towards people, or a lack of fear of humans. The literature [86] suggests that male wolves may approach residential areas more frequently than females, so this scenario modeled the removal of one male. Scenario 4 (“Illegal Hunting”) simulated the poaching of two male wolves per year (harvest = 2 males).
Group 2—Carrying capacity scenarios (S5–S7)
The second group of scenarios (Scenarios 5–7) involves increasing the carrying capacity. All three use the wolf habitat suitability map as the baseline. Scenario 5 (“Succession”) analyzed changes in forest habitat area across three reference years (2012, 2015, and 2018). Data on forest and non-forest areas (broadleaved and coniferous forests) were obtained from the Copernicus High-Resolution Layer Forest Type. The baseline year, 2012, corresponds to the wolf habitat suitability map, while the other two years came from the Copernicus cadaster. The analysis showed that forest habitats within suitability categories 7, 8, and 9 expanded to 1183 km2—an increase of 107 km2. Based on previous studies [84], the baseline carrying capacity for wolves in Scenario 5 was calculated as 18 individuals, which also served as the initial population size for the model. Scenario 6 (“Forest Management”) simulated the effects of changing forest management practices to retain mature forests for longer periods. The aim was to delay final felling by 20 years, thereby increasing the extent of older forests suitable for wolves. In this scenario, forest areas were upgraded from habitat suitability category 6 to 7, from 7 to 8, and from 8 to 9, including the existing area in category 9. This was based on the 2004 Croatian forest habitat map [31], which underpinned the wolf habitat suitability map. The Papuk Nature Park was selected as the study area for this scenario, given that its protected status facilitates implementing such management changes. The analysis indicated an increase to 1116 km2 in categories 7, 8, and 9—an increase of 40 km2. Following [84], the carrying capacity for Scenario 6 was set at 17 wolves, which was also used as the initial population size. Scenario 7 (“Hunting Management”) modeled an increase in the carrying capacity by reducing hunting quotas for wolf prey. The hunting grounds in the study area were analyzed by calculating the percentage of each hunting ground covered by suitable wolf habitat (categories 7, 8, and 9). Hunting grounds where over 50% of the area fell within these categories were identified, covering 55% of all suitable habitats in the study area. We hypothesized that reducing the hunting quota for wolf prey by 20% in these grounds would lead to a corresponding 20% increase in the wolf carrying capacity. Based on this assumption, the baseline carrying capacity for wolves in Scenario 7 was calculated to be 19 individuals.
Group 3—Population supplementation scenarios (S8–S11)
The third group of scenarios (Scenarios 8–11) focuses on wolf population supplementation. The analysis centered on existing overpasses and underpasses, as well as potential modifications to highways, aimed at mitigating their barrier effect that separates the continuous wolf population in Banovina from the study area in Slavonia. These highway structures were initially identified using the Digital Orthophoto map (accessed via http://geoportal.dgu.hr/wms, accessed on 17 July 2023) through GIS analysis. Field visits were then conducted to verify these findings, followed by further GIS analysis to evaluate potential connecting corridors between Banovina and Slavonia using habitat maps from 2004 [31] and 2016 [32]. A total of 27 existing highway overpasses and underpasses were identified as potential pathways to support wolf recolonization from Banovina to Slavonia. These structures were categorized into three groups: impassable, potentially passable with significant design modifications, and potentially passable with minor design adjustments. They are considered potentially passable because, although not originally designed for large mammals, many include bridges and smaller overpasses over watercourses whose dimensions may still allow large mammals to cross. Of these, eight highway structures are potentially passable for wolves in their current state with only minor adjustments needed, while an additional five could be made suitable with more substantial design modifications. Accordingly, Scenario 8 (“One-Region Corridor Enhancement”) modeled the supplementation of the baseline Slavonian population with a single male wolf migrating from Banovina. The supplementation focused on a male wolf because males outnumber females among long-distance dispersers [87] and males tend to disperse more frequently than females [88]. Scenario 9 (“Corridor Construction”) involved supplementing the baseline Slavonian population with a pair of wolves from Banovina by improving existing highway structures to make them passable for wolves and potentially constructing new crossings. Scenario 10 (“Banovina and Bosnia and Herzegovina”) modeled the supplementation of the baseline Slavonian population with one male wolf from Banovina and one male wolf from Bosnia and Herzegovina, facilitated by enhancing existing highway structures to allow passage from both regions. Supplementation from Bosnia and Herzegovina is potentially more challenging because Slavonia (Croatia) and Bosnia and Herzegovina are separated not only by the highway mentioned earlier but also by the Sava River. In this scenario, wolves would need to either swim across the Sava River or use a bridge, then cross the highway. While the analysis of existing highway structures suggests crossing the highway is possible, crossing the Sava River remains uncertain. Although Blanco et al. [89] suggested that it might be feasible, this scenario was modeled as an additional, though unlikely, possibility. Scenario 11 (“Translocation”) represented the supplementation of the baseline Slavonian population with a pair of wolves translocated from a nearby Croatian region where wolves are continuously present. The carrying capacity for Scenarios 8 through 11 remained the same as in the baseline scenario.

References

  1. Petracca, L.S.; Converse, S.J.; Maletzke, B.T.; Gardner, B. Forecasting dynamics of a recolonizing wolf population under different management strategies. Anim. Conserv. 2023. [Google Scholar] [CrossRef]
  2. Coulson, T.; Mace, G.M.; Hudson, E.; Possingham, H. The Use and Abuse of Population Viability Analysis. Trends Ecol. Evol. 2001, 16, 219–221. [Google Scholar] [CrossRef] [PubMed]
  3. Ellner, S.P.; Fieberg, J.; Ludwig, D.; Wilcox, C. Precision of Population Viability Analysis. Conserv. Biol. 2002, 16, 258–261. [Google Scholar] [CrossRef] [PubMed]
  4. McCarthy, M.A.; Andelman, S.J.; Possingham, H.P. Reliability of Relative Predictions in Population Viability Analysis. Conserv. Biol. 2003, 17, 982–989. [Google Scholar] [CrossRef]
  5. Lawler, J.J.; Campbell, S.P.; Guerry, A.D.; Kolozsvary, M.B.; O’Connor, R.J.; Seward, L.C.N. The Scope and Treatment of Threats in Endangered Species Recovery Plans. Ecol. Appl. 2002, 12, 663–667. [Google Scholar] [CrossRef]
  6. Abrahms, B.; Rafiq, K.; Jordan, N.R.; McNutt, J.W. Long-term, climate-driven phenological shift in a tropical large carnivore. Proc. Natl. Acad. Sci. USA 2022, 119, e2121667119. [Google Scholar] [CrossRef]
  7. Elbroch, L.M.; Lendrum, P.E.; Newby, J.; Quigley, H.; Thompson, D.J. Recolonizing wolves influence the realized niche of resident cougars. Zool. Stud. 2015, 54, 41. [Google Scholar] [CrossRef]
  8. Rhodes, J.R.; Ng, C.F.; de Villiers, D.L.; Preece, H.J.; McAlpine, C.A.; Possingham, H.P. Using integrated population modelling to quantify the implications of multiple threatening processes for a rapidly declining population. Biol. Conserv. 2011, 144, 1081–1088. [Google Scholar] [CrossRef]
  9. Gordon, C.H.; Banyard, A.C.; Hussein, A.; Laurenson, M.K.; Malcolm, J.R.; Marino, J.; Regassa, F.; Stewart, A.M.E.; Fooks, A.R.; Sillero-Zubiri, C. Canine Distemper in Endangered Ethiopian Wolves. Emerg. Infect. Dis. 2015, 21, 824–832. [Google Scholar] [CrossRef]
  10. Lieury, N.; Besnard, A.; Ponchon, C.; Ravayrol, A.; Millon, A. Geographically isolated but demographically connected: Immigration supports efficient conservation actions in the recovery of a range-margin population of the Bonelli’s eagle in France. Biol. Conserv. 2016, 195, 272–278. [Google Scholar] [CrossRef]
  11. Grauer, J.A.; Gilbert, J.H.; Woodford, J.E.; Eklund, D.; Anderson, S.; Pauli, J.N. Modest immigration can rescue a reintroduced carnivore population. J. Wildl. Manag. 2019, 83, 567–576. [Google Scholar] [CrossRef]
  12. Saunders, S.P.; Cuthbert, F.J.; Zipkin, E.F. Evaluating population viability and efficacy of conservation management using integrated population models. J. Appl. Ecol. 2018, 55, 1380–1392. [Google Scholar] [CrossRef]
  13. Morris, W.F.; Doak, D.F. Quantitative Conservation Biology: Theory and Practice of Population Viability Analysis; Sinauer Associates, Inc. Publishers: Sunderland, MA, USA, 2002. [Google Scholar]
  14. Carroll, C.; Phillips, M.K.; Schumaker, N.H.; Smith, D.W. Impacts of landscape change on wolf restoration success: Planning a reintroduction program based on static and dynamic spatial models. Conserv. Biol. 2003, 17, 536–548. [Google Scholar] [CrossRef]
  15. Oakleaf, J.K.; Mack, C.; Murray, D.L.; Henger, C.S. Habitat selection by recolonizing wolves in the northern Rocky Mountains of the United States. J. Wildl. Manag. 2006, 70, 554–563. [Google Scholar] [CrossRef]
  16. Nelson, A.; Kauffman, K.; Middleton, A.; Jimenez, M.D.; McWhirter, D.E.; Barber, J.; Gerow, K. Elk migration patterns and human activity influence wolf habitat use in the Greater Yellowstone Ecosystem. Ecol. Appl. 2012, 22, 2293–2307. [Google Scholar] [CrossRef]
  17. Marucco, F.; McIntire, E.J.B. Predicting spatio-temporal recolonization of large carnivore populations and livestock depredation risk: Wolves in the Italian Alps. J. Appl. Ecol. 2010, 47, 789–798. [Google Scholar] [CrossRef]
  18. Pettersson, H.L.; Holmes, G.; Quinn, C.H.; Sait, S.M.; Blanco, J.C. Who Must Adapt to Whom? Contested Discourses on Human–Wolf Coexistence and Their Impact on Policy in Spain. People Nat. 2023, 5, 1989–2007. [Google Scholar] [CrossRef]
  19. Ausband, D.E.; Mech, L.D. The challenges of success: Future wolf conservation and management in the United States. BioScience 2023, 73, 587–591. [Google Scholar] [CrossRef]
  20. Distefano, E. Human-Wildlife Conflict Worldwide: Collection of Case Studies, Analysis of Management Strategies and Good Practices; Food and Agriculture Organization of the United Nations (FAO): Rome, Italy, 2005. [Google Scholar]
  21. Bruns, A.; Waltert, M.; Khorozyan, I. The effectiveness of livestock protection measures against wolves (Canis lupus) and implications for their co-existence with humans. Glob. Ecol. Conserv. 2020, 21, e00868. [Google Scholar] [CrossRef]
  22. European Commission. The situation of the wolf (Canis lupus) in the European Union. In European Commission Report; European Commission: Brussels, Belgium, 2023. [Google Scholar]
  23. Sonam, K.; Dorjay, R.; Lamo, S.; Bijoor, A. A community-based conservation initiative for wolves in the Ladakh Trans-Himalaya, India. Front. Ecol. Evol. 2022, 10, 809817. [Google Scholar] [CrossRef]
  24. Hansen, S.S.; Ejrnæs, R. Mediating human-wolves conflicts through dialogue, joint fact-finding and empowerment. Front. Environ. Sci. 2022, 10, 826351. [Google Scholar] [CrossRef]
  25. Štrbenac, A.; Kusak, J.; Huber, Đ.; Jeremić, J.; Oković, P.; Majić-Skrbinšek, A.; Vukšić, I.; Katušić, L.; Desnica, S.; Gomerčić, T.; et al. Plan Upravljanja Vukom u Republici Hrvatskoj za Razdoblje od 2010. do 2015; Ministarstvo kulture, Državni Zavod za Zaštitu Prirode: Zagreb, Croatia, 2010. (In Croatian) [Google Scholar]
  26. Frkovic, A.; Ruff, R.; Cicnjak, L.; Huber, D. Wolf mortality during 1946–86 in Gorski kotar, Croatia. IUGB Congr. 1992, 18, 353–358. [Google Scholar]
  27. Kusak, J. Conditions for Life of Wolves (Canis lupus L.) in Croatia. Ph.D. Thesis, University of Zagreb, Zagreb, Croatia, 2002. [Google Scholar]
  28. Leblond, M.; St-Laurent, M.H.; Côté, S.D. Wolf habitat selection is shaped by human activities in a highly managed boreal forest. For. Ecol. Manag. 2016, 276, 125–131. [Google Scholar]
  29. Kusak, J.; Huber, Đ.; Trenc, N.; Desnica, S. Stručni Priručnik za Procjenu Utjecaja Zahvata na Velike Zvijeri Pojedinačno te u Sklopu Planskih Dokumenata; Agencija za zaštitu okoliša: Zagreb, Croatia, 2016. (In Croatian) [Google Scholar]
  30. Doboš, M.; Pavić, G.; Kukić, G.; Sikora, Č.; Jušić, K.; Jelić, D. Istraživanje Faune na Papuku Pomoću Fotozamki (Siječanj 2022.–Ožujak 2023); Javna Ustanova Park Prirode Papuk: Voćin, Croatia, 2023. (In Croatian) [Google Scholar]
  31. Antonić, O.; Kušan, V.; Jelaska, S.; Bukovec, D.; Križan, J.; Bakran-Petricioli, T.; Gottstein-Matočec, S.; Pernar, R.; Hećimović, Ž.; Janeković, I.; et al. Kartiranje staništa Republike Hrvatske (2000–2004). Drypis 2005, 1. (In Croatian) [Google Scholar]
  32. Bardi, A.; Papini, P.; Quaglino, E.; Biondi, E.; Topić, J.; Milović, M.; Pandža, M.; Kaligarič, M.; Oriolo, G.; Roland, V.; et al. Karta Prirodnih i Poluprirodnih Ne-Šumskih Kopnenih i Slatkovodnih Staništa Republike Hrvatske; Ministarstvo Zaštite Okoliša i Energetike: Zagreb, Croatia, 2016. (In Croatian) [Google Scholar]
  33. Merli, E.; Mattioli, L.; Bassi, E.; Bongi, P.; Berzi, D.; Ciuti, F.; Luccarini, S.; Morimando, F.; Viviani, V.; Caniglia, R.; et al. Estimating wolf population size and dynamics by field monitoring and demographic models: Implications for management and conservation. Animals 2023, 13, 1735. [Google Scholar] [CrossRef]
  34. Lacy, R.C.; Pollak, J.P. Vortex: A Stochastic Simulation of the Extinction Process, (Version 10.6.0); Chicago Zoological Society: Brookfield, IL, USA, 2023. [Google Scholar]
  35. Chapron, G.; Wikenros, C.; Liberg, O.; Wabakken, P.; Flagstad, Ø.; Milleret, C.; Månsson, J.; Svensson, L.; Zimmermann, B.; Åkesson, M.; et al. Estimating Wolf (Canis lupus) Population Size from Number of Packs and an Individual-Based Model. Ecol. Evol. 2021, 11, 11739–11748. [Google Scholar] [CrossRef]
  36. Kajgana, I. Utjecaj Čovjeka na Aktivnost Velikih Sisavaca na Području Zrinskog Gorja (Diplomski Rad); Sveučilište u Zagrebu, Prirodoslovno-matematički fakultet: Zagreb, Croatia, 2015; Available online: https://urn.nsk.hr/urn:nbn:hr:217:230633 (accessed on 11 September 2023). (In Croatian)
  37. Platiša, M.; Pintar, I.; Kusak, J. Tjelesne osobine sivog vuka (Canis lupus L.). Veterinar 2011, 49. (In Croatian) [Google Scholar]
  38. Turinski, I. Međudjelovanje Velikih Predatora Hrvatske—Eurazijskog Risa (Lynx lynx L.) i Sivog Vuka (Canis lupus L.)—Kroz Odnose Predacije i Kompeticije (Diplomski Rad); Sveučilište Josipa Jurja Strossmayera u Osijeku, Odjel za biologiju: Osijek, Croatia, 2017. (In Croatian) [Google Scholar]
  39. Wikenros, C.; Gicquel, M.; Zimmermann, B.; Flagstad, Ø.; Åkesson, M. Age at First Reproduction in Wolves: Different Patterns of Density Dependence for Females and Males. Proc. R. Soc. B 2021, 288, 20210207. [Google Scholar] [CrossRef]
  40. Constable, P.; Hinchcliff, K.; Demma, N.; Callahan, M.; Dale, B. Serum biochemistry of captive and free-ranging gray wolves (Canis lupus). J. Zoo Wildl. Med. 1998, 29, 435–440. [Google Scholar]
  41. Jolliffe, I.T.; Cadima, J. Principal component analysis: A review and recent developments. Philos. Trans. R. Soc. A 2016, 374, 20150202. [Google Scholar] [CrossRef]
  42. Vucetich, J.A.; Nelson, M.P.; Phillips, M.K. The Normative Dimension and Legal Meaning of Endangered and Recovery in the U.S. Endangered Species Act. Conserv. Biol. 2006, 20, 1383–1390. [Google Scholar] [CrossRef] [PubMed]
  43. Carroll, C.; Lacy, R.C.; Fredrickson, R.J.; Rohlf, D.J.; Hendricks, S.A.; Phillips, M.K. Biological and sociopolitical sources of uncertainty in population viability analysis for endangered species recovery planning. Sci. Rep. 2019, 9, 10130. [Google Scholar] [CrossRef]
  44. Smith, D.W.; Peterson, R.O.; Houston, D.B. Yellowstone after wolves. BioScience 2003, 53, 330–340. [Google Scholar] [CrossRef]
  45. Smietana, W.; Wajda, W. Wolf number changes in Bieszczady National Park, Poland. Acta Theriol. 1997, 42, 241–252. [Google Scholar] [CrossRef]
  46. Bruskotter, J.T.; Vucetich, J.A.; Enzler, S.A.; Treves, A.; Nelson, M.P. Removing protections for wolves and the future of the U.S. Endangered Species Act (1973). Conserv. Lett. 2014, 7, 401–407. [Google Scholar] [CrossRef]
  47. Liberg, O.; Chapron, G.; Wabakken, P.; Pedersen, H.C.; Thompson Hobbs, N.; Sand, H. Shoot, shovel and shut up: Cryptic poaching slows restoration of a large carnivore in Europe. Proc. R. Soc. B Biol. Sci. 2012, 279, 910–915. [Google Scholar] [CrossRef]
  48. Mech, L.D.; Boitani, L. Wolves: Behavior, Ecology, and Conservation; University of Chicago Press: Chicago, IL, USA, 2003; p. 448. [Google Scholar]
  49. Gompper, M.E.; Ray, J.C.; Groff, C.; Berger, J. A comparison of noninvasive techniques to survey carnivore communities in northeastern North America. Wildl. Soc. Bull. 2002, 30, 962–973. [Google Scholar] [CrossRef]
  50. Berger, K.M.; Gese, E.M.; Berger, J. Carnivore repatriation and holarctic prey: Narrowing the deficit in ecological effectiveness. Conserv. Biol. 2007, 21, 1105–1116. [Google Scholar] [CrossRef]
  51. Ripple, W.J.; Beschta, R.L. Trophic cascades in Yellowstone: The first 15 years after wolf reintroduction. Biol. Conserv. 2012, 145, 205–213. [Google Scholar] [CrossRef]
  52. Ćirović, D.; Jurišić, A.; Kovačić, D. Golden jackal expansion in Europe: A case of mesopredator release. Ital. J. Mammal. 2017, 28, 9–15. [Google Scholar]
  53. Torretta, E.; Corradini, A.; Pedrotti, L.; Bani, L.; Bisi, F.; Dondina, O. Hide-and-Seek in a Highly Human-Dominated Landscape: Insights into Movement Patterns and Selection of Resting Sites of Rehabilitated Wolves (Canis lupus) in Northern Italy. Animals 2023, 13, 46. [Google Scholar] [CrossRef] [PubMed]
  54. Fredrickson, R.J.; Hedrick, P.W.; Wayne, R.K. Genetic rescue of an insular population of large mammals. Proc. R. Soc. B Biol. Sci. 2003, 270, 91–97. [Google Scholar]
  55. Hedrick, P.W.; Allendorf, F.W. Genetically effective population size of large mammals: An assessment of estimators. Conserv. Genet. 2004, 5, 467–483. [Google Scholar]
  56. Tallmon, D.A.; Luikart, G.; Waples, R.S. The alluring simplicity and complex reality of genetic rescue. Trends Ecol. Evol. 2004, 23, 9–14. [Google Scholar] [CrossRef] [PubMed]
  57. Smith, D.W.; Drummer, T.D.; Murphy, K.M.; Guernsey, D.S. Survival of colonizing wolves in the Northern Rocky Mountains of the United States, 1982–2004. J. Wildl. Manag. 2010, 74, 620–634. [Google Scholar] [CrossRef]
  58. Vila, C.; Sundqvist, A.K.; Flagstad, O.; Seddon, J.; Björnerfeldt, S.; Kojola, I.; Casulli, A.; Sand, H.; Wabakken, P.; Ellegren, H. Rescue of a severely bottlenecked wolf (Canis lupus) population by a single immigrant. Proc. R. Soc. Lond. B 2003, 270, 91–97. [Google Scholar] [CrossRef]
  59. Wabakken, M.J.; Svensson, L.; Maartmann, E. The recovery, distribution, and population dynamics of wolves on the Scandinavian peninsula, 1978–1998. Can. J. Zool. 2001, 79, 710–725. [Google Scholar] [CrossRef]
  60. Chapron, G.; Kaczensky, P.; Linnell, J.D.C.; von Arx, M.; Huber, D.; Andrén, H.; López-Bao, J.V.; Adamec, M.; Álvares, F.; Anders, O.; et al. Recovery of large carnivores in Europe’s modern human-dominated landscapes. Science 2014, 346, 1517–1520. [Google Scholar] [CrossRef]
  61. Mech, L.D.; Goyal, S.M.; Paul, W.J.; Newton, W.E. Demographic effects of canine parvovirus on a free-ranging wolf population over. J. Wildl. Dis. 2008, 44, 824–836. [Google Scholar] [CrossRef]
  62. Almberg, E.S.; Mech, L.D.; Smith, D.W.; Sheldon, J.W.; Crabtree, R.L. A Serological Survey of Infectious Disease in Yellowstone National Park’s Canid Community. PLoS ONE 2009, 4, e7042. [Google Scholar] [CrossRef]
  63. Oliynyk, R.T. Human-caused wolf mortality persists for years after discontinuation of hunting. Sci. Rep. 2023, 13, 13853. [Google Scholar] [CrossRef]
  64. Liberg, O.; Suutarinen, J.; Åkesson, M.; Andrén, H.; Wabakken, P.; Wikenros, C.; Sand, H. Poaching-related disappearance rate of wolves in Sweden was positively related to population size and negatively to legal culling. Biol. Conserv. 2020, 243, 108456. [Google Scholar] [CrossRef]
  65. Nowak, S.; Żmihorski, M.; Figura, M.; Stachyra, P.; Mysłajek, R.W. The Illegal Shooting and Snaring of Legally Protected Wolves in Poland. Biol. Conserv. 2021, 264, 109367. [Google Scholar] [CrossRef]
  66. Reinhardt, I.; Kluth, G.; Nowak, C.; Szentiks, C.A.; Krone, O.; Ansorge, H.; Mueller, T. Military training areas facilitate the recolonization of wolves in Germany. Conserv. Lett. 2019, 12, e12635. [Google Scholar] [CrossRef]
  67. Sunde, P.; Collet, S.; Nowak, C.; Thomsen, P.F.; Hansen, M.M.; Schulz, B.; Matzen, J.; Michler, F.-U.; Vedel-Smith, C.; Olsen, K. Where have all the young wolves gone? Traffic and cryptic mortality create a wolf population sink in Denmark and northernmost Germany. Conserv. Lett. 2021, 14, e12812. [Google Scholar] [CrossRef]
  68. Mech, L.D.; Adams, L.G.; Meier, T.J.; Burch, J.W.; Dale, B.W. The Wolves of Denali; University of Minnesota Press: Minneapolis, MN, USA, 1998; p. 227. [Google Scholar]
  69. Peterson, R. Wolves as Interspecific Competitors in Canid Ecology. In Ecology and Conservation of Wolves in a Changing World; Carbyn, L.N., Frits, S.H., Seip, D.R., Eds.; Canadian Circumpolar Institute, Occasional Publication No. 35; Canadian Circumpolar Institute: Edmonton, AB, Canada, 1995; pp. 315–323. [Google Scholar]
  70. Musto, C.; Gazzola, A.; Milanesi, P.; Ghidini, A.; Pizzi, R.; Apollonio, M.; Bassi, E. First Evidence of Widespread Positivity to Anticoagulant Rodenticides in Grey Wolves (Canis lupus). Sci. Total Environ. 2024, 915, 169990. [Google Scholar] [CrossRef]
  71. Molnar, B.; Ciucci, P.; Mastrantonio, G.; Betschart, B. Correlates of parasites and pseudoparasites in wolves (Canis lupus) across continents: A comparison among Yellowstone (USA), Abruzzo (IT) and Mercantour (FR) national parks. Int. J. Parasitol. Parasites Wildl. 2019, 10, 196–206. [Google Scholar] [CrossRef]
  72. Kusak, J.; Fabbri, E.; Galov, A.; Gomerčić, T.; Arbanasić, H.; Caniglia, R.; Galaverni, M.; Reljić, S.; Huber, Đ.; Randi, E. Wolf-dog hybridization in Croatia. Vet. Arh. 2018, 88, 375–395. [Google Scholar] [CrossRef]
  73. Cusdin, P.A.; Greenwood, A.G. The Keeping of Wolf-Hybrids in Great Britain; Department of the Environment, Transport and the Regions and Royal Society for the Prevention of Cruelty to Animals: Keighley, UK, 2000. [Google Scholar]
  74. Kittle, A. The Influence of Prey Availability, Habitat Attributes and Other Factors on Space Use by Social Carnivores. Ph.D. Thesis, The University of Guelph, Guelph, ON, Canada, 2014. Available online: https://atrium.lib.uoguelph.ca/server/api/core/bitstreams/3c9360e5-b52d-4281-8fd6-a7ab906df48d/content (accessed on 15 March 2023).
  75. Carricondo-Sanchez, D.; Zimmermann, B.; Wabakken, P.; Eriksen, A.; Milleret, C.; Ordiz, A.; Sanz-Pérez, A.; Wikenros, C. Wolves at the door? Factors influencing the individual behavior of wolves in relation to anthropogenic features. Biol. Conserv. 2020, 244, 108514. [Google Scholar] [CrossRef]
  76. Wójcicki, A.; Borowski, Z. The presence of wolves leads to spatial differentiation in deer browsing pressure on forest regeneration. Sci. Rep. 2023, 13, 17245. Available online: https://colab.ws/articles/10.1038/s41598-023-44502-y (accessed on 15 March 2024). [CrossRef]
  77. Ugarković, D.; Tikvić, I.; Mikac, S.; Stankić, I.; Balta, D. The influence of changing climate extremes on the ecological niche of pedunculate oak in Croatia. South-East Eur. For. 2016, 7, 143–148. [Google Scholar] [CrossRef]
  78. Niemiec, R.; Berl, R.E.W.; Gonzalez, M.; Teel, T.; Salerno, J.; Breck, S.; Camara, C.; Collins, M.; Schultz, C.; Hoag, D.; et al. Rapid changes in public perception toward a conservation initiative. Conserv. Sci. Pract. 2022, 4, e12632. [Google Scholar] [CrossRef]
  79. Rodríguez-Recio, M.; Wikenros, C.; Zimmermann, B.; Sand, H. Rewilding by wolf recolonization, consequences for ungulate populations and game hunting. Biology 2022, 11, 317. [Google Scholar] [CrossRef]
  80. Bišćan, M.; Damjanović, I. The Big Bad Wolf—The perception of media-mediated messages. In Book of Abstracts; Croatian Association of Nature and Environmental Protection Experts (HUSZPO): Vodice, Croatia, 2022; pp. 169–170. [Google Scholar]
  81. Bombieri, G.; Penteriani, V.; Almasieh, K.; Ambarlı, H.; Ashrafzadeh, M.R.; Das, C.S. A worldwide perspective on large carnivore attacks on humans. PLoS Biol. 2023, 21, e3001946. [Google Scholar] [CrossRef]
  82. Linnell, J.D.C.; Kovtun, E.; Rouart, I. Wolf Attacks on Humans: An Update for 2002–2020. NINA Report 1944; Norwegian Institute for Nature Research: Trondheim, Norway, 2021. [Google Scholar]
  83. Wilson, S.M. Living with predators: A 20-year case study in the Blackfoot River watershed of Montana. In Rangeland Wildlife Ecology and Conservation; McNew, L.B., Dahlgren, D.K., Beck, J.L., Eds.; Springer: Berlin/Heidelberg, Germany, 2023; pp. 347–360. [Google Scholar]
  84. Jeremić, J.; Kusak, J.; Huber, Đ.; Štrbenac, A.; Korša, A. Report on the Status of Wolf Populations in Croatia in 2016; Croatian Agency for the Environment and Nature: Zagreb, Croatia, 2017. [Google Scholar]
  85. Reed, D.H.; O’Grady, J.J.; Ballou, J.D.; Frankham, R. The frequency and severity of catastrophic die-offs in vertebrates. Anim. Conserv. 2003, 6, 109–114. [Google Scholar] [CrossRef]
  86. Kojola, I.; Hallikainen, V.; Mikkola, K.; Gurarie, E.; Heikkinen, S.; Kaartinen, S.; Nikula, A.; Nivala, V. Wolf visitations close to human residences in Finland: The role of age, residence density, and time of day. Biol. Conserv. 2016, 198, 9–14. [Google Scholar] [CrossRef]
  87. Kojola, I.; Aspi, J.; Hakala, A.; Heikkinen, S.; Ilmoni, C.; Ronkainen, S. Dispersal in an expanding wolf population in Finland. J. Mammal. 2006, 87, 281–286. [Google Scholar] [CrossRef]
  88. Almpanidou, V.; Mazaris, A.D.; Mertzanis, Y.; Avraam, I.; Antoniou, I.; Pantis, J.D.; Sgardelis, S.P. Landscape Connectivity and Suitable Habitat Analysis for Wolves (Canis lupus L.) in the Eastern Pyrenees. Sustainability 2020, 12, 5762. [Google Scholar] [CrossRef]
  89. Blanco, J.C.; Cortés, Y.; Virgós, E. Wolf Response to Two Kinds of Barriers in an Agricultural Habitat in Spain. Can. J. Zool. 2005, 83, 312–323. [Google Scholar] [CrossRef]
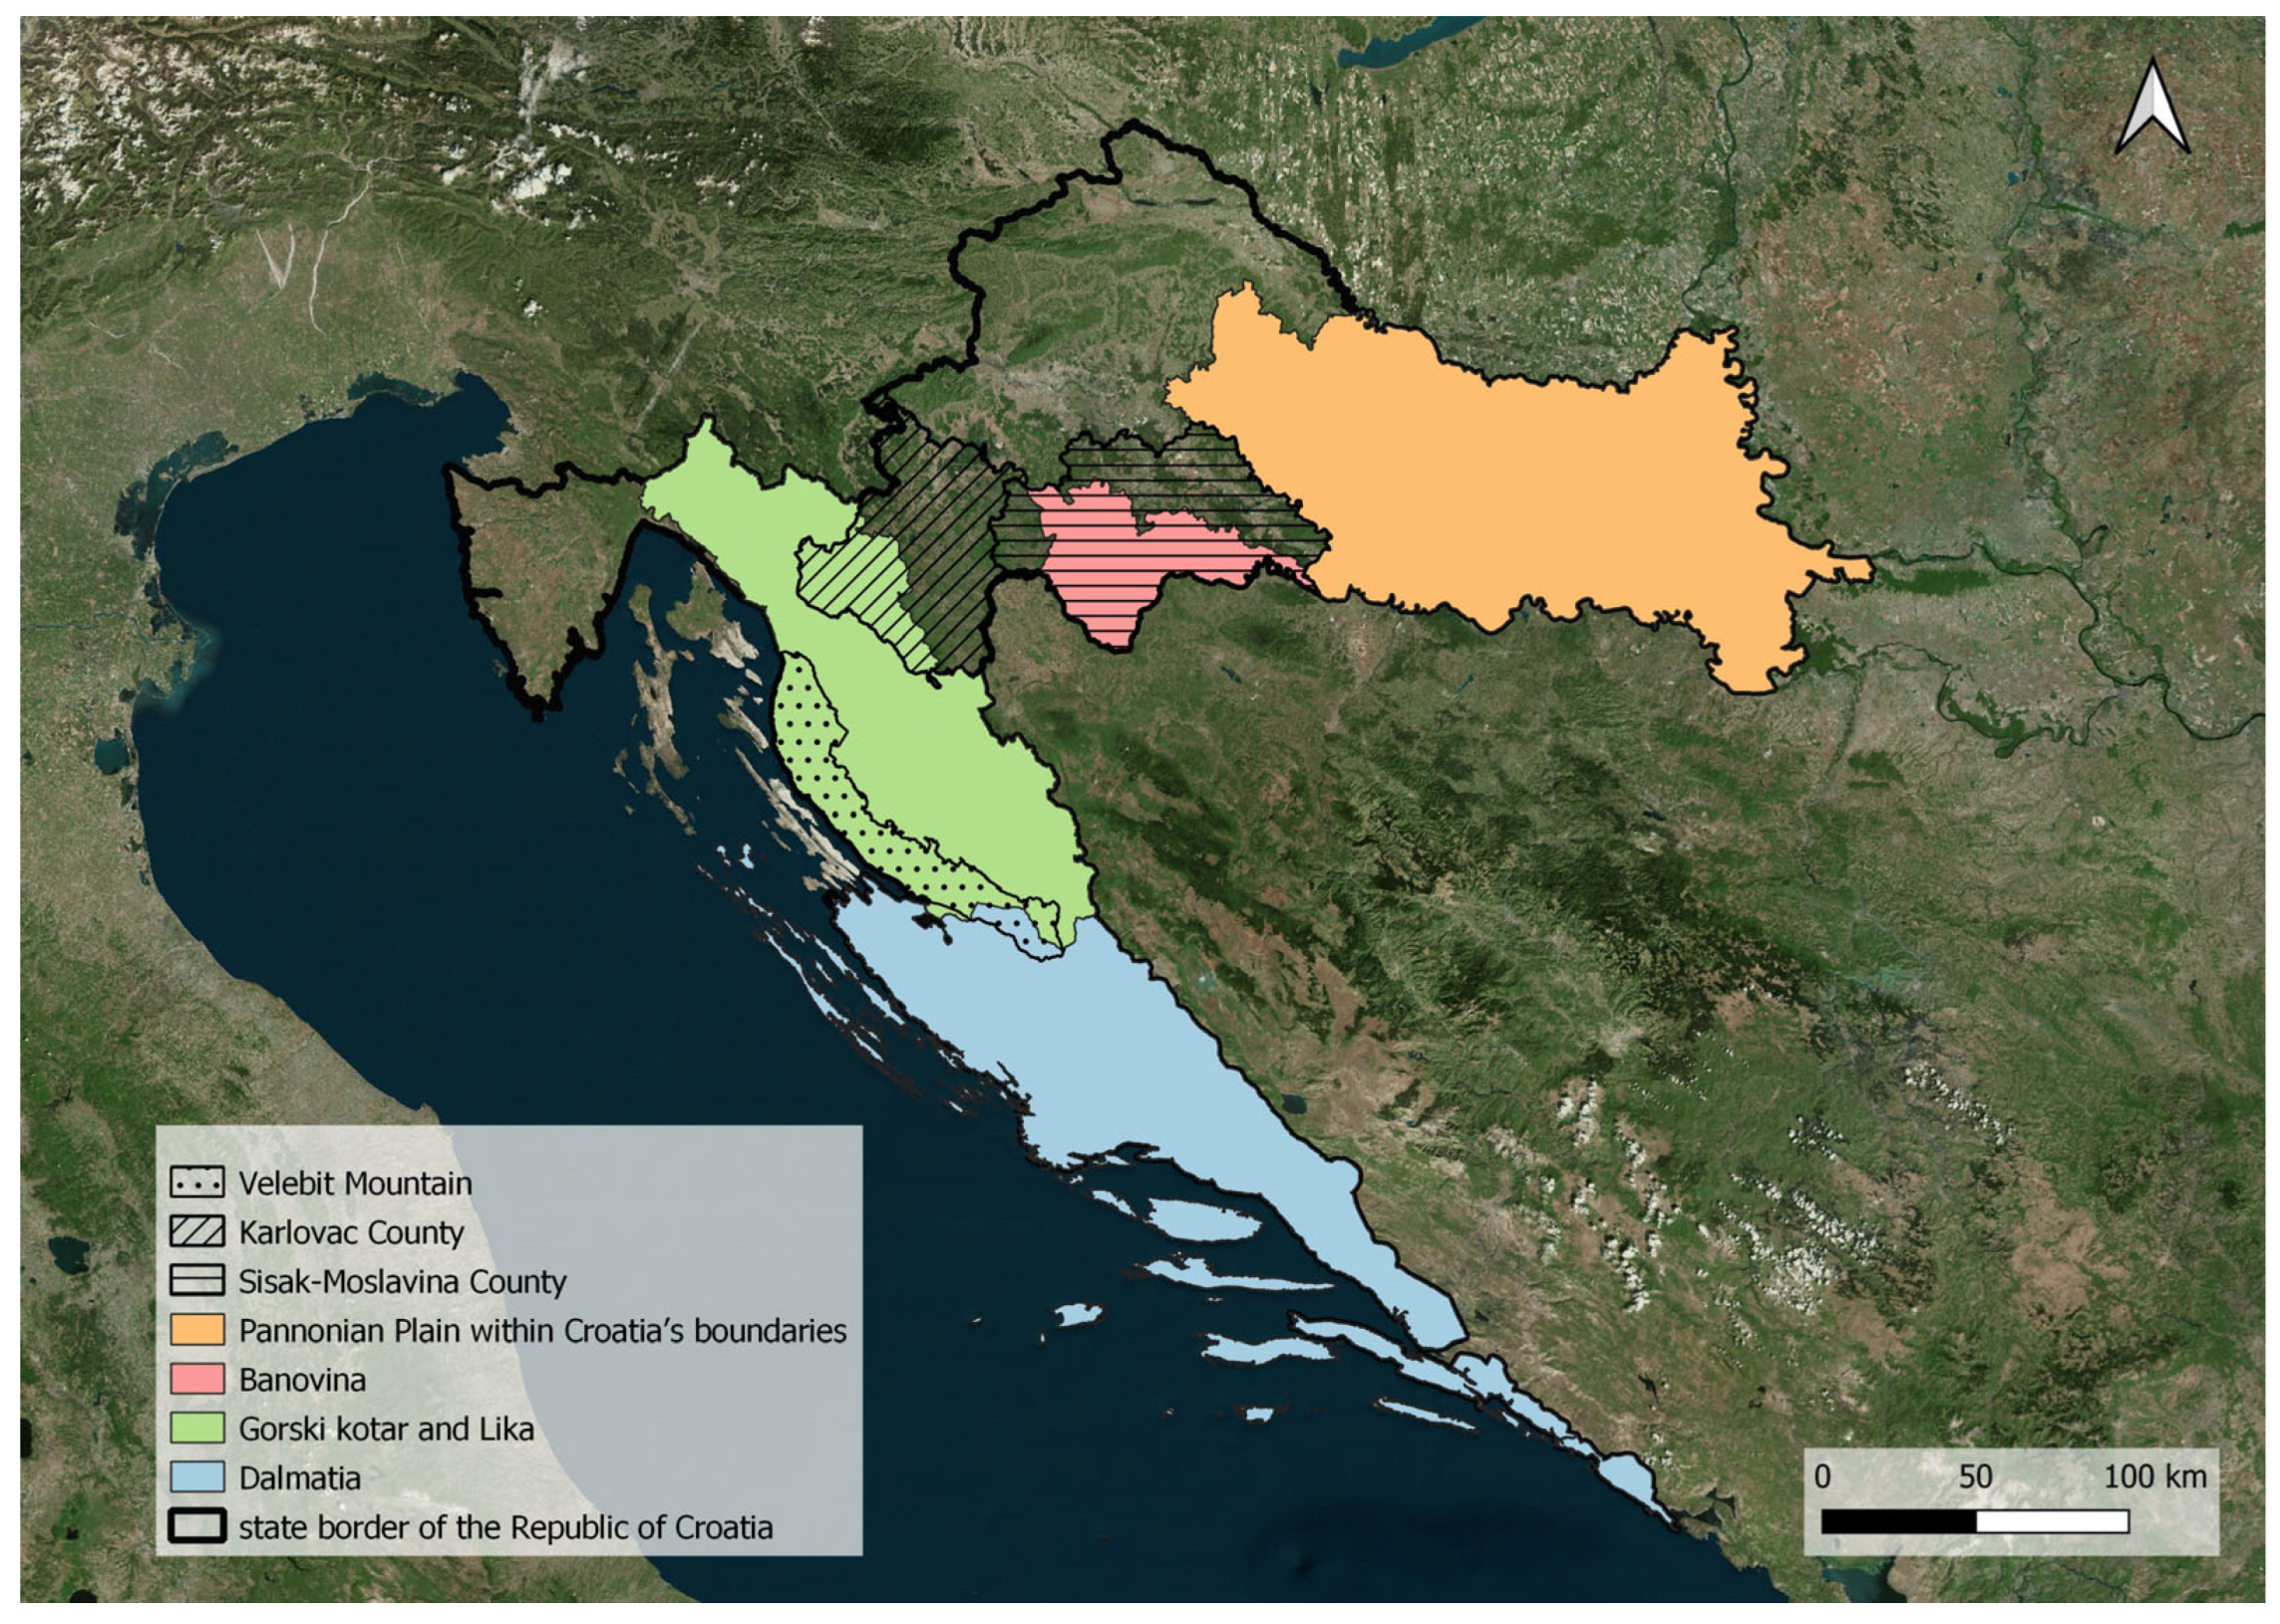
Figure 1. Geographic regions (Velebit mountain, Dalmatia, Gorski Kotar, and Lika) and administrative divisions of Croatia (Karlovac County, Sisak-Moslavina County, Pannonian Plain within Croatia’s boundaries, and Banovina) in relation to historical wolf distribution. The map displays a satellite imagery base with color-coded overlays highlighting the regions relevant to wolf distribution patterns (map prepared using QGIS software, version 3.32.3).
Diversity 17 00461 g001
Figure 2. Land cover map of the Slavonia survey area (Croatia), illustrating the distribution of major habitat types. The study area is outlined by the national border of the Republic of Croatia (black line). Habitat categories depicted include forests (dark green), shrublands (light green), grasslands and pastures (yellow), cultivated non-forest habitats and ruderal vegetation (orange), residential and industrial areas (gray), and terrestrial waters and wetlands (dark blue). Map prepared using QGIS software (version 3.32.3).
Diversity 17 00461 g002
Figure 3. Box plots illustrate the distribution of the number of simulations in which populations became extinct across 11 different scenarios over the 10-, 30-, and 100-year periods, as well as for all the combined periods. Red squares indicate the means, red boxes represent the mean ± standard error (SE), and whiskers show the mean ± 1.96 SE.
Diversity 17 00461 g003
Figure 4. Principal Component Analysis (PCA) plot showing the distribution of scenarios along the first two principal components (PC1 and PC2) for the combined dataset (10-, 30-, and 100-year models). The plot reveals three distinct groupings: Group 1 (left) includes Scenarios 9 and 11, Scenario 8 (center) appears isolated, and Group 2 (right) clusters Scenarios 1–7 and 10. Ellipses around each point represent confidence regions for the scenarios.
Diversity 17 00461 g004
Figure 5. Results of the spatial analysis of potential wolf corridors along the A3 highway (Bregana–Zagreb–Lipovac) between the Banovina and Slavonia regions in Croatia. The main map displays the study area within Croatia’s national borders (black line), highlighting Sisak-Moslavina County (Banovina area) and the Slavonia survey area with blue hatching. Highway structures are classified into three categories: passable with minor design adjustments (green markers), passable with significant design modifications (yellow markers), and impassable (red markers). The inset map (top left) provides a detailed view of a 20 km corridor segment, showing the distribution of passage structures.
Diversity 17 00461 g005
Table 1. Summary of 11 scenarios used to project the gray wolf population in the modeled area *.
Scenario No.Scenario NameScenario ClassDescriptionVariable Vortex
Categories
1Baseline-Population based on modeled area’s carrying capacity, determined by habitat suitability mapCarrying Capacity
2DiseaseUncertainty50% population reduction over two six-month periods due to diseaseCarrying Capacity and Catastrophes
3RemovalsManagementAnnual removal of an animal due to human–wildlife conflictsCarrying Capacity and Harvest
4Illegal huntingUncertaintyAnnual removal of two animals due to illegal huntingCarrying Capacity and Harvest
5Succession: Carrying capacity boostUncertaintyIncrease in suitable habitat due to natural successionCarrying Capacity
6Forest Management: Carrying capacity boostManagementIncrease in suitable habitat due to alterations in forest management practicesCarrying Capacity
7Hunting Management: Carrying capacity boostManagementIncrease in carrying capacity by modifying hunting managementCarrying Capacity
8One-Region Corridor Enhancement: Immigration by existing corridors (Banovina)ManagementSupplementation with one male wolf from Banovina—enhancing existing corridorsCarrying Capacity and Supplementation
9Corridor construction: Immigration by new corridors (Banovina) + successionManagementSupplementation with one pair of wolves (male and female) from Banovina—creating new corridors with an increase in suitable habitats due to natural successionCarrying Capacity and Supplementation
10Two-Region Corridor Enhancement: Immigration by existing corridors (Banovina and Bosnia and Herzegovina)ManagementSupplementation with one male wolf from Banovina and one male wolf from Bosnia and Herzegovina—enhancing existing corridors from both regionsCarrying Capacity and Supplementation
11Translocation: Translocation from CroatiaManagementTranslocation of one male and one female wolf from another Croatian wolf populationCarrying Capacity and Supplementation
* full details of all 11 scenarios are provided in Appendix A.
Disclaimer/Publisher’s Note: The statements, opinions and data contained in all publications are solely those of the individual author(s) and contributor(s) and not of MDPI and/or the editor(s). MDPI and/or the editor(s) disclaim responsibility for any injury to people or property resulting from any ideas, methods, instructions or products referred to in the content.