Article

Pathways to 30 × 30: Evidence-Based Lessons from Global Case Studies in Biodiversity Conservation

1
Development Economics Research Group, World Bank, 1818 H Street, Washington, DC 20433, USA
2
Development Economics Data Group, World Bank, 1818 H Street, Washington, DC 20433, USA
*
Author to whom correspondence should be addressed.
Diversity 2025, 17(6), 401; https://doi.org/10.3390/d17060401
Submission received: 10 March 2025 / Revised: 10 May 2025 / Accepted: 13 May 2025 / Published: 6 June 2025
(This article belongs to the Special Issue Restoring and Conserving Biodiversity: A Global Perspective)

Abstract

The global 30 × 30 initiative, endorsed by 188 countries, aims to expand terrestrial and marine protected areas to cover 30% of the planet by 2030. This study utilizes newly available species-occurrence maps from the Global Biodiversity Information Facility (GBIF) to identify conservation priorities in 10 countries across Latin America (Brazil, Costa Rica, and Ecuador), Africa (Cameroon, South Africa, and Madagascar), and the Asia–Pacific region (Papua New Guinea, Philippines, India, and China). By incorporating diverse taxa—including vertebrates, invertebrates, and plants—the analysis ensures equitable species representation in conservation planning. A spatial prioritization algorithm is employed to pinpoint areas where new protected regions can address biodiversity gaps, with a particular focus on endemic and unprotected species. The results highlight significant variation in initial conservation conditions, including existing protection levels and spatial distribution of unprotected species. Countries with high spatial clustering of unprotected species achieve substantial protection gains with modest protected-area expansions, while others may require exceeding the 30% target to ensure comprehensive biodiversity coverage. The study underscores the importance of localized conservation strategies within the broader global framework, demonstrating how targeted spatial planning can enhance biodiversity outcomes and support the equitable implementation of the 30 × 30 commitment.

Graphical Abstract

1. Introduction

The world’s biodiversity is declining at a rapid pace [1]. For vertebrates alone, the Living Planet Index indicates a 69% loss of terrestrial, freshwater, and marine species since 1970. In response to such evidence, 188 governments ratified the Kunming-Montreal Global Biodiversity Framework at the December 2022 Conference of the Parties to the Convention on Biological Diversity. Among other measures, the Framework commits nations to protect 30% of the planet by 2030 through a global initiative, commonly known as 30 × 30. Implementing 30 × 30 effectively requires understanding the spatial distribution of global biodiversity that should be protected, as well as how protecting 30% of the planet can best conserve this biodiversity.
The existing literature on the effectiveness of protected areas primarily examines terrestrial species and habitat loss due to factors such as deforestation, logging, hunting, and grazing [2,3,4,5,6,7,8,9,10,11]. In contrast, this study broadens the scope by assessing the spatial implications of national commitments to the 30 × 30 conservation target for a more diverse set of species. Leveraging our previous work, we utilize data from the Global Biodiversity Information Facility (GBIF) to generate spatial occurrence maps for nearly 600,000 species, including terrestrial, freshwater, and marine vertebrates and invertebrates, as well as plants [12]. This expanded representation enables a more comprehensive evaluation of biodiversity coverage within protected areas, offering critical insights for conservation planning across multiple ecosystems. Specifically, we use the species-occurrence maps to assess new opportunities for species protection in a sample of 10 countries across Latin America, Africa, and the Asia–Pacific region. By focusing on individual countries and endemic species protection, this study highlights the importance of localized conservation stewardship in achieving global biodiversity targets. The framework we developed is adaptable across diverse geographical contexts and can be tailored to any country based on user-defined criteria for identifying species at risk. This methodology provides a robust tool for informing the designation of new protected areas and the strategic expansion of existing ones, supporting evidence-based conservation planning.

2. Materials and Methods

2.1. Data

The selection of case-study countries was based on multiple factors to ensure a comprehensive and representative analysis for low- and middle-income countries, where scarce public resources warrant efficient protection strategies. Selection criteria included biodiversity status, protected-area size variation, country size variation, overall habitat diversity (terrestrial vs. marine locations), and regional representation. All selected countries are biodiversity-rich, with high international rankings for total endemic species (median percentile, 95.1) and species whose vulnerability is heightened by small ranges (median percentile, 92.9). The selection also accounts for the proportion of land designated as protected area, ranging from 3.7% in Papua New Guinea to 58.9% in Costa Rica. Regional representation is balanced across Latin America (3 countries), Africa (3), and Asia/Pacific (4). We have included two marine biodiversity cases (Madagascar and Philippines) to illustrate the distinctive features of the protection problem in marine environments.
Our country-level analyses for protection of terrestrial species are based on protected-area boundaries obtained from the World Database on Protected Areas (WDPA) [13]; these boundaries exhibit significant variation across countries in terms of territorial coverage and taxonomic representation. Data on endemic species were sourced from the World Bank’s open-access Global Biodiversity Species Endemism and Small Occurrence Data [14]. This dataset was developed by mapping species-occurrence regions using geocoded records from the GBIF and overlaying them with national administrative boundaries from the World Bank and boundaries of Exclusive Economic Zones (EEZs) from the Flanders Marine Institutes, version 12 [15]. See Table 1 for endemic species by class/order considered in our analysis.

2.2. Methods

Our analysis was conducted in several steps, combining econometric modeling with spatial overlays to identify priority areas for biodiversity conservation. We used the R version 4.3.1 (2023-06-16) programming language and Stata version 18.5 statistical software to perform the analysis.

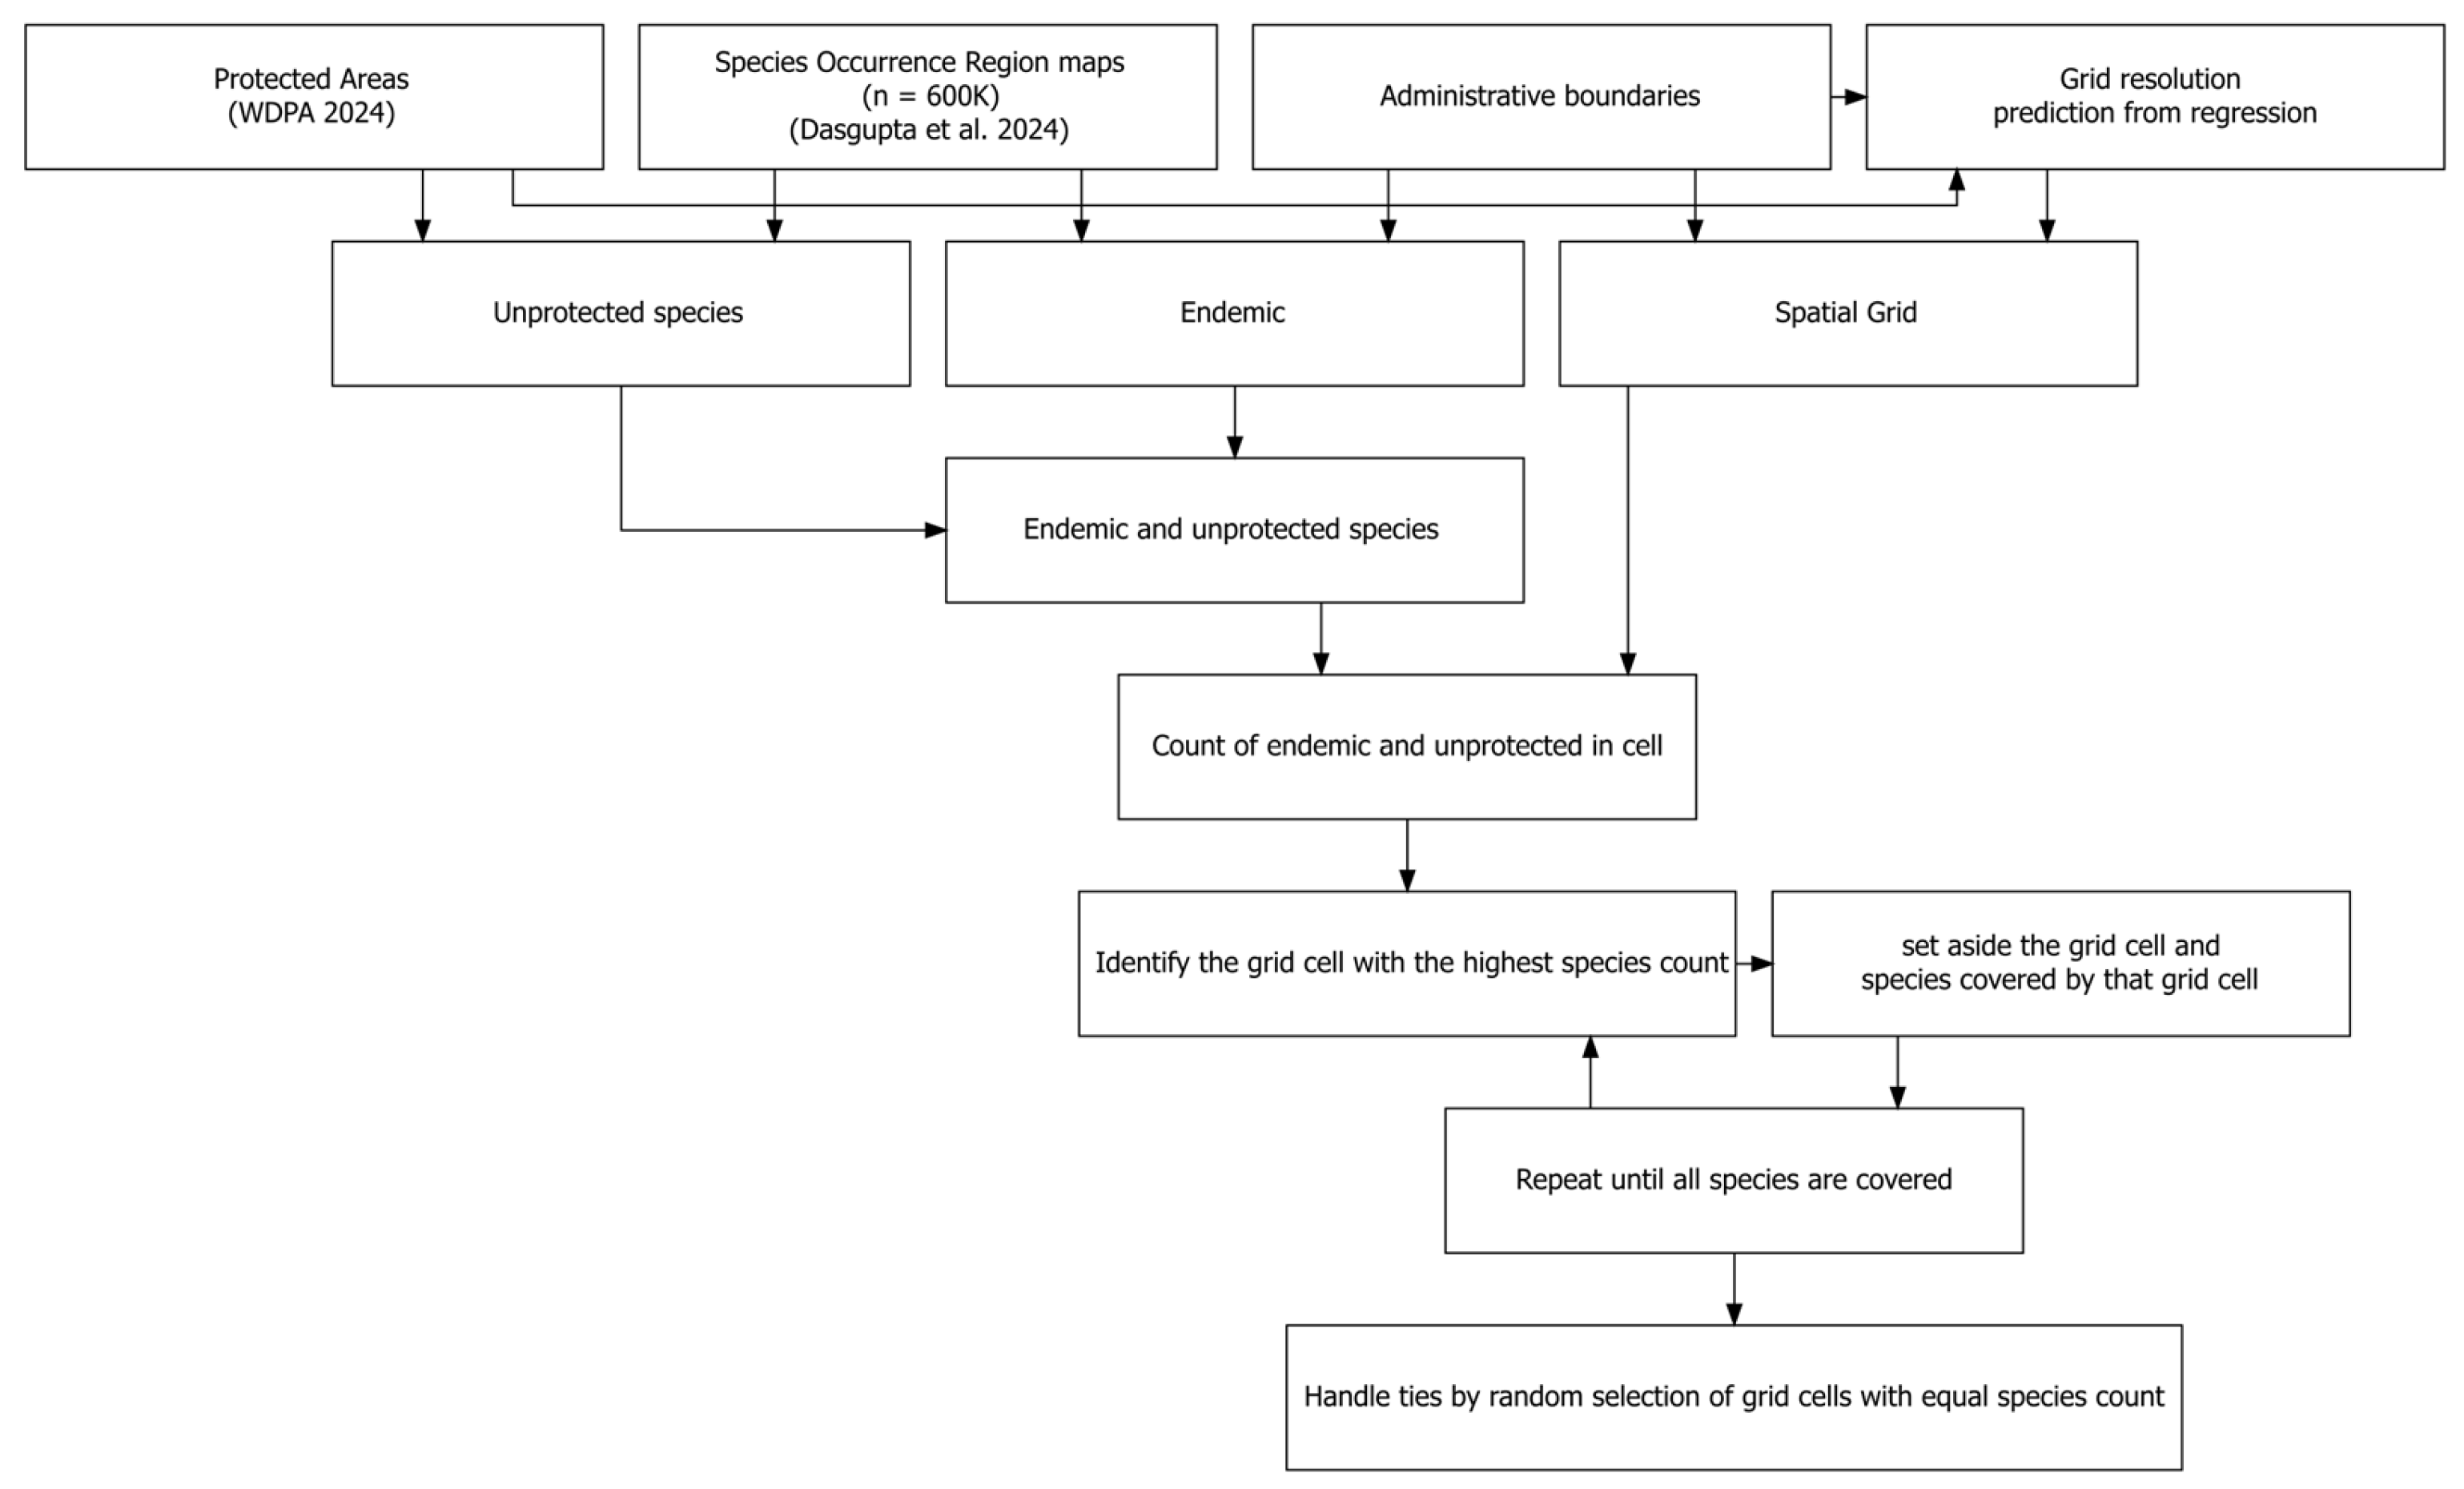
2.2.1. Determining the Optimal Grid Resolution

Since our methodology integrates geographic overlays of protected-area and EEZ maps and endemic species-occurrence regions, it is essential to establish an appropriate grid resolution for protected-area designation in each country while controlling for country size. To determine this, we first examined the relationship between country area and mean protected-area size using data from the World Bank’s country shapefile for country boundaries and the World Database on Protected Areas for protected-area size. Specifically, we plotted the logarithm of country area against the mean protected-area size (in square kilometers) for all 212 countries and political units. We then conducted an econometric analysis to determine the optimal grid resolution for protected-area designation. We employed the following equation:
ln m n P A = β 0 + β 1 ln c t r a r e a + ϵ
where ln(mnPA) is the logarithm of protected-area size, and ln(ctrarea) is the logarithm of country area. Given the large variation in protected-area numbers and sizes across countries, we believe that this approach provides more robust and stable results than computing mean protected-area size directly for individual countries.
However, we changed our method for setting grid-cell resolutions for our marine protection application because the sizes of marine protected areas vary enormously across countries with comparable EEZ areas. We set each country’s grid resolution to create 2500 cells within its EEZ. For cases with small EEZs, we generated fewer than 2500 grid cells by setting a lower bound of 1 square km per grid cell.

2.2.2. Assessing Current Protection Coverage for Terrestrial, Freshwater, and Marine Endemic Species

For this study, a terrestrial endemic species is defined as a species found exclusively in one country that is not observed anywhere else in the world. A marine species is identified as endemic if its occurrence area lies within the boundary of the country’s EEZ, the outer boundary of which is 200 nautical miles (370.4 km) from its coast. For each country, we overlaid occurrence-region maps of all endemic terrestrial and marine species onto existing WDPA protected areas and marine endemic species onto EEZ maps to quantify the percentage of endemic species’ spatial distributions that are currently under protection. This step also provided a baseline assessment of conservation gaps. We considered endemic species to be unprotected if they are either entirely unprotected or sparsely covered—defined as having less than 5% of their occurrence area and less than 25 km2 within protected areas and EEZs.

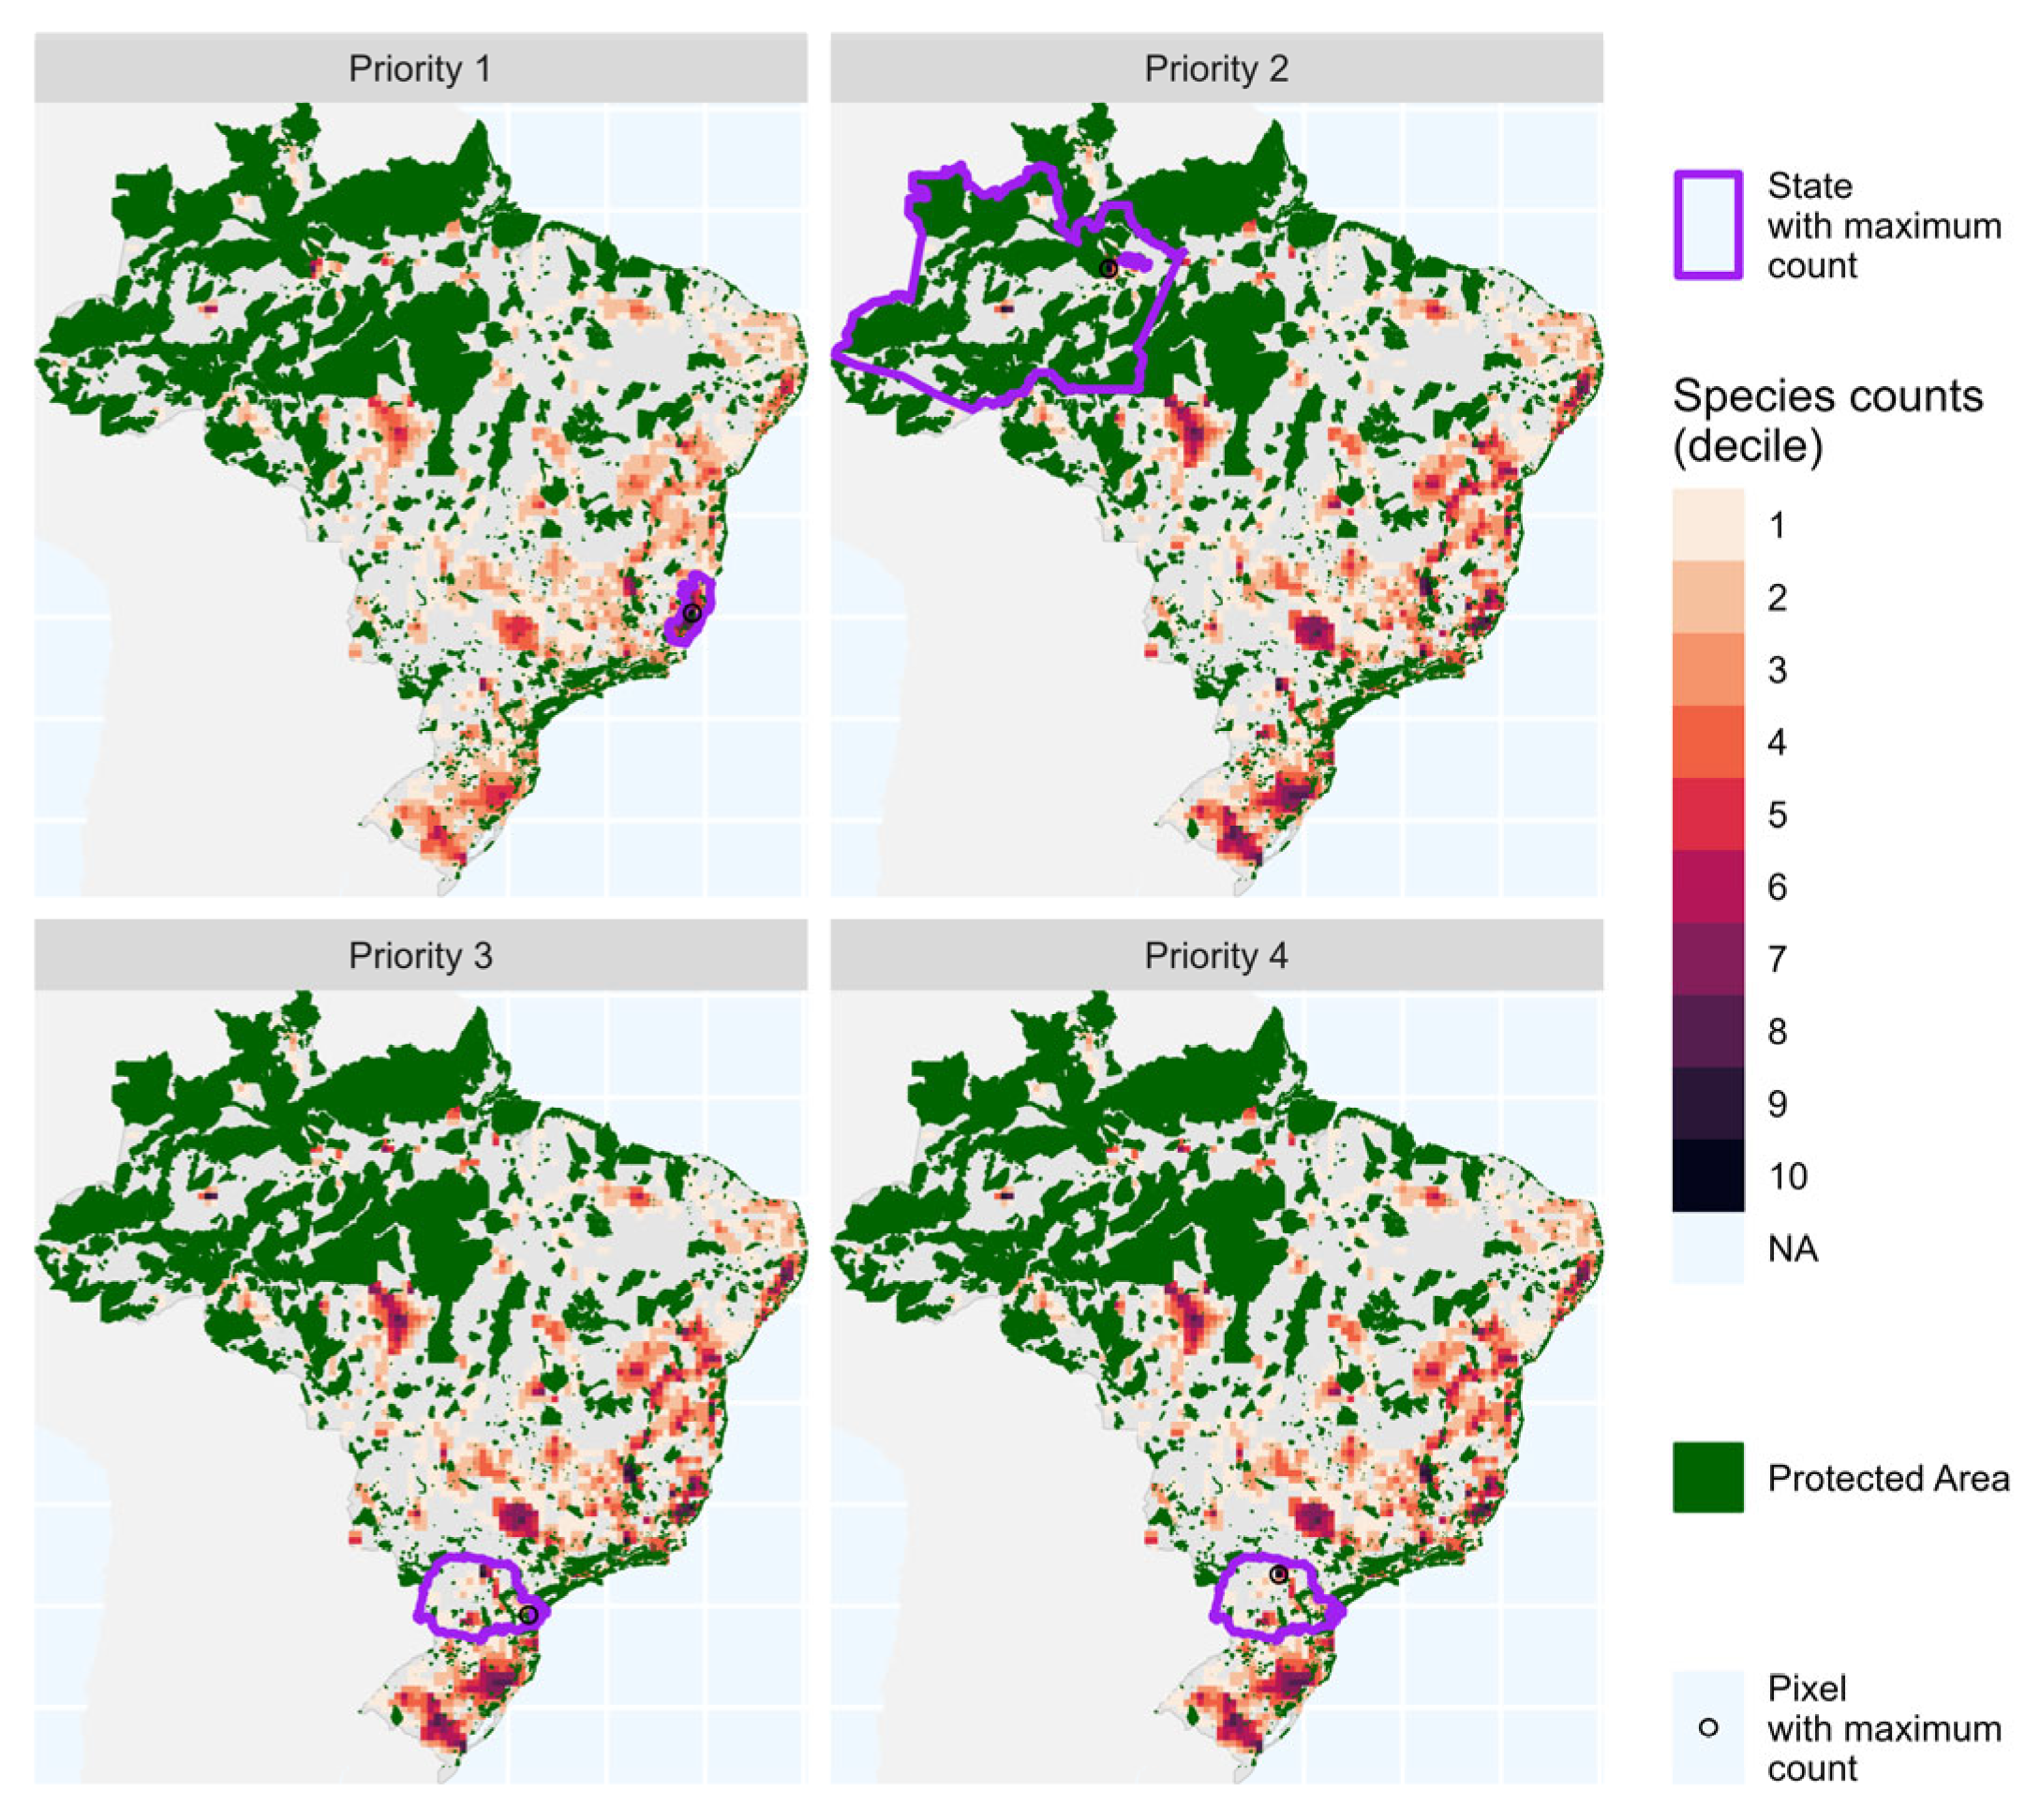
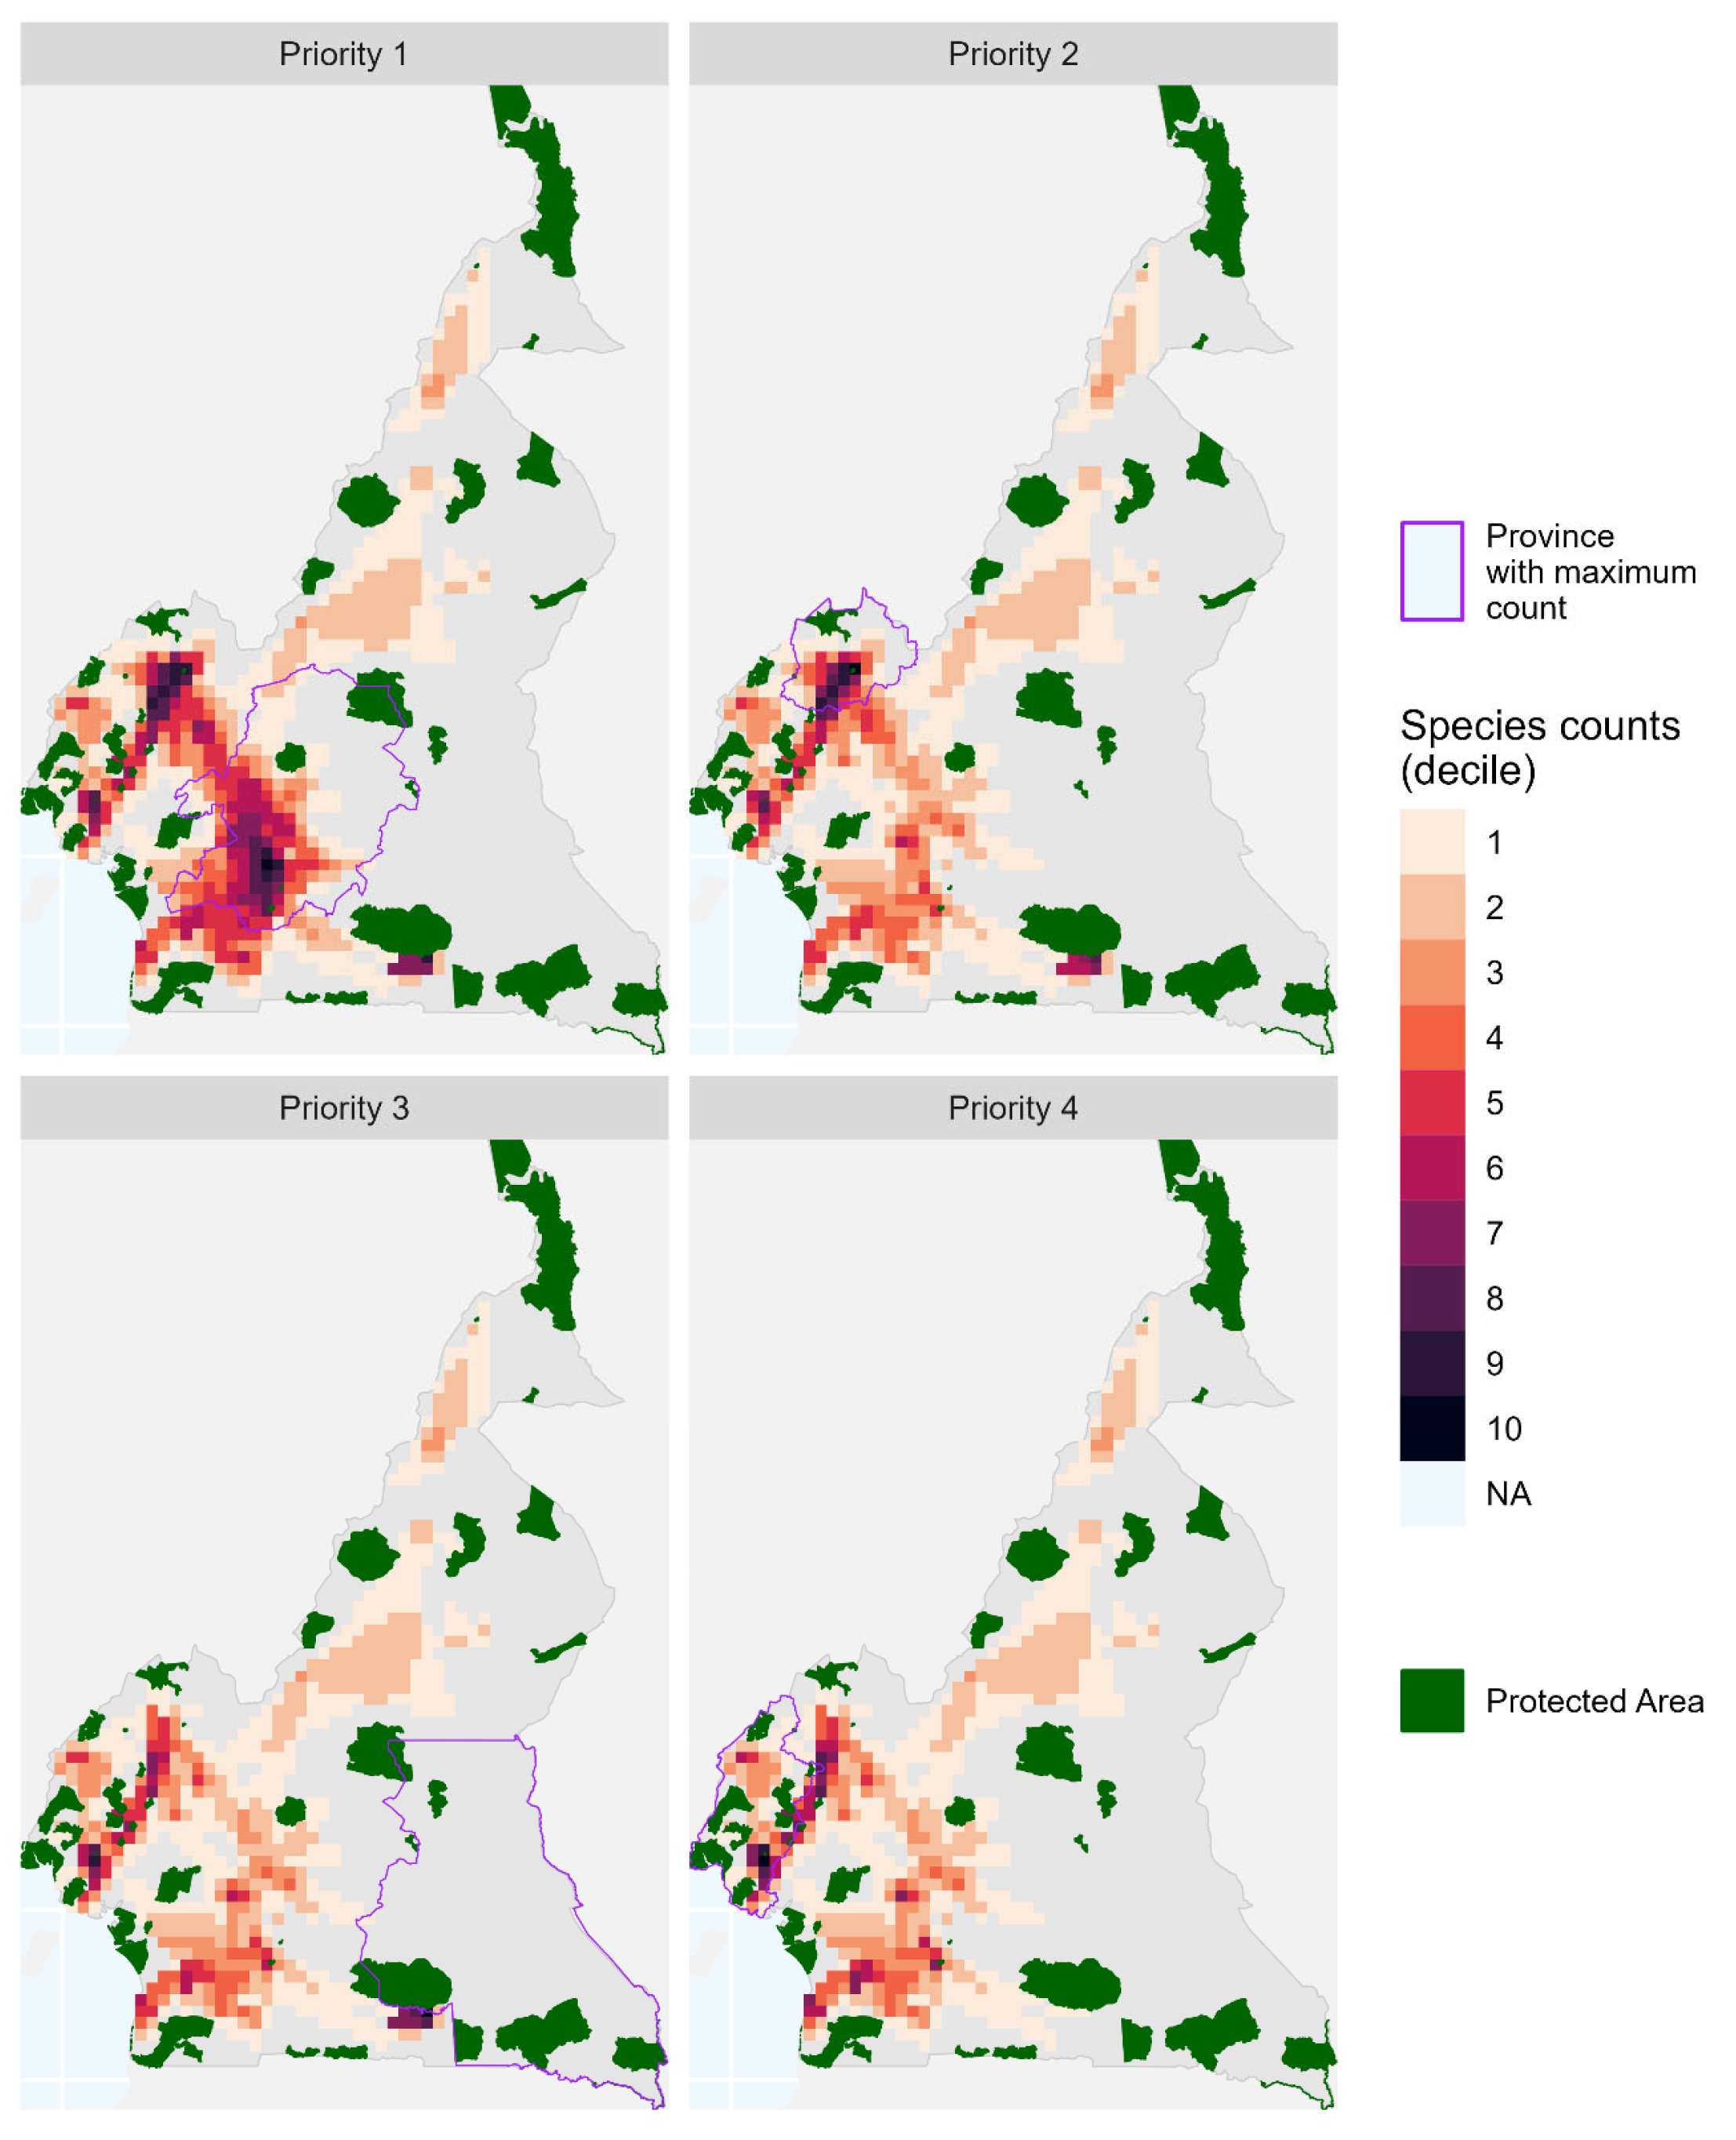
2.2.3. Prioritizing New Protected Areas to Close the Conservation Gaps

To identify priority locations for new protected areas, we applied a sequential algorithm that maximized unprotected-species coverage in successive rounds. The occurrence maps of all unprotected species were overlaid on a spatial grid, and the algorithm iteratively ranked grid cells based on species richness:
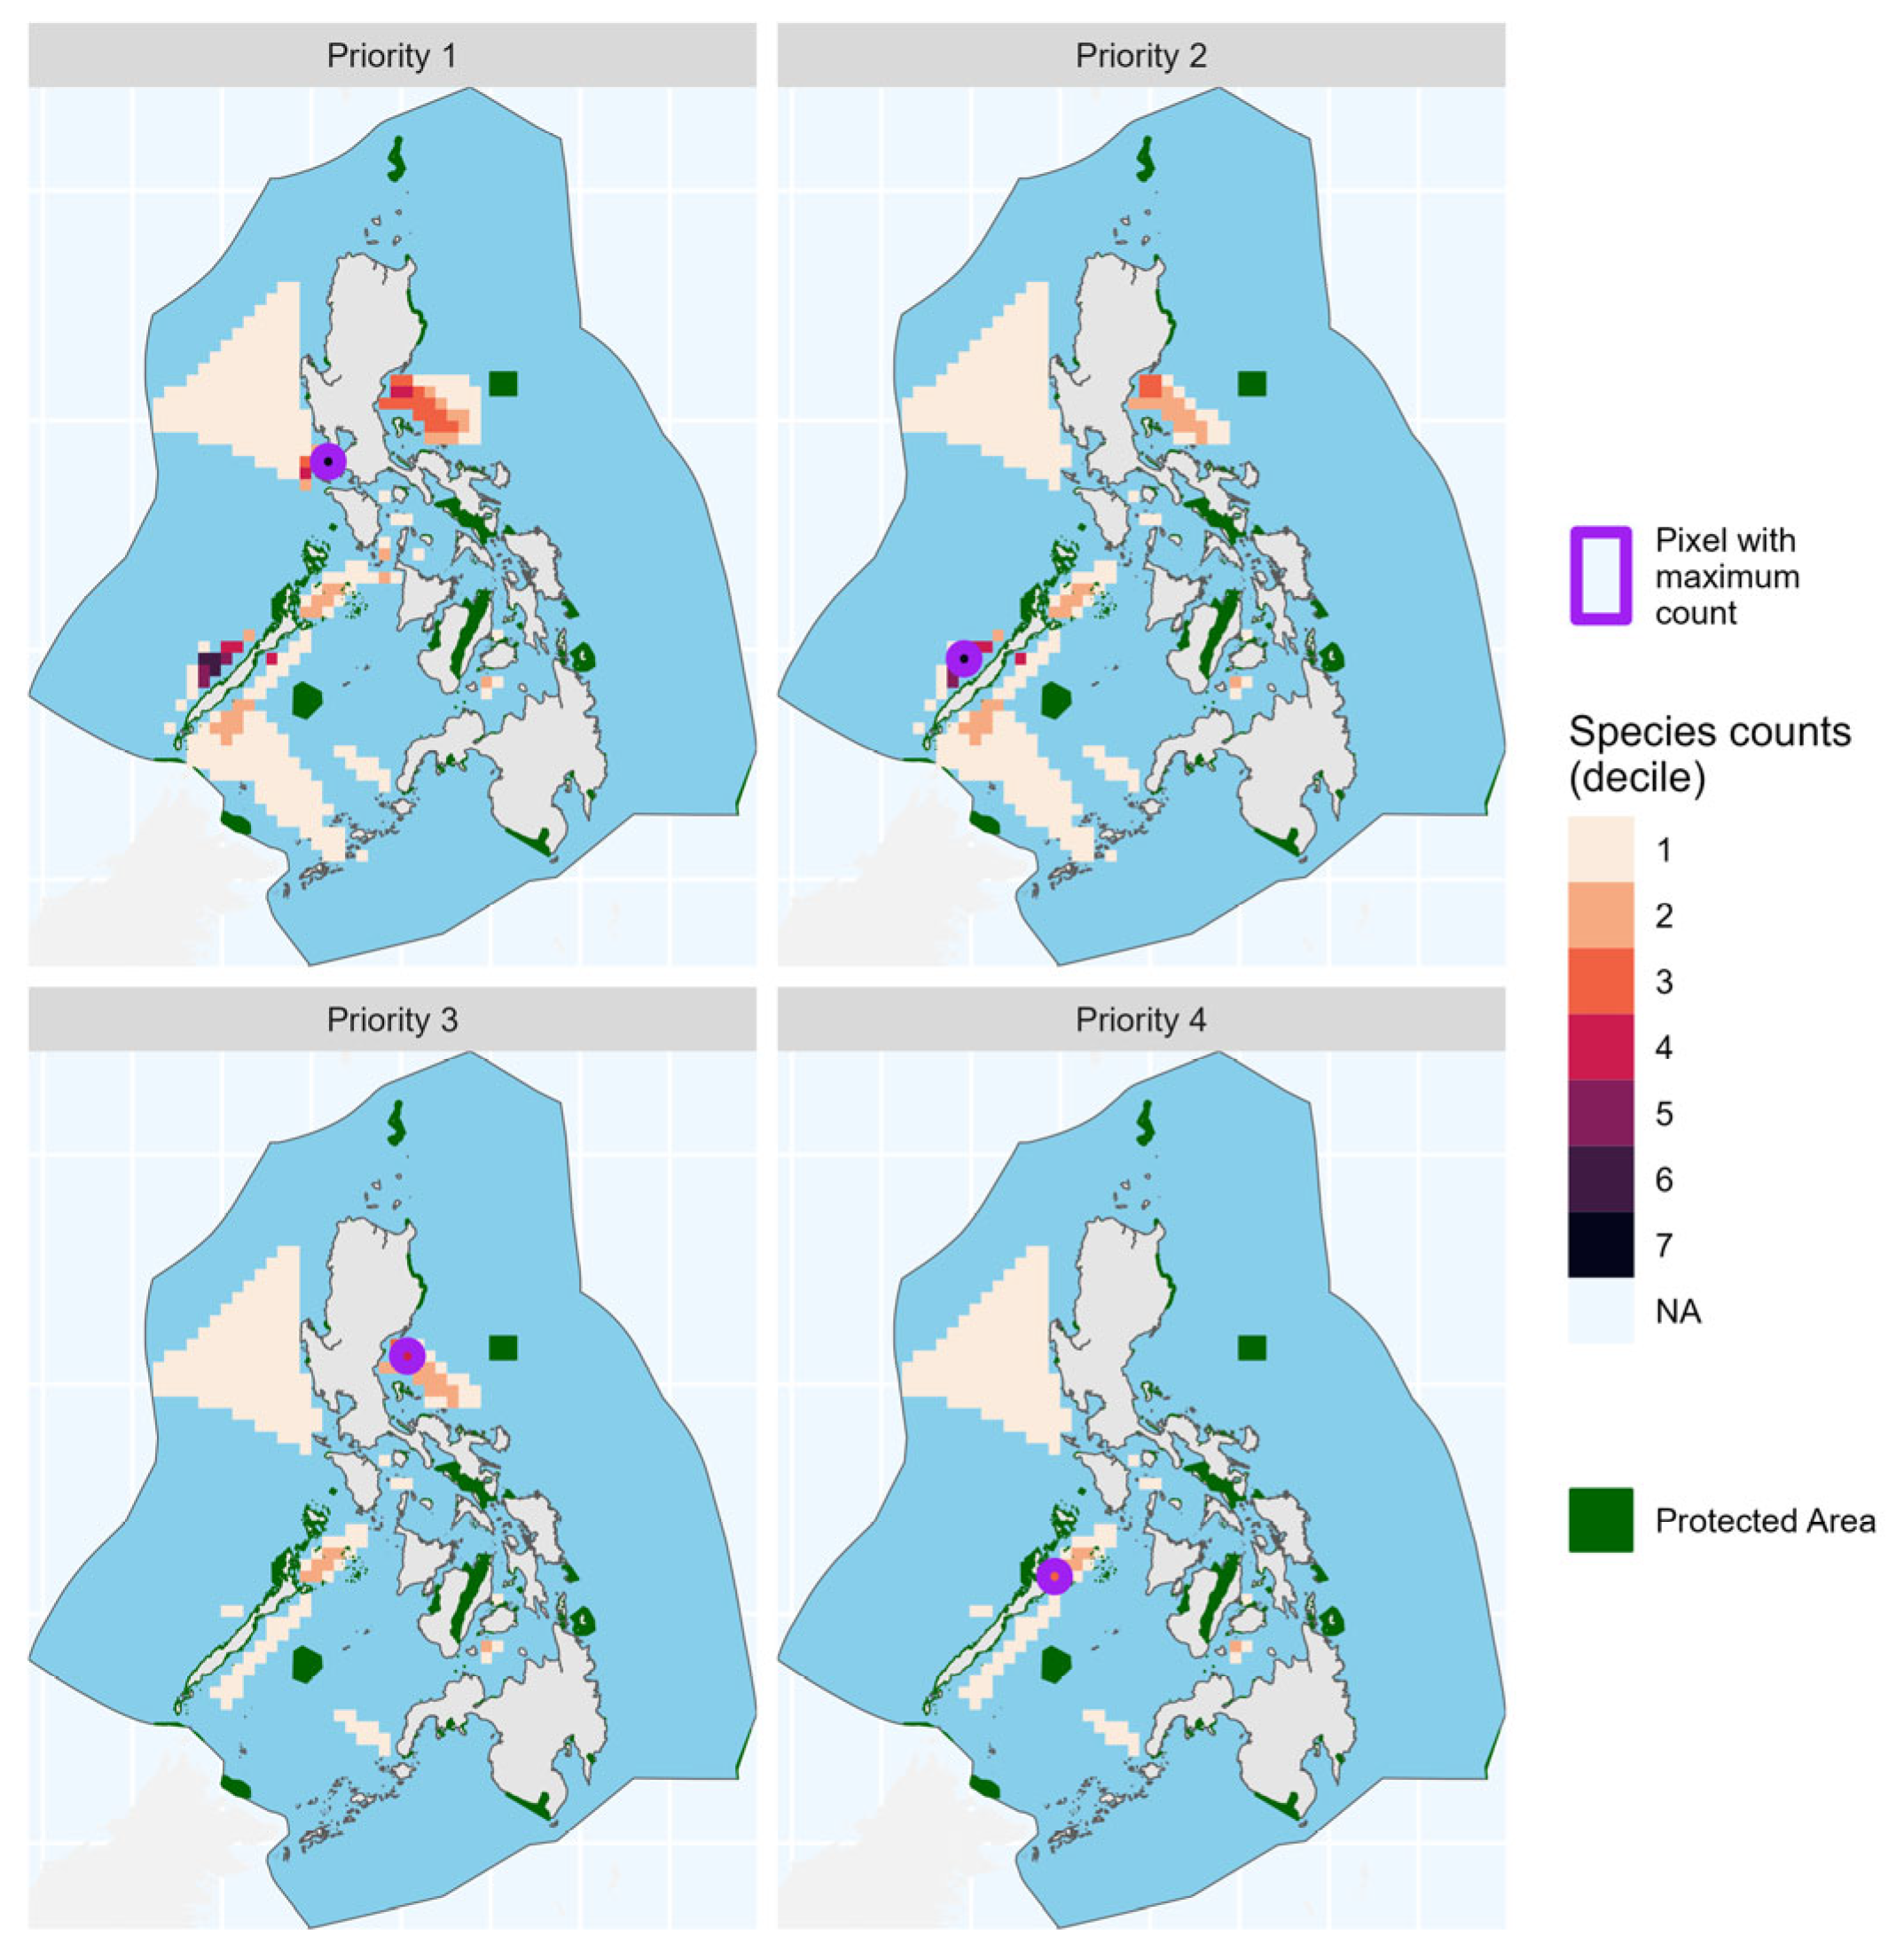
  • The algorithm first counted the number of unprotected species in each grid cell and identified the cell with the highest count as the top priority for protection (Priority 1).
  • Species residing in this cell were then set aside, and the process was repeated for the remaining species, identifying the next highest-count grid cell as the Priority 2 candidate.
  • This iterative process continued until all species were covered by at least one grid cell. In cases where multiple grid cells had the same maximum species count, the algorithm made a random selection.
Since our method does not guarantee that each species within a grid cell will be protected, as defined by our criterion (protection for less than 5% of a species’ occurrence map and less than 25 sq km), we provide a remedy by expanding the protected area until the coverage achieved removes all species from unprotected status. To compute the needed expansion for the identified species, we generate a sequence of circles from the centroid of the identified grid cell, starting with the circle that circumscribes the cell, the radius of which is one-half the length of the cell side. In each iteration, we expand the radius by 10% successively until coverage for all of the identified species is achieved.

2.2.4. Setting Priorities for Protection in Absence of Comprehensive Information on Protected Areas

Our methodology identifies location-specific clusters of species at risk, providing a valuable tool for pinpointing areas with high concentrations of critical species amidst the ongoing global biodiversity crisis. This approach enables the prioritization of conservation efforts, even in the absence of comprehensive information on existing protected areas. The flowchart in Figure 1 presents the sequential steps from the data source in the first row to the result at the bottom (see Figure 1). Supplemental Data S1 and Data S2 highlight the main optimization algorithm and post-processing pseudo-code and R script, respectively. To demonstrate its applicability, we present case studies from China and India [16,17].

3. Results

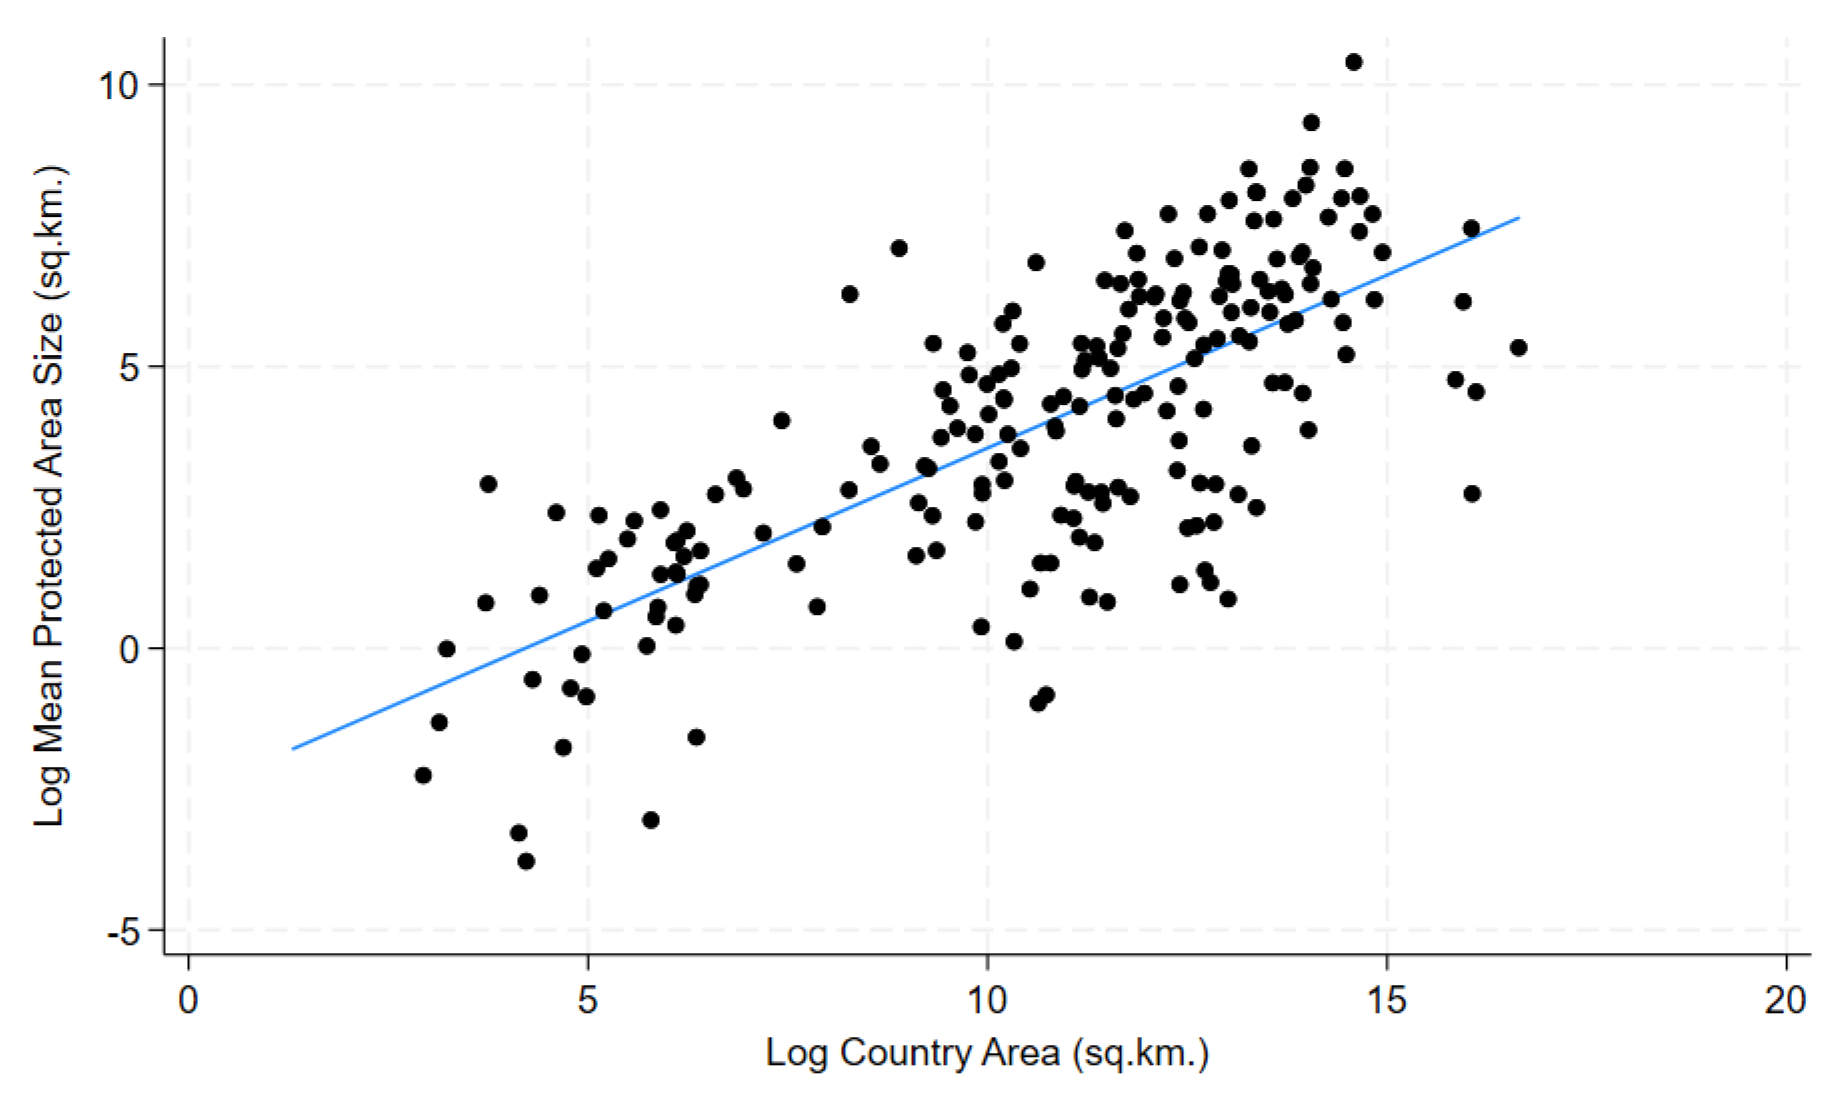
3.1. Estimation of Mean Protected-Area Size and the Corresponding Grid-Cell Resolution

Figure 2 displays the scatter diagram of country area (in logarithms) and mean protected-area size.
Table 2 reports results for the estimated (blue) regression line in Figure 2. The regression relates the logarithms of country sizes to the logarithms of countries’ mean protected-area sizes. The estimated regression coefficient can be interpreted as a response elasticity: Mean protected-area size increases by 0.614% with each 1% increase in country area, with very high significance (regression t-statistic of 15.47).
Using the regression results and land-area data from the World Bank’s country shapefiles [18], we estimated the mean protected-area size for each country and determined the corresponding grid-cell resolution. The appropriate grid resolutions are 0.332° (36.9 km) for Brazil, 0.136° (15.1 km) for Cameroon, 0.183° (20.3 km) for South Africa, 0.069° (7.7 km) for Costa Rica, 0.136° (15.1 km) for Ecuador, 0.136° (15.1 km) for Papua New Guinea. 0.253° (28.1 km) for the Philippines, and 0.197° (21.9 km) for Madagascar.

3.2. Variations in Protected Areas and Endemic Species Coverage Across Case-Study Countries

Brazil: Brazil’s 5499 designated protected areas span approximately 2.6 million km2, covering 30.6% of the country’s total land area. These areas provide substantial protection for 93% of Brazil’s terrestrial 20,245 endemic species cataloged in our database. However, 1412 endemic species have either sparse coverage or fall entirely outside the existing protected areas.
Cameroon: Cameroon’s protected-area network covers approximately 55,600 km2, equivalent to 12% of the country’s total land area (464,319 km2). These areas provide protection for 70.7% of the country’s 645 terrestrial endemic species cataloged in our database. However, 189 species (29.3%) remain unprotected.
South Africa: South Africa’s protected-area system currently covers approximately 130,000 km2, representing approximately 9% of the national land territory. Protected areas provide significant conservation coverage for 91% of the 12,793 terrestrial endemic species recorded in our database. However, 1192 endemic species remain unprotected under the current protected-area network.
Costa Rica: Costa Rica has established an extensive protected-area system, with 44,000 km2 in protected areas covering approximately 59% of the national territory. These areas provide conservation coverage for 97.9% of the country’s endemic biodiversity. Of the 6075 terrestrial endemic species recorded in our database, 5950 species (97.9%) are found within protected areas, leaving only 125 species unprotected based on our criteria.
Ecuador: Ecuador’s 82,000 km2 in protected areas encompasses approximately 23% of the national land territory, offering conservation coverage for roughly 80% of the country’s 3477 terrestrial endemic species cataloged in our database. However, 698 endemic species remain unprotected under the current system.
Papua New Guinea: In contrast, Papua New Guinea’s 23,384 km2 of currently protected areas covers only about 4% of the national territory, providing protection for 61% of the 3266 terrestrial endemic species recorded in our database. Consequently, 1270 endemic species remain unprotected under the current criteria.
Philippines: Our measure of the Philippines’ EEZ area is 1,964,764 square kilometers, with 1.6% (32,053 square kilometers) designated within 103 marine protected areas. There are 82 endemic marine species recorded, of which 55 (67%) are protected. The grid resolution for the Philippines is 0.253 DD (28.1 km).
Madagascar: Madagascar has an EEZ area of 1,196,285 square kilometers, with 1.2% (14,457 square kilometers) included in 79 marine protected areas. The database lists 67 endemic marine species, and 43 (64.2%) of them are protected.

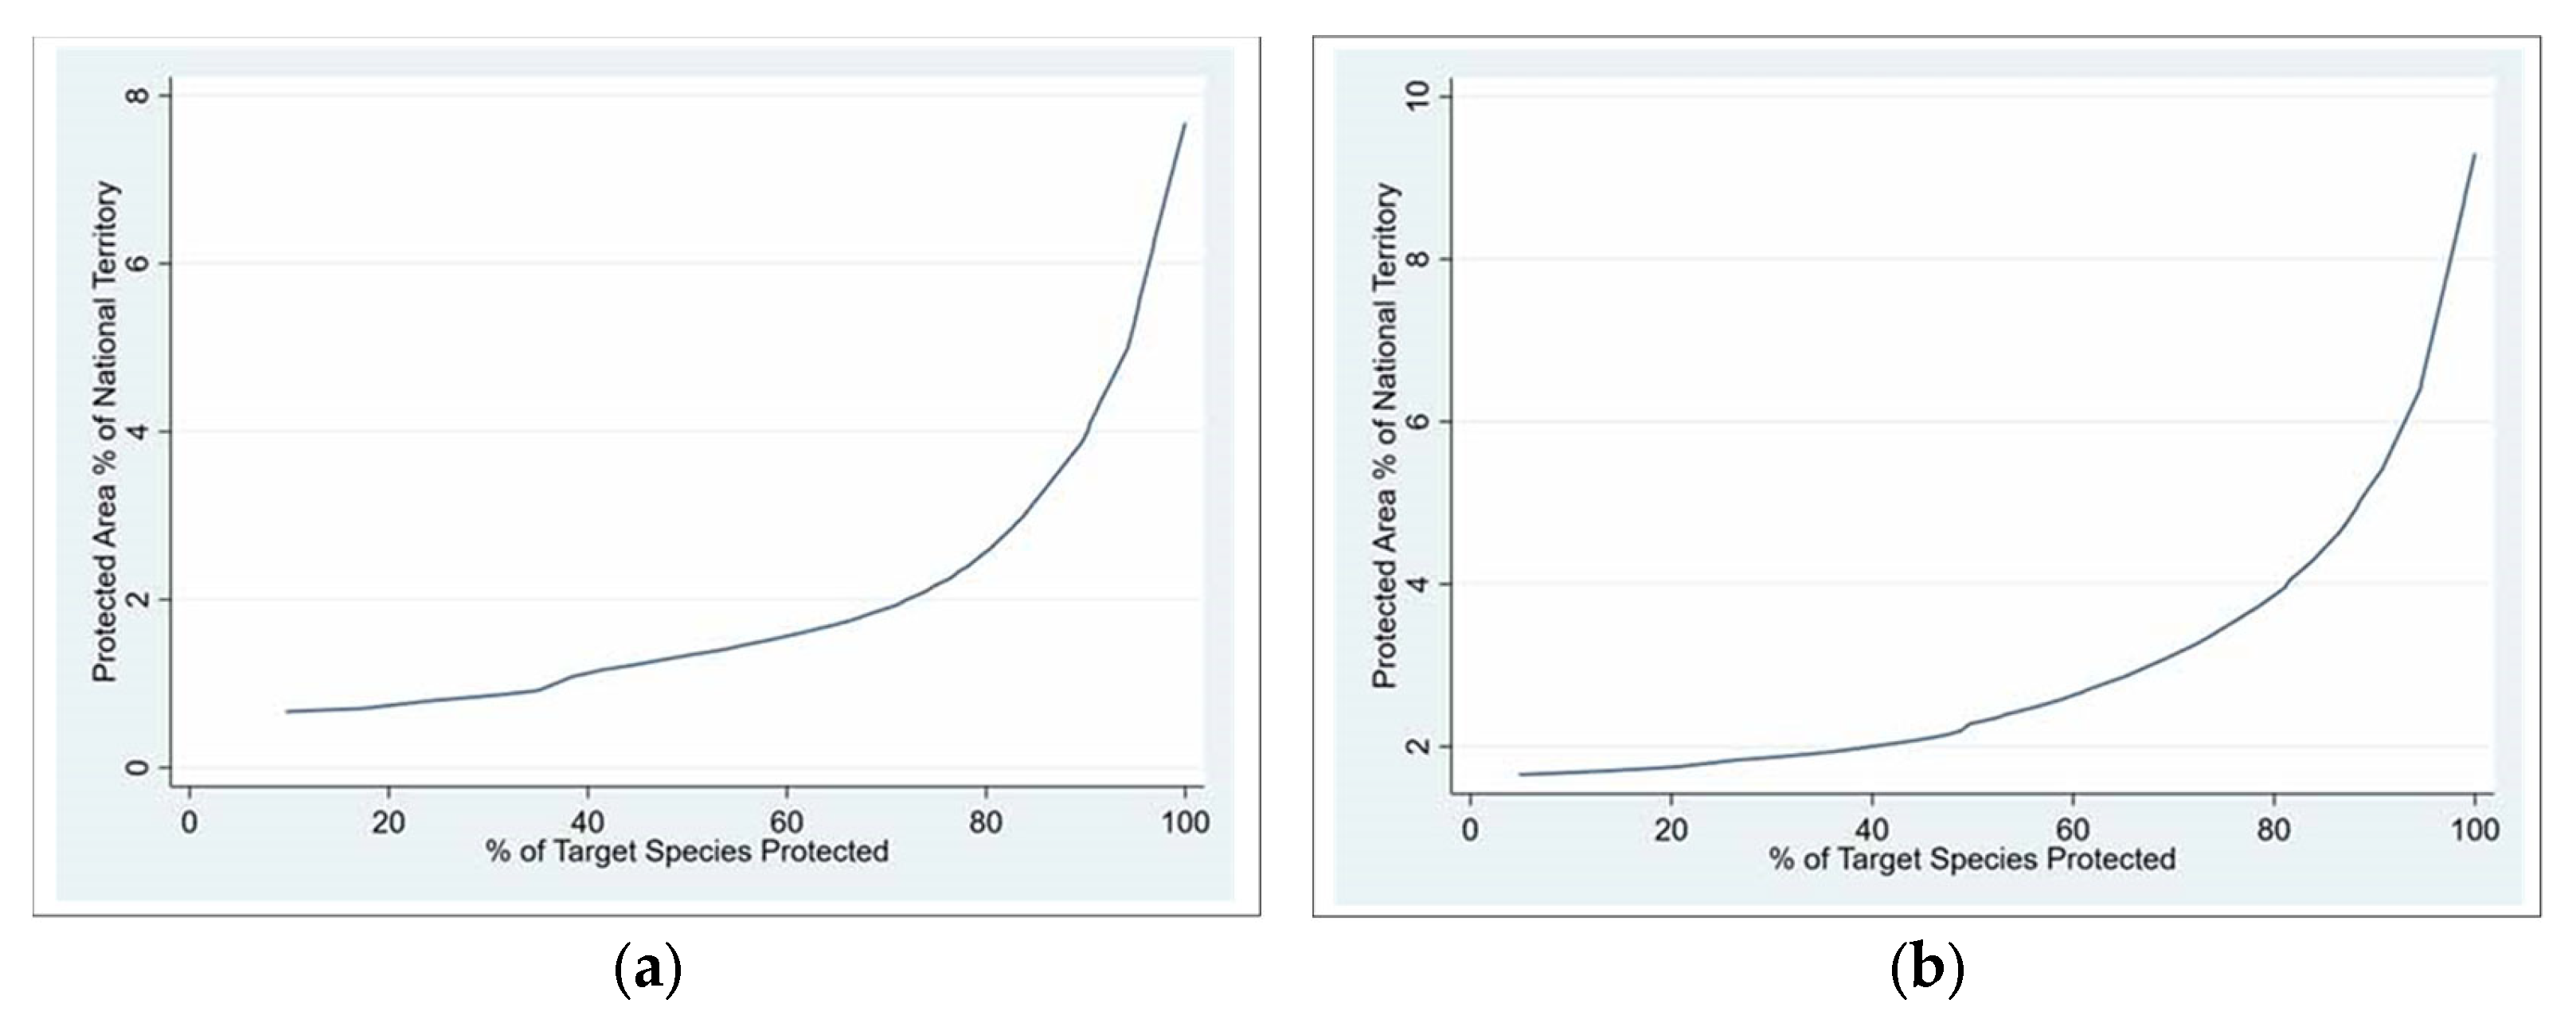
3.3. Selection of Priority Areas

In the Introduction, we introduced several criteria that were used to select case countries. For expositional clarity, this section presents pairwise country cases that differ by size and region.

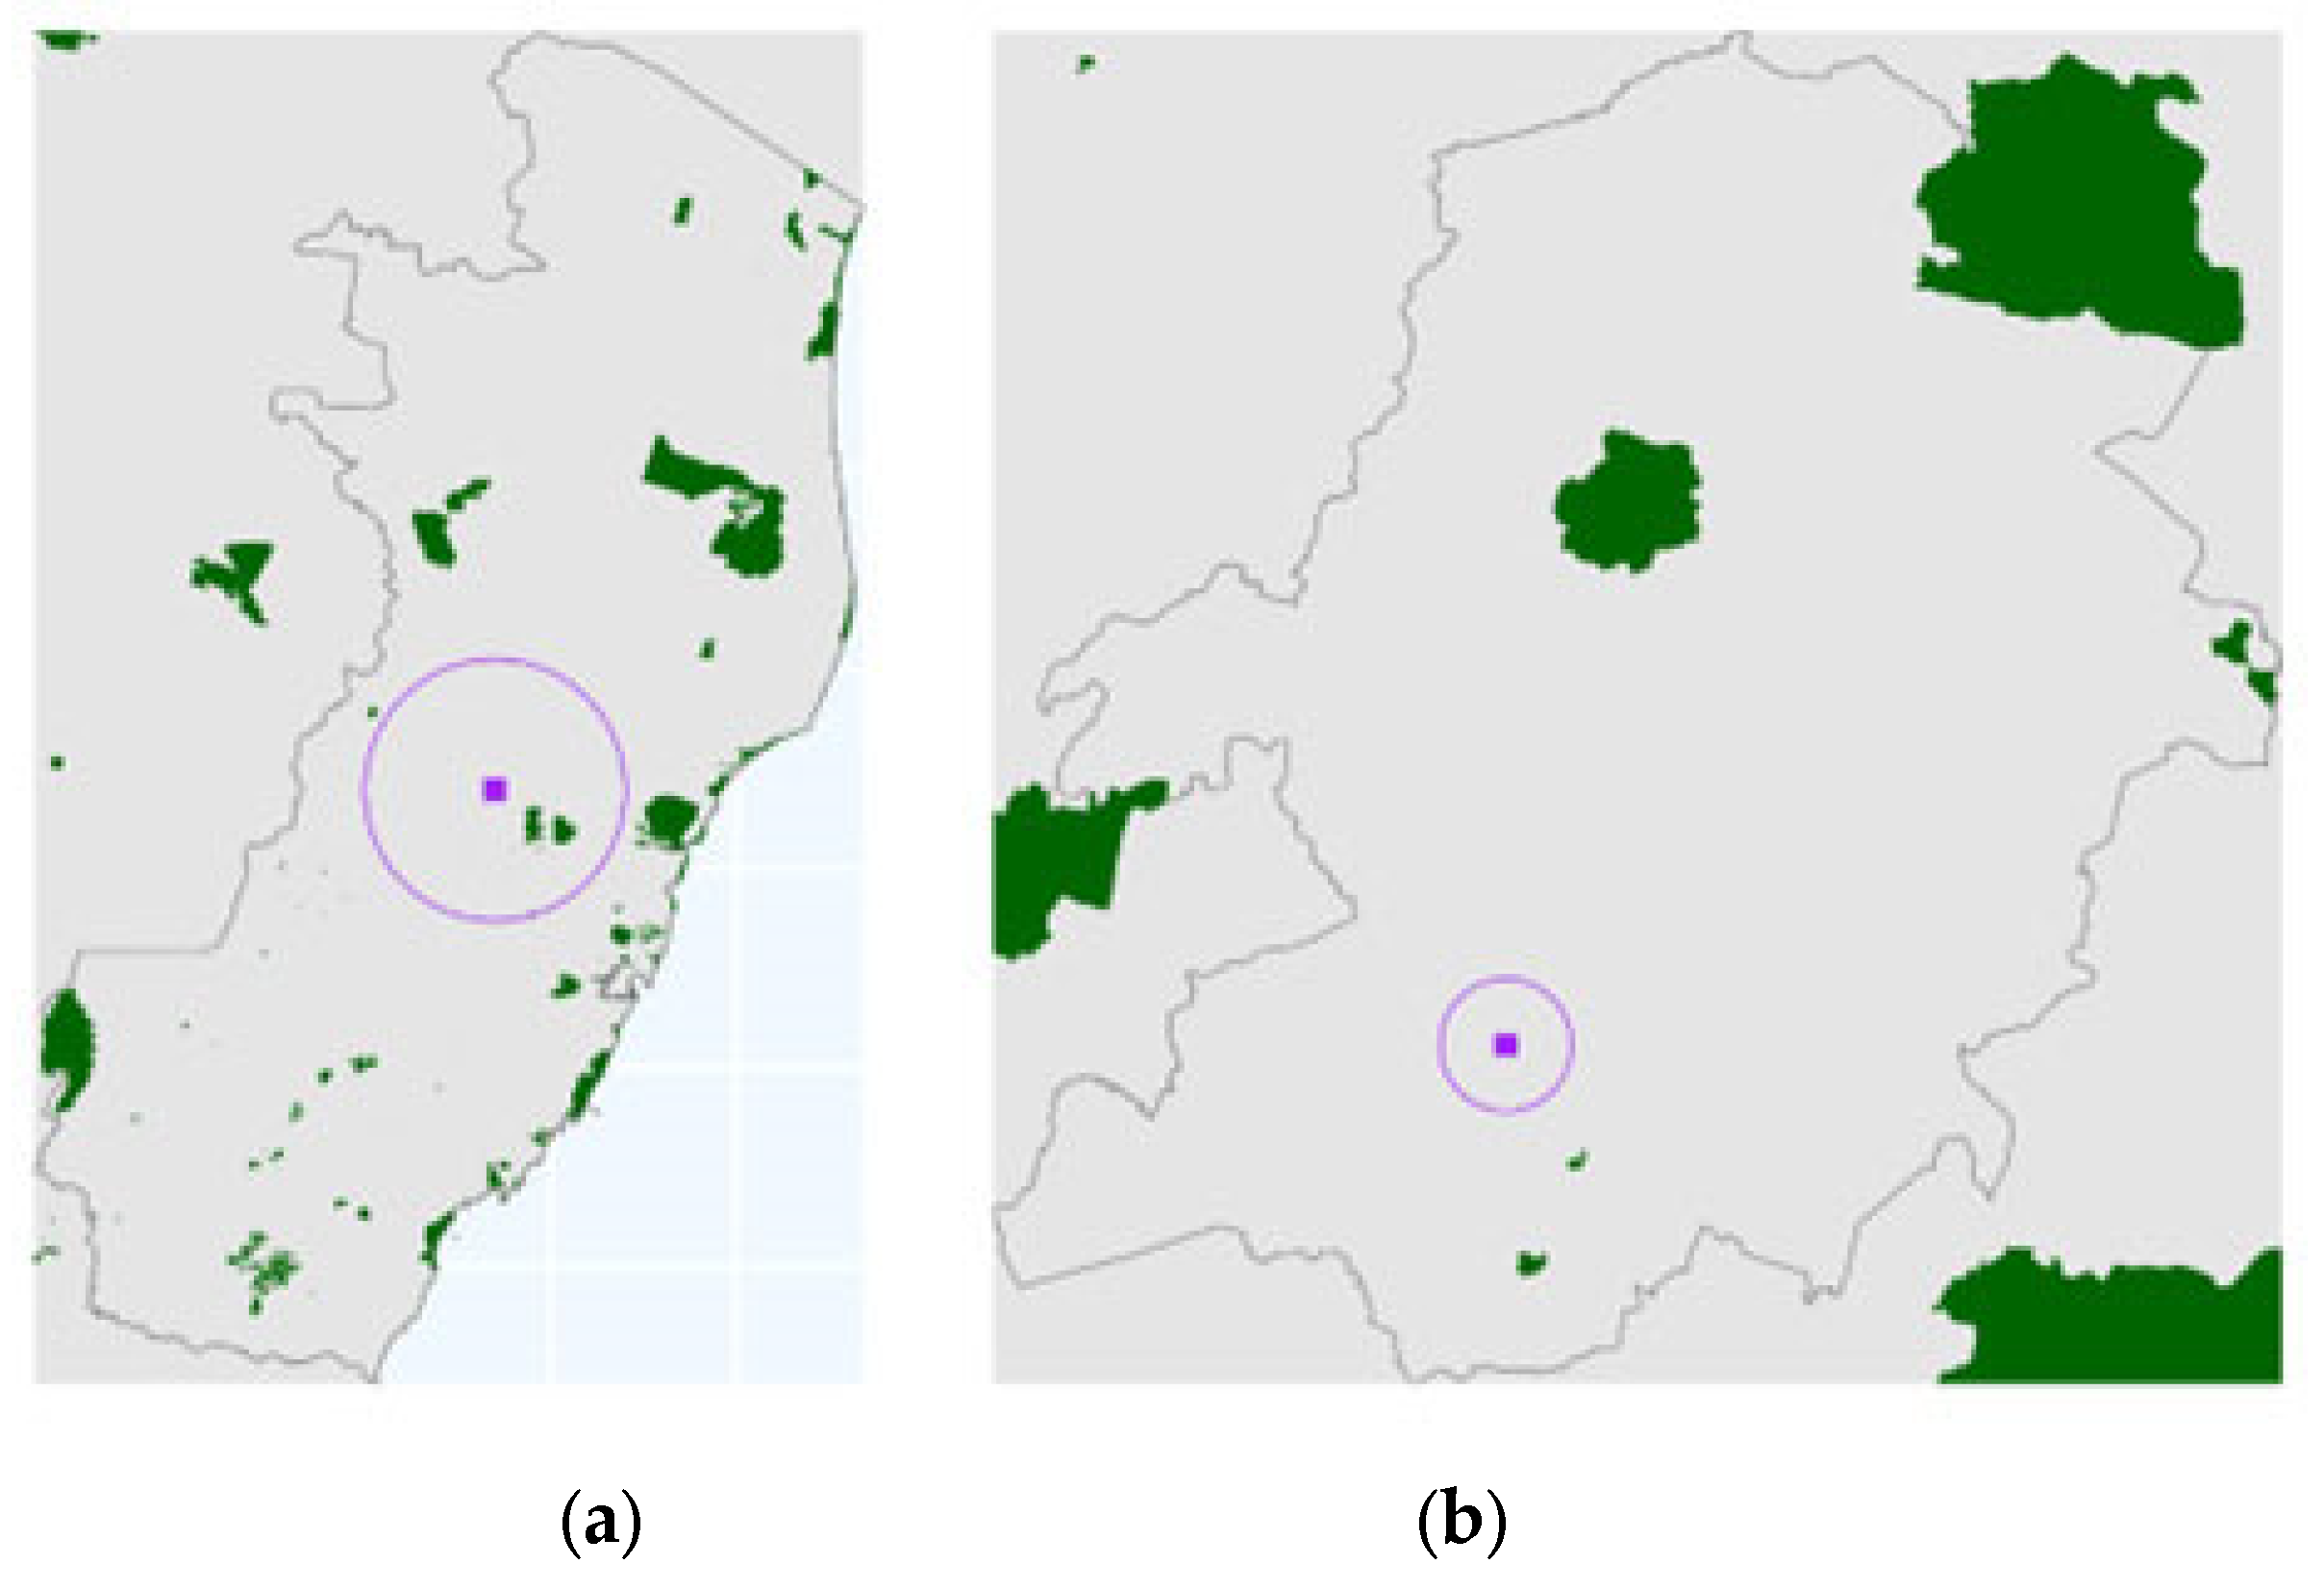
3.4. Brazil and Cameroon: Similar Geography for Unprotected Species with Small Occurrence Ranges Outside Protected Areas

Figure 3 illustrates the distribution of Brazil’s protected areas (dark green), which are predominantly concentrated in the northern and northwestern regions, providing extensive conservation coverage. Species with broad distribution ranges benefit from this protection; however, many unprotected endemic species are concentrated in the eastern and southeastern regions, where protected-area coverage is limited. The four panels in Figure 3 illustrate our iterative selection method, showing the sequential identification of high-priority areas for new protection in four steps. Grid-cell counts are color-coded by increasing priority status from light tan to dark purple.
Brazil’s 1412 unprotected endemic species are clustered mainly in the eastern and southeastern regions. In our sequential algorithm, the first-identified high-priority area (Priority 1) is in Central Espírito Santo, covering 98 unprotected species (Figure 3, upper-left panel). Northeastern Amazon follows as Priority 2, encompassing 43 species (Figure 3, upper-right panel). Eastern Paraná (Priority 3) and Northern Paraná (Priority 4) provide coverage for 32 and 30 species, respectively (Figure 3, lower panels). Collectively, these four 37 km × 37 km areas contain 203 (14.4%) of Brazil’s unprotected endemic species.
Figure 4 presents Cameroon’s protected areas (dark green), revealing a similar pattern where many unprotected endemic species are outside existing reserves, often within restricted ranges. The four panels in Figure 4 depict the highest-priority areas for new protection. The most concentrated cluster (Priority 1) is in the southern part of the Centre Region, covering 24 unprotected species (Figure 4, upper-left panel). The Priority 2 area, in central Northwest Region, includes 21 species (Figure 4, upper-right panel). Priority 3 and 4 areas, located in the Southwestern East Region (Figure 4, lower-left panel) and the southern Southwest Region (Figure 4, lower-right panel), provide coverage for 16 and 15 species, respectively. Collectively, these four 15 km × 15 km areas encompass 76 (40.2%) of Cameroon’s unprotected endemic species.
The results of our analyses for Brazil and Cameroon suggest that relatively few newly designated protected areas could provide substantial coverage for unprotected endemic species in these two countries. If the species-occurrence maps are accurate, the grid cells identified in this analysis will include all overlapping species. Since our method does not guarantee full protection for all species within a cell, we apply an iterative radial expansion approach (as described in Section 2.2.3) to determine the necessary protected-area expansion for complete coverage.
When we compute the needed expansion for the 98 species identified in the first iteration of our area selection methodology for Brazil, we find that increasing the radius 10% from the centroid of the grid cell removes 92 of 98 species from unprotected status. Increasing it another 10% removes three additional species, with the remaining three removed by radial expansions of 30%, 40%, and 50%, respectively. Similarly, for Cameroon, a 10% expansion protects 9 of the 24 species in the Priority 1 area, with successive expansions (20–50%) adding protection for 4, 3, 1, and 2 species, respectively; the remaining 5 require radial expansions of 70%, 80%, 120%, 150%, and 160%. Figure 5 displays the circular areas that provide protection coverage for all species in the countries’ Priority 1 candidate areas. In both cases, they fall well within the size range of protected areas typical of these countries.

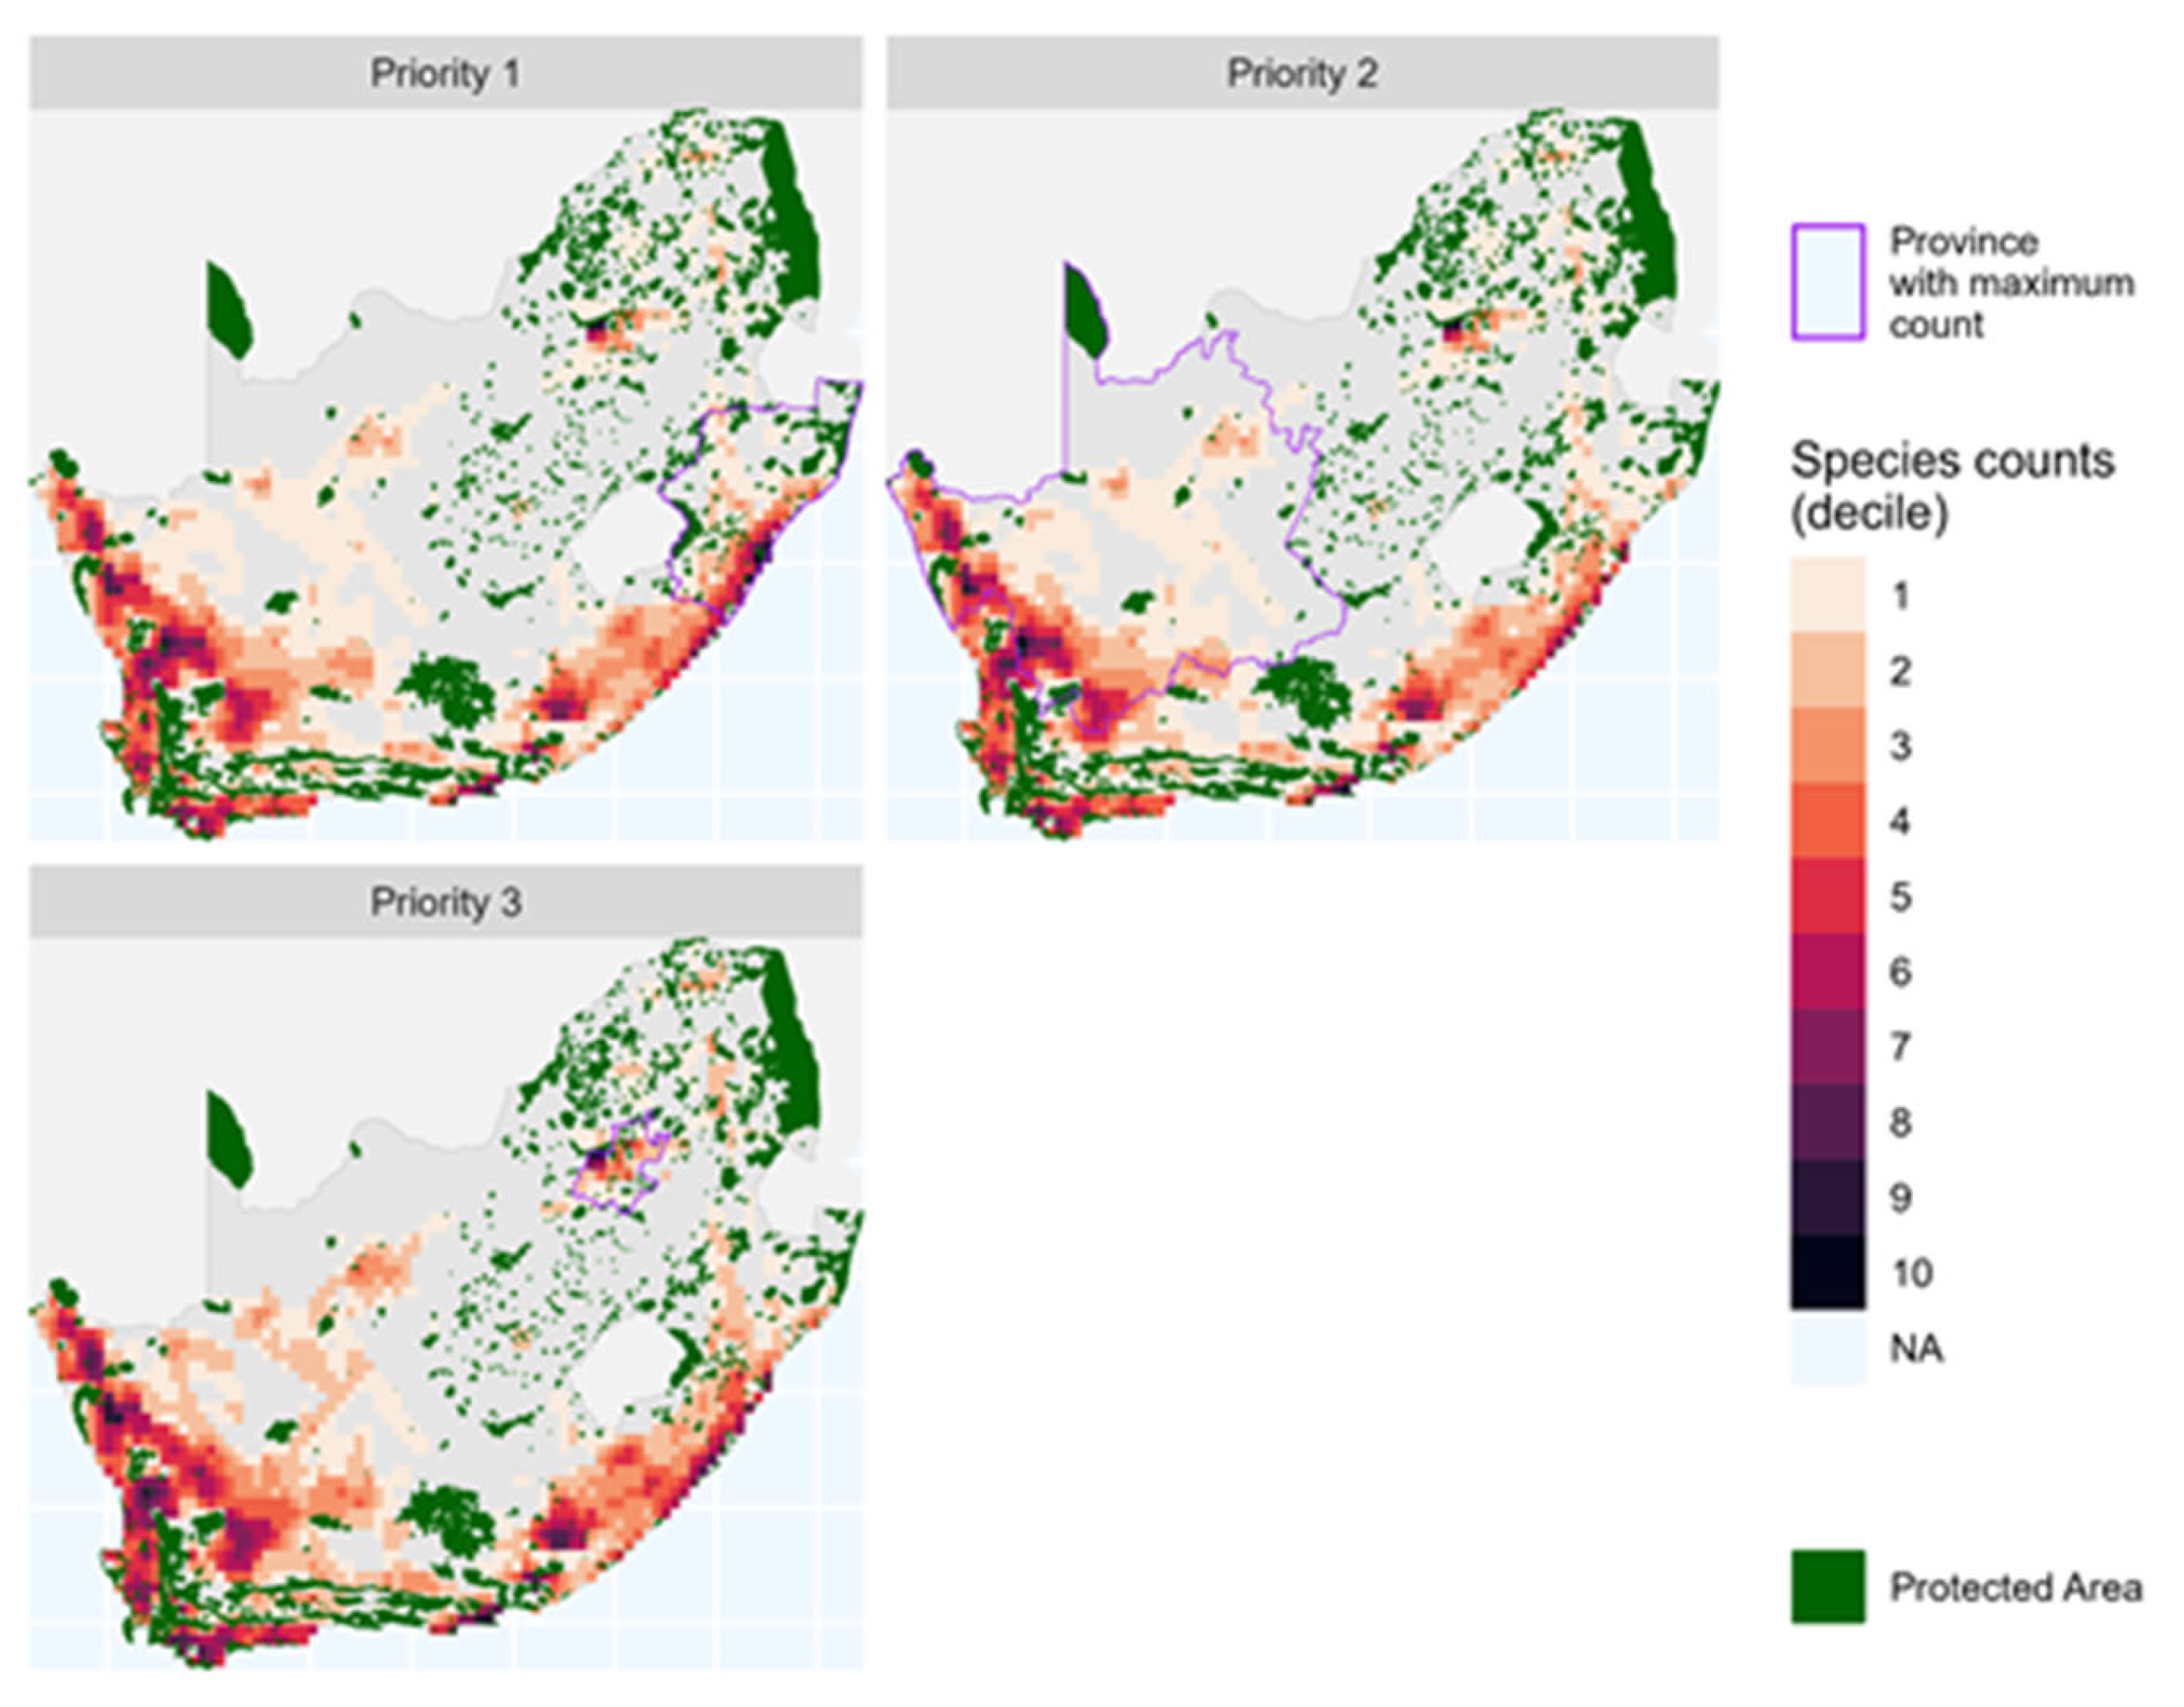
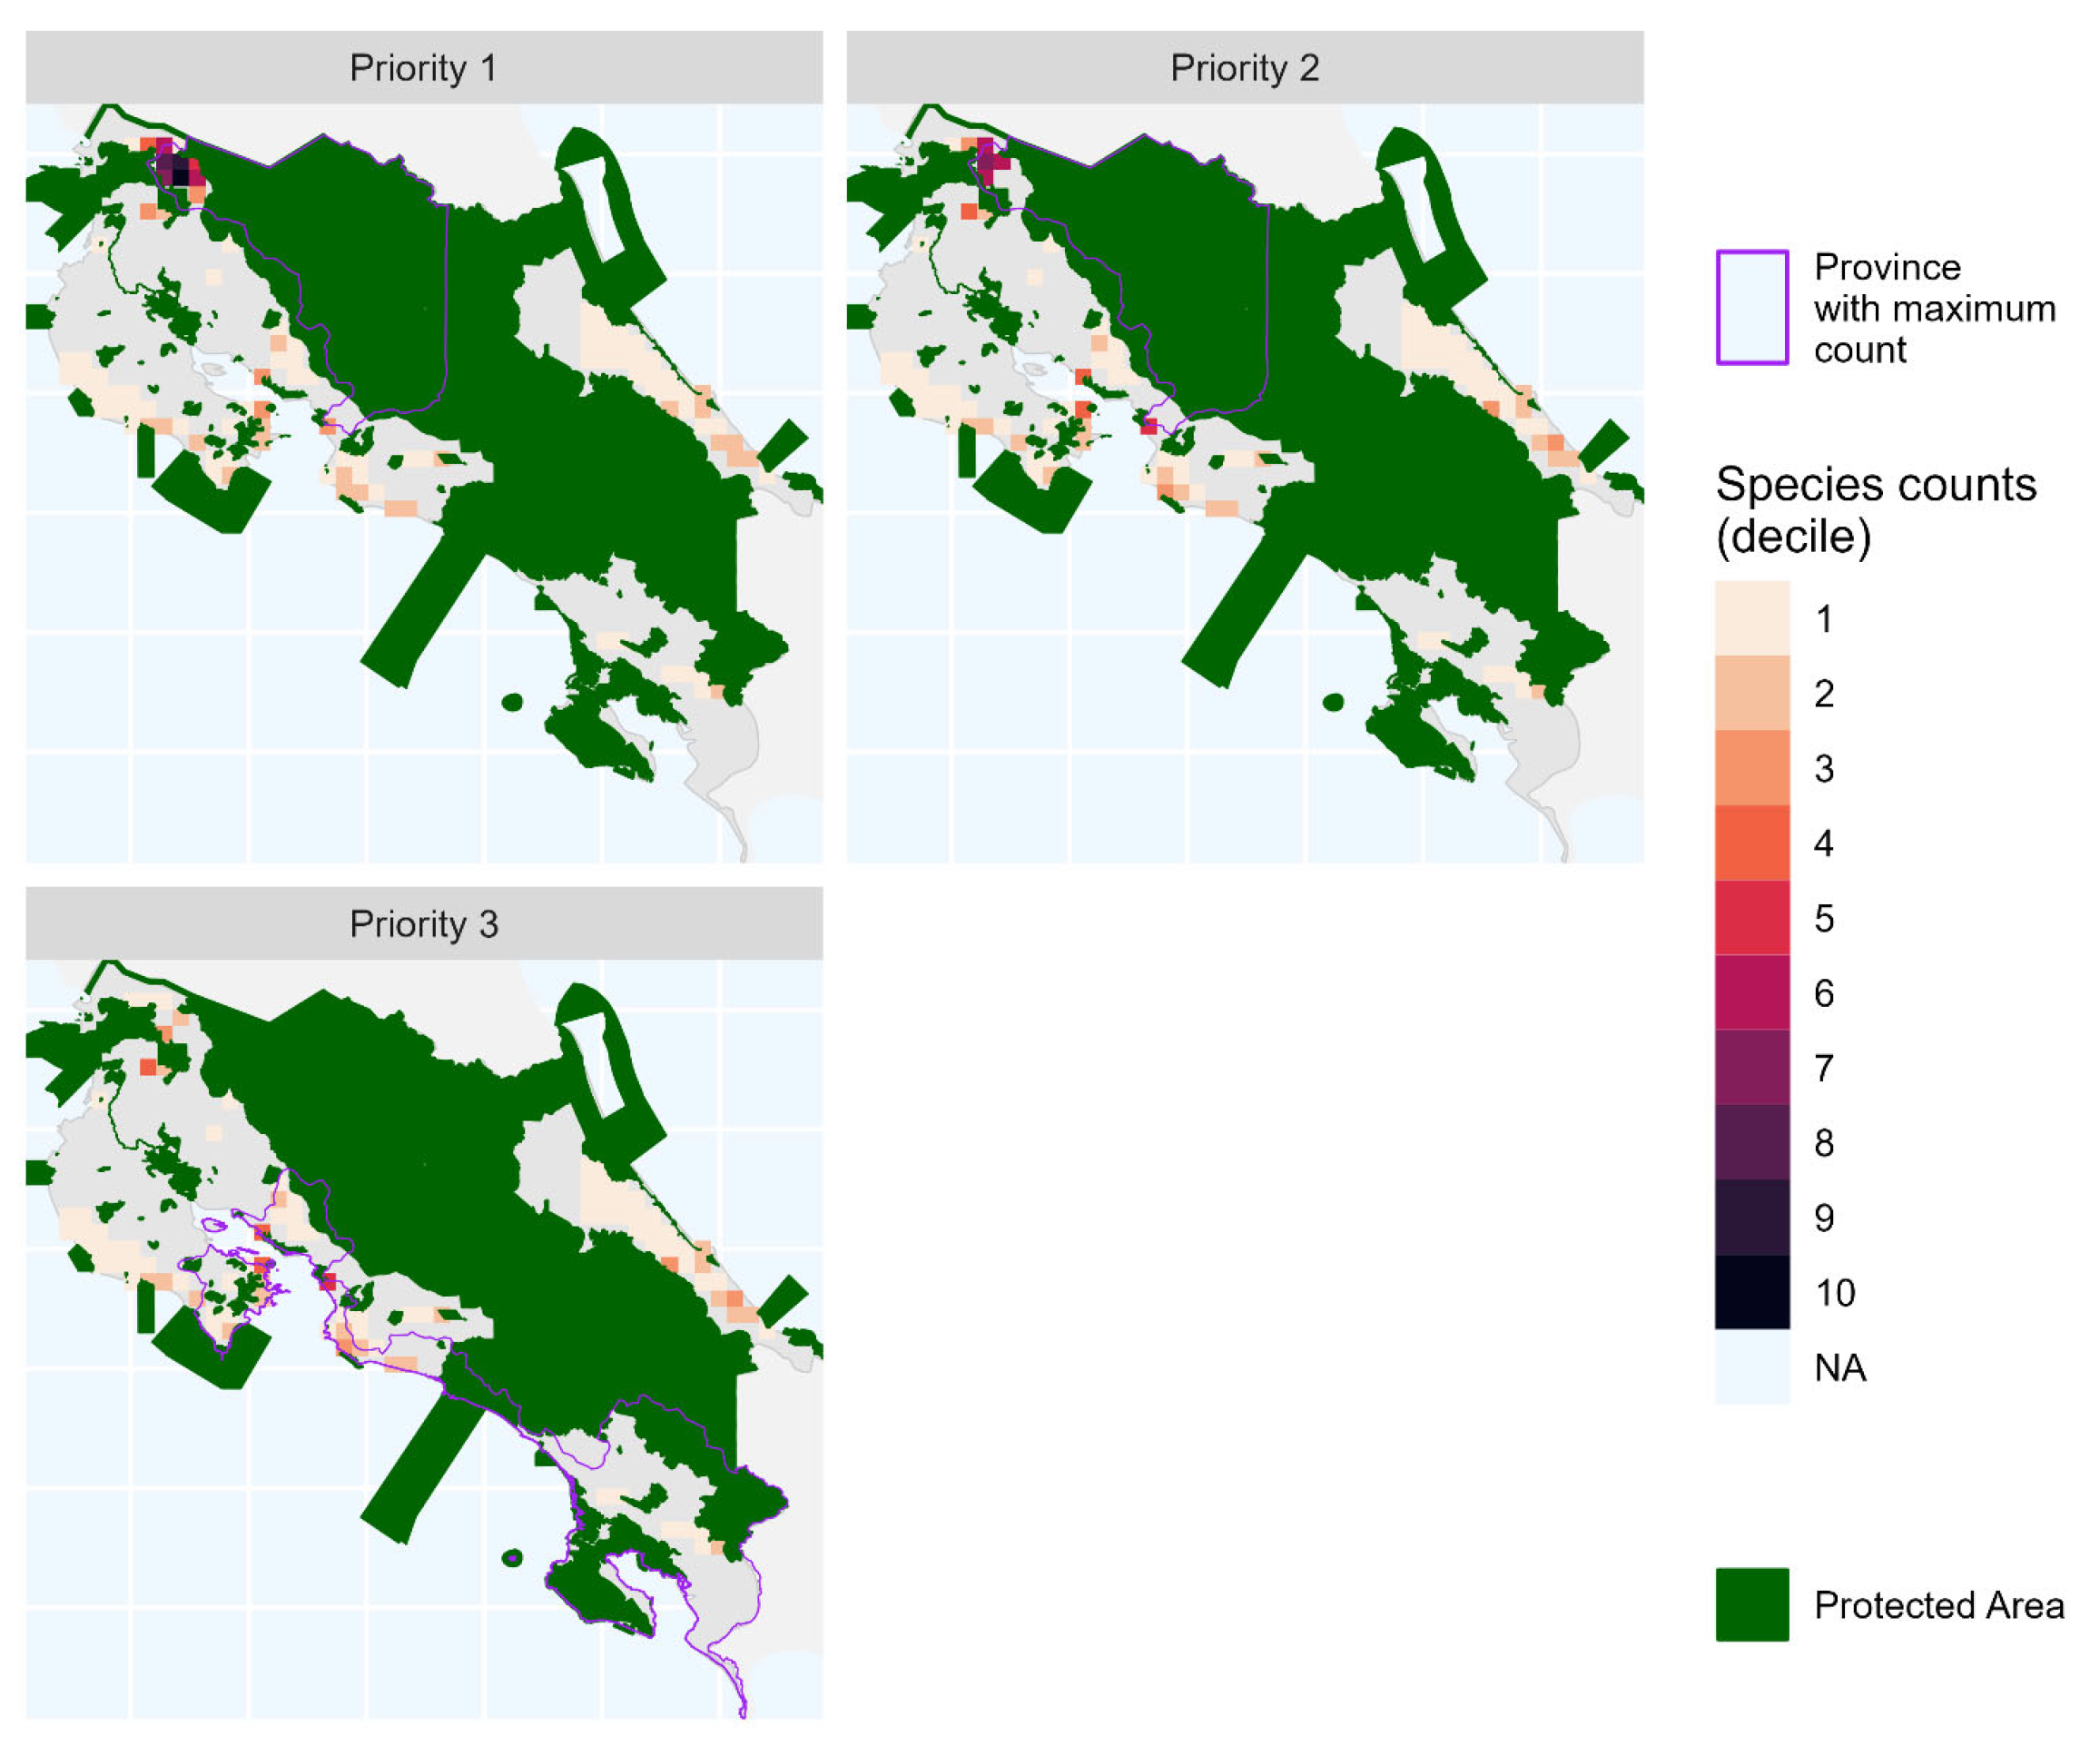
3.5. South Africa and Costa Rica: Contrasting Geographic Dispersion and Taxonomic Representation of Unprotected Species

Figure 6 and Figure 7 present the results of our priority-area identification for South Africa and Costa Rica. In South Africa, the top three priority areas for new protection are geographically dispersed. The highest-priority area is located in the eastern coastal region of KwaZulu-Natal (Figure 6, upper-left panel), followed by a second priority area in the far Western Northern Cape (Figure 6, upper-right panel) and a third in the interior northeastern region of Gauteng (Figure 6, lower-left panel). All three maps show that the priority grid cells have maximum species counts in distributions with relatively high counts across broad areas. Species coverage in all three priority areas is relatively large.
In contrast, the priority areas identified in Costa Rica are more geographically concentrated. The first and second priority areas are located in adjacent subregions of Western Alajuela Province, while the third is in the central coastal region of Puntarenas Province (Figure 7). Unlike South Africa, high species counts in Costa Rica are more localized, with little dispersion beyond the identified priority areas.
Taxonomic representation also differs between the two countries. In South Africa, the highest-priority area is dominated by arthropods but also includes vertebrates, plants, and other species. In the second and third priority areas, taxonomic diversity narrows, with species confined to plants and arthropods. The second priority area has a higher representation of plants, whereas only a single plant species is present in the third (Supplementary Table S1a). In Costa Rica, arthropods dominate the first and second priority areas, while the third priority area consists entirely of other species. Species richness declines sharply across priority areas, from 73 species in the first to 8 in the second and 5 in the third (Supplementary Table S1b).
Across the top 10 priority areas, taxonomic representation in South Africa varies widely, ranging from 2.1% to 96.8% for plants, 0% to 18.5% for vertebrates, 0% to 97.9% for arthropods, and 0% to 43.6% for other species (Table 3). In Costa Rica, arthropods dominate the two highest-priority areas, while taxonomic representation varies more in the remaining priority areas (Table 4).
These two countries highlight the importance of considering taxonomic groups beyond vertebrates in the identification of priority conservation areas. Additionally, differences in species distribution patterns suggest significant variations in the opportunity costs of expanding protected areas. In Costa Rica, where unprotected species are highly clustered, conservation efforts may require relatively little additional land. In contrast, South Africa’s widely dispersed clusters of unprotected species necessitate more extensive land acquisition to achieve comprehensive species protection.

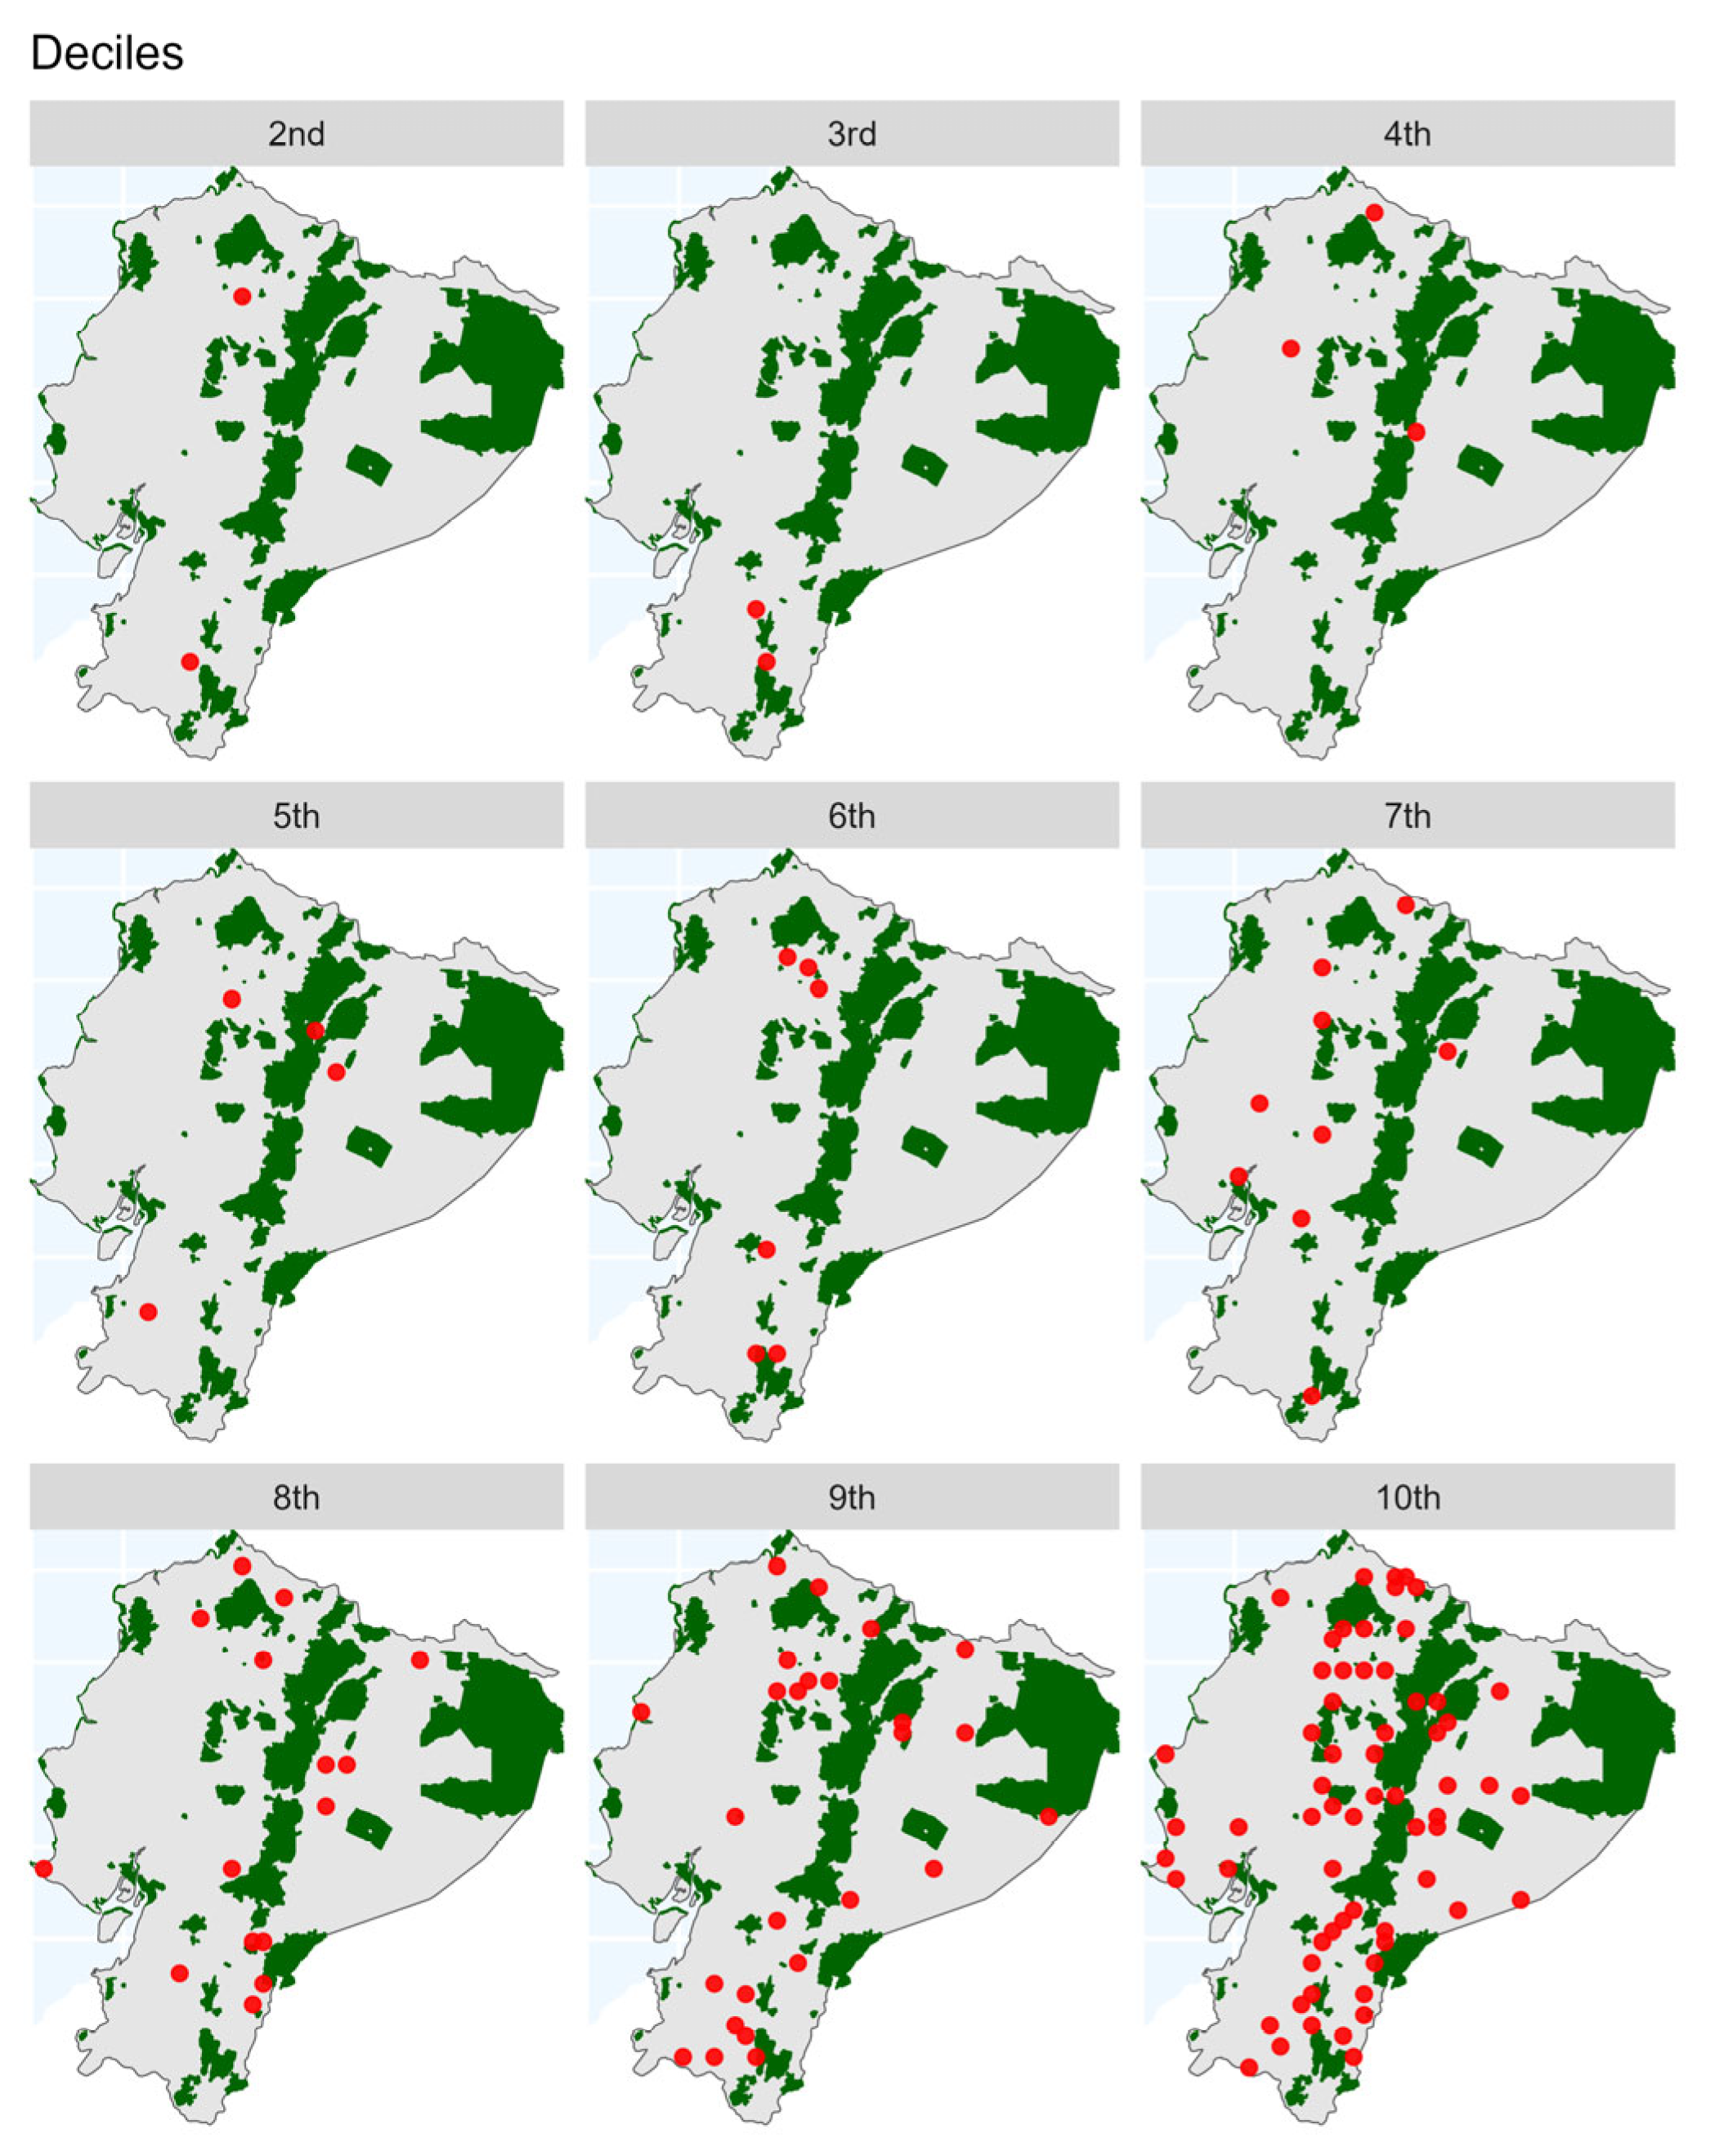
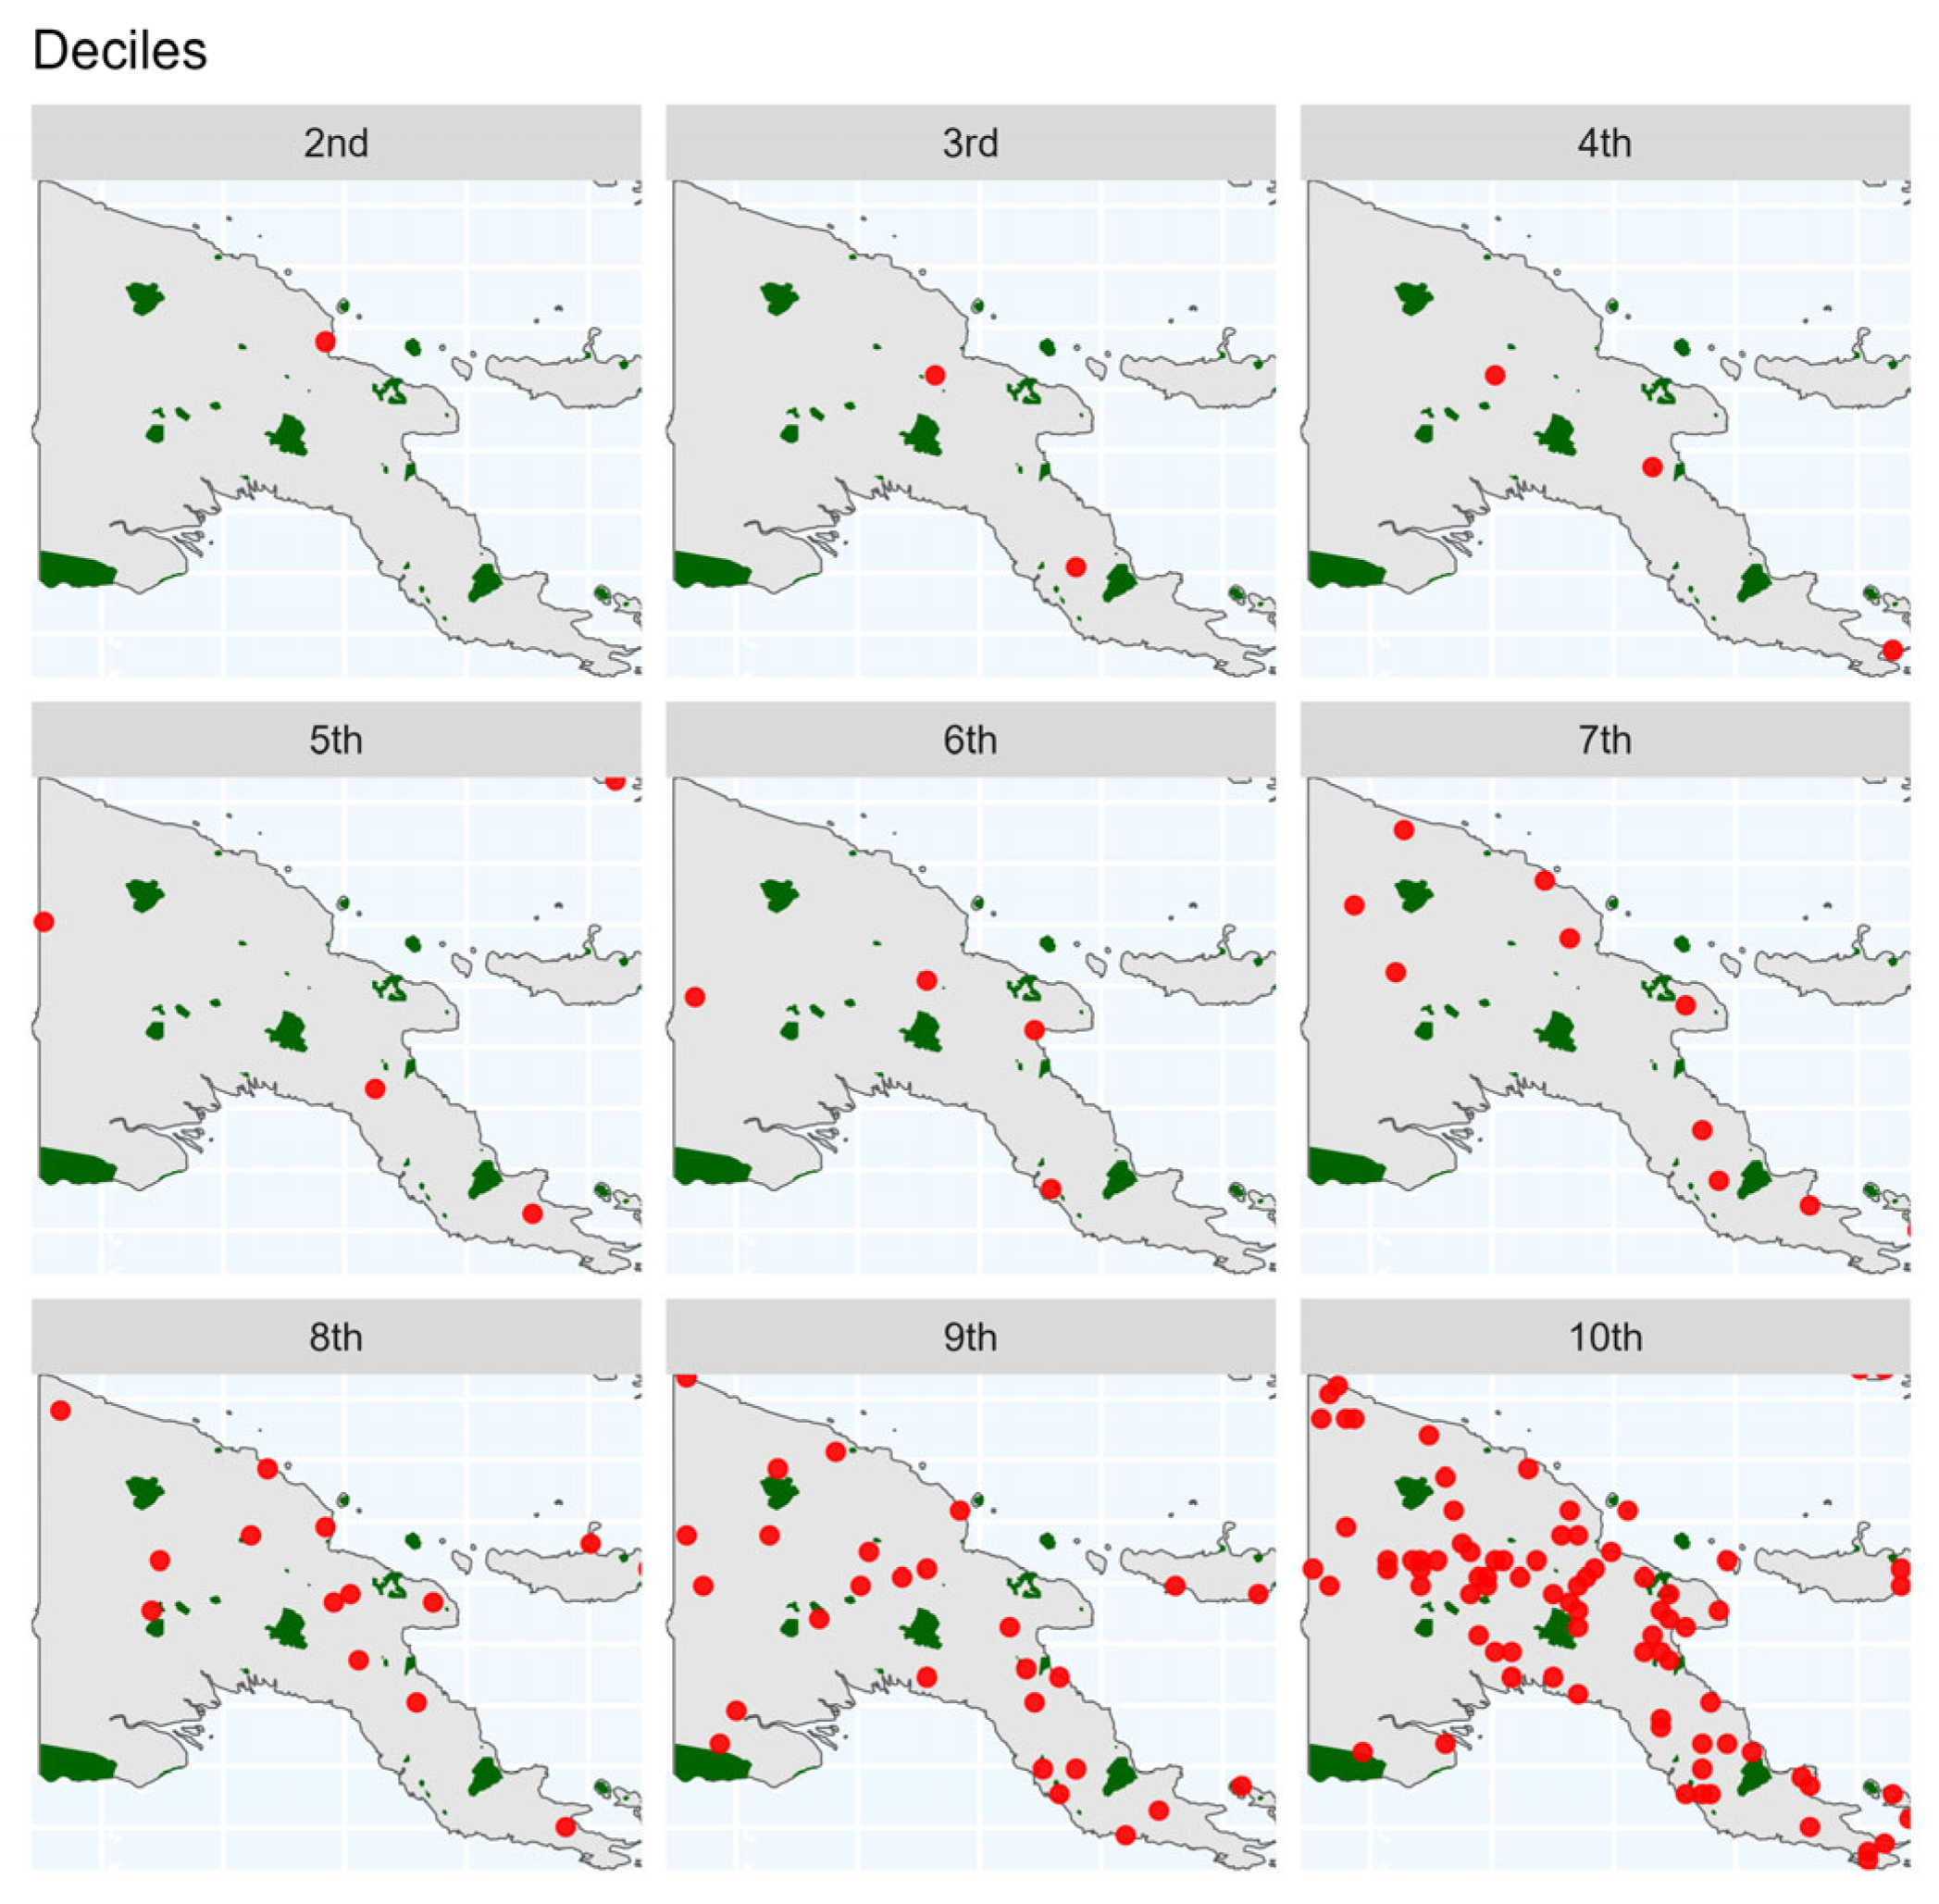
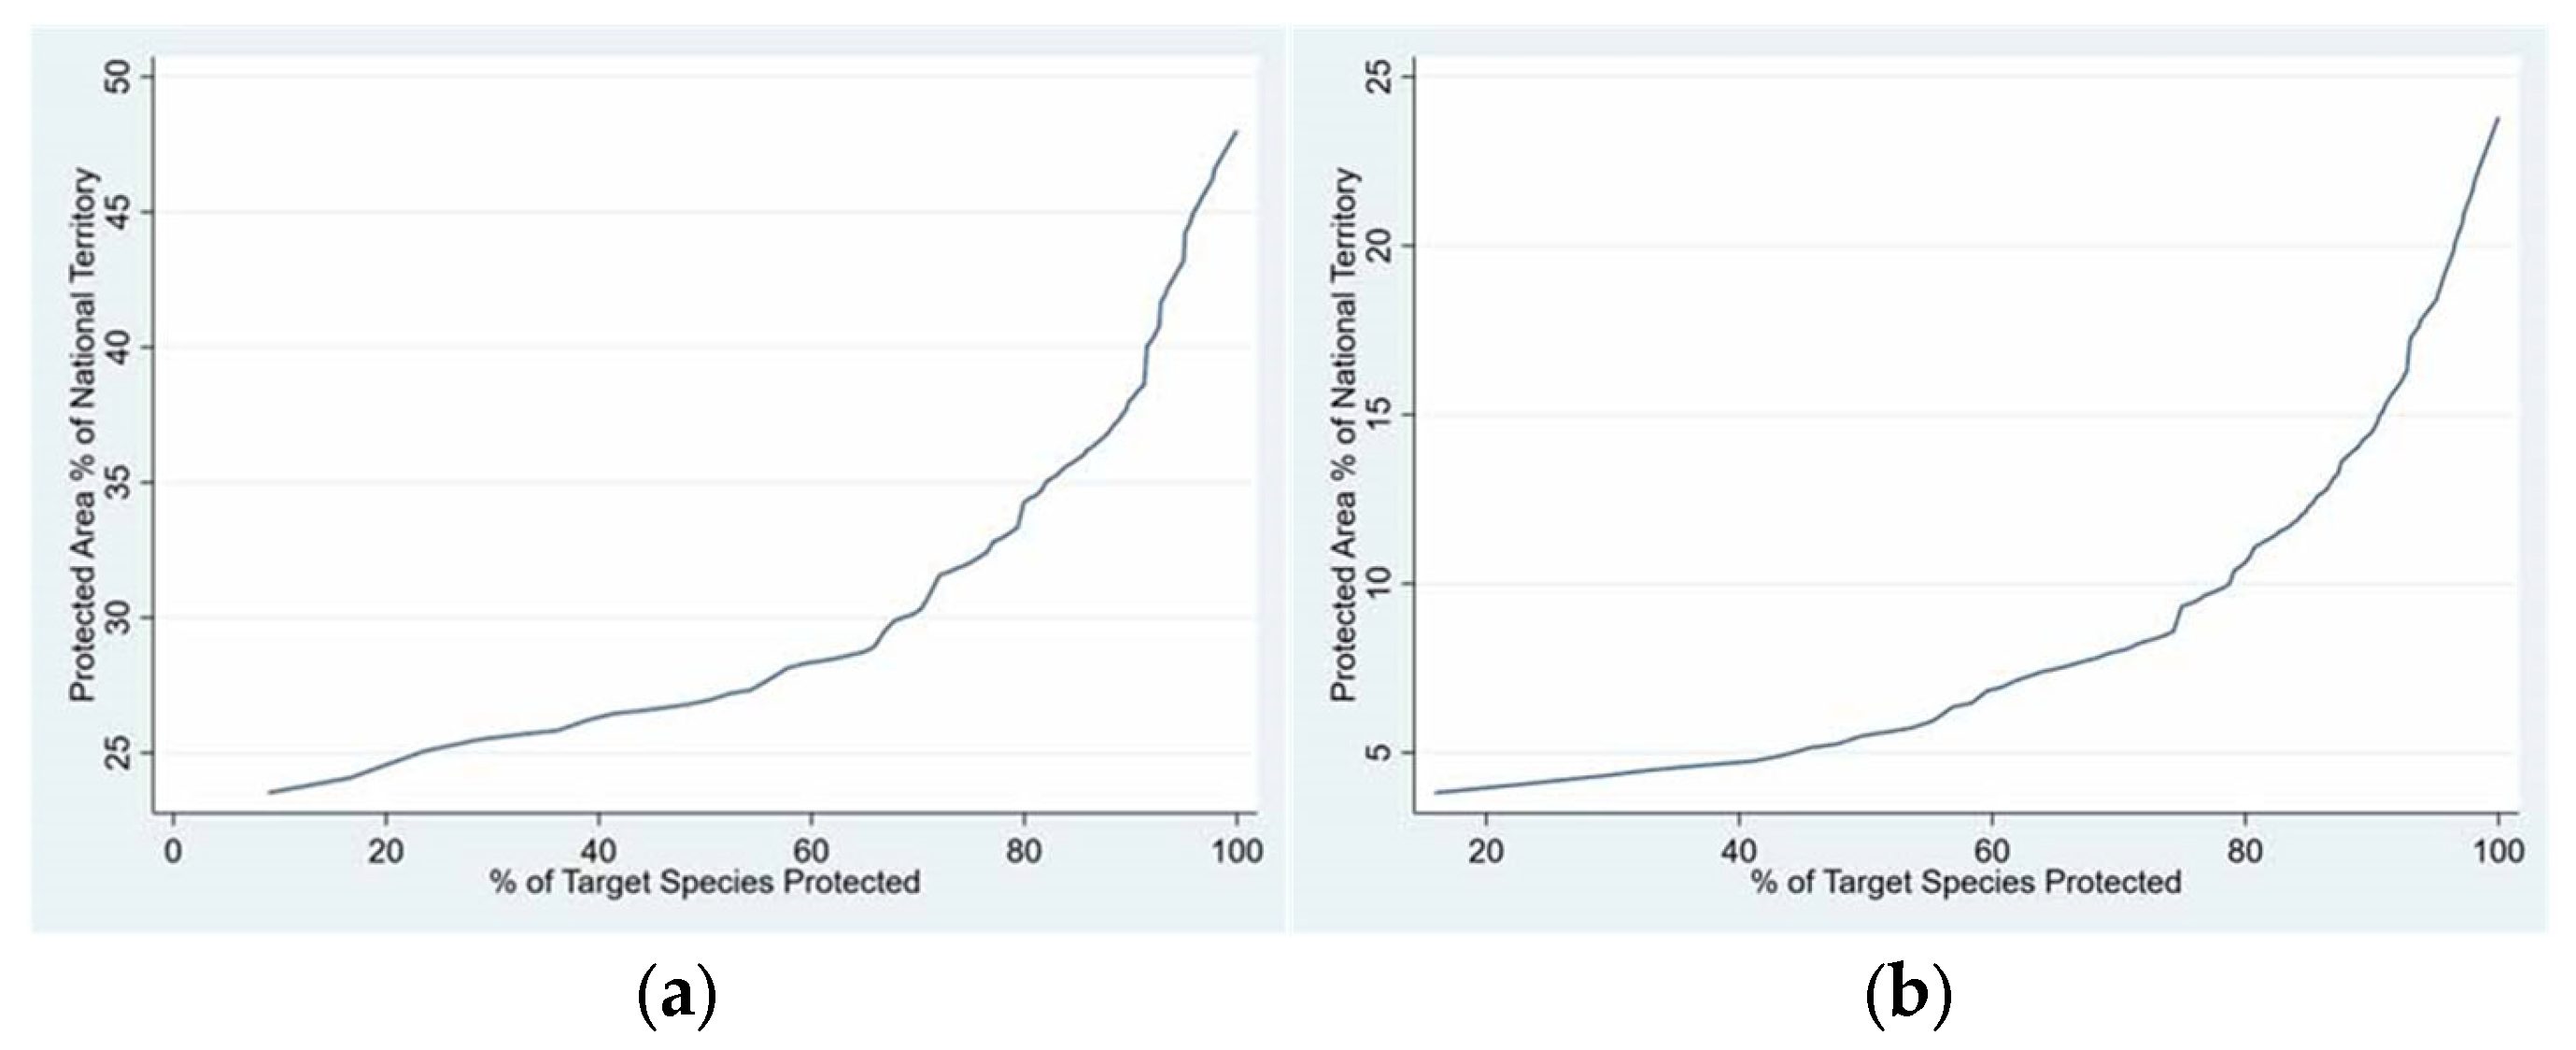
3.6. Ecuador and Papua New Guinea: Spatial Implications of Full Species Protection

Figure 8 and Figure 9 present the priority-area identification results on a map for Ecuador and Papua New Guinea in a graphical representation of the associated increase in total area required as protection decile increases. In Ecuador, two newly identified priority areas—located in Pichincha and Loja Provinces—provide protection for 20% of currently unprotected species. The second decile is covered by additional priority areas in the southern provinces of Azuay and Zamora Chinchipe. Coverage decreases for the third, fourth, and fifth deciles, after which a growing number of new areas are required to ensure full species protection. These new areas, distributed across nearly all provinces, are particularly concentrated along a north–south axis from Esmeraldas and Carchi in the north to Loja and Zamora Chinchipe in the south (Figure 8).
A similar pattern is observed in Papua New Guinea. During the initial five deciles, the number of identified priority areas increases steadily. However, as additional priority areas are added, the number of species covered per area gradually declines. Figure 9 shows that achieving full species protection necessitates the designation of new priority areas across all provinces, as reflected in the dense distribution of red dots in the bottom-right panel.
Figure 10 illustrates the territorial implications of achieving full species protection in both countries. In Ecuador (Figure 10a), the iterative expansion process begins with the 23% of national territory currently under protection. The horizontal axis measures the cumulative percentage of unprotected species added through new protected areas. Achieving 50% species coverage requires expanding protection by an additional 4% of national territory. To reach 80%, 95%, and 100% coverage, the required territorial expansion increases to 34%, 44%, and 48%, respectively, as indicated by the steepening curve.
In contrast, Papua New Guinea (Figure 10b) starts with only 4% of its territory under existing protection. Expanding coverage to include 50% of unprotected species requires an additional 6% of national territory. Reaching 80% coverage necessitates 11%, while achieving 95% and 100% protection requires 18% and 24% of the national territory, respectively.
These results suggest that replicating our method for all countries could yield valuable insights for the global 30 × 30 initiative. In some countries, such as Ecuador, achieving full protection for endemic species would require exceeding the 30% territorial target. In contrast, countries like Papua New Guinea would remain below this threshold. The feasibility of achieving full species protection depends on multiple factors, including the proportion of national territory already protected, existing safeguards for endemic species, and the geographic distribution of unprotected species across taxonomic groups.

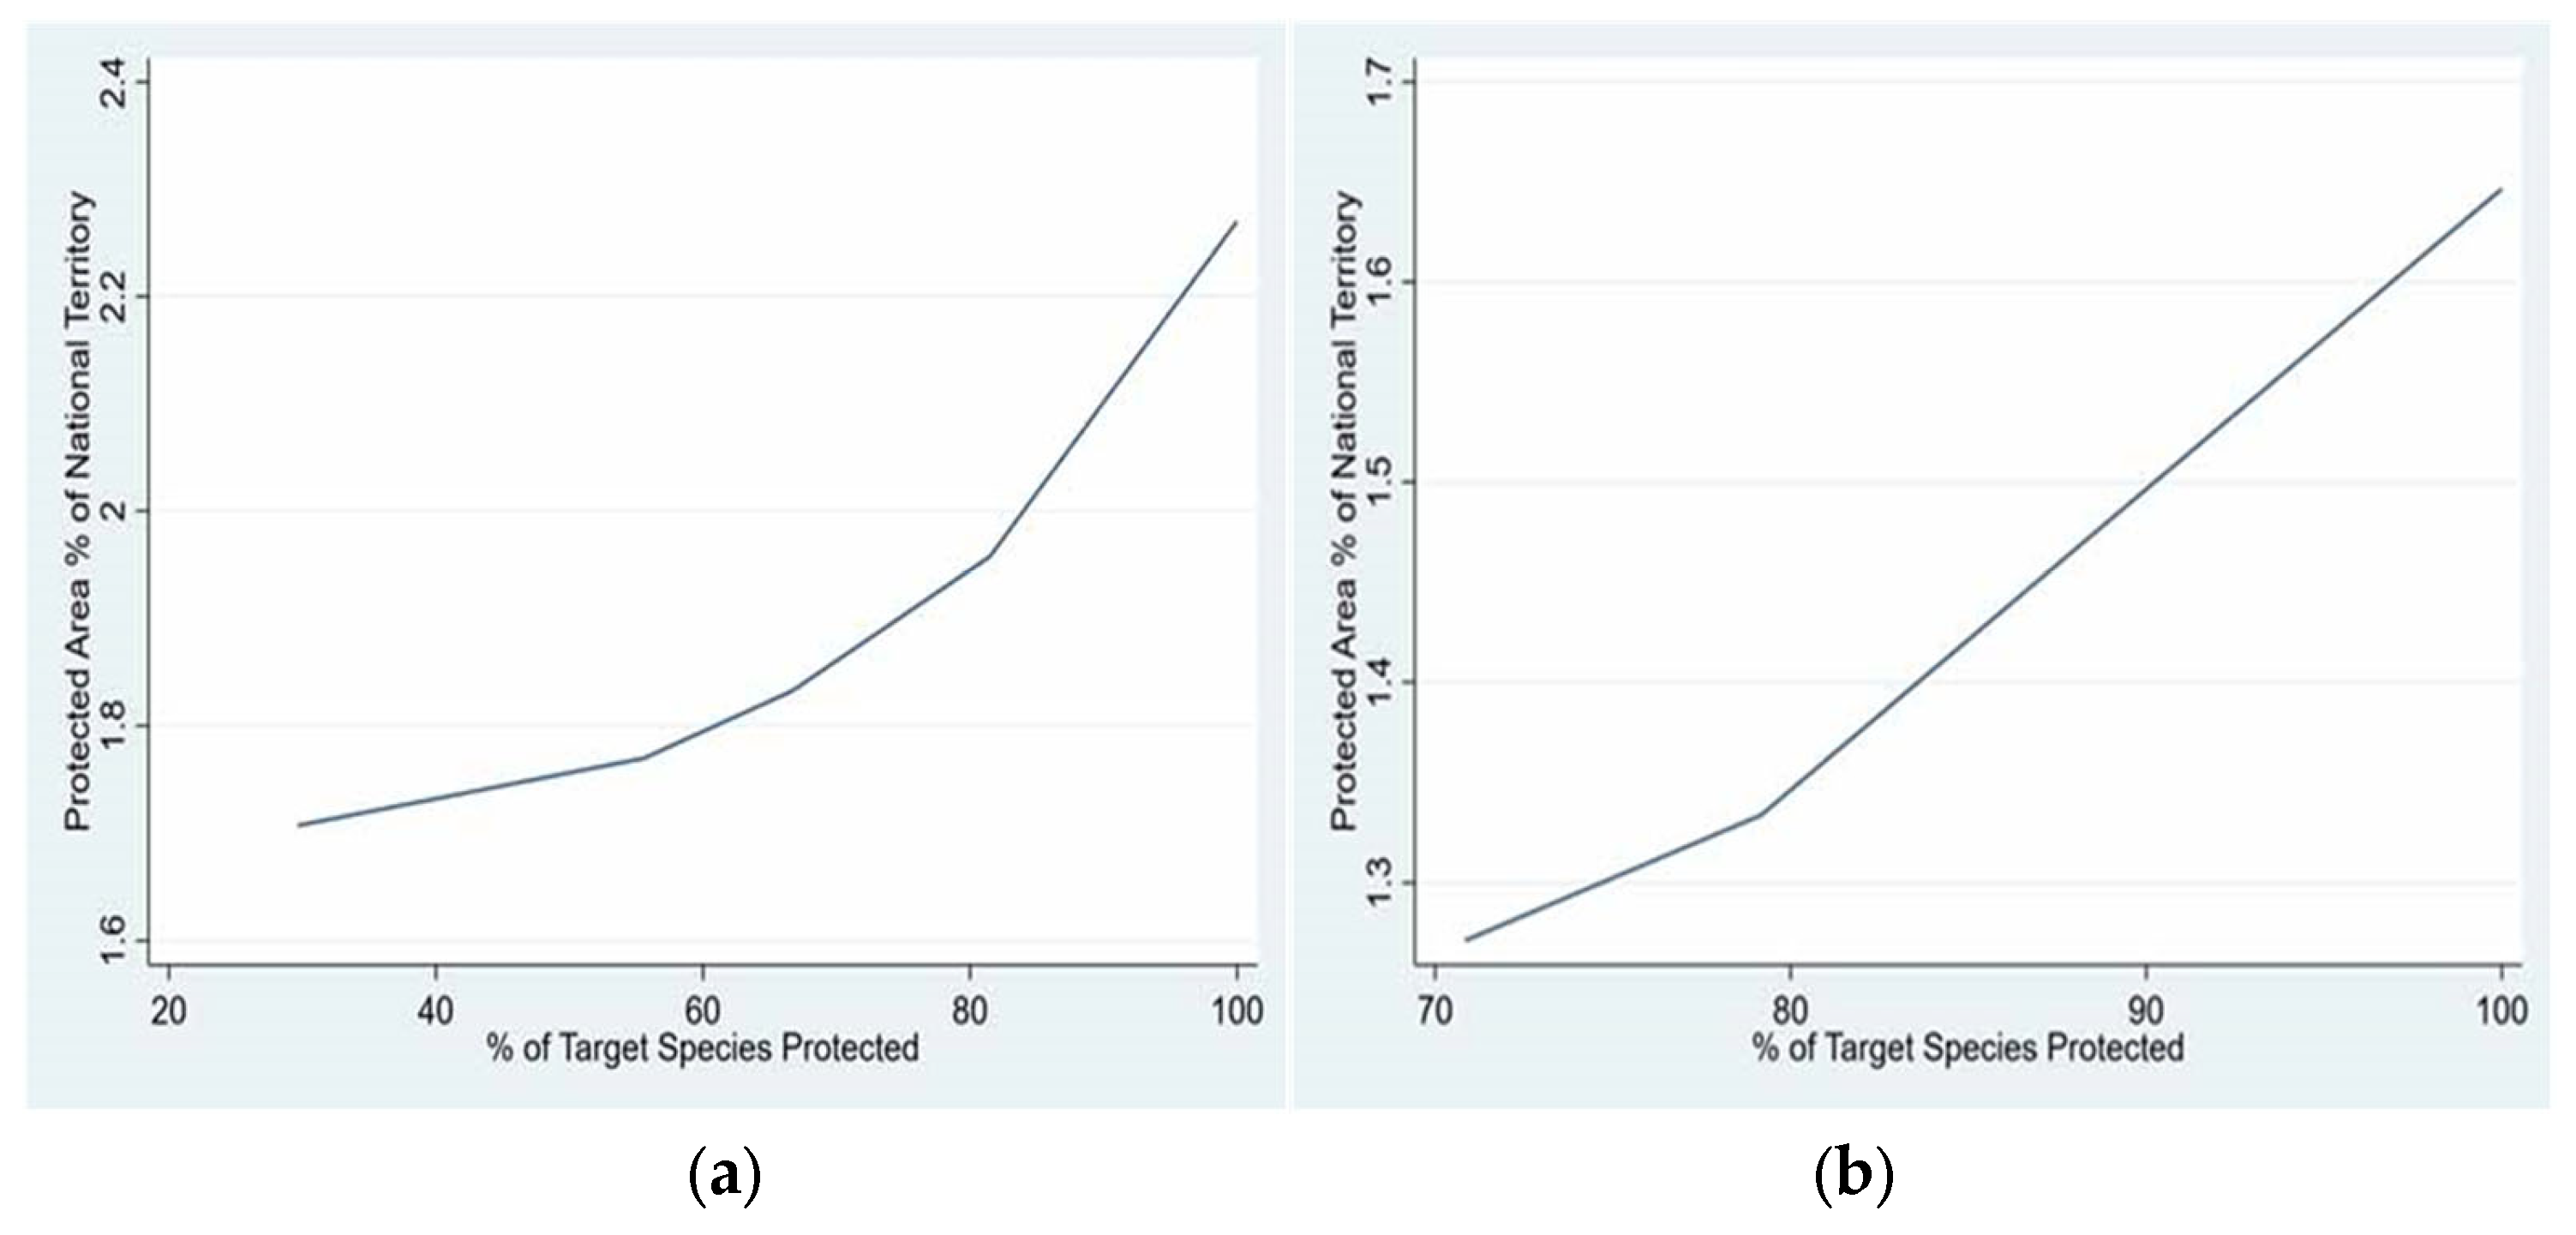
3.7. Philippines and Madagascar: Marine Species Protection

Figure 11 and Figure 12 present the priority areas identified for marine species protection in the Philippines and Madagascar, respectively. In the Philippines, the highest-priority candidate area is located off the northwestern coast, directly west of Batangas Province, and provides coverage for eight unprotected species. The second priority area, situated off the northern coast of Palawan Province, covers seven species. The third and fourth priority areas, covering three and two species, respectively, are located off the northeastern coast near Aurora Province and off the northern coast of Palawan’s main island (Figure 11).
In Madagascar, the primary priority area, which supports 17 unprotected species, lies off Androy, in the country’s southernmost region. The second priority area, covering two species, is located off the coast of neighboring region of Anosy. The third and fourth priority areas, each covering one species, are positioned along the eastern coast near the northern end of Vatovavy Fitovinany and off the coast of Sofia in the north (Figure 12).
Despite these additional protections, the required expansion of marine protected areas remains relatively modest for both countries (Figure 13). In the Philippines, achieving full protection for all unprotected species would increase the country’s protected marine area from 1.7% to 2.3% of its Exclusive Economic Zone (EEZ) (Figure 13a). For Madagascar, full coverage would require an expansion of approximately 1.65% of its EEZ (Figure 13b).

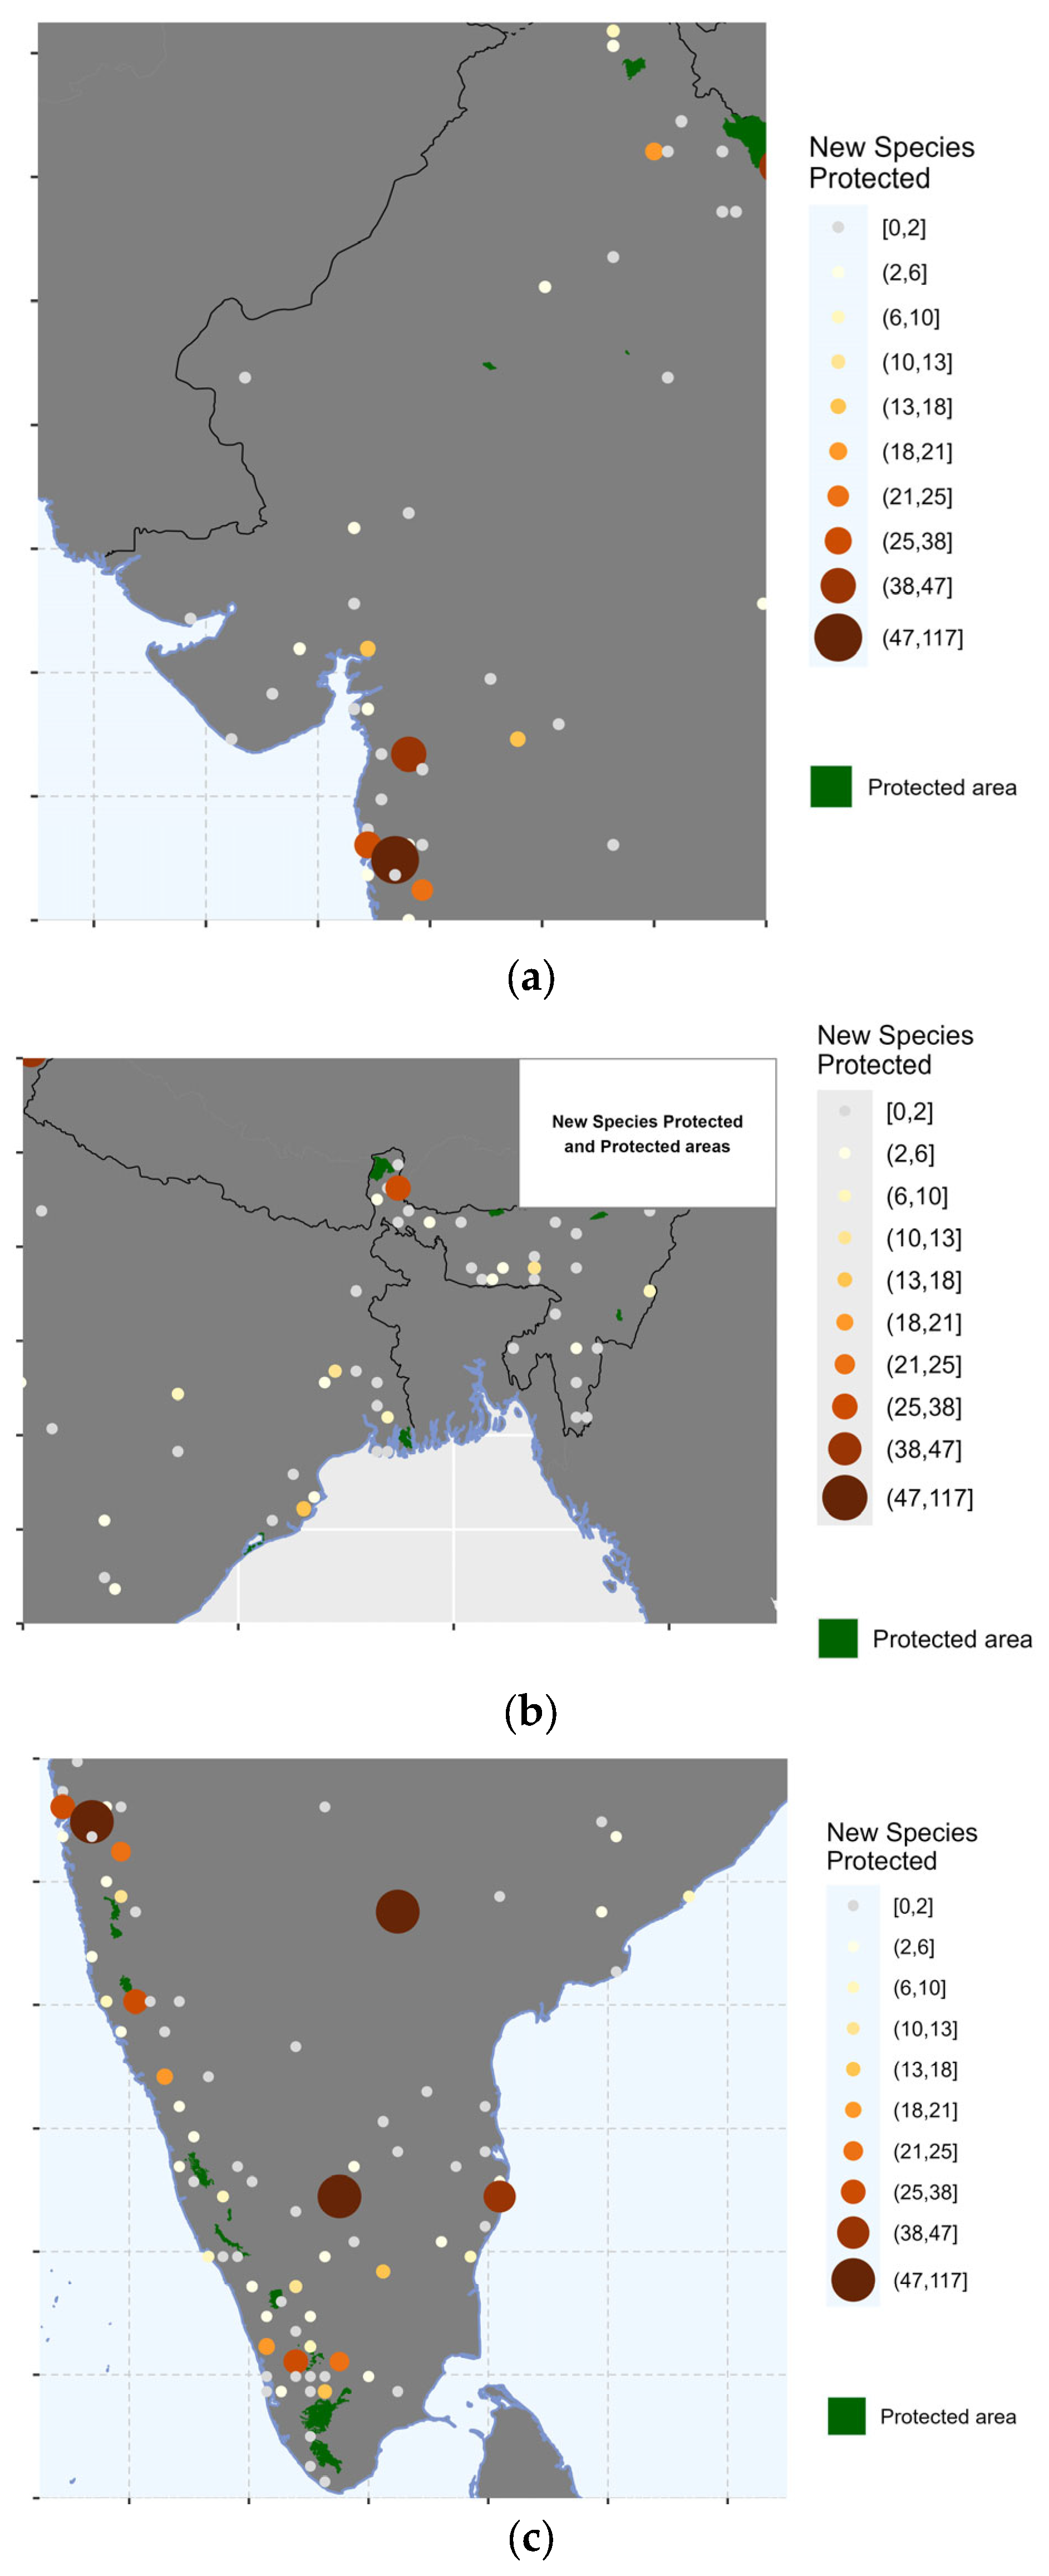
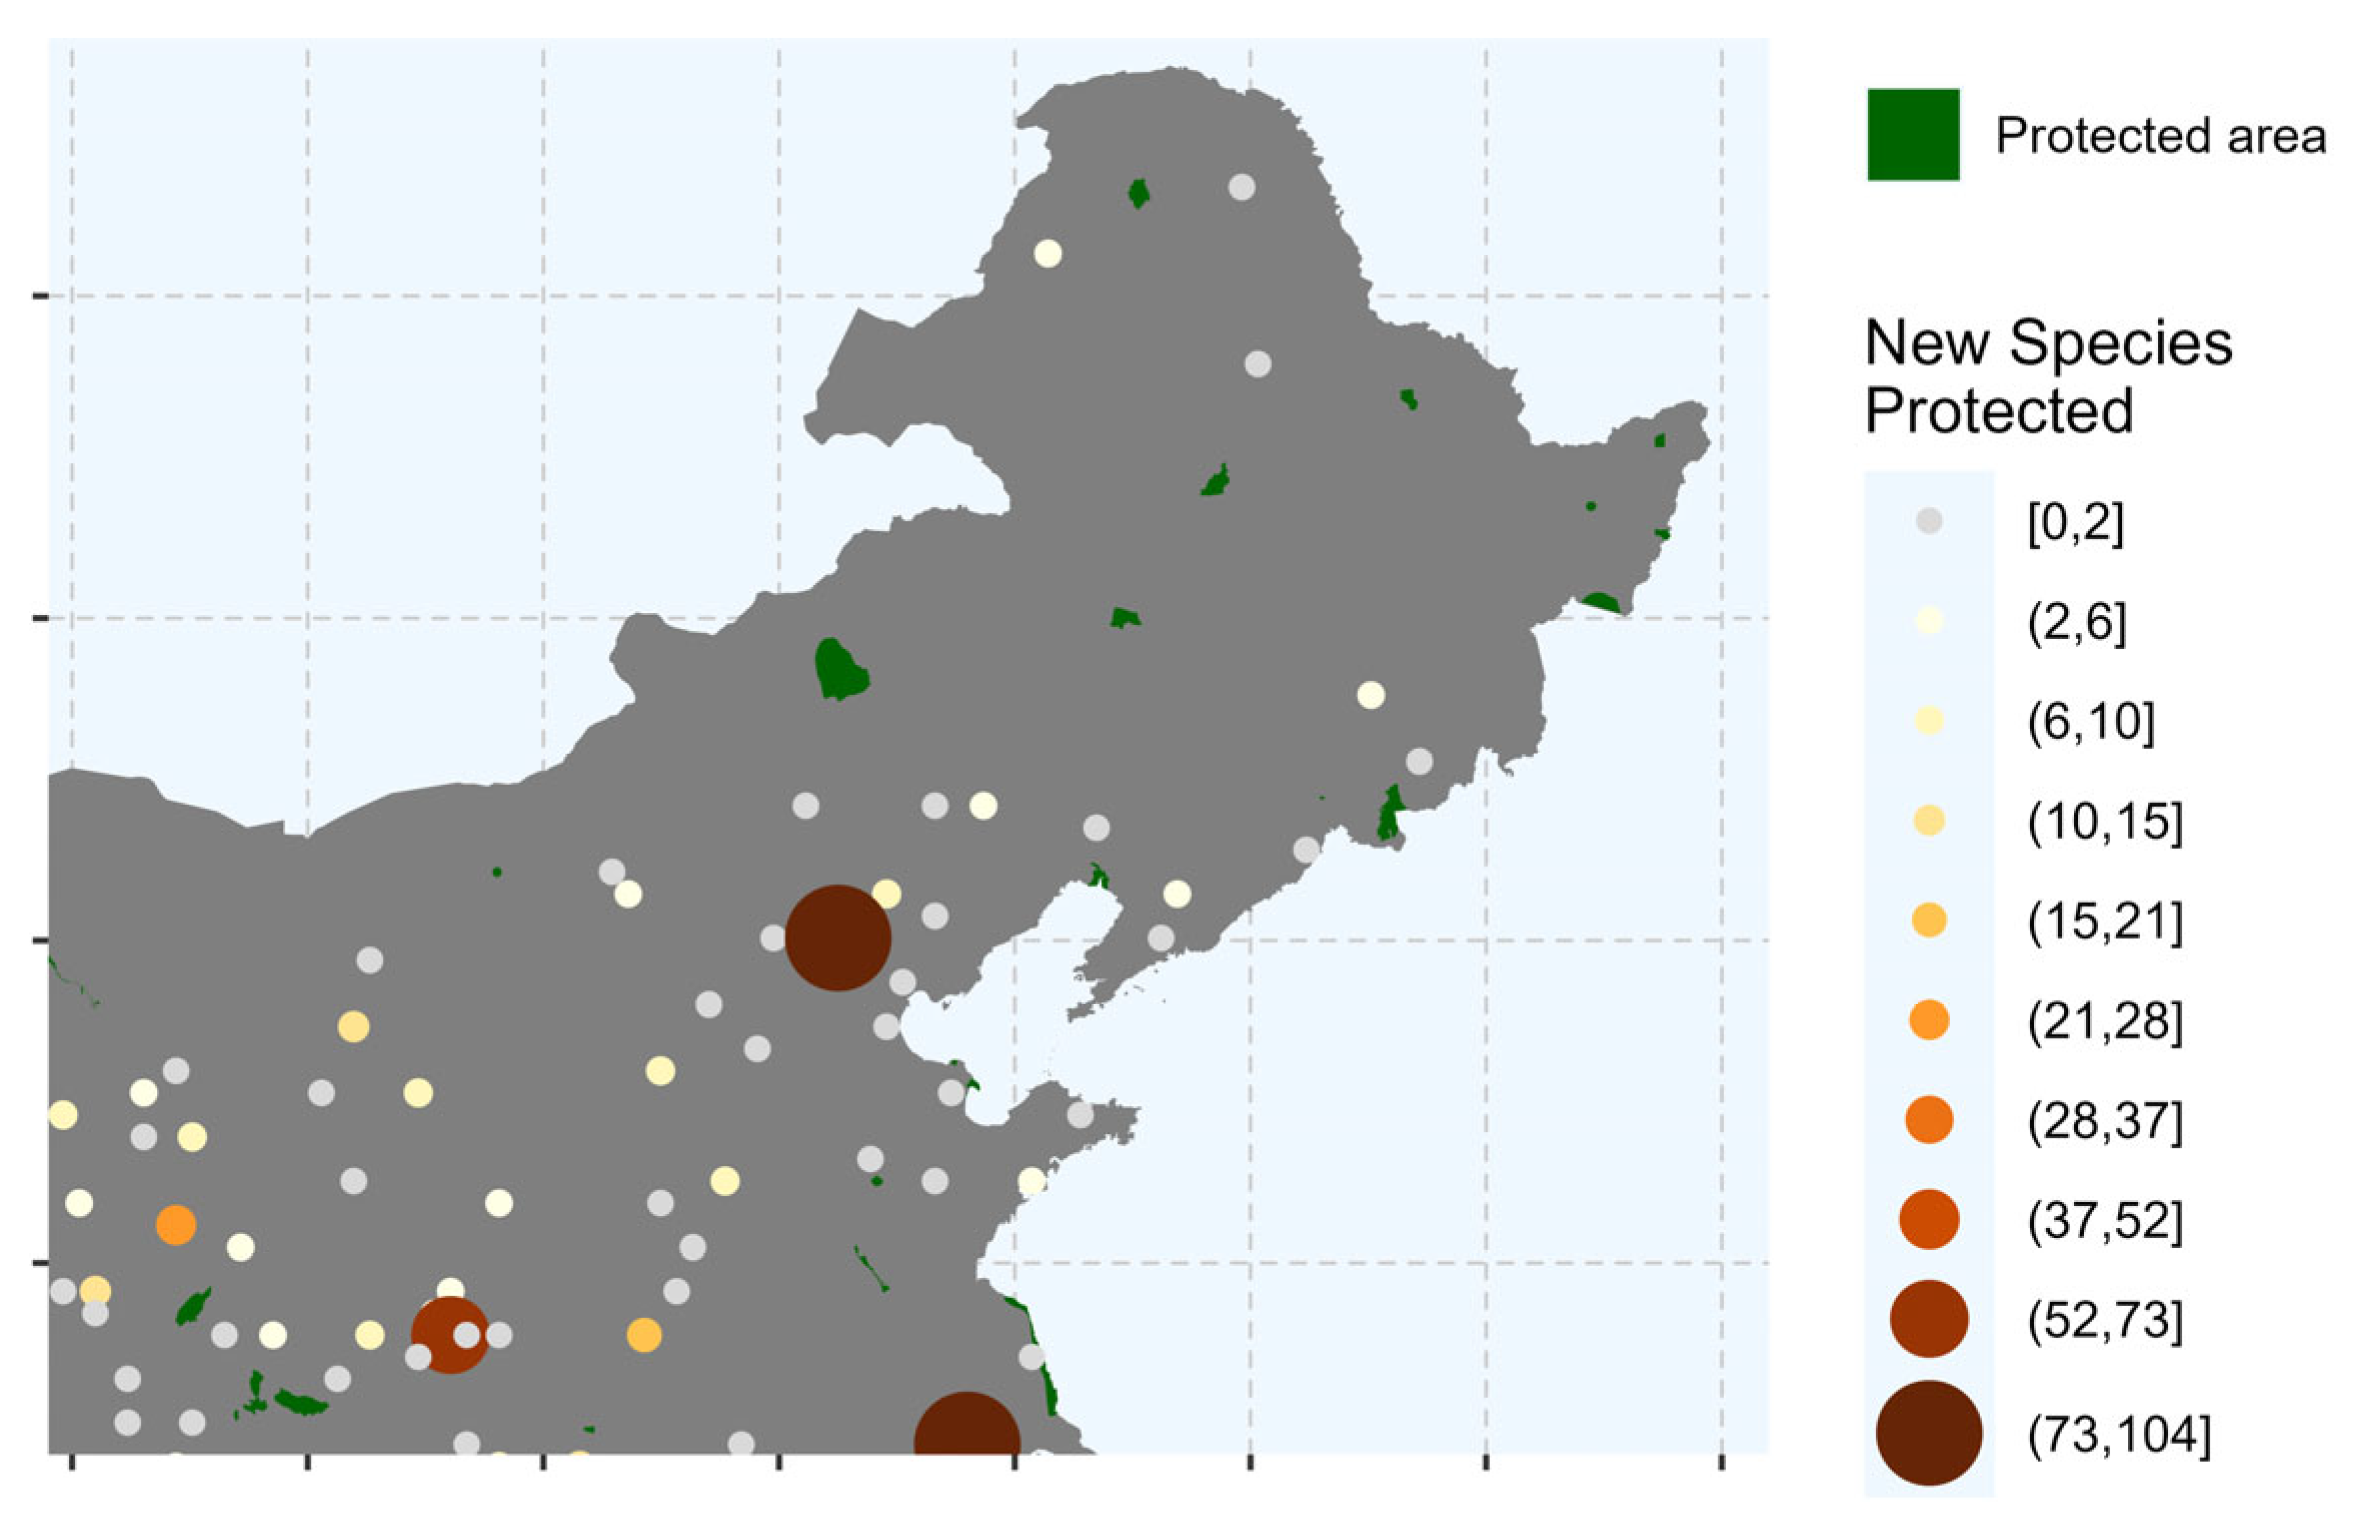
3.8. India and China: Limitations in Protected-Area Information

India and China are selected as case-study countries because they make very significant contributions to global biodiversity. Their engagement in the 30 × 30 initiative will be crucial to its success. By analyzing these countries, we aim to provide insights into their potential for protecting the diverse range of newly mapped species in our database.
India: India has 2635 endemic species in our database. However, comprehensive protected-area data are lacking in the WDPA, which lists only 17 publicly mapped protected areas, while noting that an additional 900 are restricted from public access [16]. As a result, our estimate of 1211 unprotected species in India is likely an overestimate.
To support policy efforts for biodiversity conservation, our analysis in India involved 175 iterations to identify potential areas for protecting the 1211 species not currently covered by publicly reported protected areas. The results from the first 40 iterations, which accounted for 958 species (79.1% of the total), reveal a highly skewed distribution. Notably, the first three identified areas encompass nearly 25% of unprotected species, while 11 areas collectively account for 50%. Within these newly identified priority areas, species representation varies significantly, ranging from 0 to 87.5% for plants, 0 to 82.9% for vertebrates, and 0 to 100% for arthropods and other species.
Figure 14 presents the complete species allocation results across all 175 iterations. The three largest priority areas (dark brown circles) are located in Maharashtra, Telangana, and Karnataka, collectively covering approximately 25% of all unprotected species. The next priority areas (brown circles) in Gujarat, Tamil Nadu, Uttarakhand, and the Andaman and Nicobar Islands account for an additional 14%. Further priority areas (lighter brown circles) in Kerala, southern and western Maharashtra, and Sikkim contribute another 12%, bringing the cumulative coverage to 50%. The remaining 50% of unprotected species are distributed across various regions, with notable concentrations in the northern mountain region and the Western Ghats (Supplementary Table S2a).
China: China has 10,367 endemic species in our database. However, the WDPA provides limited protected-area data, listing only 87 publicly mapped areas, while noting that an additional 2960 are not publicly accessible [17]. Consequently, our estimate of 2156 unprotected species in China is likely an overestimate.
To support biodiversity conservation efforts, our analysis in China involved 303 iterations to identify potential areas for protecting the 2156 species not currently covered by publicly reported protected areas. The results from the first 40 iterations, which account for 1330 species (61.7% of the total), indicate that species distribution in China is significantly less skewed than in India. Specifically, 7 areas cover 25% of the unprotected species, while 23 areas account for 50%. Species representation within these newly identified priority areas is highly diverse, ranging from 8.3% to 100% for plants, 0 to 25.4% for vertebrates, 0 to 81.2% for arthropods, and 0 to 83.3% for other species.
Figure 15 presents the complete species-allocation results across all 303 iterations. The three largest priority areas (dark brown circles) are located in Hainan, Jiangsu, and Beijing, collectively covering 14% of all unprotected species. The next priority areas (brown circles) in Yunnan, Sichuan, Shaanxi, and Fujian contribute another 15%, while additional priority areas (lighter brown circles) in Xizang, Sichuan, and Guangdong bring the cumulative coverage to 35%. The remaining 65% of unprotected species are distributed across the country, with particularly large concentrations in the southwestern region (Supplementary Table S2b).
By the 30 × 30 standard, the additional land needed to achieve full coverage of unprotected species in India and China is relatively modest (Figure 15). In India, publicly reported protected areas currently cover less than 1% of the national territory. Expanding protection by just 1.3% would ensure coverage for 50% of unprotected species, while reaching 80%, 95%, and 100% coverage would require territorial increases of 2.6%, 5.4%, and 7.7%, respectively (Figure 16a).
Similarly, in China, publicly reported protected areas cover 1.7% of the national territory. To achieve 50% coverage of unprotected species, an additional 2.3% of land would be needed. Expanding protection further to cover 80%, 95%, and 100% of unprotected species would require 3.9%, 6.7%, and 9.3% of national territory, respectively (Figure 16b).
These findings offer a data-driven perspective that may help to inform conservation planning in India and China, particularly within the framework of global initiatives such as 30 × 30.

4. Discussion

The global biodiversity crisis continues to accelerate, with nearly one million species at risk of extinction, as highlighted by the Global Assessment Report on Biodiversity and Ecosystem Services [19]. Protected areas are a cornerstone of biodiversity conservation, offering critical refuges for species, preserving habitats, facilitating migration, and maintaining ecological processes. While substantial efforts have expanded conservation areas in recent decades, their effectiveness in mitigating species loss depends largely on spatial placement [20,21]. Poorly positioned protected areas may fail to capture biodiversity hotspots or protect key species, reducing their conservation impact. Additionally, historical biases in conservation planning—such as an overemphasis on vertebrates—have likely contributed to suboptimal siting, misaligning protection efforts with broader biodiversity needs [22,23,24,25].
This study addresses these challenges by incorporating species-occurrence data from the Global Biodiversity Information Facility (GBIF) to assess the adequacy of existing protected areas for endemic-species conservation across ten countries. Endemic species, due to their restricted distributions, are particularly vulnerable to habitat loss and extinction, making them a priority for conservation planning [26,27,28,29,30]. The results highlight significant disparities in national conservation coverage. While some countries already protect substantial portions of their endemic species, others exhibit considerable gaps, with endemic species concentrated in unprotected regions. Taxonomic representation among unprotected species varies across countries, reflecting inconsistencies in current conservation efforts.
A spatial prioritization approach reveals that many countries can achieve comprehensive protection of endemic species within the 30% territorial target of the global 30 × 30 initiative. Moreover, for nations with highly clustered unprotected species, modest expansions in protected areas could yield substantial conservation gains. In contrast, others may need to exceed the 30% threshold to ensure sufficient biodiversity coverage. These findings emphasize the need for conservation strategies tailored to national and regional biodiversity patterns, rather than uniform global targets.
Across all scenarios, data-driven spatial planning emerges as a crucial tool for enhancing conservation outcomes. By leveraging species distribution data to inform the targeted expansion of protected areas, this approach strengthens the evidence base for national conservation strategies. The framework is also flexible to incorporate other indicators of interest, such as the coverage of ecoregion(s) (e.g., Terrestrial Ecoregions of the World [31]) and the pixel share of the total area of the species-occurrence region, which can provide policy makers with additional information to consider for the selection of protected areas. Ultimately, integrating species-occurrence data into conservation planning can improve biodiversity protection, ensuring that protected-area networks effectively contribute to global conservation goals.

5. Conclusions

The success of the 30 × 30 initiative depends on the strategic conservation efforts of all sovereign countries and territories to safeguard species at risk, with the effectiveness of protected areas reliant on strategic spatial placement. This study introduces a scalable methodology offering critical insights for conservation planning. A key contribution is the reassessment of international species protection, expanding the taxonomic scope to include plants, invertebrates, and non-vertebrate taxa alongside vertebrates, thus promoting a more inclusive conservation approach to ecosystem health. Although focused on endemic species, the adaptable framework accommodates alternative criteria, such as restricted ranges, high extinction risks, ecoregion representation, or IUCN Red List classifications, allowing for applications across diverse ecological and policy contexts. The methodology supports differential weighting across taxa, aligning conservation priorities with specific national and regional needs, and by iteratively identifying high-priority areas for new protections, it provides a robust data-driven tool for strengthening biodiversity conservation within the 30 × 30 framework.

Supplementary Materials

The following supporting information can be downloaded at https://www.mdpi.com/article/10.3390/d17060401/s1, Table S1a: Species groups in South Africa’s top three priority areas for new protection; Table S1b: Species groups in Costa Rica’s top three priority areas for new protection; Table S2a: Species distribution in the new priority areas identified for India; Table S2b: Species distribution in the new priority areas identified for China; Data S1: The pseudo-code presented highlights the main optimization algorithm and post-processing; Data S2: The R script presented highlights the main optimization algorithm and post-processing.

Author Contributions

Conceptualization, D.W. and S.D.; methodology, D.W.; software, B.B.; validation, D.W., S.D., and B.B.; formal analysis, D.W.; investigation, S.D.; resources, S.D. and B.B.; data curation, B.B.; writing—original draft preparation, D.W.; writing—review and editing, S.D. and B.B.; visualization, B.B.; supervision, S.D.; project administration, S.D.; funding acquisition, S.D. and B.B. All authors have read and agreed to the published version of the manuscript.

Funding

This research was funded by the Global Environment Facility (P179309) and Global Data Facility (P508169). The findings, interpretations, and conclusions expressed in this paper are entirely those of the authors. They do not necessarily represent the views of the International Bank for Reconstruction and Development/World Bank and its affiliated organizations, or those of the Executive Directors of the World Bank or the governments they represent.

Institutional Review Board Statement

Not applicable.

Informed Consent Statement

Not applicable.

Data Availability Statement

The data presented in this study will be available from the Development Data Hub at https://datacatalog.worldbank.org/, subject to license agreements. The user must download data from the World Database of Protected Areas at https://www.protectedplanet.net/.

Acknowledgments

We extend our gratitude to Pritthijit (Raja) Kundu for his valuable assistance with the graphics and to Norma Adams for editorial support.

Conflicts of Interest

The authors declare no conflicts of interest.

World Bank Disclaimer

The findings, interpretations, and conclusions expressed in this article are entirely those of the author(s). They do not necessarily reflect the views of The World Bank, its Board of Executive Directors, or the governments they represent.

Abbreviations

The following abbreviations are used in this manuscript:
DDdecimal degrees
EEZExclusive Economic Zone
GBIFGlobal Biodiversity Information Facility
WDPAWorld Database of Protected Areas

References

  1. Pimm, S.L.; Jenkins, C.N.; Abell, R.; Brooks, T.M.; Gittleman, J.L.; Joppa, L.N.; Raven, P.H.; Roberts, C.M.; Sexton, J.O. The biodiversity of species and their rates of extinction, distribution, and protection. Science 2014, 344, 1246752. [Google Scholar] [CrossRef] [PubMed]
  2. Chen, H.; Zhang, T.; Costanza, R.; Kubiszewski, I. Review of the approaches for assessing protected areas’ effectiveness. Environ. Impact Assess. Rev. 2023, 98, 106929. [Google Scholar] [CrossRef]
  3. Pulido-Chadid, K.; Virtanen, E.; Geldmann, J. How effective are protected areas for reducing threats to biodiversity? A systematic review protocol. Environ. Evid. 2023, 12, 18. [Google Scholar] [CrossRef] [PubMed]
  4. Llorente-Culebras, S.; Ladle, R.J.; Santos, A.M. Publication trends in global biodiversity research on protected areas. Biol. Conserv. 2023, 281, 109988. [Google Scholar] [CrossRef]
  5. Rodríguez-Rodríguez, D.; Martínez-Vega, J. Effectiveness of Protected Areas in Conserving Biodiversity: A Worldwide Review; Springer: Cham, Switzerland, 2022. [Google Scholar] [CrossRef]
  6. Ma, B.; Zhang, Y.; Hou, Y.; Wen, Y. Do protected areas matter? A systematic review of the social and ecological impacts of the establishment of protected areas. Int. J. Environ. Res. Public Health 2020, 17, 7259. [Google Scholar] [CrossRef]
  7. Geldmann, J.; Barnes, M.; Coad, L.; Craigie, I.D.; Hockings, M.; Burgess, N.D. Effectiveness of terrestrial protected areas in reducing habitat loss and population declines. Biol. Conserv. 2013, 161, 230–238. [Google Scholar] [CrossRef]
  8. Mora, C.; Sale, P.F. Ongoing global biodiversity loss and the need to move beyond protected areas: A review of the technical and practical shortcomings of protected areas on land and sea. Mar. Ecol. Prog. Ser. 2011, 434, 251–266. [Google Scholar] [CrossRef]
  9. Nelson, A.; Chomitz, K.M. Effectiveness of strict vs. multiple use protected areas in reducing tropical forest fires: A global analysis using matching methods. PLoS ONE 2011, 6, e22722. [Google Scholar] [CrossRef]
  10. Joppa, L.; Pfaff, A. Reassessing the forest impacts of protection: The challenge of nonrandom location and a corrective method. Ann. N. Y. Acad. Sci. 2010, 1185, 135–149. [Google Scholar] [CrossRef]
  11. Bruner, A.G.; Gullison, R.E.; Rice, R.E.; Da Fonseca, G.A. Effectiveness of parks in protecting tropical biodiversity. Science 2001, 291, 125–128. [Google Scholar] [CrossRef]
  12. Dasgupta, S.; Blankespoor, B.; Wheeler, D. Revisiting Global Biodiversity: A Spatial Analysis of Species Occurrence Data from the Global Biodiversity Information Facility; World Bank Group: Washington, DC, USA, 2024; Policy Research Working Paper No. 10821; Available online: http://hdl.handle.net/10986/41788 (accessed on 5 November 2024).
  13. Protected Planet. 2024. Available online: https://www.protectedplanet.net/en/thematic-areas/wdpa?tab=WDPA (accessed on 3 July 2024).
  14. World Bank. National level dataset of Species Endemism, Small Occurrence and Species at Risk Data. Available online: https://datacatalog.worldbank.org/search/dataset/0066034/global_biodiversity_data: (accessed on 10 December 2024).
  15. Flanders Marine Institute. Maritime Boundaries Geodatabase: Maritime Boundaries and Exclusive Economic Zones (200NM); Version 12; Flanders Marine Institute: Oostende, Belgium, 2023. [Google Scholar] [CrossRef]
  16. Protected Planet. 2024. Available online: https://www.protectedplanet.net/country/IND (accessed on 3 July 2024).
  17. Protected Planet. 2024. Available online: https://www.protectedplanet.net/country/CHN (accessed on 3 July 2024).
  18. World Bank. Country Boundaries. 2024. Available online: https://datacatalog.worldbank.org/search/dataset/0038272/World-Bank-Official-Boundaries (accessed on 3 July 2024).
  19. Intergovernmental Science-Policy Platform on Biodiversity and Ecosystem Services (IPBES). Global Assessment Report on Biodiversity and Ecosystem Services. Available online: https://www.ipbes.net/global-assessment (accessed on 5 October 2024).
  20. Hoffmann, S. Challenges and opportunities of area-based conservation in reaching biodiversity and sustainability goals. Biodivers. Conserv. 2022, 31, 325–352. [Google Scholar] [CrossRef]
  21. Maxwell, S.L.; Cazalis, V.; Dudley, N.; Hoffmann, M.; Rodrigues, A.S.; Stolton, S.; Visconti, P.; Woodley, S.; Kingston, N.; Lewis, E.; et al. Area-based conservation in the twenty-first century. Nature 2020, 586, 217–227. [Google Scholar] [CrossRef] [PubMed]
  22. Delso, Á.; Fajardo, J.; Muñoz, J. Protected area networks do not represent unseen biodiversity. Sci. Rep. 2021, 11, 12275. [Google Scholar] [CrossRef]
  23. Venter, O.; Magrach, A.; Outram, N.; Klein, C.J.; Possingham, H.P.; Di Marco, M.; Watson, J.E. Bias in protected-area location and its effects on long-term aspirations of biodiversity conventions. Conserv. Biol. 2018, 32, 127–134. [Google Scholar] [CrossRef]
  24. Zeng, Y.; Senior, R.A.; Crawford, C.L.; Wilcove, D.S. Gaps and weaknesses in the global protected area network for safeguarding at-risk species. Sci. Adv. 2023, 9, eadg0288. [Google Scholar] [CrossRef]
  25. Pyšek, P.; Richardson, D.M.; Pergl, J.; Jarošík, V.; Sixtová, Z.; Weber, E. Geographical and taxonomic biases in invasion ecology. Trends Ecol. Evol. 2008, 23, 237–244. [Google Scholar] [CrossRef]
  26. Kraus, D.; Enns, A.; Hebb, A.; Murphy, S.; Drake, D.A.R.; Bennett, B. Prioritizing nationally endemic species for conservation. Conserv. Sci. Pract. 2023, 5, e12845. [Google Scholar] [CrossRef]
  27. Coelho, N.; Gonçalves, S.; Romano, A. Endemic plant species conservation: Biotechnological approaches. Plants 2020, 9, 345. [Google Scholar] [CrossRef]
  28. Stuessy, T.F.; Baeza, C.M.; López-Sepúlveda, P.; Rodríguez, R.; Swenson, U.; Crawford, D.J.; Ruiz, E.A. Conservation of native and endemic species. In Plants of Oceanic Islands: Evolution, Biogeography, and Conservation of the Flora of the Juan Fernández (Robinson Crusoe) Archipelago; Cambridge University Press: Cambridge, UK, 2018; pp. 149–161. [Google Scholar]
  29. Burlakova, L.E.; Karatayev, A.Y.; Karatayev, V.A.; May, M.E.; Bennett, D.L.; Cook, M.J. Endemic species: Contribution to community uniqueness, effect of habitat alteration, and conservation priorities. Biol. Conserv. 2011, 144, 155–165. [Google Scholar] [CrossRef]
  30. Işik, K. Rare and endemic species: Why are they prone to extinction? Turk. J. Bot. 2011, 35, 411–417. [Google Scholar] [CrossRef]
  31. Olson, D.M.; Dinerstein, E.; Wikramanayake, E.D.; Burgess, N.D.; Powell, G.V.N.; Underwood, E.C.; D’amico, J.A.; Itoua, I.; Strand, H.E.; Morrison, J.C.; et al. Terrestrial Ecoregions of the World: A New Map of Life on Earth: A new global map of terrestrial ecoregions provides an innovative tool for conserving biodiversity. BioScience 2001, 51, 933–938. [Google Scholar] [CrossRef]
Figure 1. Flowchart of the methodology, where references include Dasgupta et al., 2024 [12] and WDPA (2024) [13].
Diversity 17 00401 g001
Figure 2. Country area versus mean protected-area size (sq km) for 212 countries and political units with the blue line representing the regression line. Average protected-area size is computed from the World Database of Protected Areas (WDPA) (2024) [13] and country area from the World Bank’s country shapefile [18].
Diversity 17 00401 g002
Figure 3. Brazil’s top four priority areas identified for new protection. Cell counts are color-coded from lowest (light yellow) to highest (red and dark brown).
Diversity 17 00401 g003
Figure 4. Cameroon’s top four priority areas identified for new protection. Cell counts are color-coded from lowest (light yellow) to highest (red and dark brown).
Diversity 17 00401 g004
Figure 5. Full protection areas for Priority 1 groups: (a) Espirito Santo, Brazil; and (b) Centre Region, Cameroon.
Diversity 17 00401 g005
Figure 6. Top three priority areas identified for new protection in South Africa. Cell counts are color-coded from lowest (light yellow) to highest (red and dark brown).
Diversity 17 00401 g006
Figure 7. Top three priority areas identified for new protection in Costa Rica. Cell counts are color-coded from lowest (light yellow) to highest (red and dark brown).
Diversity 17 00401 g007
Figure 8. Incremental protected areas in Ecuador (represented with red dots) by new species coverage (nth decile) and existing protected areas (represented in green).
Diversity 17 00401 g008
Figure 9. Incremental protected areas in Papua New Guinea (represented with red dots) by new species coverage (nth decile) and existing protected areas (represented in green).
Diversity 17 00401 g009
Figure 10. Species protection versus land in protected areas: (a) Ecuador and (b) Papua New Guinea.
Diversity 17 00401 g010
Figure 11. Top four marine priority areas in the Philippines’ Exclusive Economic Zone (EEZ). Cell counts are color-coded from lowest (light yellow) to highest (red and dark brown). Purple circle identifies the pixel with the maximum count.
Diversity 17 00401 g011
Figure 12. Top four marine priority areas in Madagascar’s EEZ. Cell counts are color-coded from lowest (light yellow) to highest (red and dark brown). Purple circle identifies the pixel with the maximum count.
Diversity 17 00401 g012
Figure 13. Marine species protection versus territory in the EEZ: (a) the Philippines and (b) Madagascar.
Diversity 17 00401 g013
Figure 14. New protected areas for complete species coverage in India: (a) northern, (b) eastern, and (c) southern regions. Grid cells surround the centroids of circles, which are sized and color-coded by the number of new species protected.
Diversity 17 00401 g014
Figure 15. New protected areas for complete species coverage in China. Grid cells surround the centroids of circles, which are sized and color-coded by the number of new species protected.
Diversity 17 00401 g015aDiversity 17 00401 g015b
Figure 16. Species protection versus land in protected areas: (a) India and (b) China.
Diversity 17 00401 g016
Table 1. Country counts for terrestrial, freshwater, and marine endemic species by species group.
CountryArthropodsFishFungiOther KingdomsMolluscaTerr. VertebratesVascular Plants
Brazil3675125341812374092813,713
Cameroon1924570860320
China3798233223982933205098
Costa Rica428828163418974981
Ecuador7129542111383022127
India970986012389417913
Madagascar144837927716685869
Papua New Guinea6176310212512512121
Philippines43812002649579447
South Africa2398200118727121949137
Table 2. Regression results. The t-statistic is the estimated regression coefficient divided by its standard error; classical significance with 95% confidence generally requires a t-statistic above 2.0.
VariableLog Mean Protected-Area Size (sq km)
Log country area (sq km)0.614 *** 1
(0.0397) 2
Constant−2.587 *** 1
(0.442) 2
Observations212
R-squared0.533
1 *** indicates p < 0.01. 2 Standard error shown in parentheses.
Table 3. Top 10 priority areas identified for South Africa, showing total species protected and distribution across taxonomic groups.
Priority Area (No.)Species
Total (%)
Plants
Total (%)
Vertebrates
Total (%)
Arthropods
Total (%)
Other Species
Total (%)
162 (5.2%)7 (11.3%)6 (9.7%)39 (62.9%)10 (16.1%)
255 (4.6%)38 (69.1%)0 (0.0%)17 (30.9%)0 (0.0%)
347 (3.9%)1 (2.1%)0 (0.0%)46 (97.9%)0 (0.0%)
440 (3.4%)38 (95.0%)0 (0.0%)2 (5.0%)0 (0.0%)
539 (3.3%)20 (51.3%)2 (5.1%)0 (0.0%)17 (43.6%)
631 (2.6%)30 (96.8%)0 (0.0%)1 (3.2%)0 (0.0%)
730 (2.5%)27 (90.0%)1 (3.3%)1 (3.3%)1 (3.3%)
827 (2.3%)18 (66.7%)5 (18.5%)4 (14.8%)0 (0.0%)
926 (2.2%)24 (92.3%)1 (3.8%)1 (3.8%)0 (0.0%)
1025 (2.1%)3 (12.0%)1 (4.0%)19 (76.0%)2 (8.0%)
Table 4. Top 10 priority areas identified for Costa Rica, showing total species protected and distribution across taxonomic groups.
Priority Area (No.)Species
Total (%)
Plants
Total (%)
Vertebrates
Total (%)
Arthropods
Total (%)
Other Species
Total (%)
173 (58.4%)0 (0.0%)0 (0.0%)73 (100.0%)0 (0.0%)
28 (6.4%)0 (0.0%)0 (0.0%)8 (100.0%)0 (0.0%)
35 (4.0%)0 (0.0%)0 (0.0%)0 (0.0%)5 (100.0%)
44 (3.2%)0 (0.0%)0 (0.0%)4 (100.0%)0 (0.0%)
53 (2.4%)2 (66.7%)0 (0.0%)0 (0.0%)1 (33.3%)
63 (2.4%)0 (0.0%)1 (33.3%)1 (33.3%)1 (33.3%)
73 (2.4%)0 (0.0%)0 (0.0%)3 (100.0%)0 (0.0%)
82 (1.6%)1 (50.0%)0 (0.0%)0 (0.0%)1 (50.0%)
92 (1.6%)0 (0.0%)0 (0.0%)0 (0.0%)2 (100.0%)
102 (1.6%)0 (0.0%)0 (0.0%)2 (100.0%)0 (0.0%)
Disclaimer/Publisher’s Note: The statements, opinions and data contained in all publications are solely those of the individual author(s) and contributor(s) and not of MDPI and/or the editor(s). MDPI and/or the editor(s) disclaim responsibility for any injury to people or property resulting from any ideas, methods, instructions or products referred to in the content.

