Abstract
Charipinae taxonomy has been always very problematic because of the large number of described species and unclear interspecific limits. Following the morphological characterisation, molecular information is now used to determine the boundaries between species. In this context, we compared two cosmopolitan species: Alloxysta victrix (Westwood, 1833) and Alloxysta consobrina (Zetterstedt, 1838). Material from Alloxysta tscheki (Giraud, 1860) and Alloxysta leunisii (Hartig, 1841) was also included. An integrative phylogenetic study was performed using three molecular markers (COI, ITS2, and 16S) and a morphological matrix. Inter- and intraspecific genetic distances were calculated and compared with previous data. The results showed no differences between interspecific and intraspecific distances for the four studied species and no clear phylogenetic structure, in contrast to other well-resolved Charipinae species included in our analyses. In light of these findings, three new junior synonyms are established under A. victrix (Westwood, 1833): A. consobrina (Zetterstedt, 1838) n. syn., A. tscheki (Giraud, 1860) n. syn., and A. leunisii (Hartig, 1841) n. syn.
1. Introduction
Hymenoptera parasitoids are among the most important groups of insects used for biological pest control [1,2,3,4,5]. Parasitoids remain one of the least studied groups of insects with significant biocontrol potential, and many new species await discovery [6,7]. To address these challenges, molecular methods for species identification have been proposed as a standardised tool for taking an inventory of global biodiversity under initiatives like ‘The Barcode of Life’ [8]. This approach involves complementing traditional taxonomic methods with DNA barcoding, enabling nonspecialists to identify species via a COI gene sequence. This sequence evolves rapidly enough to enable discrimination between closely related species as well as investigation of intraspecific diversity [9]. Combining COI with other molecular markers, such as ITS2 and 16S, improves the accuracy of species-identification and phylogenetic studies, especially when combined with morphological or ecological data [10,11]. These molecular techniques have previously been applied to clarify phylogenetic relationships among parasitic Hymenoptera [12].
Members of the subfamily Charipinae (Cynipoidea: Figitidae) are secondary parasitoids of aphids via Aphidiinae (Braconidae) and Aphelinidae (Chalcidoidea), and secondary parasitoids of psyllids via Encyrtidae (Chalcidoidea) [13]. The abundance of the primary parasitoids can be modified by the presence of Charipinae in the field. This causes aphid populations to increase, leading to severe losses in yields of important crops. For this reason, Charipinae studies are very important in aphid biological control programs, and they are usually a problem for those who are working with them. Several studies have been performed related to DNA Barcode and species boundaries [14,15]. In relation to Charipinae, some previous studies have focused on trying to establish correct species limits [16] and hypotheses about possible intraspecific variations [17].
Two very similar and cosmopolitan species are present within Alloxysta. The two species under consideration are Alloxysta victrix (Westwood, 1833) and Alloxysta consobrina (Zetterstedt, 1838) (=fuscicornis (Hartig, 1841)). It is evident that these species exhibit numerous diagnostic characteristics in common, including the presence of closed radial cells and pronotal carinae, and an absence of propodeal carinae (Figure 1). Fergusson [18] synonymized A. fuscicornis under A. victrix, yet provided no explanation for this decision. As demonstrated by Evenhuis (in Menke and Evenhuis [13]), significant disparities were identified when Alloxysta specimens were reared from mummies of Macrosiphum rosae and related species, as well as Brevicoryne brassicae. The species differ in three principal ways: the size of the radial cell, the length of the flagellomeres, and the colour of the head. For these reasons, these authors resurrected A. fuscicornis from synonymy with A. victrix but mentioned that the status of these two species needs further careful study. In a recent study, van Veen et al. [19] performed a comprehensive analysis of the variable nuclear gene region (ITS2) in a number of Alloxysta species. The authors demonstrated that each species possesses a unique allele devoid of intraspecific variation, and so concluded that A. victrix and A. fuscicornis should be regarded as discrete species. Until this point, they had been identified as different species on a global scale. However, morphological differentiation between them has sometimes proven to be difficult. It is important to note here that the name A. fuscicornis was replaced by Alloxysta consobrina (Zetterstedt, 1838) in one of our previous revisions. Recently, members of the subfamily Charipinae were characterized using a combination of molecular markers and the inter- and intraspecific distances for this specific group released for the first time, with interspecific genetic distances in this subfamily reported to range from 12.4% to 16.4%. Continuing with the revision of Charipinae species limits, we focused in the present study on “vixtrix complex” (Alloxysta victrix (Westwood, 1833) and Alloxysta consobrina (Zetterstedt, 1838)) and compared these two cosmopolitan and problematic species, as well as some other related species, such as Alloxysta tscheki (Giraud, 1860) and Alloxysta leunisii (Hartig, 1841). To improve the quality and robustness of our results we combined information from three molecular markers (COI, 16S and ITS2) together with a selection of morphological features based on a dataset published by Paretas-Martínez et al. [20]. After this analysis based on integrative taxonomy, three new synonymies were established as follows: A. consobrina (Zetterstedt, 1838) n. syn., A. tscheki (Giraud, 1860) n. syn., and A. leunisii (Hartig, 1841) n. syn. of A. victrix (Westwood, 1833).
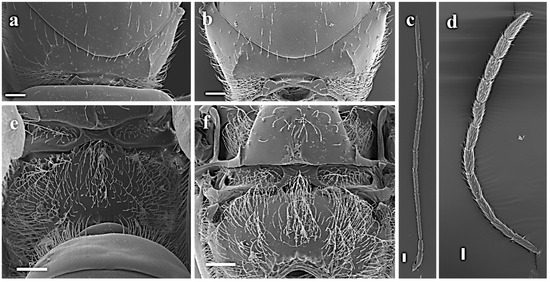
Figure 1.
Morphological comparison between A. consobrina and A. victrix: (a) pronotum of A. consobrina; (b) pronotum of A. vixtrix; (c) female antenna of A. victrix; (d) female antennae of A. consobrina; (e) propodeum of A. consobrina; (f) propodeum of A. victrix, (scale bar: 50 µm).
2. Materials and Methods
2.1. Collection, Sorting, and Identification
Charipinae specimens included in this study (Supplementary Material) were collected in Yprès, Belgium during the 2022 summer season as part of another project (Verheyde et al. unpublished data.). A total of 1025 specimens were identified using morphological characters and a published dichotomous key [21]; of these, 219 were identified as A. victrix and 35 as A. consobrina. Twelve of these specimens preserved in absolute ethanol were selected for molecular analysis: seven of A. victrix and five of A. consobrina.
These specimens were examined using a stereo microscope (OPTIKA ZSM-2) and an environmental scanning electron microscope (FEI Quanta 200 ESEM) at the department of scientific and technical services at the University of Barcelona. Examination using a scanning electron microscope (Hitachi S4800) was also carried out at SCIE (Servicio Central de Soporte a la Investigación) at the Universitat de València.
2.2. Morphological Descriptions
The morphological terminology employed in this study was drawn from Paretas-Martínez et al. [20]. The measurements and abbreviations employed in this study ranged from F1 to F12, denoting the initial and subsequent flagellomeres. The width of the forewing radial cell was measured from the margin of the wing to the beginning of the Rs vein. The transfacial line was measured as the distance between the inner margins of the compound eyes, measured across the face through the antennal sockets, divided by the height of the eye. The malar space was measured as the distance from the lower part of the gena to the mouthparts, divided by the height of the eye. As outlined in the following section, the female and male specimens of the species demonstrated identical characteristics except for the indications specified. The morphological dataset was based on Paretas-Martínez et al. [20]. For this study, only 53 characters were selected, as presented below:
- 0.
- Shape of frons: (0) straight; (1) convex.
- 1.
- Frontal ocellus: (0) almost aligned with lateral ocelli; (1) forming a triangle with lateral ocelli.
- 2.
- Clypeus: (0) not projecting over mandibles; (1) slightly projecting over mandibles; (2) broadly projecting over mandibles.
- 3.
- Epistomal sulcus: (0) present, at least marked by a distinct change of curvature at face; (1) absent.
- 4.
- Distance between tentorial pits: (0) shorter than distance from tentorial pits to clypeal margin; (1) longer.
- 5.
- Clypeo-pleurostomal lines: (0) present, at least marked by a change of curvature at lower face; (1) absent.
- 6.
- Facial strigae: (0) present, radiating from clypeus; (1) absent.
- 7.
- Malar impression: (0) absent; (1) present.
- 8.
- Transfacial line: (0) 1–1.25 times eye’s height; (1) <eye’s height; (2) >1.75 eye’s height.
- 9.
- Shape of dorsal margin of the head: (0) straight; (1) convex.
- 10.
- Number of ommatidia in a distance equal to toruli width: (0) around 10; (1) 4–6.
- 11.
- Face setae: (0) abundant, homogeneously distributed on face and frons; (1) sparse, concentrated below the toruli.
- 12.
- Number of flagellomeres (female): (0) 12; (1) 11; (2) 10; (3) 9.
- 13.
- Apical club in female antenna: (0) absent; (1) present, formed by 2 segments; (2) present but unsegmented.
- 14.
- Pedicel (female): (0) as long as wide; (1) longer than wide but smaller than F1; (2) globular, bigger than F1; (3) cup-shaped.
- 15.
- Relation between F1 and F2: (0) F1 longer than F2; (1) F1 subequal to F2; (2) F1 shorter than F2.
- 16.
- Relation between F2 and F3: (0) F2 longer than F3; (1) F2 subequal to F3; (2) F2 shorter than F3.
- 17.
- Beginning of rhinaria and club shaped: (0) F2; (1) F3; (2) F4.
- 18.
- Shape of F1 (male): (0) without modifications; (1) excavated or curved; (2) with a prominent hump.
- 19.
- Shape of F2 (male): (0) without modifications; (1) excavated or curved.
- 20.
- Pronotal carinae: (0) absent; (1) short; (2) long; (3) very large, forming a well upraised pronotal plate.
- 21.
- Anterior part of subpronotal plate: (0) with two folds separated by a flat surface; (1) wrinkled, with two folds; (2) curved.
- 22.
- Processes behind submedian pronotal depression: (0) big, defining a subpronotal plate; (1) small, punctual; (2) absent.
- 23.
- Pronotum setosity: (0) abundant on all the pronotum; (1) abundant anteriorly, glabrous or sparse posteriorly.
- 24.
- Mesopleuron surface: (0) with wrinkles and/or carinae; (1) with a single sulcus; (2) smooth, plain.
- 25.
- Mesopleural triangle: (0) present; (1) absent.
- 26.
- Scutum setosity: (0) abundant; (1) sparse glabrous.
- 27.
- Anterior admedian signum: (0) present, at least by two strips without setae; (1) absent.
- 28.
- Imbricated sculpture in the scutum: (0) on the entire scutum; (1) only on small areas next to notauli; (2) absent.
- 29.
- Notauli: (0) deep, well-marked; (1) superficial, only slightly marked; (2) absent.
- 30.
- Median mesoscutal impression: (0) present; (1) absent.
- 31.
- Parascutal carina: (0) anteriorly ending next to tegula; (1) continuing reaching pronotal carinae.
- 32.
- Scutellar foveae: (0) present; (1) absent.
- 33.
- Subaxillar bar: (0) posterior end with a dorsal projection; (1) continuous with posterior part of scutellum.
- 34.
- Pronotal carinae: (0) one carina; (1) with carinae; (2) symmetric carinae at both sides; (3) with a projected plate.
- 35.
- Metascutellum: (0) distinctly constricted medially; (1) subrectangular.
- 36.
- Sculpture on metascutellum: (0) one longitudinal medial carina; (1) strongly sculptured; (2) with only some wrinkles.
- 37.
- Sculpture on metanotal trough ventral bar: (0) present; (1) absent.
- 38.
- Metanotal trough: (0) clearly marked; (1) not delimitated on its inferior margin.
- 39.
- Propodeum carinae: (0) present; (1) absent; (2) the entire propodeum with irregular carinae.
- 40.
- Shape of propodeum carinae: (0) narrow; (1) broad; (2) forming a propodeal plate; (3) incomplete.
- 41.
- Medial acetabular carina: (0) long; (1) very short.
- 42.
- Shape of wing: (0) asymmetrical; (1) almost symmetrical; (2) with an ondulation in its apical ventral part.
- 43.
- R1vein: (0) complete; (1) not reaching Rs; (2) reaching anterior margin; (3) not reaching anterior margin.
- 44.
- Rs vein: (0) complete; (1) incomplete.
- 45.
- Shape of Rs: (0) not parallel to R1; (1) parallel to R1.
- 46.
- 2rm vein: (0) clearly indicated; (1) only marked by a small beginning; (2) very thick.
- 47.
- Veins aspect: (0) hollowed; (1) not hollowed.
- 48.
- Rs+M vein: (0) pointing to middle of basal vein; (1) pointing to posterior end of basal vein; (2) absent.
- 49.
- M, Cu1a and M+Cu1a veins: (0) present; (1) absent.
- 50.
- Marginal setae: (0) present; (1) absent.
- 51.
- T3–T4: (0) dorsomedian lengths subequal; (1) T3 very small; (2) fused.
- 52.
- Ring of setae at base of T3: (0) absent, only a few sparse setae present; (1) present.
- 53.
- Apex of ventral spine: (0) projected; (1) not projected.
2.3. DNA Extraction, PCR Amplification, and Sequencing
DNA extraction, PCR amplification, and Sanger sequencing were carried out by AllGenetics & Biology SL (www.allgenetics.eu (accessed on 14 May 2025)). Genomic DNA was extracted nondestructively from whole specimens using the Quick-DNA Microprep Plus Kit (Zymo Research, Tustin, CA, USA) following the manufacturer’s instructions. Briefly, entire specimens were incubated in the extraction buffer without physical disruption or crushing. The kit employs a combination of enzymatic and chemical lysis methods to release DNA. This non-destructive protocol preserves the external morphology of the specimens, enabling subsequent morphological examination. DNA was eluted in 12 μL of elution buffer and quantified using the Qubit dsDNA High Sensitivity Assay (Thermo Fisher Scientific, Waltham, MA, USA). DNA yields were very low (see Section 3). Three genetic markers were targeted for PCR amplification: the mitochondrial cytochrome c oxidase subunit I gene (COI), the 16S ribosomal RNA gene (16S rDNA), and the nuclear internal transcribed spacer 2 (ITS2 rDNA). PCR protocols varied for each gene as follows: For COI, we used the forward primer LCO1490 paired with the reverse primer HCO2198 [22]. PCRs were carried out in 12.5 μL, containing 2 μL of template DNA solution, 0.5 μM of each primer, 6.25 μL of Supreme NZYTaq 2x Green Master Mix (NZYTech, Lisbon, Portugal), and ultrapure water. The reaction mixture was incubated as follows: an initial denaturation step at 95 °C for 5 min, followed by 35 cycles of 95 °C for 30 s, 49 °C for 45 s, 72 °C for 45 s, and a final extension step at 72 °C for 7 min. Samples that showed weak products were reamplified successfully. These PCRs were carried out in a final volume of 25 μL, containing 10 μL of the first PCR product, 0.5 μM of the primers, 6.25 μL of Supreme NZYTaq 2x Green Master Mix, and ultrapure water up to 25 μL. The reaction mixture was incubated as follows: an initial denaturation step at 95 °C for 5 min, followed by five cycles of 95 °C for 30 s, 49 °C for 45 s, 72 °C for 45 s, and a final extension step at 72 °C for 7 min.
For 16S, the forward primer 16SWbF [23] was paired with the reverse primer 16SWbR [24] to amplify a fragment of around 500 bp length. The PCR reactions were carried out in a final volume of 12.5 μL containing two slightly different reaction mixtures: (a) 6.25 μL of Supreme NZYTaq 2x Green Master Mix, 0.5 μM of the primers, 2 μL of template DNA solution, and ultra-pure water up to 12.5 μL; and (b) 3.13 μL of Supreme NZYTaq 2x Green Master Mix, 0.5 μM of the primers, 1.25 μL of template DNA, and ultrapure water up to 12.5 μL. Thermal cycling conditions included an initial denaturation step at 95 °C for 5 min, followed by 35 cycles of 95 °C for 30 s, 49 °C/51 °C (for the different reaction mixtures a and b, respectively), for 45 s, 72 °C for 45 s, and a final extension step at 72 °C for 7 min.
For ITS2, the primer pair used was ITS2F and ITS2R [19] which amplifies a region 400 bp long. PCRs were carried out in a final volume of 12.5 μL, containing 2 μL of template DNA solution, 0.5 μM of the primers, 6.25 μL of Supreme NZYTaq 2x Green Master Mix, and ultrapure water up to 12.5 μL. Cycling conditions included an initial denaturation step at 95 °C for 5 min, followed by 35 cycles of 95 °C for 30 s, 57 °C for 45 s, 72 °C for 45 s, and a final extension step at 72 °C for 7 min.
A negative control that contained no DNA was included in every PCR round to check for cross-contamination. PCR products were run on 2% agarose gels stained with GreenSafe (NZYTech, Portugal), and imaged under UV light to verify the amplicon size. The PCR products were bidirectionally sequenced on an ABI 3730xl DNA Analyzer (Applied Biosystems, Foster City, CA, USA), with the same primers as those used in the PCR amplification. The amplification products that showed an intense background smear, primer dimers, or nonspecific bands in the electrophoresis gel were purified using magnetic beads (Mag-Bind, Omega-Biotek, Norcross, GA, USA) prior to sequencing.
Initial electropherogram analysis was conducted by AllGenetics & Biology SL in Geneious 8.1.9 (https://www.geneious.com (accessed on 14 May 2025)). The primer annealing regions and the low-quality regions at both ends of each electropherogram were trimmed (error probability limit of 0.03). Sequence reads were manually checked for sequencing errors or ambiguous base calls. Ambiguities and polymorphic positions were coded using the IUPAC ambiguity code.
2.4. Phylogenetic Analyses
A phylogenetic analysis was performed using three molecular markers: partial sequences of the cytochrome oxidase I (COI), the mitochondrial gene for the large ribosomal subunit (16S), and the internal transcribed spacer 2 (ITS2). The sequences obtained in the present study were aligned with reference sequences provided by or retrieved from Ferrer-Suay et al. [16] and from other sequences of different Alloxysta species available in Genbank and BOLD. The sequences were aligned using Mafft v7.017, as implemented in Geneious 8.1.9, and the G-INS-i algorithm. The alignments were translated into amino acids to detect possible stop codons or frame shifts.
We constructed a morphological matrix with 53 characters including anatomical features from all informative body parts (Supplementary Material). For the maximum likelihood analysis, we constructed a concatenated dataset with the three molecular markers and the morphological matrix. The best-fit substitution models were selected using PartitionFinder v2.1.1 [22,24], under the corrected Akaike Information Criterion (AICc). The morphological matrix was analysed using the k-state Markov model [25,26].
We conducted phylogenetic analyses under the maximum-likelihood (ML) criterion with IQ-TREE [27] 2 v2.3.5 for both the molecular (COI, 16S and ITS2) and morphological data. We analysed the concatenated data in a single dataset. The molecular dataset was divided into three subsets, so that mitochondrial (COI), nuclear (ITS2+16S), and morphological data were presented separately. For the concatenated analysis we set six partitions: one for the morphological characters, one for each of the partial sequences of the ITS2 and 16S genes, and one for each codon position of the partial COI sequences. Nodal support was assessed with 1000 ultrafast bootstrap replicates (UFboot2) [28], and nodes with UFboot2 ≥ 95 were considered as robust. The ML trees obtained were edited using iTOL. Average intra- and interspecific uncorrected genetic distances (K2P) were estimated with MEGA X. In DNA barcoding analyses, it is very common to estimate the K2P distances (Kimura 2 parameters) between COI sequences. K2P distances consider the sequence evolution model so that more realistic distance values may be estimated.
Topology tests were performed using Bayes factor delimitation (BFD*) implemented in BEAST2 [29]. The concatenated dataset of the three molecular markers was tested for two hypotheses: (1) All the taxa morphologically identified as either A. consobrina, A. leunisi, A. tschecki, or A. victrix are considered independent groups; (2) all the specimens within the A. victrix complex are considered as a single unit. The input tree set was the posterior set of species trees generated by *BEAST. A reversible-jump Markov chain Monte Carlo (rjMCMC) method was used. Two independent MCMC chains were run for every node, each for 10 million iterations with a burn-in of 5 million iterations. After this, each chain was sampled every 500 generations. We estimated the marginal likelihood using path-sampling/thermodynamic integration (PS; [30]), and stepping-stone analysis (SS; [31]) Bayes factors were estimated as twice the difference in the natural log of the model likelihoods (2ΔlnBL); following Kass and Raftery [32] (1995), values of 2ΔlnBL > 1 indicated evidence in favour of a hypothesis and values of 2ΔlnBL > 10 indicated strong support [33].
3. Results
The ML dataset consisted of 134 specimens (17 of which were generated in this study or retrieved from Ferrer-Suay et al. [16]) with a total of 1614 bp (465 bp for the 16S, 490 bp for the ITS2, and 657 bp for the COI) and 53 morphological characters. The best models for the ML analysis were MK+G4 for the morphological partition, TPM3u+F for the 16S, K3Pu+F+G4 for the ITS2, and TN+F+G4, F81+F, and TVM+F+G4 for the first, second, and third codon positions of the COI, respectively.
The ML analyses were summarized in consensus trees (Figure 2). All the analyses recovered equivalent topologies with different degrees of support (Figure 2). The best supported nodes were obtained with the concatenated dataset (Figure 2). The two mitochondrial and nuclear subsets resulted in similarly explicative phylogenies with well-supported nodes, similarly to the concatenated analysis. The concatenated and molecular analyses recovered all the Alloxysta species clustered into well-supported monophyletic clades except for the specimens identified within the A. victrix complex (A. consobrina, A. fuscicornis, A. leunisii, A. tscheki, and A. victrix). Together, the species group was nested within a well-supported monophyletic clade, but the internal topology did not align with the morphological identification of the specimens and most of the internal nodes exhibited low support. The topology of the morphological subset clustered all the Alloxysta species but the only clade with good nodal support was the one containing the species A. basimacula. The rest of the terminals clustered most of the Alloxysta species; however, this was with low nodal support and so cannot be considered in this discussion. These results align with the problematic characteristic of the A. victrix complex that most species exhibit low morphological variation.
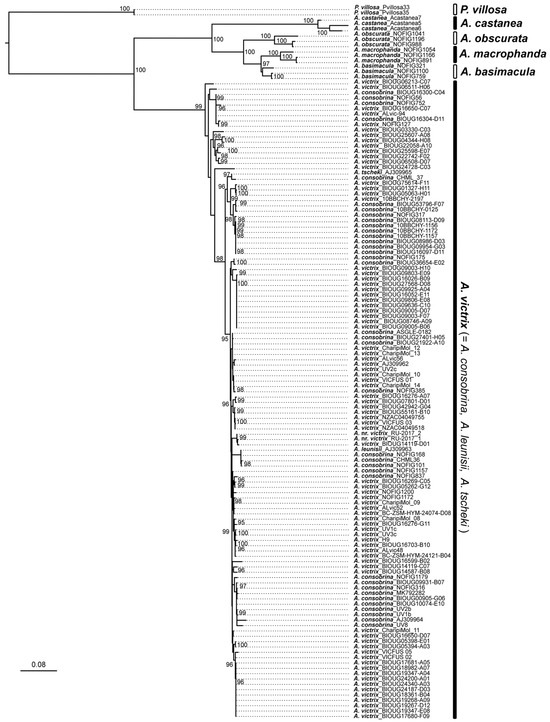
Figure 2.
Consensus tree from the ML analysis with the concatenated dataset of three molecular markers (COI, ITS2, 16S) and the morphological matrix on IQTREE2. Ultrafast Bootstrap values above 95% are indicated in the nodes.
All Alloxysta species, with the exception of those within the A. victrix complex (A. consobrina, A. fuscicornis, and A. victrix), exhibited a clear barcode gap, with intraspecific divergence values below 8% and interspecific divergence values exceeding 13%. In contrast, within the A. victrix complex, both intra- and interspecific divergences were below 8% (Table 1). Bayes factor analysis supported the single-species hypothesis over the multiple-independent-lineages hypothesis, with 2ΔlnBL > 6 in the path sampling (PS) analysis and 2ΔlnBL > 8 in the stepping-stone (SS) analysis.

Table 1.
Mean pairwise distance matrixes (Kimura 2-parameter distances ± standard deviation) for COI sequences within (on the diagonal) and between (below the diagonal) Alloxysta and Phaenoglyphis species.
4. Discussion
Charipinae can be identified by their small size and shiny, smooth bodies, as well as a limited number of other diagnostic features. These characteristics, combined with the large number of described species, make their identification particularly challenging. A previous study showed that most of the species limits established within the Charipinae subfamily based on morphological features (based on type material studies) were correct (Ferrer-Suay et al. [16]). However, there are still species complexes, mainly within the Alloxysta genus, which require more in-depth analyses. One such group is the Alloxysta victrix complex, which is the focus of the present study.
There has been an ongoing discussion regarding the taxonomic status of Alloxysta victrix and Alloxysta consobrina. Their potentially close relationship was stated in a previous work in which striking similarities were noted, such as a closed radial cell, the presence of pronotal carinae, and an absence of propodeal carinae. However, Menke and Evenhuis [13] highlighted significant differences between the two species based on their respective hosts, suggesting that they are more distinct than their morphology alone might imply. Specifically, A. consobrina and A. victrix can be distinguished by variations in the size of the radial cell, the length of the flagellomeres, and the coloration of the head. Due to these distinctions, Menke and Evenhuis [13] reinstated A. consobrina from synonymy but acknowledged that further taxonomic study was necessary. Later, van Veen et al. [19] provided additional molecular evidence by sequencing a highly variable nuclear gene region (ITS2) across several Alloxysta species. Their findings revealed that each species carries a unique allele with no intraspecific variation, further supporting their separation. Previously, these two species had been considered as different species.
As part of our analysis, we also included two closely related species: Alloxysta leunisii and Alloxysta tscheki. A revision of the type material of A. tscheki revealed that it is morphologically very similar to A. consobrina, to the extent that distinguishing them under a microscope is nearly impossible. As a result, their taxonomic status was left unresolved pending further analysis [34]. Additionally, A. leunisii shares similarities with the other three species but can be differentiated by the position of the rhinaria and the club shape, which appears on F2 in A. leunisii but on F3–F4 in the others.
The results obtained in this study from our phylogenetic analysis of three molecular markers and morphological data showed a topology where A. victrix, A. consobrina, and other allied species formed a unique clade with maximum support but no internal structure, supporting our previous taxonomic studies [35]. These data are supported by the results shown in Table 1. From the table, it may be observed that the genetic divergence between victrix and the other species within the complex (consobrina, leunisii, and tscheki) is below 8%, with a median of 5%. The genetic distance is low enough to consider them all as belonging to the same species [14]. The Bayesian factor analysis supports the unification of all the species over considering each species as independent units. In light of these findings, we decided to establish the following new synonymies: A. victrix (Westwood, 1833) (=A. consobrina (Zetterstedt, 1838) n. syn., A. tscheki (Giraud, 1860) n. syn., and A. leunisii (Hartig, 1841) n. syn.
Alloxysta victrix and A. consobrina are cosmopolitan species which are of considerable economic importance worldwide, as they act as hyperparasitoids, potentially disrupting aphid biological control programs. Despite their importance, taxonomic ambiguities surrounding these species hinder a precise understanding of their ecological roles. To address this issue, integrative taxonomy studies—combining morphological, molecular, and ecological approaches—are essential to clarify their taxonomic status and assess their real impact on pest management strategies.
Morphologically, these four species can be differentiated as outlined in the key below:
| 1. | Head yellow; F1 longer than F2, F2–F4 subequal, propodeum without setae usually present in other species. | A. victrix |
| Head brown; without combination of characters as above. | 2 | |
| 2. | Female: rhinaria and club shape begin at F2; F2 shorter than F3. | A. leunisii |
| Female: rhinaria and club shape begin at F3 or F4; F2 subequal to F3. | 3 | |
| 3. | Often found on Brevicoryne brassicae through Diaeretiella rapae. | A. consobrina |
| Often found on Cryptomizus sp. through Aphidius ribis. | A. tscheki |
Following this study, it is essential to reconsider the reliance on flagellomere proportions or body coloration as sole diagnostic traits for this group. While these characteristics may be useful when combined with other features, they are not sufficient on their own to reliably distinguish species. Based on these findings, we will further examine and reassess species boundaries within this genus. Additionally, in this study, we found that the molecular marker COI is a valuable tool for distinguishing or consolidating different species within the Charipinae subfamily, in line with its successful application in other Hymenoptera families. The combination of morphological and molecular features is essential to establishing species limit.
Supplementary Materials
The following supporting information can be downloaded at: https://www.mdpi.com/article/10.3390/d17050362/s1, Figure S1. Consensus tree from the ML analysis with the morphological matrix on IQTREE2. Ultrafast Bootstrap values above 95% is indicated in the nodes. Figure S2. Consensus tree from the ML analysis with the mitochondrial subset of the fragment of the COI gene on IQTREE2. Ultrafast Bootstrap values above 95% is indicated in the nodes. Figure S3. Consensus tree from the ML analysis with the nuclear subset of the fragments of the ITS2 and 16S genes on IQTREE2. Ultrafast Bootstrap values above 95% is indicated in the nodes. Table S1: Sequences used in the molecular analyses separated by species and gene. Code from GenBank Database and published references.
Author Contributions
M.F.-S.: conceptualization, funding acquisition, investigation, writing—original draft. V.C.-P.: formal analysis, methodology, writing—review and editing. J.P.-V.: writing—review and editing. J.S.: writing—review and editing. All authors have read and agreed to the published version of the manuscript.
Funding
This research was supported by project GE 2023 of the Council of Innovation, Universities, Science and Digital Society (reference: CIGE/2022/158).
Institutional Review Board Statement
Not applicable.
Data Availability Statement
Data is contained within the article and Supplementary Material.
Acknowledgments
We would like to thank Wounter Dekonic and Fons Verheyde for providing the material studied here. We are also very grateful to Jordi Paretas-Martínez for taking some of the wasp photographs, and the department of scientific and technical services at the University of Barcelona.
Conflicts of Interest
The authors declare no conflict of interest.
References
- Baranowski, R.; Glenn, H.; Sivinski, J. Biological control of the Caribbean fruit fly (Diptera: Tephritidae). Fla. Entomol. 1993, 76, 245–251. [Google Scholar] [CrossRef]
- Díaz, N.B.; Gallardo, F.E. Sobre los Cynipoideos del Brasil, parasitoides de dípteros estercoleros (Hymenoptera: Cynipoidea). Rev. Soc. Entomol. Argent. 1996, 55, 127–129. [Google Scholar]
- Matrangolo, W.; Nascimento, A.; Carvalho, R. Criação em laboratório de Aganaspis pelleranoi (Hym.: Eucoilidae) parasitoide de moscas das frutas (Dip.: Tephritidae). Resumos Congr. Bras. Entomol. 1997, 150. [Google Scholar]
- Rathman, R.J.; Johnson, M.W.; Tabashnik, B.E. Production of Ganaspidium utilis (Hymenoptera: Eucoilidae) for biological control of Liriomyza spp. (Diptera: Agromyzidae). Biol. Control 1991, 1, 256–260. [Google Scholar] [CrossRef]
- Villeneuve, F.; Trottin Caudal, Y. La protection intégrée des cultures légumières en France: Acquis et perspectives. Infos 1997, 135, 40–44. [Google Scholar]
- Madrigal-Cardeño, A. Fundamentos de Control Biológico de Plagas; Universidad Nacional de Colombia: Medellín, Colombia, 2001. [Google Scholar]
- Bebber, D.P.; Polaszek, A.; Wood, J.R.I.; Barker, C.; Scotland, R.W. Taxonomic capacity and author inflation. New Phytol. 2014, 203, 718–728. [Google Scholar] [CrossRef] [PubMed]
- Ratnasingham, S.; Hebert, P.D.N. BOLD: The Barcode of Life Data System. Mol. Ecol. Notes 2007, 7, 355–364. [Google Scholar] [CrossRef]
- Hebert, P.D.N.; Cywinska, A.; Ball, S.L.; deWaard, J.R. Biological identifications through DNA barcodes. Proc. Biol. Sci. 2003, 270, 313–321. [Google Scholar] [CrossRef]
- Moritz, C.; Cicero, C. DNA barcoding: Promise and pitfalls. PLoS Biol. 2004, 2, e354. [Google Scholar] [CrossRef]
- Dasmahapatra, K.K.; Mallet, J. DNA barcodes: Recent successes and future prospects. Heredity 2006, 97, 254–255. [Google Scholar] [CrossRef]
- Dowton, M.; Austin, A.D. Molecular phylogeny of the insect order Hymenoptera: Apocritan relationships. Proc. Natl. Acad. Sci. USA 1994, 91, 9911–9915. [Google Scholar] [CrossRef] [PubMed]
- Menke, A.S.; Evenhuis, H.H. North American Charipidae: Key to genera, nomenclature, species checklists, and a new species of Dilyta Förster (Hymenoptera: Cynipoidea). Proc. Entomol. Soc. Wash. 1991, 93, 136–158. [Google Scholar]
- Zhang, Y.M.; László, Z.; Looney, C.; Dénes, A.L.; Hanner, R.H.; Shorthouse, D. DNA barcodes reveal inconsistent species boundaries in Diplolepis rose gall wasps and their Periclistus inquilines (Hymenoptera: Cynipidae). Can. Entomol. 2019, 151, 717–727. [Google Scholar] [CrossRef]
- Sheffield, C.; Heron, J.; Gibbs, J.; Onuferki, T.M.; Oram, R.; Best, L.; deSilve, N.; Dumesh, S.; Pinar, A.; Rowe, G. Contribution of DNA barcoding to the study of the bees (Hymenoptera: Apoidea) of Canada: Progress to date. Can. Entomol. 2017, 149, 736–754. [Google Scholar] [CrossRef]
- Ferrer-Suay, M.; Staverløkk, A.; Selfa, J.; Pujade-Villar, J.; Naik, S.; Ekrem, T. Nuclear and mitochondrial markers suggest new species boundaries in Alloxysta (Hymenoptera: Cynipoidea: Figitidae). Arthropod Syst. Phylogeny 2018, 76, 463–473. [Google Scholar] [CrossRef]
- Ferrer-Suay, M.; Bulgarella, M.; Heimphel, G.E.; Rakhshani, E.; Selfa, J. Interspecific limits within Charipinae (Cynipoidea: Figitidae), insights from molecular data. Insects 2024, 15, 354. [Google Scholar] [CrossRef]
- Fergusson, N.D.M. Charipidae, Ibaliidae and Figitidae (Hymenoptera: Cynipoidea). Handb. Identif. Br. Insects 1986, 8, 1–55. [Google Scholar]
- Van Veen, F.J.; Belshaw, R.; Godfray, H.C.J. The value of the ITS2 region for the identification of species boundaries between Alloxysta hyperparasitoids (Hymenoptera: Charipidae) of aphids. Eur. J. Entomol. 2003, 100, 449–453. [Google Scholar] [CrossRef]
- Paretas-Martínez, J.; Arnedo, M.A.; Melika, G.; Selfa, J.; Seco-Fernández, M.V.; Fülöp, D.; Pujade-Villar, J. Phylogeny of the parasitic wasp subfamily Charipinae (Hymenoptera, Cynipoidea, Figitidae). Zool. Scr. 2007, 36, 153–172. [Google Scholar] [CrossRef]
- Ferrer-Suay, M.; Selfa, J.; Pujade-Villar, J. A proposal of Charipinae’s keys for the world fauna (Hymenoptera: Cynipoidea: Figitidae). Zookeys 2019, 822, 79–139. [Google Scholar] [CrossRef]
- Folmer, O.; Black, M.; Hoeh, W.; Lutz, R.; Vrijenhoek, R. DNA primers for amplification of mitochondrial cytochrome c oxidase subunit I from diverse metazoan invertebrates. Mol. Mar. Biol. Biotechnol. 1994, 3, 294–299. [Google Scholar] [PubMed]
- Whitfield, J.B. Molecular and morphological data suggest a single origin of the polydnaviruses among braconid wasps. Naturwissenschaften 1997, 84, 502–507. [Google Scholar] [CrossRef]
- Lanfear, R.; Calcott, B.; Ho, S.Y.W.; Guindon, S. PartitionFinder: Combined selection of partitioning schemes and substitution models for phylogenetic analyses. Mol. Biol. Evol. 2012, 29, 1695–1701. [Google Scholar] [CrossRef] [PubMed]
- Lewis, P.O. A likelihood approach to estimating phylogeny from discrete morphological character data. Syst. Biol. 2001, 50, 913–925. [Google Scholar] [CrossRef]
- Barbosa, F.F.; Mermudes, J.R.M.; Russo, C.A.M. Performance of tree-building methods using a morphological dataset and a well-supported Hexapoda phylogeny. PeerJ 2024, 12, e16706. [Google Scholar] [CrossRef] [PubMed]
- Rambaut, A.; Drummond, A.J.; Xie, D.; Baele, G.; Suchard, M.A. Posterior summarization in Bayesian phylogenetics using Tracer 1.7. Syst. Biol. 2018, 67, 901–904. [Google Scholar] [CrossRef]
- Hoang, D.T.; Chernomor, O.; Von Haeseler, A.; Minh, B.Q.; Vinh, L.S. UFBoot2: Improving the ultrafast bootstrap approximation. Mol. Biol. Evol. 2018, 35, 518–522. [Google Scholar] [CrossRef]
- Bouckaert, R.; Heled, J.; Kühnert, D.; Vaughan, T.; Wu, C.-H.; Xie, D.; Suchard, M.A.; Rambaut, A.; Drummond, A.J. BEAST 2: A software platform for Bayesian evolutionary analysis. PLoS Comput. Biol. 2014, 10, e1003537. [Google Scholar] [CrossRef]
- Lartillot, N.; Philippe, H.; Lewis, P. Computing Bayes factors using thermodynamic integration. Syst. Biol. 2006, 55, 195–207. [Google Scholar] [CrossRef]
- Xie, W.; Lewis, P.O.; Fan, Y.; Kuo, L.; Chen, M.-H. Improving marginal likelihood estimation for Bayesian phylogenetic model selection. Syst. Biol. 2011, 60, 150–160. [Google Scholar] [CrossRef]
- Kass, R.E.; Raftery, A.E. Bayes factors. J. Am. Stat. Assoc. 1995, 90, 773–795. [Google Scholar] [CrossRef]
- Grummer, J.A.; Bryson, R.W., Jr.; Reeder, T.W. Species delimitation using Bayes factors: Simulations and application to the Sceloporus scalaris species group (Squamata: Phrynosomatidae). Syst. Biol. 2014, 63, 119–133. [Google Scholar] [CrossRef] [PubMed]
- Ferrer-Suay, M.; Selfa, J.; Pujade-Villar, J. New contribution to the knowledge of the genus Alloxysta (Insecta: Hymenoptera: Cynipoidea: Figitidae): Revision of some type material. Ann. Nat. Hist. Mus. Wien. Ser. B 2015, 117, 23–36. [Google Scholar]
- Ferrer-Suay, M.; Selfa, J.; Pujade-Villar, J. Palaearctic species of Charipinae (Hymenoptera, Figitidae): Two new species, synthesis and identification key. Eur. J. Taxon. 2018, 427, 1–110. [Google Scholar] [CrossRef]
Disclaimer/Publisher’s Note: The statements, opinions and data contained in all publications are solely those of the individual author(s) and contributor(s) and not of MDPI and/or the editor(s). MDPI and/or the editor(s) disclaim responsibility for any injury to people or property resulting from any ideas, methods, instructions or products referred to in the content. |
© 2025 by the authors. Licensee MDPI, Basel, Switzerland. This article is an open access article distributed under the terms and conditions of the Creative Commons Attribution (CC BY) license (https://creativecommons.org/licenses/by/4.0/).