Article

Changes in the Soil Bacterial Community Across Fairy Rings in Grasslands Using Environmental DNA Metabarcoding

by
Teresa Marí
1,
José Manjón-Cabeza
1,2,*,
Antonio Rodríguez
1,†,
Leticia San Emeterio
3,
Mercedes Ibáñez
1,2,‡ and
M.-Teresa Sebastià
1,2
1
Group GAMES, Department of Crop and Forest Science and Engineering, School of Agrifood, Forestry Science and Engineering, University of Lleida, Av. Rovira Roure, 191, 25198 Lleida, Spain
2
Laboratory of Functional Ecology and Global Change (ECOFUN), Forest Sciences and Technology Centre of Catalonia (CTFC), Ctra. de Sant Llorenç de Morunys, Km. 2, 25280 Solsona, Spain
3
Department of Agronomy, Biotechnology and Food, Universidad Pública de Navarra, 31006 Pamplona, Spain
*
Author to whom correspondence should be addressed.
Current Address: Université Clermont Auververgne, INRAE, VetAgro Sup, UREP, 63000 Clermont-Ferrand, France.
Current Address: Centre for Ecological Research and Forestry Applications (CREAF), Universitat Autónoma de Barcelona, 08193 Bellaterra, Spain.
Diversity 2025, 17(5), 322; https://doi.org/10.3390/d17050322
Submission received: 28 February 2025 / Revised: 4 April 2025 / Accepted: 8 April 2025 / Published: 29 April 2025
(This article belongs to the Section Microbial Diversity and Culture Collections)

Abstract

:
Fairy ring fungi are considered keystone species in grasslands due to their strong impact on soil physicochemical properties, but their effect on the associated bacterial community is poorly understood. Here, we analyze shifts in soil bacterial diversity and community composition across fairy rings using Illumina metabarcoding. A total of 254,135 MiSeq reads and between 405 and 1444 operational taxonomic units (OTUs) per soil sample were observed in a montane grassland in the Eastern Pyrenees. We found a strong reduction in all bacterial diversity indices inside the ring-affected zones compared to the outside grassland, especially in the stimulation (current ring) zone. The exception were Firmicutes, the dominant taxa in the grassland, which increased their relative abundance further in fairy ring-affected zones. The recovery of bacterial populations after the fungal front passage highlights the strong resilience of the bacterial communities to this biotic disturbance.

1. Introduction

Grasslands are one of the most widespread ecosystems worldwide [1]. They provide goods and services such as carbon sequestration, cultural heritage and high biodiversity [2,3,4,5]. However, changes in land use have resulted in the loss of many grassland ecosystems across Europe [6] and the ecosystem services that those provide. Since many of these ecosystem services are provided by microbial organisms [7], it is important to increase the knowledge of the mechanisms that regulate the dynamics of microbial diversity for the successful management of these valuable areas and the goods and services they provide [8].
Among the whole biodiversity in semi-natural grasslands, saprophytic basidiomycete fungi causing fairy rings have been described as keystone species [9]. Growing radially through the soil with the eventual formation of fruiting bodies, these fungi also become evident aboveground because of their effect on the vegetation. Based on this effect, [10] fairy rings are divided into three types: type I rings are characterized by causing severe symptoms or plant death; type II rings exhibit arcs of greener plants with luxuriant growth; and type III rings involve the occurrence of rings of basidiocarps without any effect on vegetation. Type II rings can appear and disappear unpredictably, but they can also turn into type I rings, as the dead zone characterizing type I rings generally does not appear until summer [11].
The enhancement in vegetation growth in type I and II rings is attributed to the breakdown of the soil organic matter by the saprophytic fungus [8,12,13]. In this process, complex protein molecules are transformed into compounds of nitrogen readily available to vascular plants, which then exhibit a luxuriant growth in this zone [14]. Once dead, the resulting vegetal material will, in turn, serve as a food supply for the soil biota [10].
Fungi also modify soil aggregation, soil nutrient pools, hydrophobicity and pH, resulting in shifts in the soil bacterial community composition of the different zones across the rings [3,15,16]. Understanding the changes induced by the interaction of the fairy ring fungi on the bacterial communities is crucial to unraveling the mechanisms that promote the productivity of semi-natural grasslands [15]. Although microbial changes across fairy ring zones have been previously studied [17,18,19], only a few studies have used next-generation DNA sequencing (NGS) methods to characterize the changes in the composition of bacterial communities across fairy rings in grassland soils [16,20]. These changes can include a strong proliferation of a few taxa, which may become dominant, causing profound effects on the bacterial community dynamics [21,22,23]. These changes mainly benefit Basidiomycota [24,25,26]. The increase in these groups has been shown to impact the environment by acting as ecosystem engineers as reported by Zotti et al. [27]: (i) release of hydrophobins; (ii) pathogenic behavior toward the plant community; (iii) disturbance of the rhizosphere microbial community; (iv) enrichment of nutrients that leads to toxic levels; and (v) release of cyanides. Not only may direct effects, such as the release of toxic compounds, affect the bacterial assembly, but indirect effects, through alterations to the plant community, can also have an impact on the rhizosphere bacteria in grasslands.
The mechanisms underlying the negative effects of fairy ring fungi on vegetation, including soil hydrophobicity and release of phytotoxins, have been further documented [3,28,29,30]. However, changes on the diversity and composition of the bacterial community related to the passage of the fungi and the enhancement of vegetation growth on type II fairy rings have received less attention and inconclusive results [3,15,16]. While some studies have shown a decrease in bacterial diversity [27] with the progression of the fairy ring, others have shown the opposite [16]. Regarding specific groups, the response of the community is also inconclusive. While some works have shown a decrease in Actinobacteria [27], others have reported an increase in Gram + bacteria [31], to which these groups belong, but also a direct increase in Actinobacteria [16].
In this study, we focus on the soil microbial community of a calcareous pastured grassland of the Eastern Pyrenees in the Iberian Peninsula. Rings of lush growth of vegetation were visible in the study grassland without any occurrence of basidiocarps. In a previous study on this grassland [25,32], we described the fungal community of these fairy rings through the use of Illumina metabarcoding. Contrary to that found by previous studies on Tricholoma matsutake rings [33,34], we found an increase in fungal biodiversity associated to the fungal front passage, and a change in the fungal community composition towards a higher Basidiomycota/Ascomycota ratio as the ring advances. In addition, in contrast to previous findings [15], these changes remained stable across the different ring-affected areas and were significantly different from the outside zones. Based on our previous results, the aims of this study are (a) to characterize the bacterial diversity and community composition in this montane, pastured, semi-natural grassland and (b) to describe these changes in the bacterial community composition across the fairy ring zones. We posit that fairy ring fungi would affect the soil bacterial community composition by changing the physical and chemical properties of the soil. We expect an acidification of the soil beneath the stimulation zone but no decreases in soil moisture, given the unseen negative effects of fairy rings on the vegetation. However, in the same grassland, we found potassium depletion induced by fairy rings [31]. Our expectation is that the bacterial major groups will change in parallel to what was found in fungal communities [25,32].

2. Materials and Methods

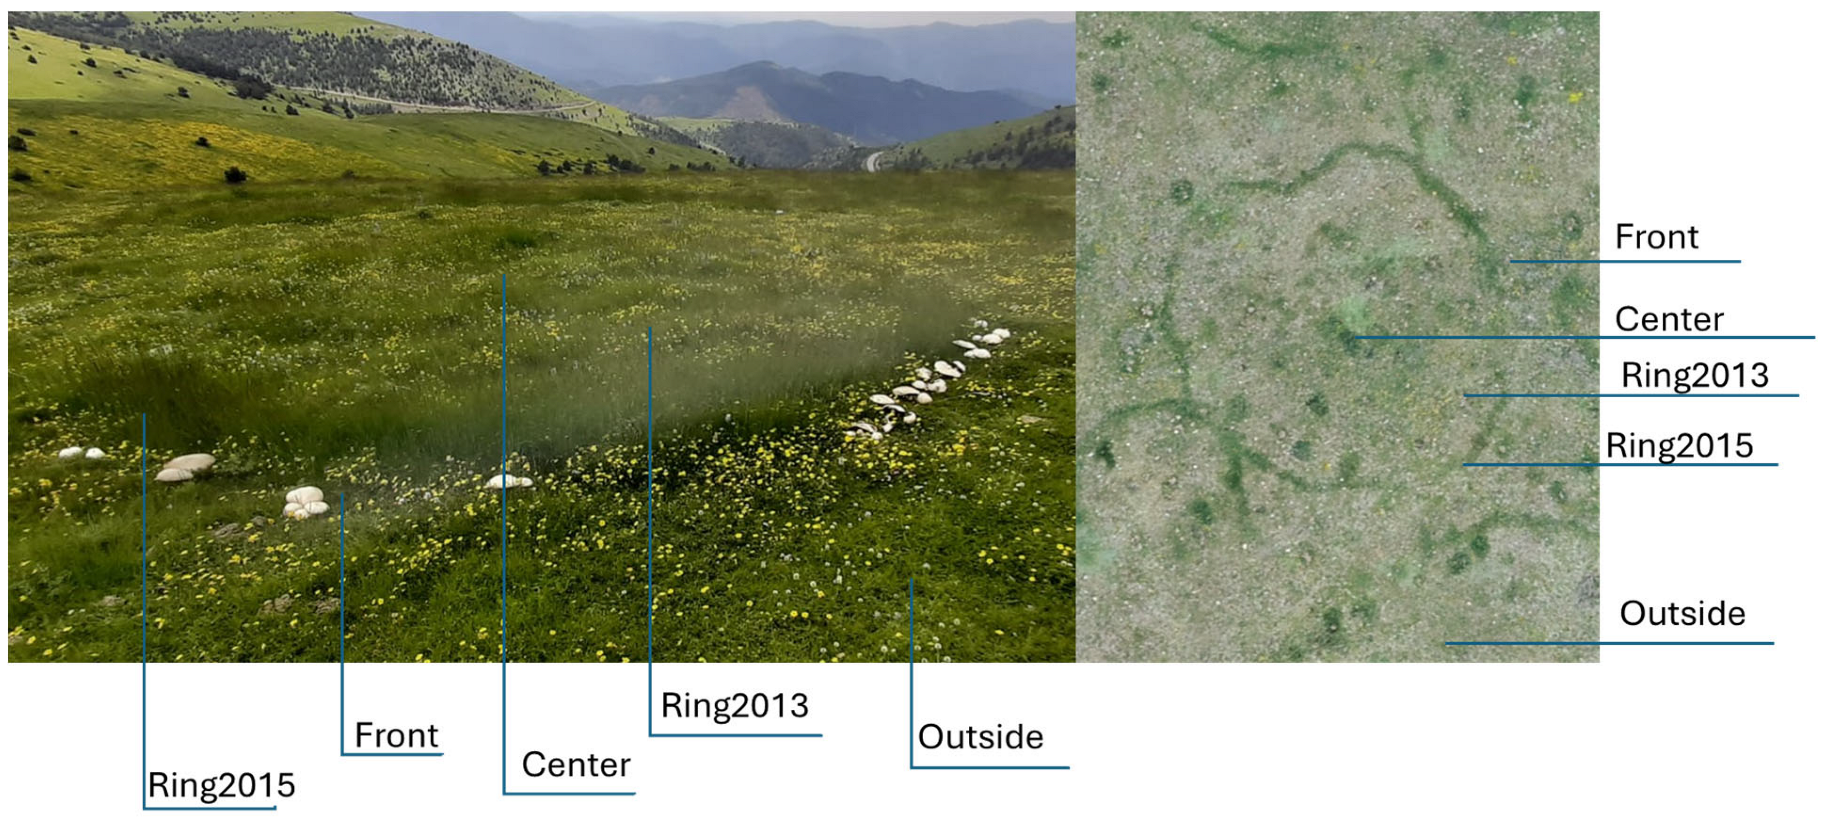
2.1. Study Site and Experimental Design

This study was conducted in the area of pastured grassland called La Bertolina (Spain), in the Eastern Pyrenees (42°05′56″ N, 1°39′40″ E), 1276 m.a.s.l. This area was previously cropped and annually tilled until 1998, after about 40 years of cereal cultivation. The mean annual temperature in this area (1991-2020) is 9.7 °C, and the mean annual precipitation is 884.97 mm (GenCat, https://sig.gencat.cat/visors/hipermapa.html, accessed on 29 April 2025). The texture of the soil is sandy loam with a limestone bedrock, with a high stoniness composed of polygenic conglomerates (ICGC, http://betaportal.icgc.cat/visor/client_utfgrid_geo.html, geologic map 1:50,000 BG50M_v1r1, 2007, accessed on 25 May 2015). This grassland is extensively grazed by cattle (0.44 LSU ha−1) from spring to autumn. The vegetation is dominated by grasses (Festuca arundinacea Schreb., Poa pratensis L., Dactylis glomerata L.), although Trifolium pratense L., Plantago lanceolata L., and other forbs are also common in this grassland.
Sampling strategy was conducted as described in [25]. Briefly, in May 2015, when the rings were more visible, six rings were selected, based on their spatial arrangement in order to avoid intersections with other adjacent rings. These rings had diameters ranging from 4.5 to 9.9 m. A radial transect was designated across each ring, with five circular sampling points of 25 cm in diameter, which constituted the variable “ring zone” (RZ): (1) in the center of the ring (“Center”); (2) in the geo-referenced 2013 ring zone (“Ring13”); (3) in the 2015 dark-green vegetation zone (“Ring15”); (4) in the area immediately outside of the ring (“Front”); and (5) outside the ring (>2 m), without visible ring influence (“Outside”) (Figure 1). A total number of 30 soil samples were taken in the 0–10 cm depth soil layer with a 10 cm × 6 cm × 5 cm metal soil core in each sampling point. The identity of the rings was also considered and appears in analysis as R1 to R6.

2.2. Soil Physicochemical Properties Analysis

Soil water content (gravimetric) was calculated as the difference in soil weight before and after drying at 60 °C, divided by the dry weight. pH was measured in the soil, and the temperature of the soil (Tsoil) was measured with a thermometer in the field. Ca, P, Mg and K were measured in dry samples. While available P was measured with the Olsen method [35], Ca, P and Mg were extracted using ammonium acetate and measured by atomic absorption spectroscopy (AAS). NO3. and NH4+ were measured with an autoanalyzer (SKALAR/SAN SYSTEM SA3000-5000).

2.3. Next Generation Sequencing and Bioinformatic Analysis

DNA was isolated upon arrival to the laboratory using the PowerSoil DNA isolation kit (MoBio, Qiagen, (Hilden, Germany)), strictly following the manufacturer’s instructions. Determination of DNA concentration was performed using a NanoDrop 1000 spectrophotometer (Thermo Fisher Scientific (Waltham, MA, USA)).
For DNA metabarcoding library preparation, a fragment of the bacterial 16S ribosomal RNA gene of around 530 bp, was amplified using the primers Bakt 341F (5′ CCT ACG GGN GGC WGC AG 3′) and Bakt 805R (5′ GAC TAC HVG GGT ATC TAA TCC 3′), [36]. The primers had the Illumina adapter sequences and were tagged to their 5′ end. The tags make it possible to link the reads obtained during sequencing to a particular sample.
PCRs were carried out in a final volume of 25 µL, containing 2.5 µL of template DNA, 0.5 µM of the primers, 12.5 µL of Phusion DNA polymerase mix (Thermo Scientific (Waltham, MA, USA)), and ultrapure water up to 25 µL. Incubation times and temperatures, as well as PCR quality control and purification can be found in the Supplementary Materials.
Amplicon pools were purified and sent for sequencing to the Illumina MiSeq PE300 platform. All the negative controls were included in the pools in order to check for potential contamination. Quality filtering of the FASTQ files can be found in the Supplementary Materials. Paired-end assembly of the forward (R1) and reverse (R2) reads was performed using FLASH [37]. Mismatch resolution in the overlapping region is accomplished by keeping the base with the higher quality score. The FASTQ files were quality-filtered using the bioinformatic tool Qiime 1.9.1 [38]. DNA sequences having quality scores <20 were discarded. Chimeric sequences were removed using the UCHIME algorithm [39] implemented in VSEARCH. The reference database used was Greengenes [40]. 16S reads were clustered into OTUs using the open-reference approach in Qiime. In this method, reads are clustered against a reference database, and any reads which do not hit the reference sequence collection are subsequently clustered de novo. Each OTU was assigned to a microbial taxa using the BLAST (v.2.14.1, NCBI, Bethesda, MD, USA) algorithm [41]. Based on the resulting OTU table obtained for each sample, the OTUs which were present in the negative control and the OTUs represented by sequences with frequencies lower than 0.005% in the whole dataset were removed.
Finally, rarefaction plots were constructed showing the rarefied number of OTUs, defined at a 97% sequence identity threshold, assuming a sufficient sequencing depth when the rarefaction curves tended towards saturation. All those samples not reaching the plateau were removed from further analysis (Figure 2). Additionally, the percentage of coverage was calculated by the Good’s method [42].

2.4. Statistical Analyses

The following data analyses were performed using R software (v.2.3.0, R Development Core Team, Vienna, Austria). Bacterial phyla and classes, with read abundances higher than 1%, were the main variables analyzed. Families and genera with read abundances higher than 0.5% were also analyzed. One-way ANOVA, followed by Tukey’s multiple comparison tests [43] were used to test for significant differences among the means of the relative read abundances of each taxa and soil variables across RZ. The significance of least significant difference tests was evaluated in all cases at p < 0.05.
The Hill’s series of diversity indices was used to identify diversity changes between RZ levels [44]. Hill’s diversity consists of three numbers: N0 is species richness; N1 is the exponential of Shannon’s diversity index (its value focuses on common and abundant species); and N2 is the inverse of Simpson’s diversity index (which largely favors very abundant species) [45]. Linear mixed models (LME) considered RZ as a fixed factor and the “ring identity” and “ring diameter” as random factors, whereas either Hill’s N0, N1 and N2 were considered response variables in separate models. The model for each Hill’s index was compared then with a model following the same structure but adjusted for heteroscedasticity (“weights = varIdent (form = ~1|Size)”) and the most parsimonious model was selected based on the Akaike Information Criterion (AIC). Once the best model was selected, the significance of the LME models was tested by ANOVA. Significant differences between RZ levels were tested using Tukey’s post-hoc test [46] when RZ terms were significant in the linear-mixed models.
The CANOCO 5 software package (Microcomputer Power, Ithaca, NY, USA) was used to perform multivariate analysis on the microbial community samples, using the relative abundances of the OTUs obtained from the Illumina metabarcoding data set as descriptors. In particular, we used redundancy analysis (RDA), including ring diameter (RD; two categories: large, more than 6 m, and small, less than 5 m), ring zone (RZ; five categories: center, Ring14, Ring15, front, outside), soil pH and moisture as independent explanatory variables; and the ring identity as a condition variable (six categories: Ring 1 to 6). Interactions between the ring and the RZs were also tested. A forward selection procedure and Monte Carlo permutation test based on 999 random permutations were used to determine the significance of the experimental variables explaining the observed variance in the composition of the bacterial communities. The independent contribution of all explanatory variables (simple term effects) and their partial contributions (conditional term effects) were both computed.

3. Results

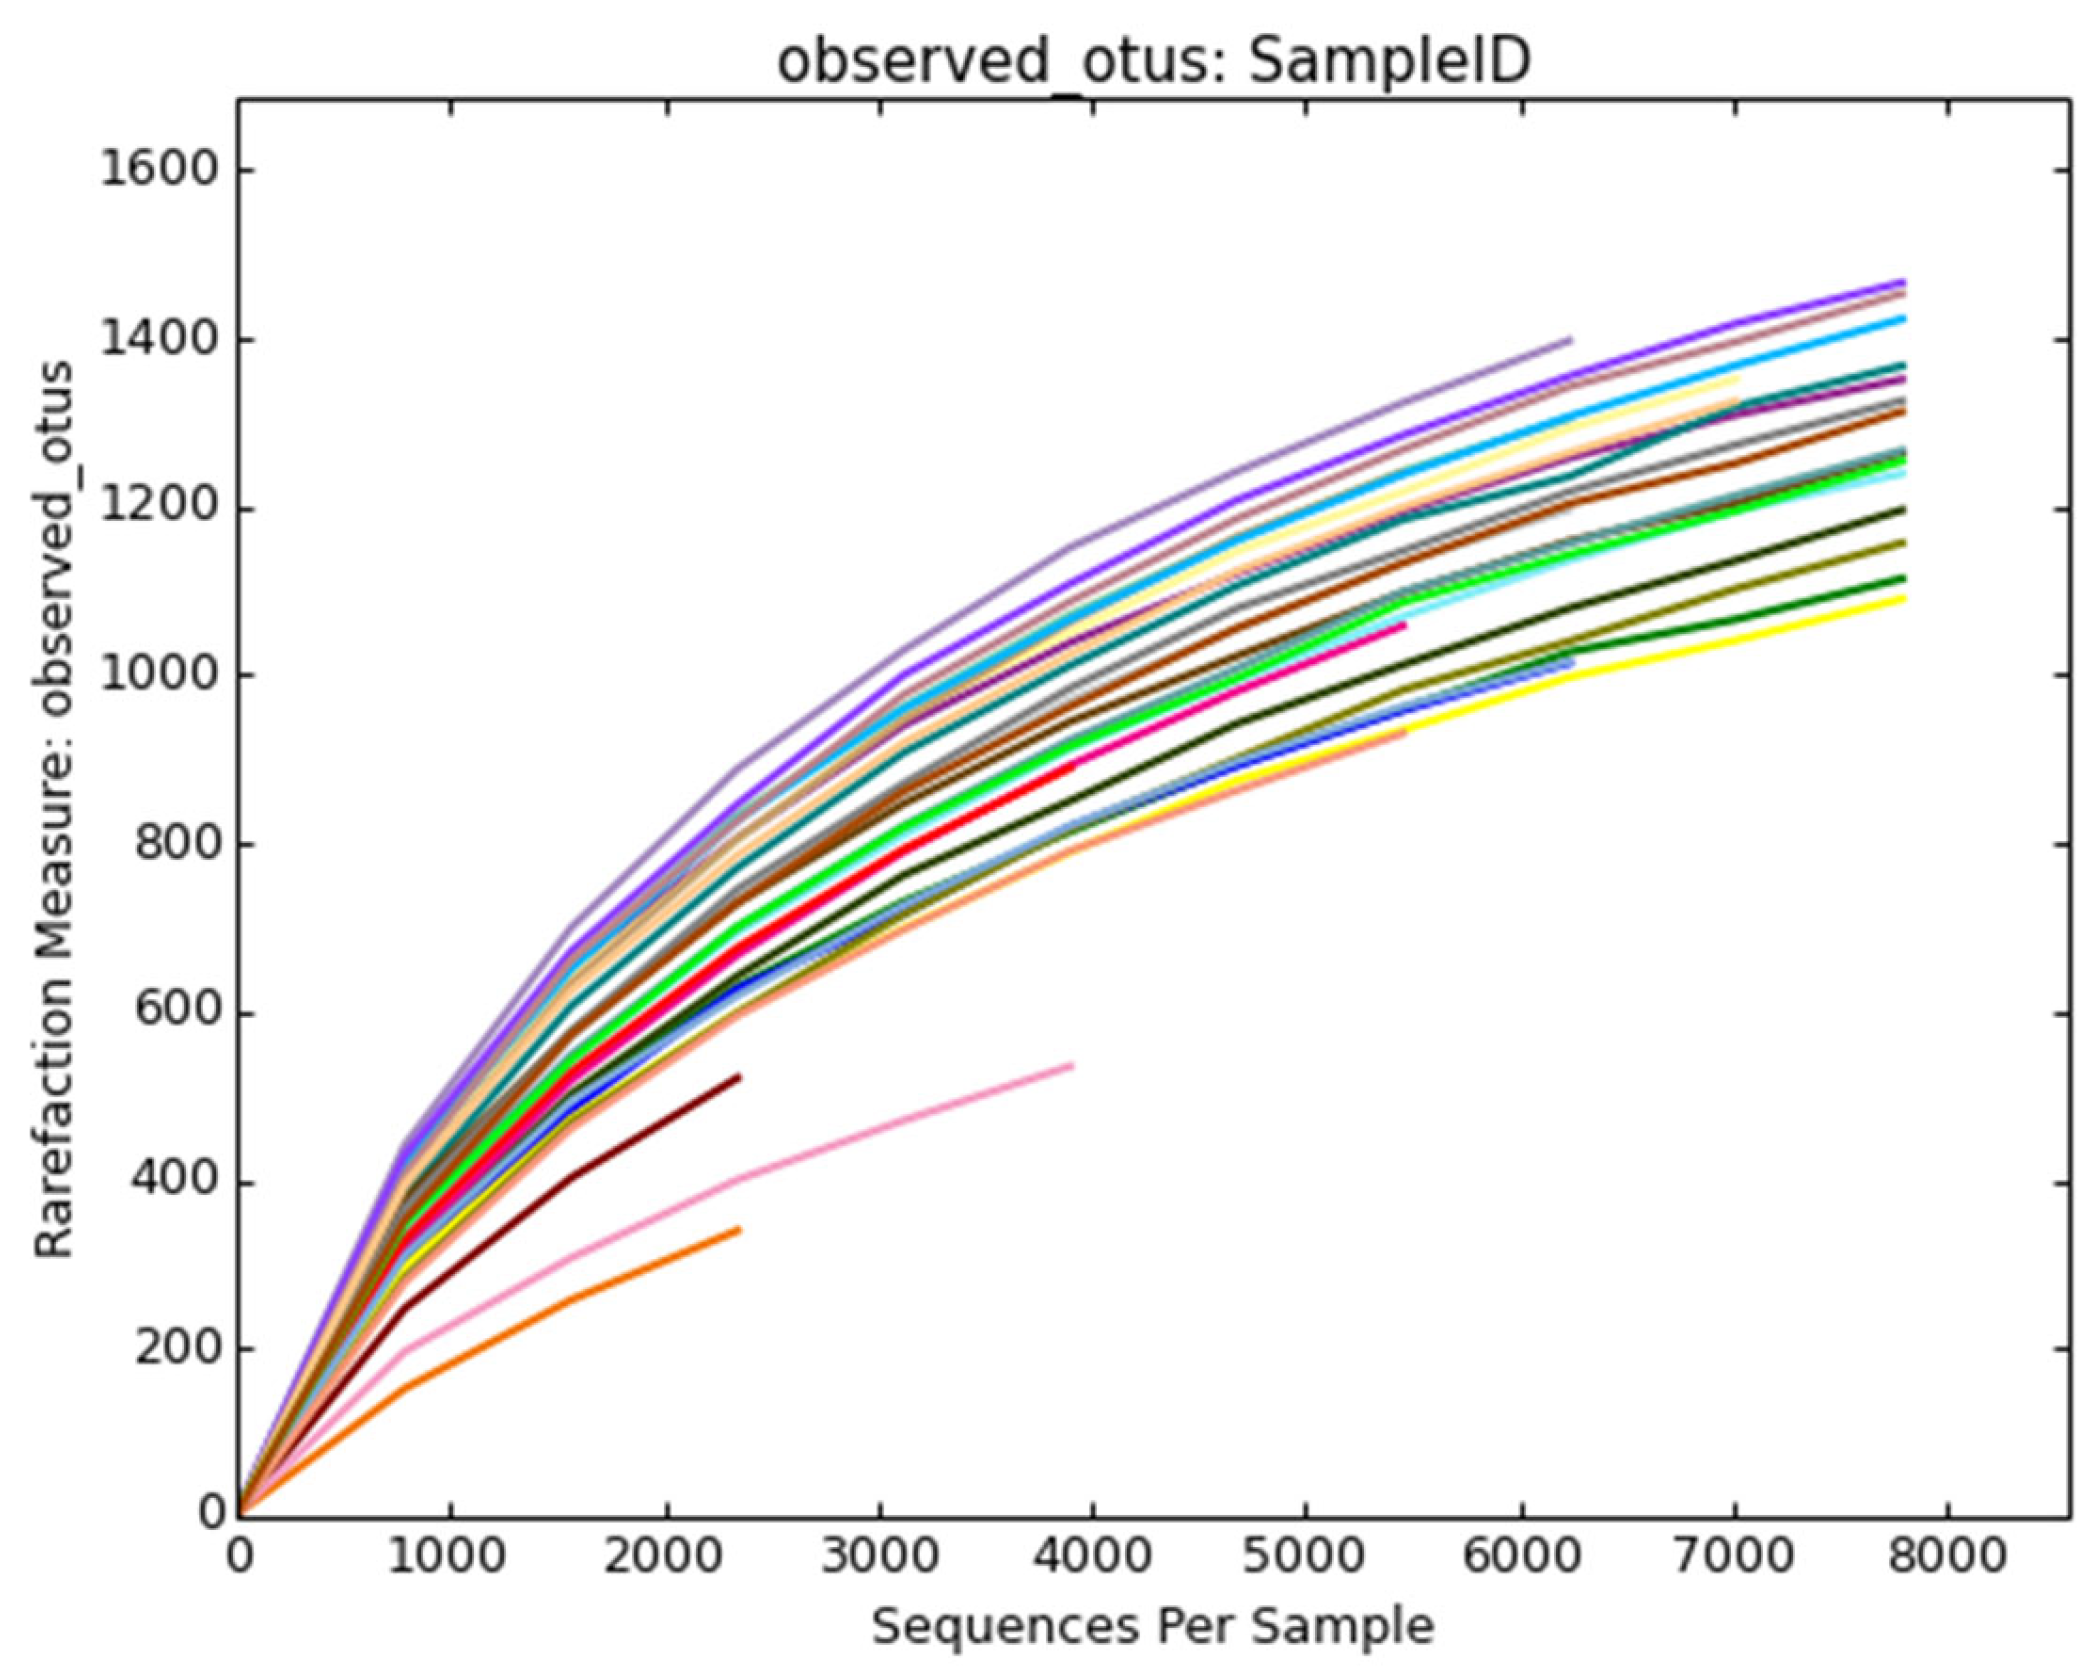
3.1. Sequencing Results of Bacterial Communities

A total of 254,135 filtered reads and 2067 OTUs were obtained from thirty samples through Illumina MiSeq sequencing analysis. From 2035 to 18,865 reads were found per sample, with the number of OTUs ranging from 405 to 1444 per sample. As shown in Figure 2, rarefaction curves for most of the samples tended to plateau as the number of sequencing events increased, indicating that the sequencing depth was enough to retrieve most of the bacterial diversity.

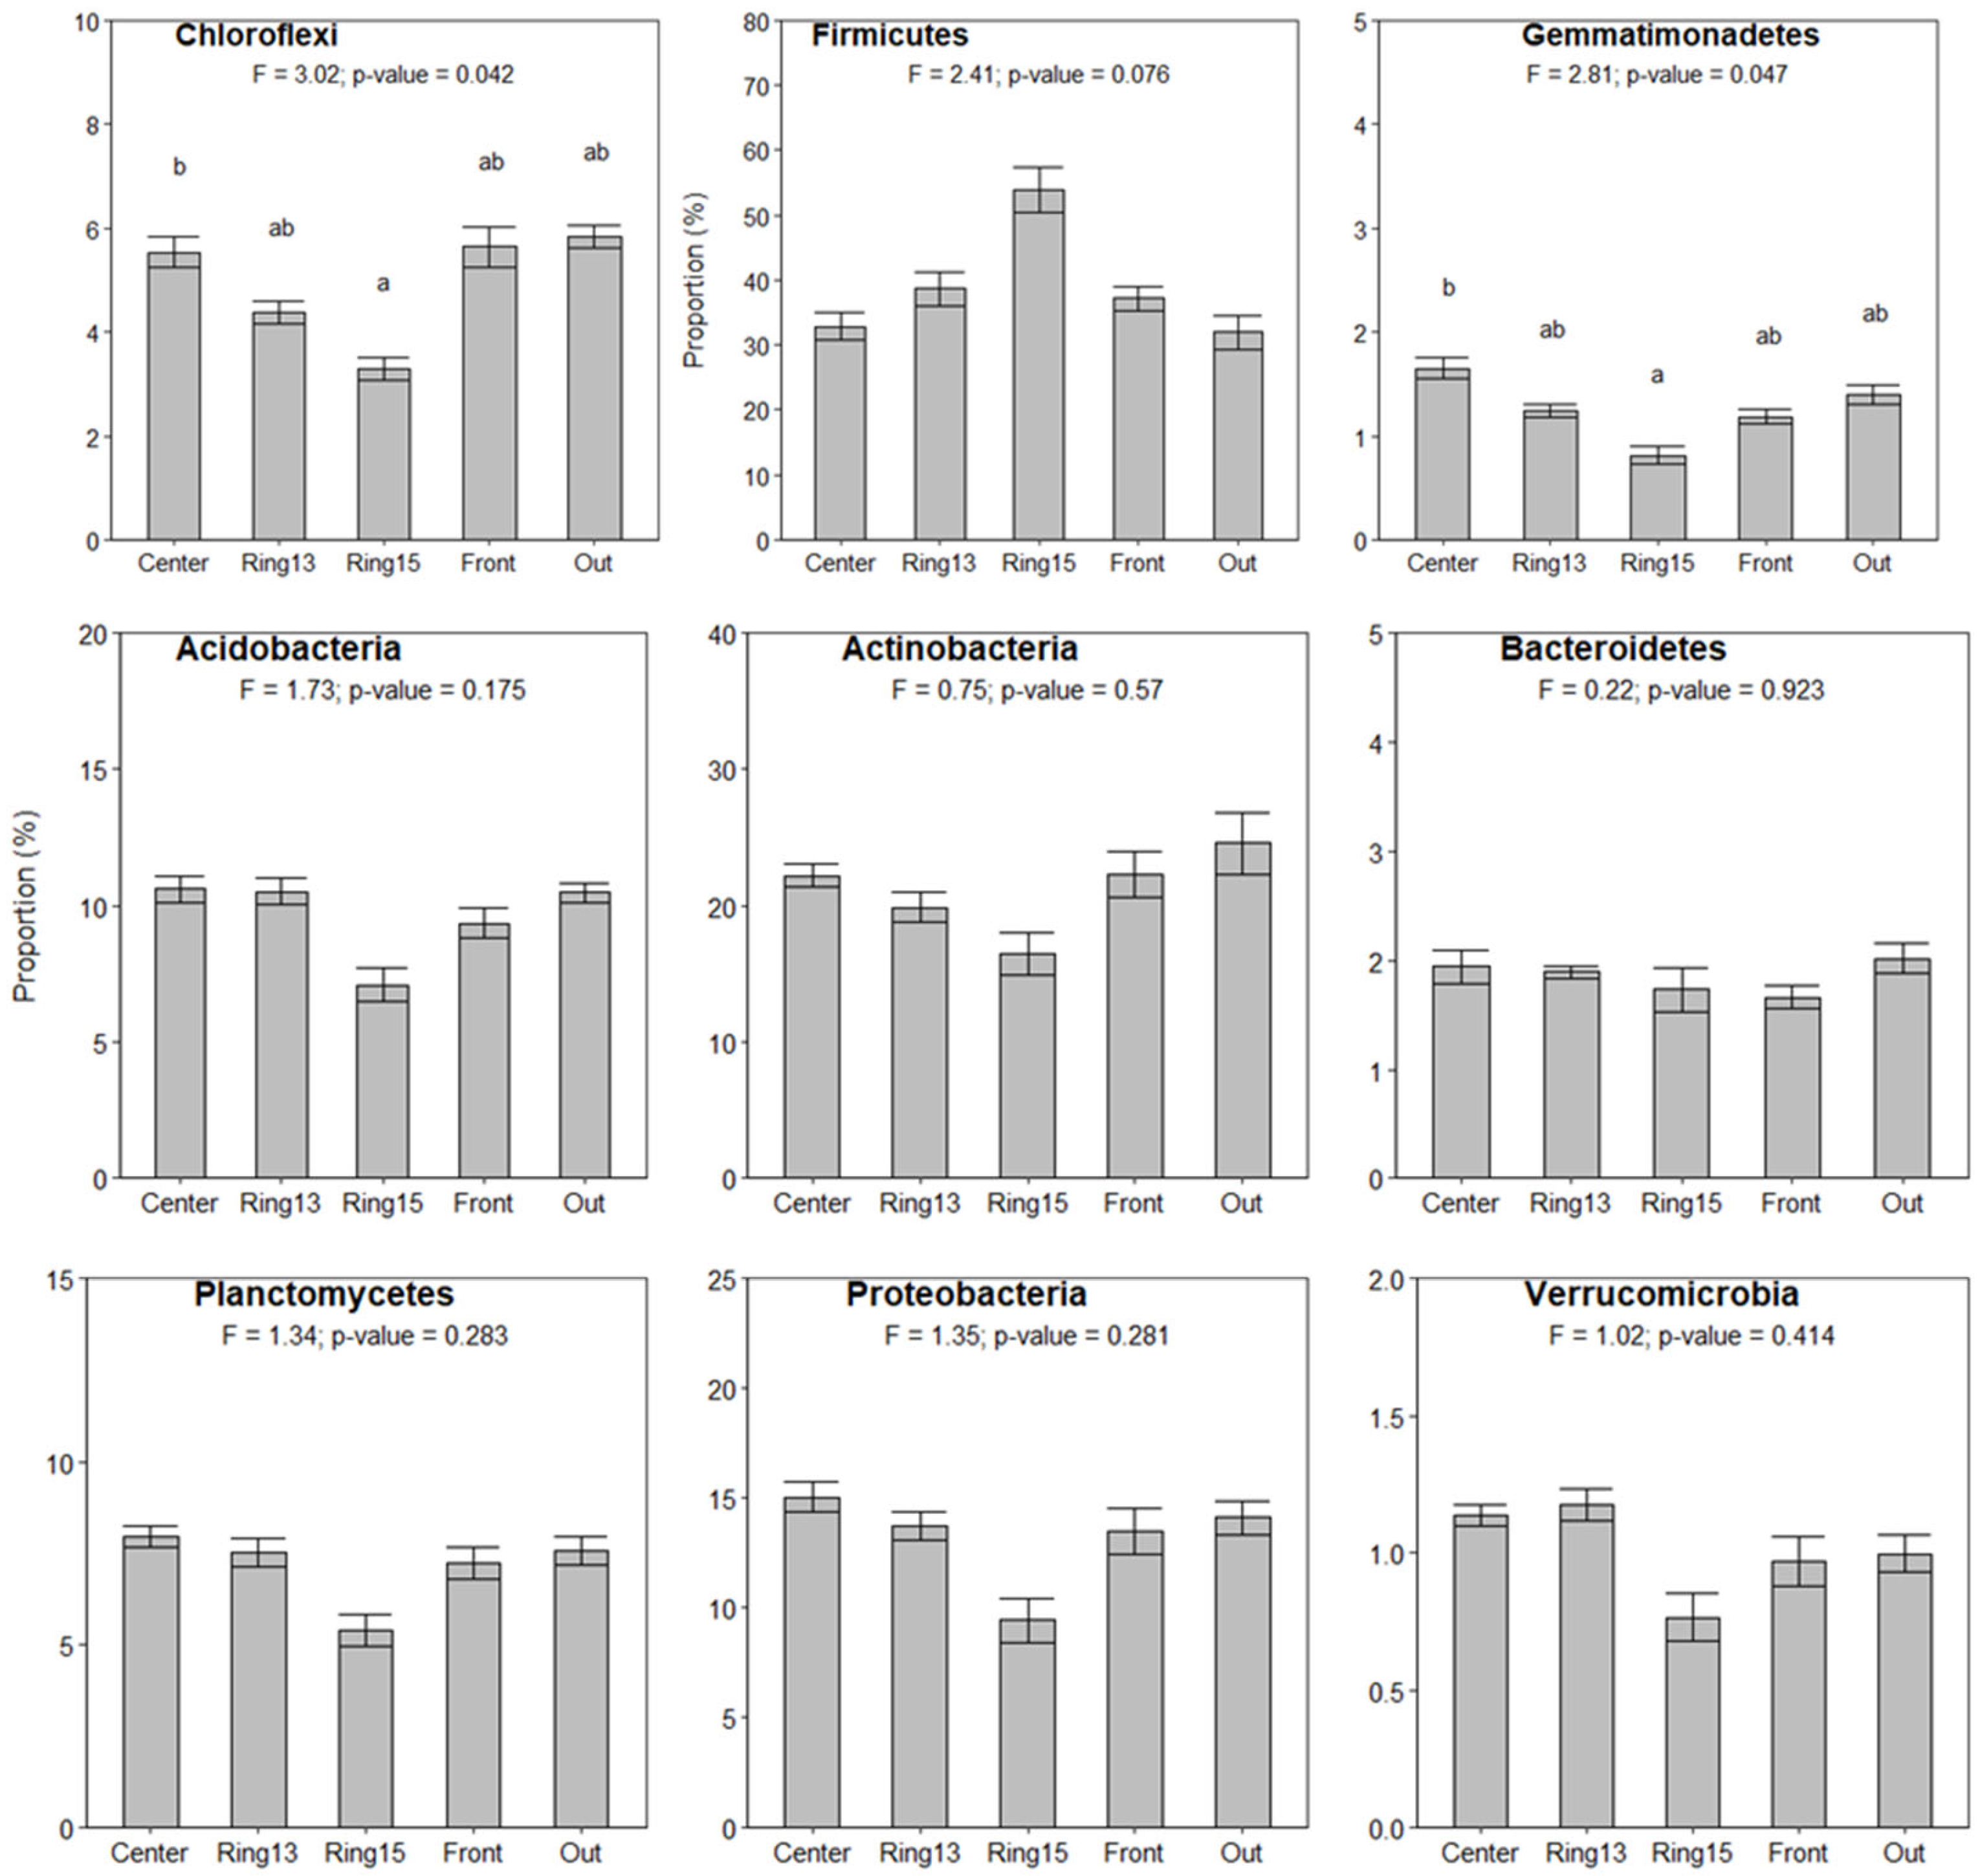
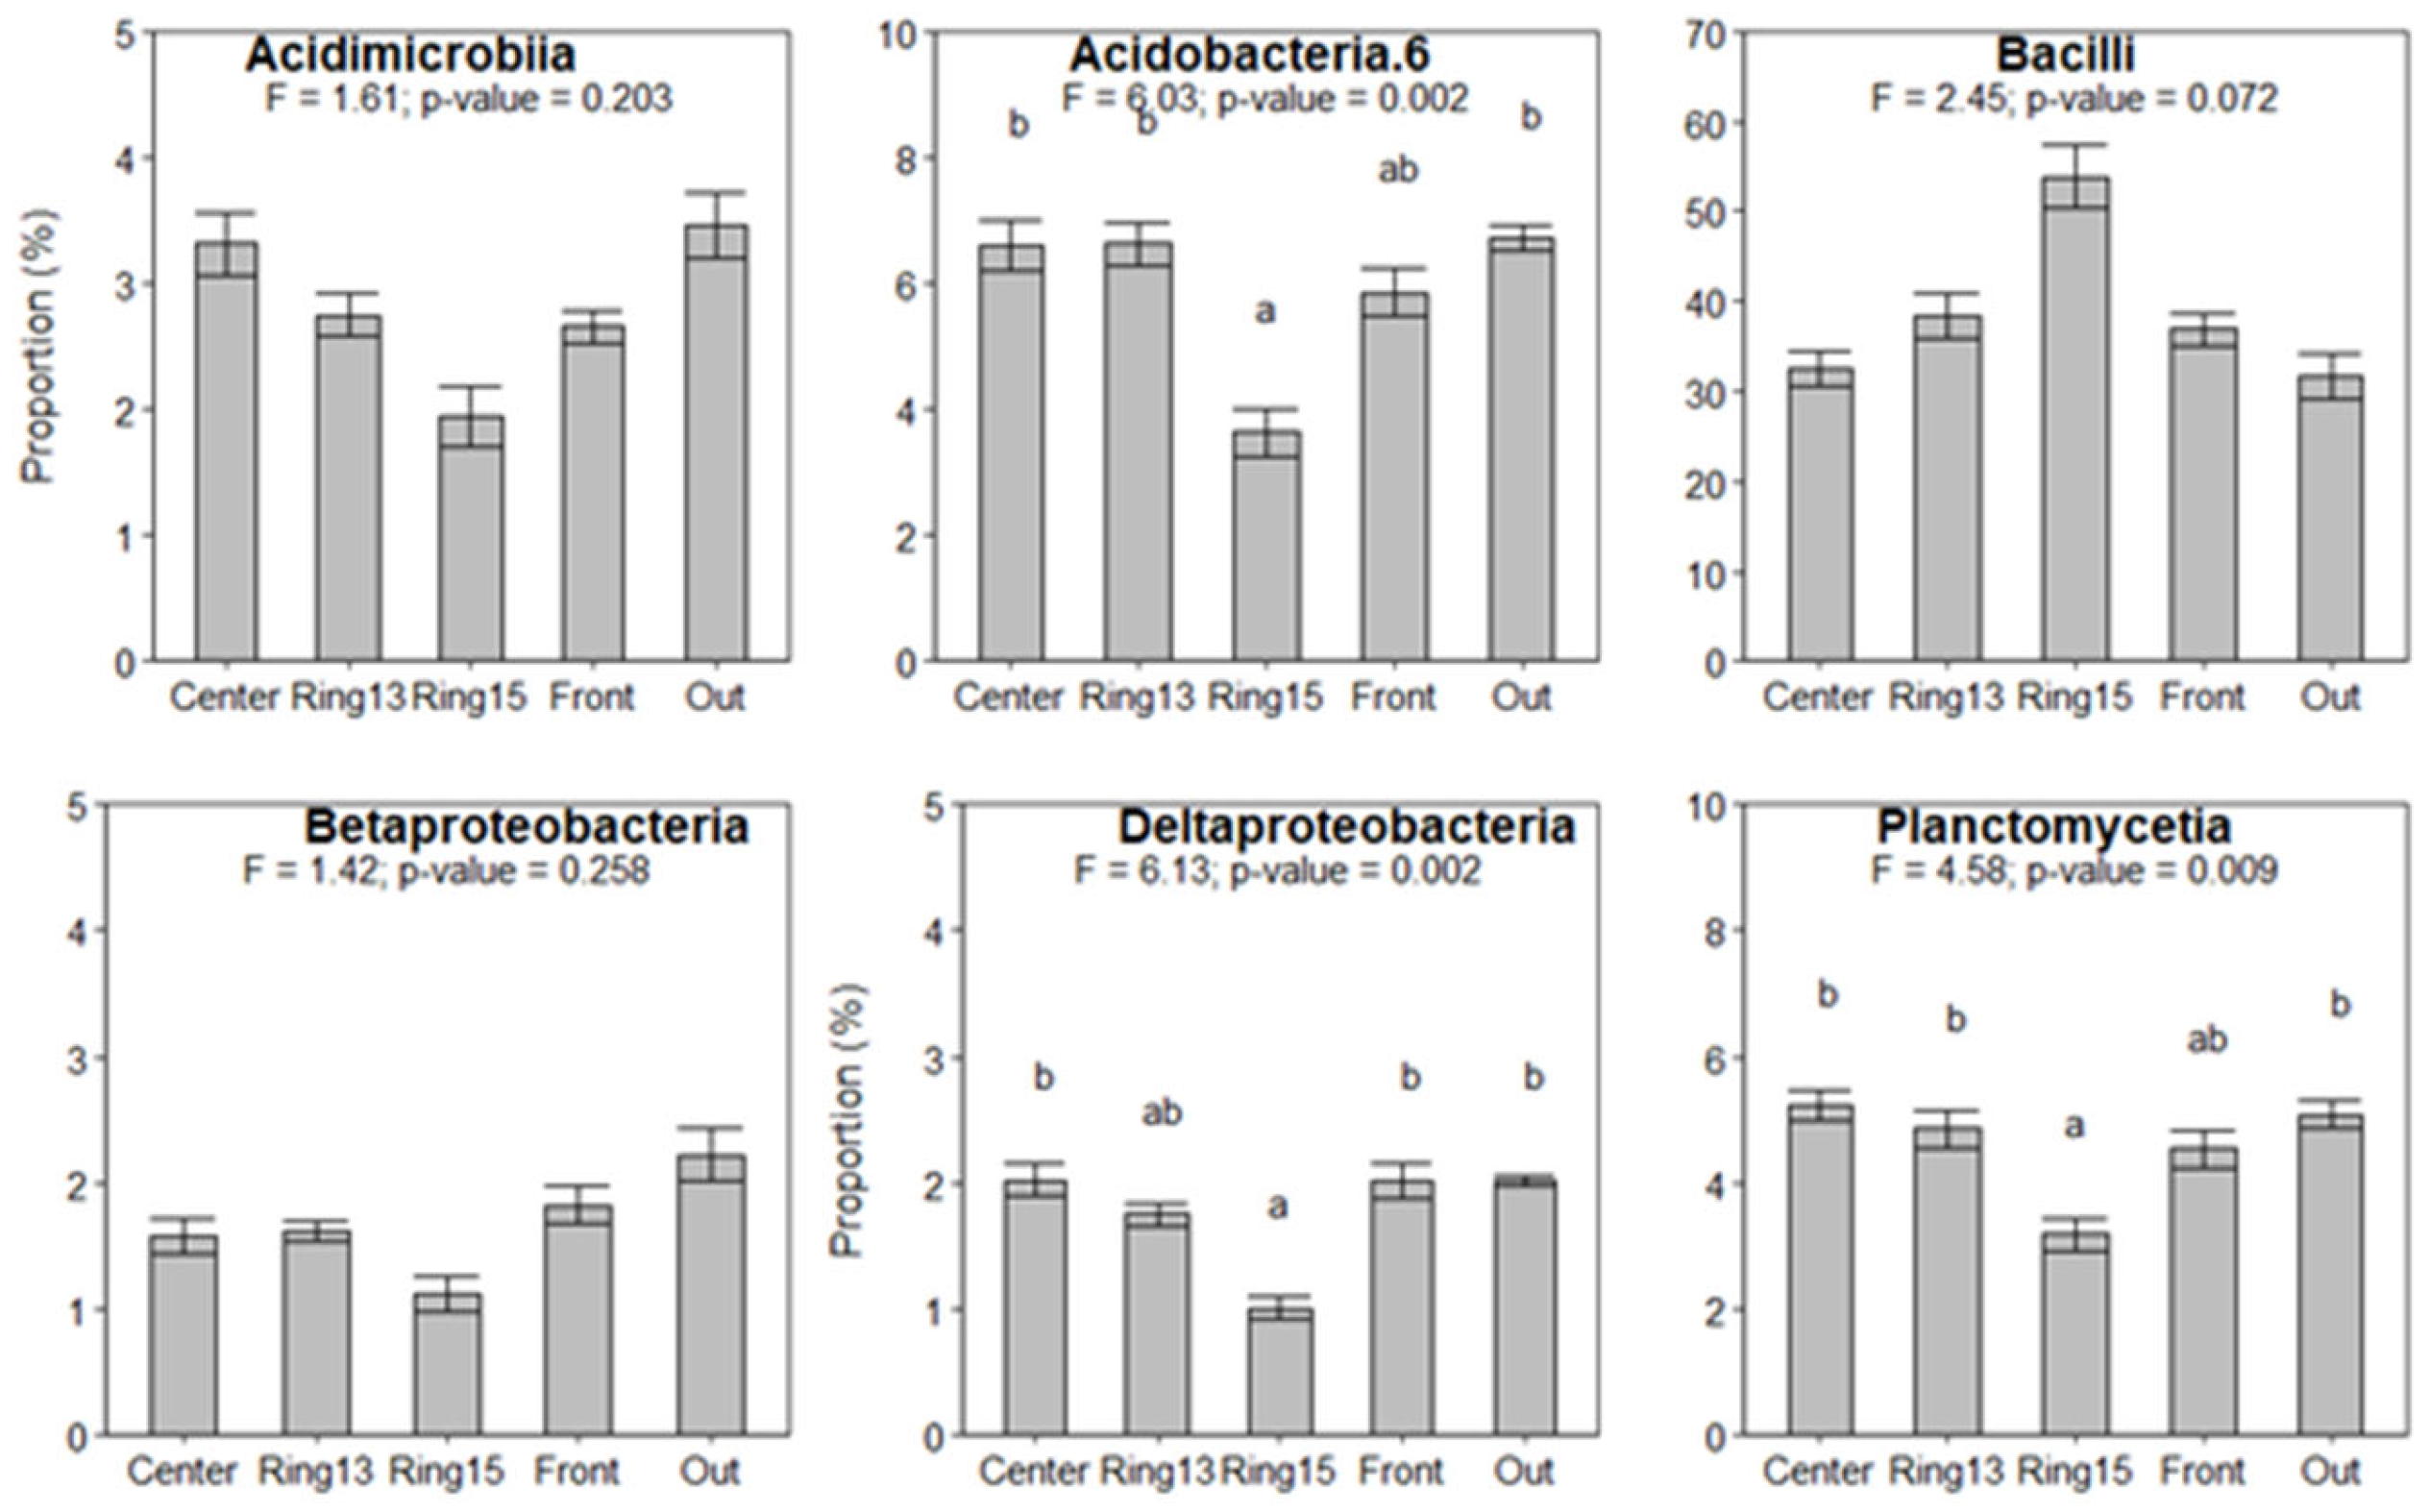
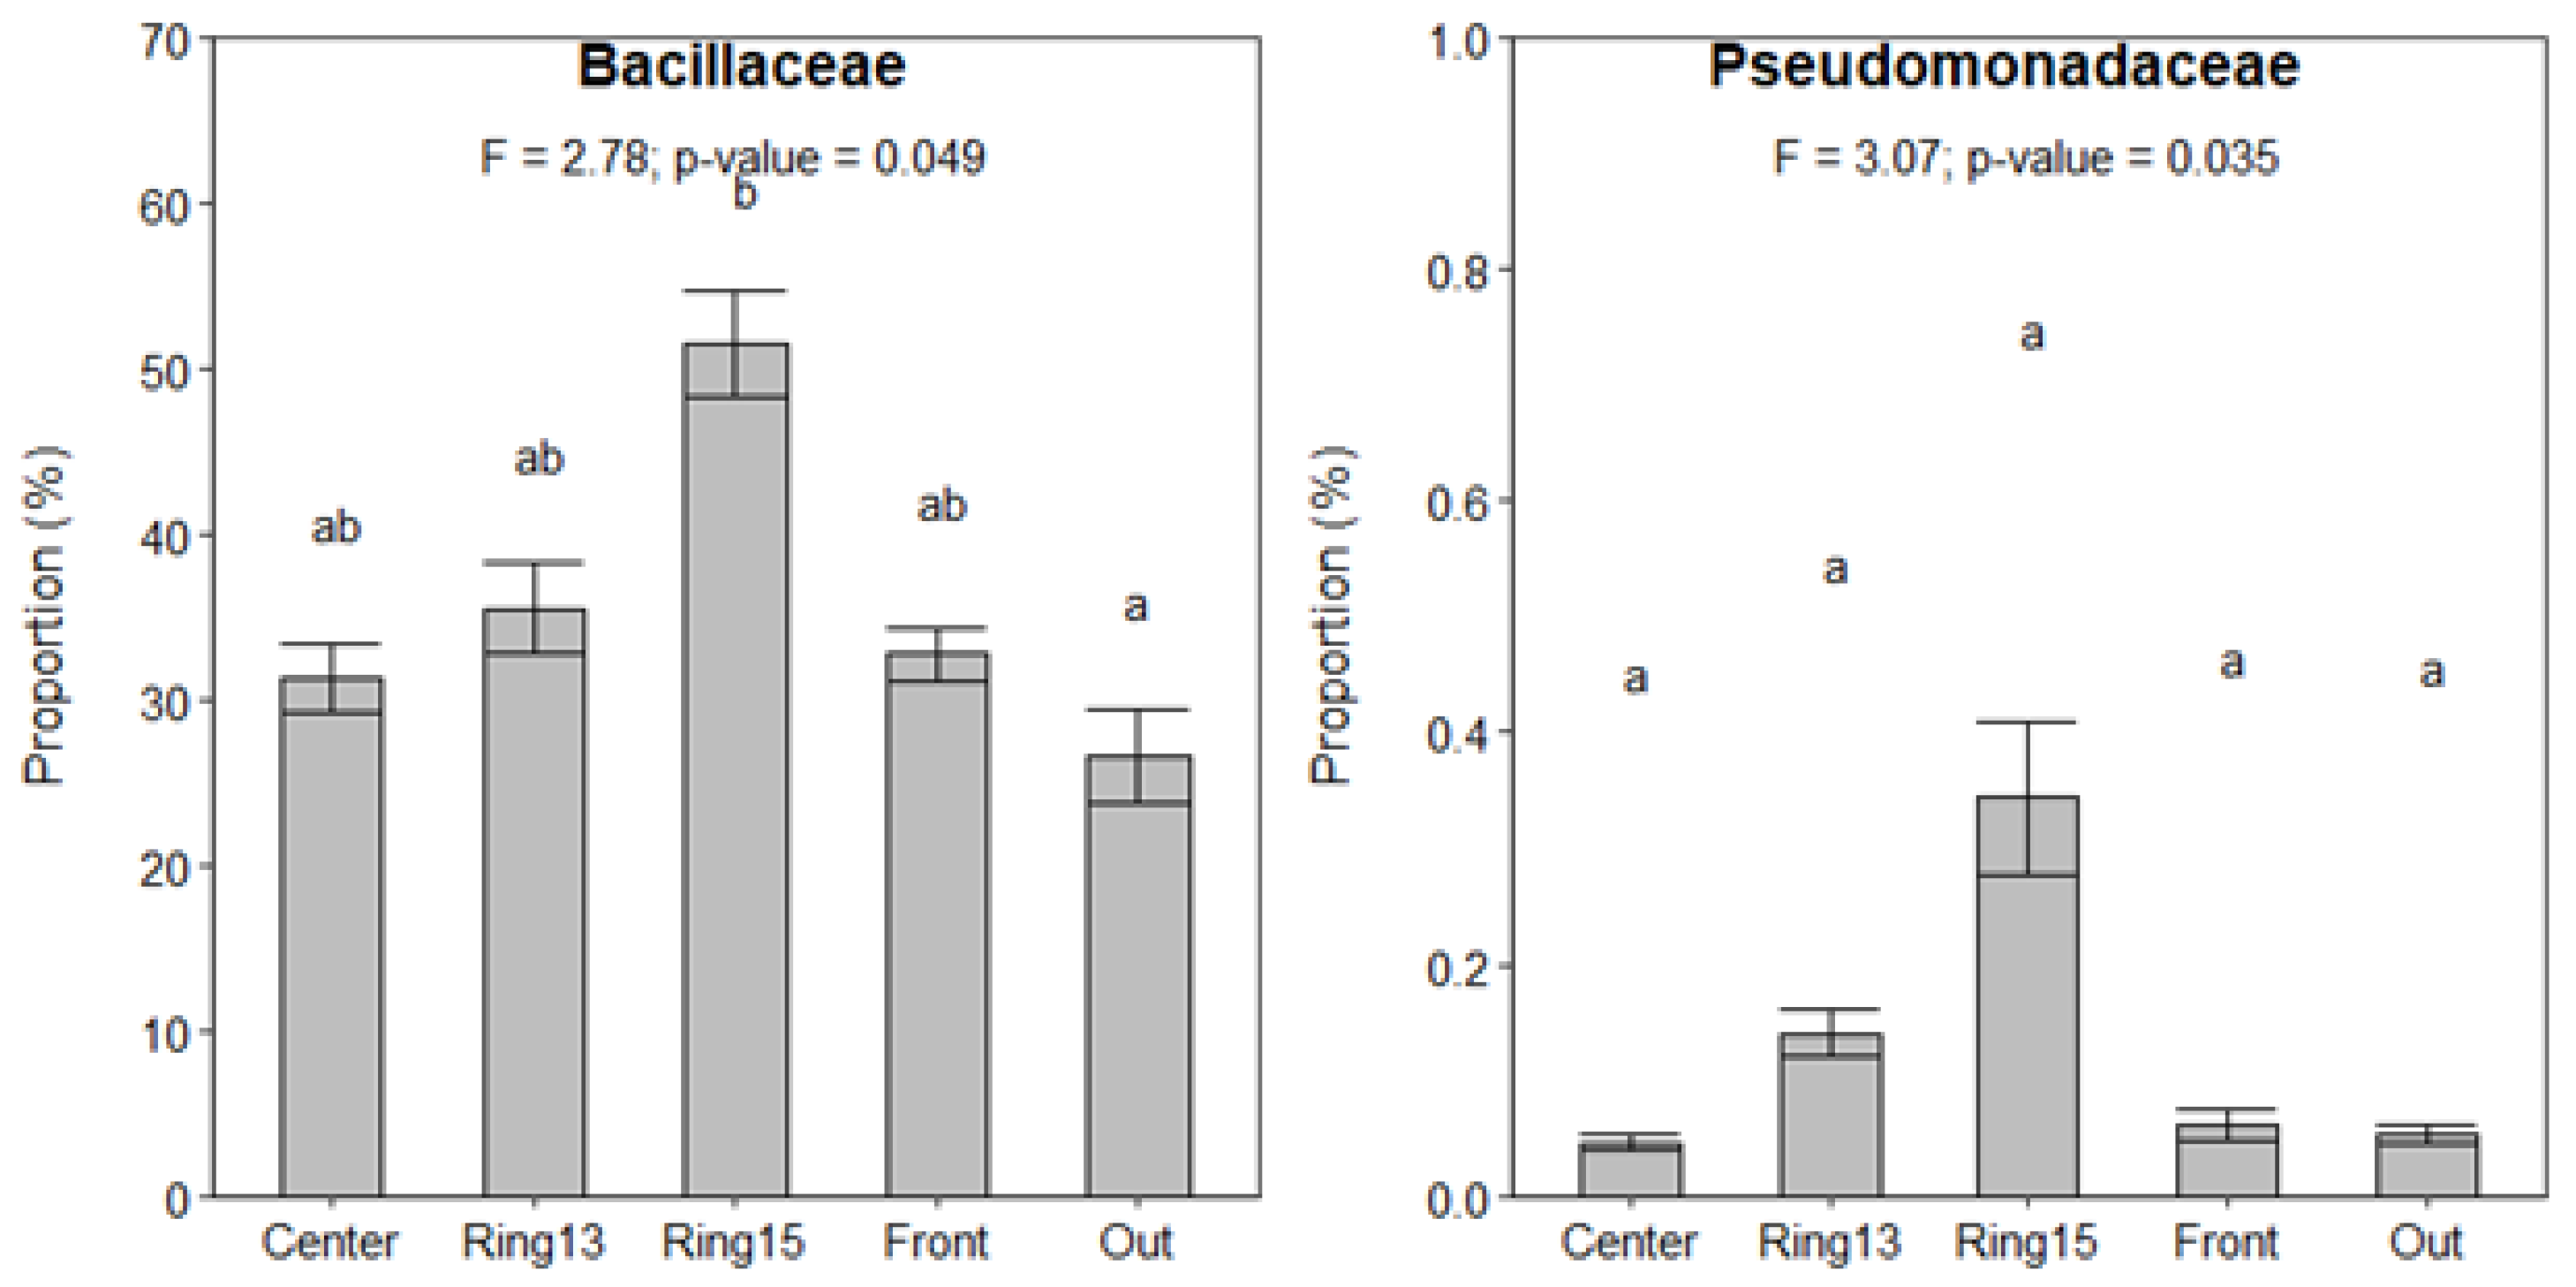
3.2. Bacterial Community Composition in La Bertolina

Sequences that could not be classified into any known bacterial kingdom represented the 0.2% of reads and were categorized as unassigned. The remaining 99.8% of bacterial reads were assigned into 17 different phyla, 62 classes, 88 orders, 108 families and 98 genera. A total of 761 OTUs were not categorized at the family or genus level. The most abundant phyla found across all thirty samples were Firmicutes (38.9% of the mean read abundance), Actinobacteria (21.1%), Proteobacteria (13.2%), Acidobacteria (9.6%) and Planctomycetes (7.1%) (see Figure 3). Less abundant were Chloroflexi (4.9%), Bacteroidetes (1.8%), Gemmatimonadetes (1.3%) and Verrucomicrobia (1%) (see Figure 3). The remaining phyla were joined together into “Other phyla” for further analyses.
Increasing the phylogenetic resolution, the bacterial community was dominated by the class Bacilli within the phylum Firmicutes (38.6%). This class was mainly dominated by the order Bacillales, and it had an OTU classified into the family Bacillaceae and another OTU assigned as Bacillus sp., which accounted for 30.8% and 4.1% of the main reads per sample, respectively.
The class Actinobacteria was dominant within the phylum Actinobacteria (12.4%). The most abundant order was Actinomycetales (12.1%), whereas at the genus level, Mycobacterium (1.9%), Pseudoconardia (1.5%) and Rubrobacter (1%) were the most relevant identified taxa. Within the phylum Proteobacteria, Alphaproteobacteria was the dominant class (8.4%, mainly constituted by Rhizobiales), and the genera Rhodoplanes (1.6%) and Skermanella (1%) were the most abundant identified taxa. The class Acidobacteria-6 (5.9%) was dominant within the phylum Acidobacteria (predominantly the order iii1-15, 5.8%), while the class Planctomycetia (4.6%) was dominant within the phylum Planctomycetes (dominated by the order Gemmatales, 2.4%).

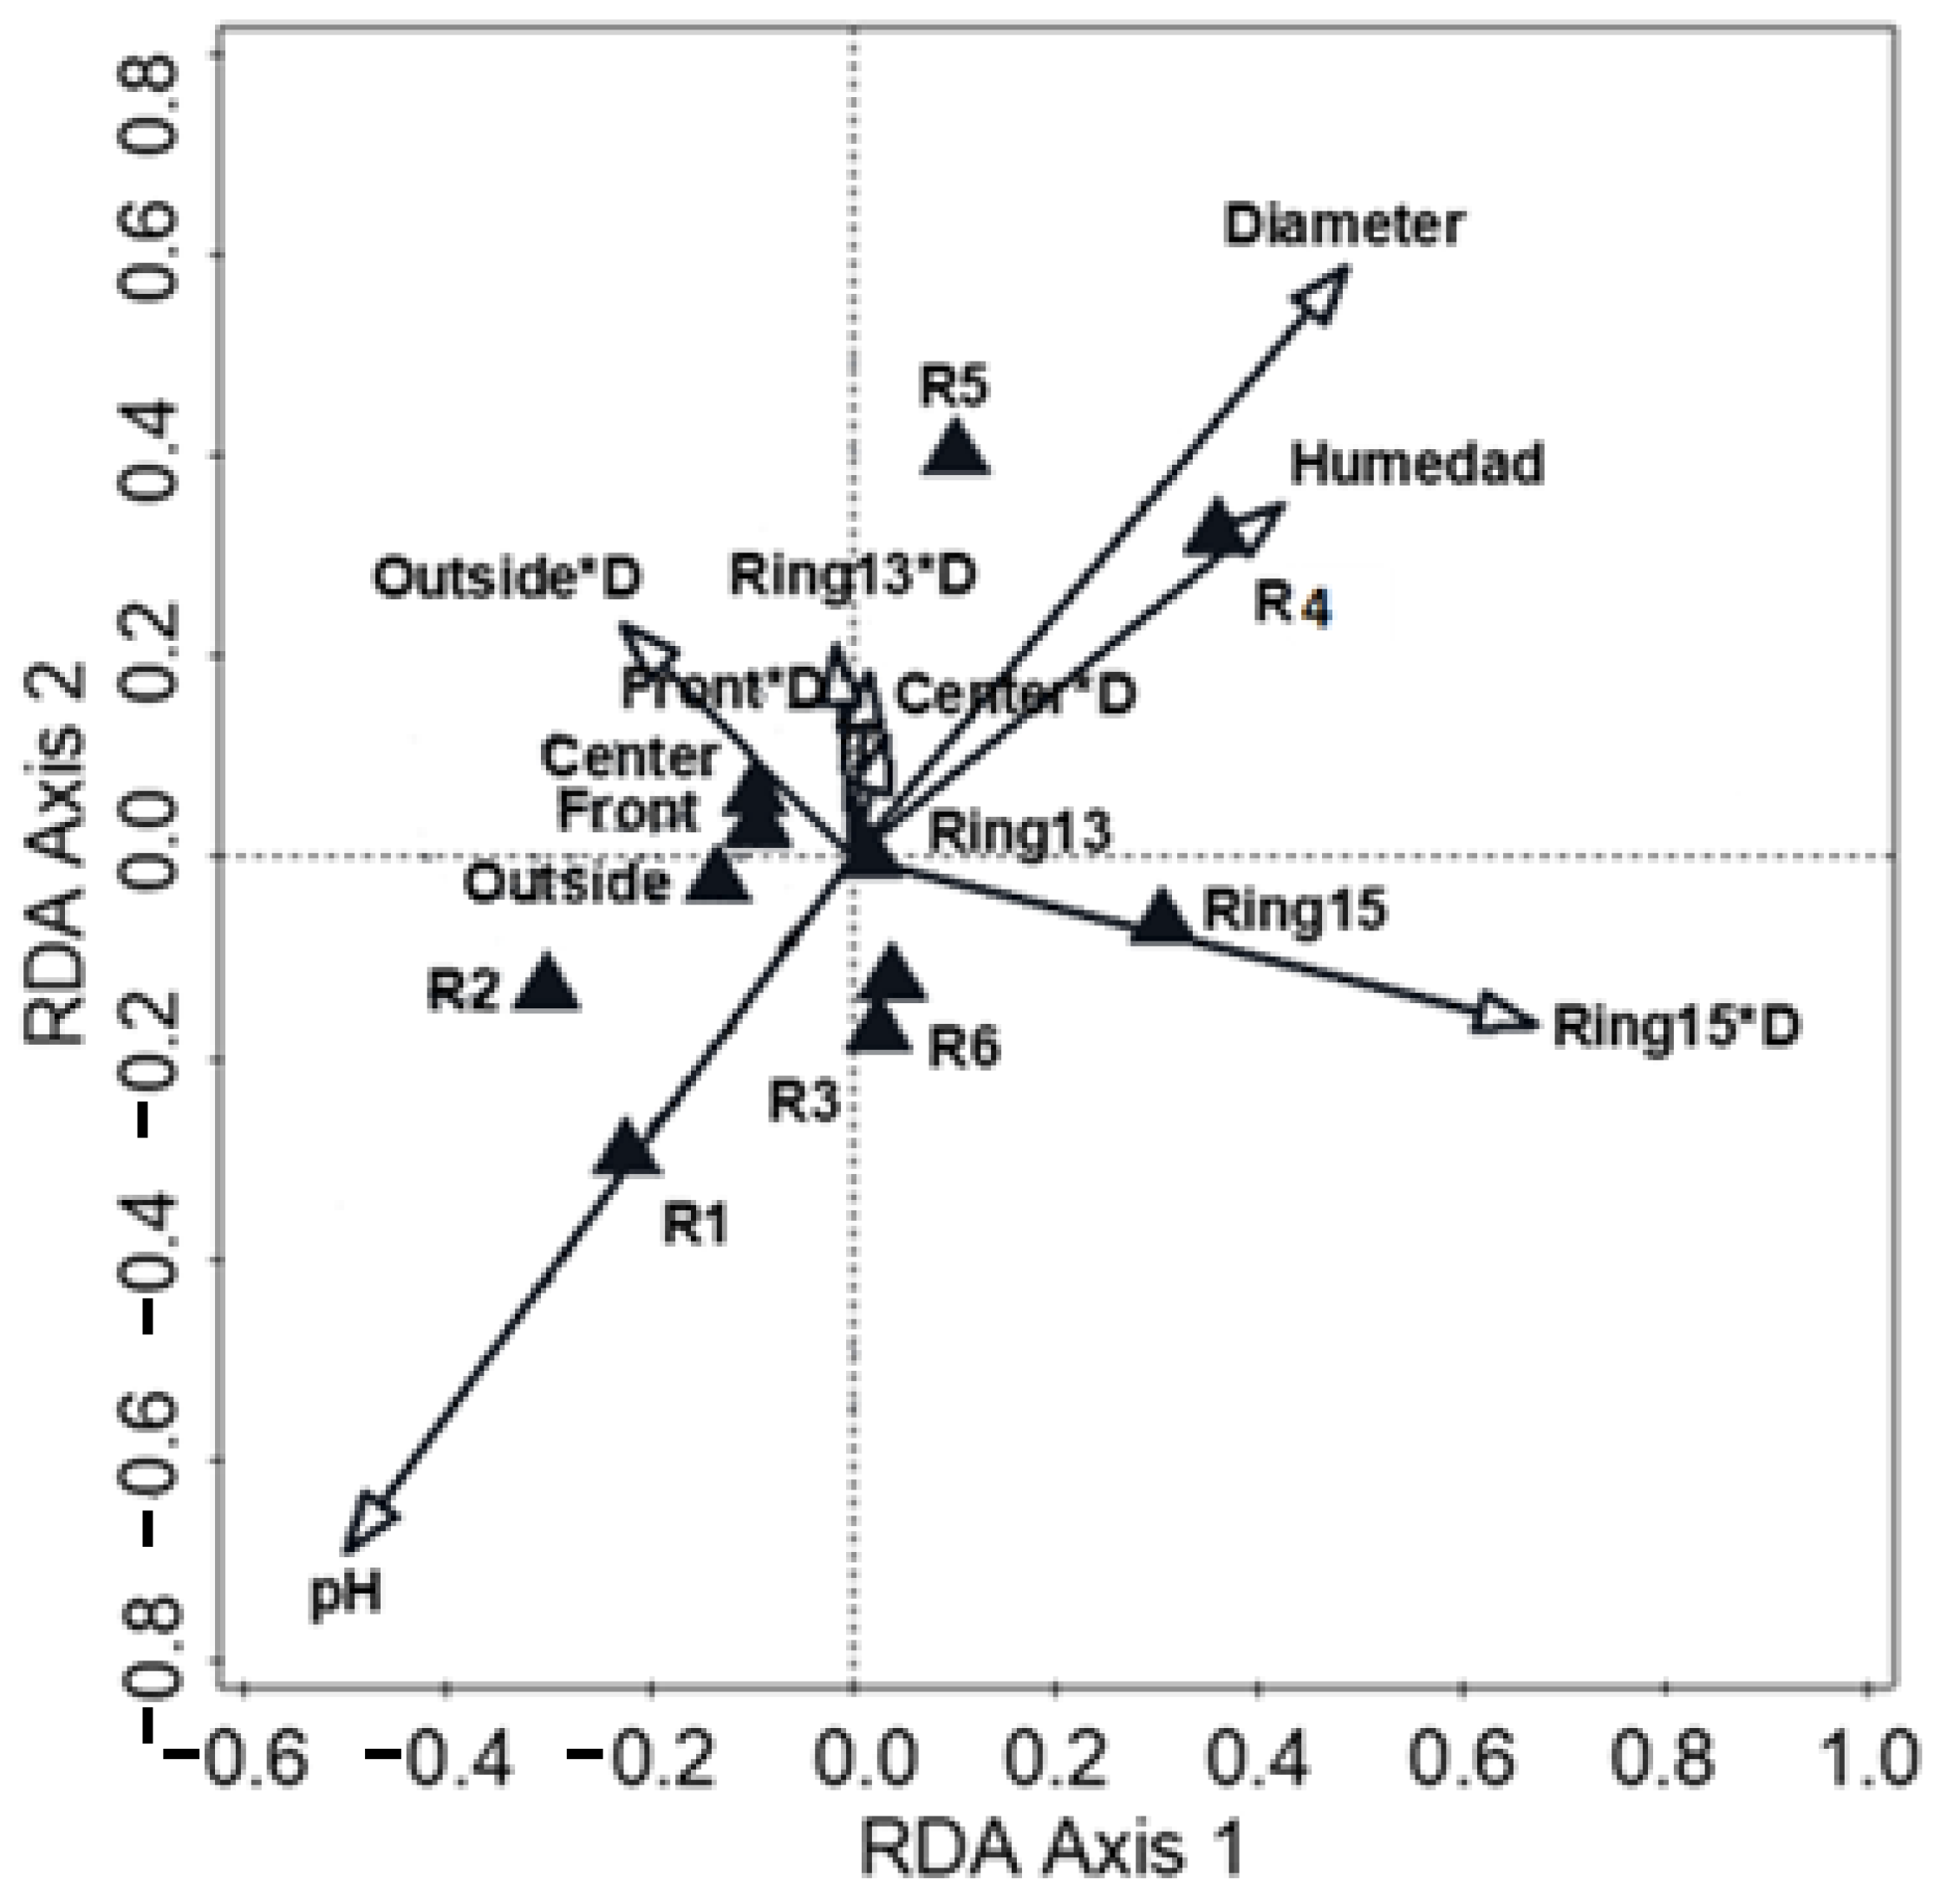
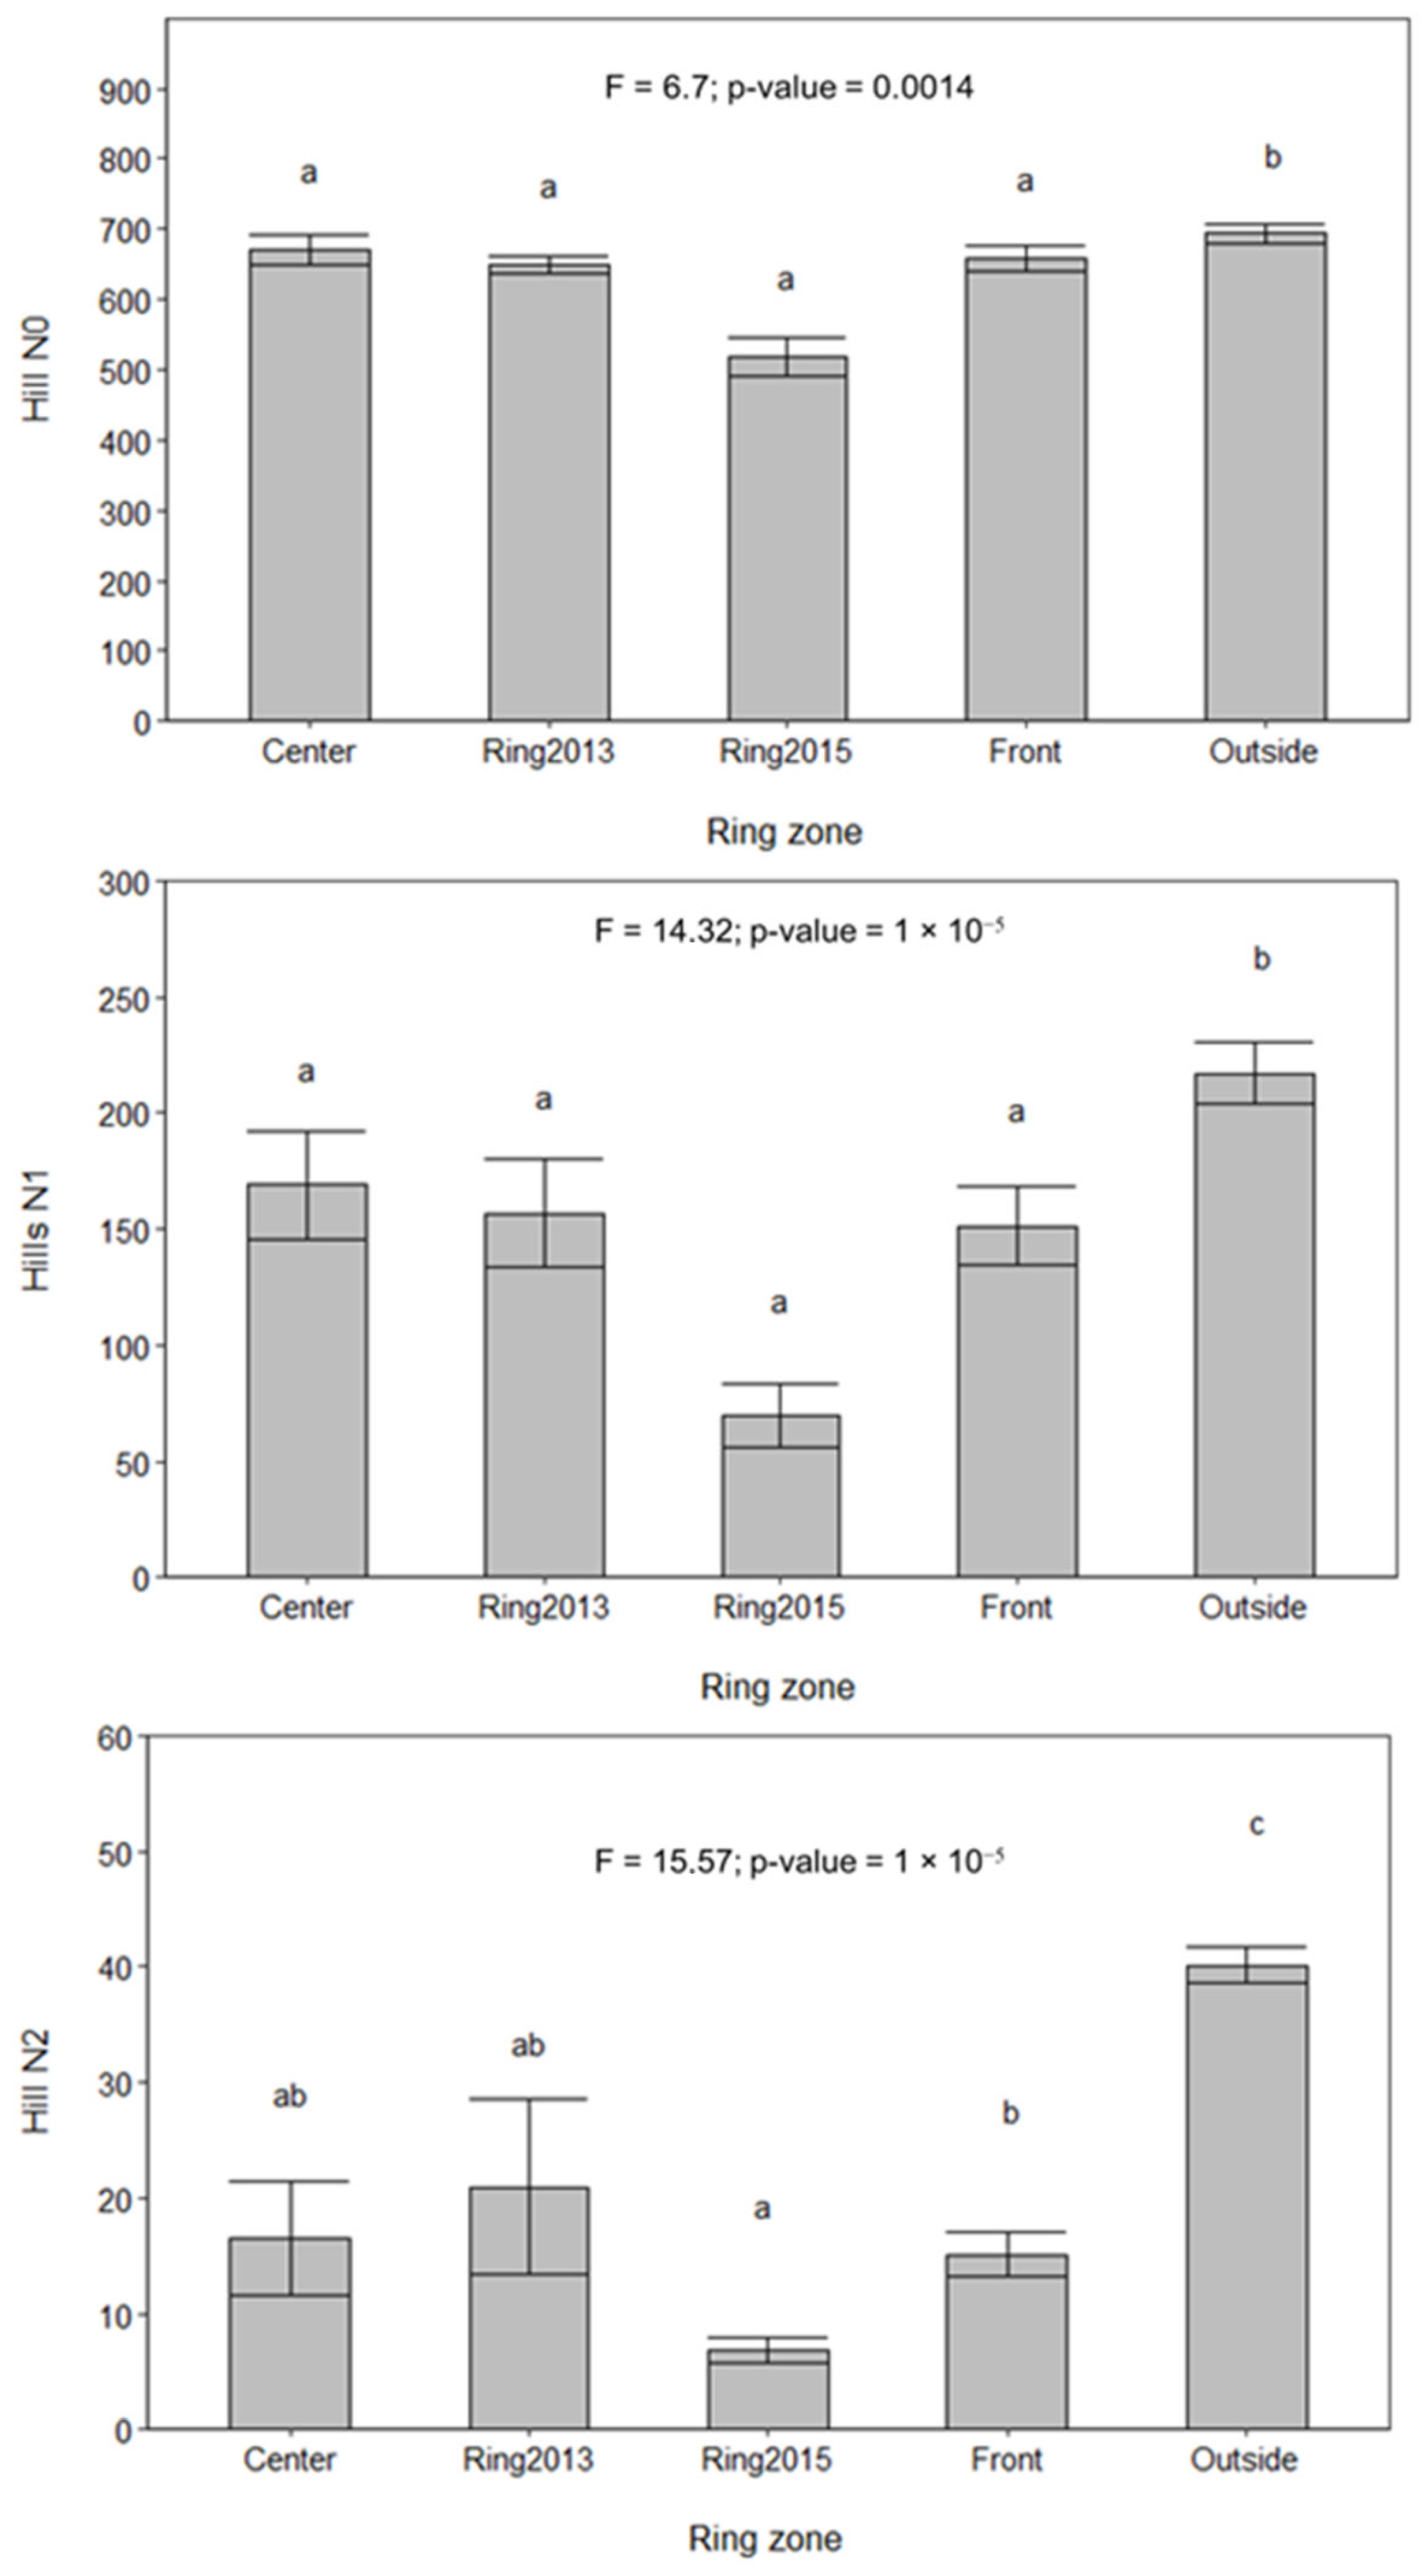
3.3. Changes in Bacterial Community Across Fairy Rings and Environmental Gradients

The composition of the bacterial community showed a gradual differentiation towards the Ring15 zone (Figure 3). Chloroflexi and Gemmatimonadetes were found in lower proportions in this ring zone (5.5%, F = 3.02, p < 0.05; and 0.8%, F = 2.81, p < 0.05; Figure 3). Actinobacteria, Proteobacteria, Acidobacteria and Planctomycetes followed the same trend. By contrast, the most abundant phylum across all fairy rings, Firmicutes, tended to increase even further towards the Ring15 zone (Figure 3).
We also analyzed the bacterial class composition across RZ, and we found a strong differentiation towards the Ring15 zone (Figure 4). Acidobaceria-6 (3.6%; F = 6.03; p < 0.05), Deltaproteobacteria (1%; F = 6.13; p < 0.05) and Planctomycetia (3.2; F = 4.58; p < 0.05) were found with lower abundances in the Ring15 zone compared to the other zones inside and outside the rings, whereas Bacilli within the phylum Firmicutes showed the reverse trend (53.8%; F = 2.45, p = 0.07; Figure 4). The majority of the 108 families identified showed the same decreasing pattern towards the Ring15 zone, with the exceptions of Bacillaceae (51.6%; F = 2.78, p < 0.05) and Pseudomonadaceae (0.3%; F = 3.07, p < 0.05), both higher in the Ring15 zone with respect to the outside of the rings and to all other ring zones, respectively (Figure 5). Among the most abundant identified genera (>0.5% of the total reads), we only found Gemmata, with significant lower abundances in the Ring15 zone compared to the center zone and outside (0.6%; F = 3.5, p < 0.05). Finally, when going down to the OTU level, we found a few taxa associated with the Ring15 zone, all belonging to the genus Bacillus, but without any possible identification at the species level.
The first and second axis of the RDA explained 12.9% and 5.8% of the bacterial community composition variation, respectively (Figure 6). The first axis separated samples from the Ring15 zone, towards the positive end, from those of the other zones, with samples from the outside zone positioned at the negative end of Axis 1 (Figure 6). However, the effect of R15 on compositional distribution was dependent on ring diameter, being strongest in the biggest rings (Figure 6). Furthermore, RDA Axis 1 was negatively correlated with a gradient of OTU richness (Figure 6). Samples were distributed independently of the ring zone on RDA Axis 2, which was related mostly to the pH gradient and secondarily to moisture and to ring diameter (Figure 6). Soil pH ranged between 7.86 in the center zone and 7.98 outside. Soil moisture ranged between 6.5% in the Ring15 zone and 7.5% outside (p > 0.05).
Although no effects from the ring zone were observed in the different soil variables (Table 1), the effects of environmental variables (Table 1) on bacterial community composition were validated by the variability explained by the independent variables included in the RDA analysis, which overall accounted for 57% of the community variation. The interaction RZ × Diameter was the factor explaining most of the variation (7.7%, Table S1), as shown by the first RDA axis, whereas pH and Diameter were associated with the second RDA axis, explaining 6.6% and 6.5% of the total variation, respectively. Moisture was also significantly associated with the second axis, explaining 5.1% of the total variation, although the pH and moisture effects disappeared when considering the RDA conditional term effects (Table S1).
We found significant differences in the Hill’s diversity indices across RZ for a sampling depth of 2035 sequences per sample (Figure 7). All of them showed a reduction in bacterial diversity in the ring-affected zones (center, Ring13, Ring15 and front) compared to the outside of the rings, in particular in the Ring15 zone, where all indices showed their lowest values. In particular, N2 (the inverse of Simpson’s diversity index) showed the strongest difference among zones (Figure 7).

4. Discussion

4.1. Bacterial Community Composition in La Bertolina Grassland

The dominant soil bacterial phyla in la Bertolina were Firmicutes (driven by the class Bacilli), followed by Actinobacteria (driven by Actinobacteria, Figure 3), both included within those nine major phyla found in most of the bacterial 16S rRNA gene libraries generated so far [47]. Contrary to our findings, several studies on grassland, cropland or other soils dominated by grasses revealed a predominance of Acidobacteria, Proteobacteria and Actinobacteria when using both Illumina MiSeq and 454 pyrosequencing of the soil bacterial libraries [48,49,50]. In contrast, Kuramae et al. [51] found similar results to ours when studying a semi-natural chalk grassland after the abandonment of intensive agriculture by using different molecular methodologies, where Firmicutes and Actinobacteria were the most abundant phyla. Lienhard et al. [52] also found an increase in Firmicutes in grasslands under tillage when compared to natural pastures, using a 454 pyrosequencing approach. Similarly, Li et al. [53] found a higher proportion of Firmicutes when increasing the level of degradation in grassland soils. This suggests that the main composition of the community could still be a legacy effect of the previous agricultural use at our study site, which ended about 20 years ago. In fact, the strong impact of agricultural practices on the microbial community composition is known, due to the changes they induce in the physical and chemical characteristics of the soil [54,55], and our results suggest that this influence may act for several years after cessation of cropping.
The predominance of Firmicutes has been related to different stress factors, such as the snow cover during the coldest winter months [56], the drought episodes during summer [57] or agricultural practices such as tillage [52]. This is due to their ability to form endospores, which make bacteria resistant to extreme temperatures and enhance their survival under stress conditions [58]. In particular, OTUs belonging to the order Bacillales were found in our study with the highest relative abundances, and Bacillus (within Firmicutes) was the most abundant taxa identified at the genus level in our study, and it has also been reported to grow at temperatures below 0 °C [59]. Actinobacteria was the second most abundant phyla in our study (Figure 4). Decreasing abundances have been found under tillage management [52], which has been explained by the particular filamentous morphology of Actinobacteria, which confers them a special sensitivity to physical disturbances [28,60].

4.2. Soil Physicochemical Changes Across Fairy Rings

Although our regressions did not reveal any effects on soil physicochemical parameters, it has been shown that fungal degradation of lignocellulose and organic N results in lower pH and enhanced solubilization of nutrients, making nutrients become readily available for plants [28]. Fairy ring fungi have been reported by several authors [61] to acidify the soil beneath the stimulation zone, and the composition of the bacterial community is known to be strongly influenced by this factor [62]. Indeed, our results highlighted soil pH as the second most important factor explaining the variation in the bacterial community composition at the OTU level (Figure 7). However, the fact that pH was not significant when considering the conditional terms effects (Table S1) suggests that other factors affect the variability of the assembly of the ring. In this case, these factors seem to be related to the identity of the ring (Figure 6). On one hand, this could be due to rings being formed by different fungal species, and hence different bacterial communities, or to a time development effect. This cannot be confirmed since no fruiting bodies were found in this experimental field [25]. On the other hand, there is also the possibility that different parts of the grasslands present different pH values due to topography and other abiotic factors, and hence the difference between the pH found and the importance of ring identity. Supporting the latter statement, the soil pH in this calcareous grassland ranged between 7.45 and 8.14, which are values significantly higher than some of those reported for soils in other studies [61]. A high carbonate content in calcareous soils provides strong buffering capacity; making these soils relatively resistant to acidification [63]. This fact may counteract the biochemical effects of the microbial activity beneath the stimulation zone.
Despite the fact that one of the main actions of the fungi in the literature is the increase in the hydrophobicity of the soil, no differences in the bacterial community due to the soil moisture were found, contrary to the findings of [64].

4.3. Effects of the Fairy Ring Fungi on the Soil Bacterial Diversity

Although culture techniques of bacterial communities have provided essential awareness about fairy ring soil dynamics [3,15], NGS techniques allow the scientific community to deepen the knowledge of microbial diversity across these biotic formations. In contrast to our results, Yang et al. [16] found an increase in Chao1 and Shannon’s bacterial diversity indices inside the fairy rings of Agaricus gennadii. However, a reduction in bacterial richness was detected beneath Tricholoma matsutake [33,49], although for the Shannon’s diversity index converse results have been reported. While Oh [33] and colleagues found a decrease in soil dominated by T. matsutake, Kim et al. [49] found an increase beneath the ring. It is expected that the fungal front passage modifies the bacterial community structure by favoring a few selected taxa [3]. We found strong differences in Hill’s N2, which is more sensitive to the changes in dominant species due to having an exponential form. Meanwhile, the Shannon index, which is the base of Hill’s N1, has a log function, which makes it sensitive to changes in rare taxa [65]. We found an increase in taxa belonging to Bacilli, the dominant bacterial group present at the study site (Figure 5). Hill’s N2, based on Simpson’s diversity index, showed therefore the strongest reduction inside the rings, in particular in the Ring15 zone, where most abundant taxa within bacterial populations were found, emphasizing their uneven distribution (Figure 7).

4.4. Changes in the Soil Bacterial Community Composition Across Fairy Rings

The reduction found in our study in the bacterial OTU richness in the stimulation zone or Ring15 was associated with the increase in the relative abundances of taxa belonging to Firmicutes (Figure 2, Figure 3 and Figure 4). In our study, biotic interactions and physicochemical changes produced by the advance of the fairy ring fungi seem to have triggered the unusual proliferation of particular taxa at our study site [23]. The increased population growth rates of the now super-abundant species often take a time to return to their expected values for a stable population; this fast recovery contrasts with the results reported by some authors, who found that bacterial communities do not recover even several years after a disturbance [66,67]. By contrast, our results show that it can be less than two years, as we found a trend toward recovery in the Ring13 zone (Figure 2, Figure 3 and Figure 4). Intrinsic factors of bacterial population, together with the cessation of the disturbances caused by the fairy ring fungus, soon return the community nearly to their initial composition, as seen in Figure 4 for the classes Planctomycetotia, Acidobacteria 6 and Deltaproteobacteria, and also in the RDA (Figure 6).
Our results reinforce the idea that the abundances of the taxa belonging to the Firmicutes may increase in response to decomposition of organic matter by fairy ring fungi [68]. According to the copiotroph/oligotroph ecological division of soil bacteria [69], changes in nutrient availability are expected to translate into changes in the proportion of the different strategists. The high availability of nutrients in the soil beneath Ring15, or the stimulation zone, is expected to favor copiotrophic, fast-growing bacterial taxa, while reducing the abundances of the oligotroph, slow-growing taxa [69,70]. The phylum Firmicutes is commonly included into copiotrophic groups that grow fast under high availability of nutrients [71]. Although a similar increase in this phylum was found in T. matsutake fairy rings [33], previous studies on Agaricus species in grassland soils showed inconclusive results [15,16]. Moreover, experiments have shown a decrease in Gram + bacteria in deceased rhizosphere soil [72]. This would align with our observed increase in Firmicutes within the lush zone of the ring.
Similar to results reported by [15], Pseudomonadaceae also peaked in the Ring15 zone (Figure 5). Several taxa within this family are found in high relative abundances, competing successfully with other microbes in nutrient-rich substrates [73,74]. In the literature, they have shown to adhere to soil particles, roots and fungal hyphae, having a beneficial role in mycorrhizal establishment and plant growth [39,73,75]. Furthermore, species within the genus Pseudomonas have been found to enhance the yield of saprotrophic fungi cultures [76]. The visible enhancement of plant growth could thus be a result not only of the enhanced availability of nutrients by the fairy ring fungi, but also of a complex network of synergies, including bacterial taxa that could act as plant growth-promoting rhizobacteria.

5. Conclusions

In conclusion, the soil bacterial community in La Bertolina was dominated by the phylum Firmicutes, which increased towards the Ring15 zone of the fairy rings, where all bacterial diversity indices simultaneously decreased. These changes were accompanied by a reduction in most of the other taxa, depicting a case of super-abundance of a few species. Pseudomonadaceae also peaked in the stimulation zone, reaffirming their ability to grow fast under the high availability of nutrients, which is assumed to be related to fungal decomposition. The recovery of bacterial diversity and composition towards the center of the ring suggests a strong resilience of the microbial community in this grassland after the biotic perturbation caused by the fairy ring fungi, particularly when compared to our own results for fungal communities in this grassland [25,32]. The main limitation of both the previous and this study is the absence of the basidiocarp, impeding the identification of the fairy ring-forming fungi. Furthermore, another limitation is that, similar to most of the studies published, this study did not take into account the temporal dynamics of the fairy rings. We did not find an influence of the fairy rings in soil physicochemical parameters but, in a recent publication in the same zone [31], we found that K plays a key role. Further studies are needed to unravel the relationships between above- and belowground communities in grassland pastures, considering fairy ring fungi as important modulators of vegetation and soil bacterial diversity.

Supplementary Materials

The following supporting information can be downloaded at: https://www.mdpi.com/article/10.3390/d17050322/s1, Table S1: Simple and conditional term effects of the RDA analysis. “Explained variance (%)” shows the percentage of variability explained by each variable, including size, zone and interactions between them.

Author Contributions

T.M., L.S.E. and M.I. carried out the experiment. T.M. wrote the manuscript with support from M.I., A.R., L.S.E., J.M.-C. and M.-T.S., A.R. helped with the coding. M.-T.S. obtained the funding, coordinated the projects and supervised the work. All authors have read and agreed to the published version of the manuscript.

Funding

This study was developed within the projects BIOGEI (CGL 201349142-C2-1-R) and CAPAS (CGL 2010-22378-C03-01), funded by the Spanish Science Foundation (FECYT) together with the FPU program (FPU12/05849), run by the Spanish Ministry of Education. Funding from the project IMAGINE (CGL 2017-85490-R) together with the IF program (PRE2018-086312) allowed the completion of this work.

Institutional Review Board Statement

Not applicable.

Data Availability Statement

Data are available under reasonable request.

Acknowledgments

We thank the owners of La Bertolina, Helena Sarri, for their helpfulness in the field work. We are grateful to AllGenetics, where all the metabarcoding analyses were conducted. We acknowledge Haifa Debouk for helping with data processing. We acknowledge Christian Mestre for the drone image processing.

Conflicts of Interest

The authors declare no conflicts of interest.

Abbreviations

The following abbreviations are used in this manuscript:
OTUOperational Taxonomic Unit
RZRing Zone
LSULivestock Unit
LMELinear Mixed Effect Model

References

  1. Blair, J.; Nippert, J.; Briggs, J. Grassland Ecology. In Ecology and the Environment; Monson, R.K., Ed.; Springer: New York, NY, USA, 2014; pp. 389–423. ISBN 978-1-4614-7500-2. [Google Scholar]
  2. Rodríguez, A.; de Lamo, X.; Sebastià, M.-T. Interactions between Global Change Components Drive Plant Species Richness Patterns Within Communities in Mountain Grasslands Independently of Topography. J. Veg. Sci. 2018, 29, 1029–1039. [Google Scholar] [CrossRef]
  3. Bonanomi, G.; Mingo, A.; Incerti, G.; Mazzoleni, S.; Allegrezza, M. Fairy Rings Caused by a Killer Fungus Foster Plant Diversity in Species-Rich Grassland. J. Veg. Sci. 2012, 23, 236–248. [Google Scholar] [CrossRef]
  4. Bürgi, M.; Silbernagel, J.; Wu, J.; Kienast, F. Linking Ecosystem Services with Landscape History. Landsc. Ecol. 2015, 30, 11–20. [Google Scholar] [CrossRef]
  5. Wilson, J.B.; Peet, R.K.; Dengler, J.; Pärtel, M. Plant Species Richness: The World Records. J. Veg. Sci. 2012, 23, 796–802. [Google Scholar] [CrossRef]
  6. Schirpke, U.; Kohler, M.; Leitinger, G.; Fontana, V.; Tasser, E.; Tappeiner, U. Future Impacts of Changing Land-Use and Climate on Ecosystem Services of Mountain Grassland and Their Resilience. Ecosyst. Serv. 2017, 26, 79–94. [Google Scholar] [CrossRef]
  7. Maron, P.-A.; Sarr, A.; Kaisermann, A.; Lévêque, J.; Mathieu, O.; Guigue, J.; Karimi, B.; Bernard, L.; Dequiedt, S.; Terrat, S.; et al. High Microbial Diversity Promotes Soil Ecosystem Functioning. Appl. Environ. Microbiol. 2018, 84, e02738-17. [Google Scholar] [CrossRef] [PubMed]
  8. Bonanomi, G.; Incerti, G.; Allegrezza, M. Assessing the Impact of Land Abandonment, Nitrogen Enrichment and Fairy-Ring Fungi on Plant Diversity of Mediterranean Grasslands. Biodivers. Conserv. 2013, 22, 2285–2304. [Google Scholar] [CrossRef]
  9. Van der Wal, A.; Geydan, T.D.; Kuyper, T.W.; De Boer, W. A Thready Affair: Linking Fungal Diversity and Community Dynamics to Terrestrial Decomposition Processes. FEMS Microbiol. Rev. 2013, 37, 477–494. [Google Scholar] [CrossRef]
  10. Shantz, H.L.; Piemeisel, R.L. Fungus Fairy Rings in Eastern Colorado and Their Effect on Vegetation. J. Agric. Res. 1917, 11, 191–245. [Google Scholar]
  11. Dernoeden, P.H. About Fairy Rings and Their Management. Int. Newsl. Curr. Dev. Turfgrass 2002, 10, 1–5. [Google Scholar]
  12. Edwards, P.J. Effects of the Fairy Ring Fungus Agaricus Arvensis on Nutrient Availability in Grassland. New Phytol. 1988, 110, 377–381. [Google Scholar] [CrossRef]
  13. Xu, X.; Ouyang, H.; Cao, G.; Richter, A.; Wanek, W.; Kuzyakov, Y. Dominant Plant Species Shift Their Nitrogen Uptake Patterns in Response to Nutrient Enrichment Caused by a Fungal Fairy in an Alpine Meadow. Plant Soil 2011, 341, 495–504. [Google Scholar] [CrossRef]
  14. Yang, C.; Li, J.; Zhang, F.; Liu, N.; Zhang, Y. The Optimal Redfield N: P Ratio Caused by Fairy Ring Fungi Stimulates Plant Productivity in the Temperate Steppe of China. Fungal Ecol. 2018, 34, 91–98. [Google Scholar] [CrossRef]
  15. Caesar-TonThat, T.C.; Espeland, E.; Caesar, A.J.; Sainju, U.M.; Lartey, R.T.; Gaskin, J.F. Effects of Agaricus Lilaceps Fairy Rings on Soil Aggregation and Microbial Community Structure in Relation to Growth Stimulation of Western Wheatgrass (Pascopyrum smithii) in Eastern Montana Rangeland. Microb. Ecol. 2013, 66, 120–131. [Google Scholar] [CrossRef] [PubMed]
  16. Yang, C.; Zhang, F.; Liu, N.; Hu, J.; Zhang, Y. Changes in Soil Bacterial Communities in Response to the Fairy Ring Fungus Agaricus Gennadii in the Temperate Steppes of China. Pedobiol.-J. Soil Ecol. 2018, 69, 34–40. [Google Scholar] [CrossRef]
  17. Vaario, L.; Fritze, H.; Spetz, P.; Heinonsalo, J.; Hanajík, P.; Pennanen, T. Tricholoma matsutake Dominates Diverse Microbial Communities in Different Forest Soils. Appl. Environ. Microbiol. 2011, 77, 8523–8531. [Google Scholar] [CrossRef]
  18. Ohara, H.; Hamada, M. Disappearance of Bacteria from the Zone of Active Mycorrhizas in Tricholoma matsutake (S. Ito et Imai) Singer. Nature 1967, 213, 528–529. [Google Scholar] [CrossRef]
  19. Wang, J.T.; Zheng, Y.M.; Hu, H.W.; Zhang, L.M.; Li, J.; He, J.Z. Soil pH Determines the Alpha Diversity but Not Beta Diversity of Soil Fungal Community along Altitude in a Typical Tibetan Forest Ecosystem. J. Soils Sediments 2015, 15, 1224–1232. [Google Scholar] [CrossRef]
  20. Miller, G.L.; Grand, L.F.; Tredway, L.P. Identification and Distribution of Fungi Associated with Fairy Rings on Golf Putting Greens. Plant Dis. 2011, 95, 1131–1138. [Google Scholar] [CrossRef]
  21. Simberloff, D.; Martin, J.L.; Genovesi, P.; Maris, V.; Wardle, D.A.; Aronson, J.; Courchamp, F.; Galil, B.; García-Berthou, E.; Pascal, M.; et al. Impacts of Biological Invasions: What’s What and the Way Forward. Trends Ecol. Evol. 2013, 28, 58–66. [Google Scholar] [CrossRef]
  22. Hassan, A.; Ricciardi, A. Are Non-Native Species More Likely to Become Pests? Influence of Biogeographic Origin on the Impacts of Freshwater Organisms. Front. Ecol. Environ. 2014, 12, 218–223. [Google Scholar] [CrossRef]
  23. Pivello, V.R.; Vieira, M.V.; Grombone-Guaratini, M.T.; Matos, D.M.S. Thinking About Super-Dominant Populations of Native Species—Examples from Brazil. Perspect. Ecol. Conserv. 2018, 16, 74–82. [Google Scholar] [CrossRef]
  24. Duan, M.; Bau, T. Grassland Fairy Rings of Leucocalocybe mongolica Represent the Center of a Rich Soil Microbial Community. Braz. J. Microbiol. 2021, 52, 1357–1369. [Google Scholar] [CrossRef] [PubMed]
  25. Marí, T.; Castaño, C.; Rodríguez, A.; Ibáñez, M.; Lobo, A.; Sebastià, M.-T. Fairy Rings Harbor Distinct Soil Fungal Communities and High Fungal Diversity in a Montane Grassland. Fungal Ecol. 2020, 47, 100962. [Google Scholar] [CrossRef]
  26. Zotti, M.; De Filippis, F.; Cesarano, G.; Ercolini, D.; Tesei, G.; Allegrezza, M.; Giannino, F.; Mazzoleni, S.; Bonanomi, G. One Ring to Rule Them All: An Ecosystem Engineer Fungus Fosters Plant and Microbial Diversity in a Mediterranean Grassland. New Phytol. 2020, 227, 884–898. [Google Scholar] [CrossRef]
  27. Zotti, M.; Bonanomi, G.; Mancinelli, G.; Barquero, M.; De Filippis, F.; Giannino, F.; Mazzoleni, S.; González-Andrés, F. Riding the Wave: Response of Bacterial and Fungal Microbiota Associated with the Spread of the Fairy Ring Fungus Calocybe gambosa. Appl. Soil Ecol. 2021, 163, 103963. [Google Scholar] [CrossRef]
  28. Gramss, G.; Voigt, K.D.; Bergmann, H. Factors Influencing Water Solubility and Plant Availability of Mineral Compounds in the Tripartite Fairy Rings of Marasmius Oreades (BOLT.: FR.) FR. J. Basic Microbiol. 2005, 45, 41–54. [Google Scholar] [CrossRef]
  29. Fidanza, M.A. Characterization of Soil Properties Associated with Type-I Fairy Ring Symptoms in Turfgrass. Sect. Bot. 2007, 625, 533–536. [Google Scholar] [CrossRef]
  30. Rillig, M.C. A Connection Between Fungal Hydrophobins and Soil Water Repellency? Pedobiologia 2005, 49, 395–399. [Google Scholar] [CrossRef]
  31. Rodríguez, A.; Ibáñez, M.; Bol, R.; Brüggemann, N.; Lobo, A.; Jimenez, J.J.; Ruess, L.; Sebastià, M.-T. Fairy Ring-Induced Soil Potassium Depletion Gradients Reshape Microbial Community Composition in a Montane Grassland. Eur. J. Soil Sci. 2022, 73, e13239. [Google Scholar] [CrossRef]
  32. Marí Marí, T. Changes in Soil Biodiversity and Activity Along Management and Climatic Gradients. Ph.D. Thesis, Universitat de Lleida, Lleida, Spain, 2017. [Google Scholar]
  33. Oh, S.-Y.; Fong, J.J.; Park, M.S.; Lim, Y.W. Distinctive Feature of Microbial Communities and Bacterial Functional Profiles in Tricholoma Matsutake Dominant Soil. PLoS ONE 2016, 11, e0168573. [Google Scholar] [CrossRef] [PubMed]
  34. Kim, M.; Yoon, H.; You, Y.H.; Kim, Y.E.Y.J.; Woo, J.R.; Seo, Y.; Lee, G.M.; Kim, Y.E.Y.J.; Kong, W.S.; Kim, J.G. Metagenomic Analysis of Fungal Communities Inhabiting the Fairy Ring Zone of Tricholoma matsutake. J. Microbiol. Biotechnol. 2013, 23, 1347–1356. [Google Scholar] [CrossRef] [PubMed]
  35. Olsen, S.R. Estimation of Available Phosphorus in Soils by Extraction with Sodium Bicarbonate; U.S. Department of Agriculture: Washington, DC, USA, 1954. [Google Scholar]
  36. Herlemann, D.P.; Labrenz, M.; Jürgens, K.; Bertilsson, S.; Waniek, J.J.; Andersson, A.F. Transitions in Bacterial Communities Along the 2000 km Salinity Gradient of the Baltic Sea. ISME J. 2011, 5, 1571–1579. [Google Scholar] [CrossRef]
  37. Magoč, T.; Salzberg, S.L. FLASH: Fast Length Adjustment of Short Reads to Improve Genome Assemblies. Bioinformatics 2011, 27, 2957–2963. [Google Scholar] [CrossRef]
  38. Caporaso, J.G.; Kuczynski, J.; Stombaugh, J.; Bittinger, K.; Bushman, F.D.; Costello, E.K.; Fierer, N.; Pẽa, A.G.; Goodrich, J.K.; Gordon, J.I.; et al. QIIME Allows Analysis of High-Throughput Community Sequencing Data. Nat. Methods 2010, 7, 335–336. [Google Scholar] [CrossRef]
  39. Edgar, R.C.; Haas, B.J.; Clemente, J.C.; Quince, C.; Knight, R. UCHIME Improves Sensitivity and Speed of Chimera Detection. Bioinformatics 2011, 27, 2194–2200. [Google Scholar] [CrossRef]
  40. DeSantis, T.Z.; Hugenholtz, P.; Larsen, N.; Rojas, M.; Brodie, E.L.; Keller, K.; Huber, T.; Dalevi, D.; Hu, P.; Andersen, G.L. Greengenes, a Chimera-Checked 16S rRNA Gene Database and Workbench Compatible with ARB. Appl. Environ. Microbiol. 2006, 72, 5069–5072. [Google Scholar] [CrossRef] [PubMed]
  41. Altschul, S.F.; Gish, W.; Miller, W.; Myers, E.W.; Lipman, D.J. Basic Local Alignment Search Tool. J. Mol. Biol. 1990, 215, 403–410. [Google Scholar] [CrossRef]
  42. Good, I.J.; Toulmin, G.H. The Number of New Species, and the Increase in Population Coverage, When a Sample Is Increased. Biometrika 1956, 43, 45. [Google Scholar] [CrossRef]
  43. Rohlf, F.; Sokal, R. Statistical Tables; Macmillan: New York, NY, USA, 1995. [Google Scholar]
  44. Hill, M.O. Diversity and Evenness: A Unifying Notation and Its Consequences. Ecology 1973, 54, 427–432. [Google Scholar] [CrossRef]
  45. Chao, A.; Gotelli, N.J.; Hsieh, T.C.; Sander, E.L.; Ma, K.H.; Colwell, R.K.; Ellison, A.M. Rarefaction and Extrapolation with Hill Numbers: A Framework for Sampling and Estimation in Species Diversity Studies. Ecol. Monogr. 2014, 84, 45–67. [Google Scholar] [CrossRef]
  46. Lenth, R. Emmeans Package: Estimated Marginal Means, Aka Least-Squares Means. R Package Version 1.11.0-004. 2019. Available online: https://rvlenth.github.io/emmeans/authors.html (accessed on 19 September 2019).
  47. Janssen, P.H. Identifying the Dominant Soil Bacterial Taxa in Libraries of 16S rRNA and 16S rRNA Genes. Appl. Environ. Microbiol. 2006, 72, 1719–1728. [Google Scholar] [CrossRef] [PubMed]
  48. Huhe; Jiang, C.; Wu, Y.; Cheng, Y. Bacterial and Fungal Communities and Contribution of Physicochemical Factors During Cattle Farm Waste Composting. MicrobiologyOpen 2017, 6, e00518. [Google Scholar] [CrossRef]
  49. Kim, M.; Yoon, H.; Kim, Y.E.; Kim, Y.J.; Kong, W.S.; Kim, J.G. Comparative Analysis of Bacterial Diversity and Communities Inhabiting the Fairy Ring of Tricholoma matsutake by Barcoded Pyrosequencing. J. Appl. Microbiol. 2014, 117, 699–710. [Google Scholar] [CrossRef]
  50. Pan, Y.; Cassman, N.; de Hollander, M.; Mendes, L.W.; Korevaar, H.; Geerts, R.H.E.M.; van Veen, J.A.; Kuramae, E.E. Impact of Long-Term N, P, K, and NPK Fertilization on the Composition and Potential Functions of the Bacterial Community in Grassland Soil. FEMS Microbiol. Ecol. 2014, 90, 195–205. [Google Scholar] [CrossRef] [PubMed]
  51. Kuramae, E.E.; Gamper, H.A.; Yergeau, E.; Piceno, Y.M.; Brodie, E.L.; DeSantis, T.Z.; Andersen, G.L.; van Veen, J.A.; Kowalchuk, G.A. Microbial Secondary Succession in a Chronosequence of Chalk Grasslands. ISME J. 2010, 4, 711–715. [Google Scholar] [CrossRef] [PubMed]
  52. Lienhard, P.; Terrat, S.; Prévost-Bouré, N.C.; Nowak, V.; Régnier, T.; Sayphoummie, S.; Panyasiri, K.; Tivet, F.; Mathieu, O.; Levêque, J.; et al. Pyrosequencing Evidences the Impact of Cropping on Soil Bacterial and Fungal Diversity in Laos Tropical Grassland. Agron. Sustain. Dev. 2014, 34, 525–533. [Google Scholar] [CrossRef]
  53. Li, H.Y.; Yao, T.; Zhang, J.G.; Gao, Y.M.; Ma, Y.C.; Lu, X.W.; Zhang, H.R.; Yang, X.L. Relationship between soil bacterial community and environmental factors in the degraded alpine grassland of eastern Qilian Mountains, China. Ying Yong Sheng Tai Xue Bao 2018, 29, 3793–3801. [Google Scholar] [CrossRef]
  54. French, K.E.; Tkacz, A.; Turnbull, L.A. Conversion of Grassland to Arable Decreases Microbial Diversity and Alters Community Composition. Appl. Soil Ecol. 2017, 110, 43–52. [Google Scholar] [CrossRef]
  55. Govaerts, B.; Mezzalama, M.; Unno, Y.; Sayre, K.D.; Luna-Guido, M.; Vanherck, K.; Dendooven, L.; Deckers, J. Influence of Tillage, Residue Management, and Crop Rotation on Soil Microbial Biomass and Catabolic Diversity. Appl. Soil Ecol. 2007, 37, 18–30. [Google Scholar] [CrossRef]
  56. Scavino, A.F.; Ji, Y.; Pump, J.; Klose, M.; Claus, P.; Conrad, R. Structure and Function of the Methanogenic Microbial Communities in Uruguayan Soils Shifted Between Pasture and Irrigated Rice Fields. Environ. Microbiol 2013, 15, 2588–2602. [Google Scholar] [CrossRef] [PubMed]
  57. Grönemeyer, J.L.; Burbano, C.S.; Hurek, T.; Reinhold-Hurek, B. Isolation and Characterization of Root-Associated Bacteria from Agricultural Crops in the Kavango Region of Namibia. Plant Soil 2012, 356, 67–82. [Google Scholar] [CrossRef]
  58. Filippidou, S.; Wunderlin, T.; Junier, T.; Jeanneret, N.; Dorador, C.; Molina, V.; Johnson, D.R.; Junier, P. A Combination of Extreme Environmental Conditions Favor the Prevalence of Endospore-Forming Firmicutes. Front. Microbiol. 2016, 7, 1707. [Google Scholar] [CrossRef] [PubMed]
  59. Druce, R.G.; Thomas, S.B. An Ecological Study of the Psychrotrophic Bacteria of Soil, Water, Grass and Hay. J. Appl. Bacteriol. 1970, 33, 420–435. [Google Scholar] [CrossRef]
  60. Stackebrandt, E.; Rainey, F.A.; Ward-Rainey, N.L. Proposal for a New Hierarchic Classification System, Actinobacteria classis Nov. Int. J. Syst. Evol. Microbiol. 1997, 47, 479–491. [Google Scholar] [CrossRef]
  61. Zotti, M.; Bonanomi, G.; Mazzoleni, S. Fungal Fairy Rings: History, Ecology, Dynamics and Engineering Functions. IMA Fungus 2025, 16, e138320. [Google Scholar] [CrossRef]
  62. de Vries, F.T.; Manning, P.; Tallowin, J.R.B.; Mortimer, S.R.; Pilgrim, E.S.; Harrison, K.A.; Hobbs, P.J.; Quirk, H.; Shipley, B.; Cornelissen, J.H.C.; et al. Abiotic Drivers and Plant Traits Explain Landscape-Scale Patterns in Soil Microbial Communities. Ecol. Lett. 2012, 15, 1230–1239. [Google Scholar] [CrossRef]
  63. Kirk, G.J.d.; Bellamy, P.H.; Lark, R.M. Changes in Soil pH across England and Wales in Response to Decreased Acid Deposition. Glob. Change Biol. 2010, 16, 3111–3119. [Google Scholar] [CrossRef]
  64. Yang, Y.; Ashworth, A.J.; DeBruyn, J.M.; Willett, C.; Durso, L.M.; Cook, K.; Philip, A.; Moore, J.; Owens, P.R. Soil Bacterial Biodiversity Is Driven by Long-Term Pasture Management, Poultry Litter, and Cattle Manure Inputs. PeerJ 2019, 7, e7839. [Google Scholar] [CrossRef]
  65. Nagendra, H. Opposite Trends in Response for the Shannon and Simpson Indices of Landscape Diversity. Appl. Geogr. 2002, 22, 175–186. [Google Scholar] [CrossRef]
  66. Allison, S.D.; Martiny, J.B.H. Resistance, Resilience, and Redundancy in Microbial Communities. Proc. Natl. Acad. Sci. USA 2008, 105, 11512–11519. [Google Scholar] [CrossRef]
  67. Shade, A.; Peter, H.; Allison, S.; Baho, D.; Berga, M.; Buergmann, H.; Huber, D.; Langenheder, S.; Lennon, J.; Martiny, J.; et al. Fundamentals of Microbial Community Resistance and Resilience. Front. Microbiol. 2012, 3, 417. [Google Scholar] [CrossRef] [PubMed]
  68. Edwards, P.J. The Growth of Fairy Rings of Agaricus Arvensis and Their Effect upon Grassland Vegetation and Soil. J. Ecol. 1984, 72, 505–513. [Google Scholar] [CrossRef]
  69. Fierer, N.; Bradford, M.A.; Jackson, R.B. Toward an Ecological Classification of Soil Bacteria. Ecology 2007, 88, 1354–1364. [Google Scholar] [CrossRef]
  70. Leff, J.W.; Jones, S.E.; Prober, S.M.; Barberán, A.; Borer, E.T.; Firn, J.L.; Harpole, W.S.; Hobbie, S.E.; Hofmockel, K.S.; Knops, J.M.H.; et al. Consistent Responses of Soil Microbial Communities to Elevated Nutrient Inputs in Grasslands Across the Globe. Proc. Natl. Acad. Sci. USA 2015, 112, 10967–10972. [Google Scholar] [CrossRef] [PubMed]
  71. Fidanza, M.A.; Cisar, J.L.; Kostka, S.J.; Gregos, J.S.; Schlossberg, M.J.; Franklin, M. Preliminary Investigation of Soil Chemical and Physical Properties Associated with Type-I Fairy Ring Symptoms in Turfgrass. Hydrol. Process. 2007, 21, 2285–2290. [Google Scholar] [CrossRef]
  72. Lee, S.-M.; Kong, H.G.; Song, G.C.; Ryu, C.-M. Disruption of Firmicutes and Actinobacteria Abundance in Tomato Rhizosphere Causes the Incidence of Bacterial Wilt Disease. ISME J. 2021, 15, 330–347. [Google Scholar] [CrossRef]
  73. Artursson, V.; Finlay, R.D.; Jansson, J.K. Interactions between Arbuscular Mycorrhizal Fungi and Bacteria and Their Potential for Stimulating Plant Growth. Environ. Microbiol. 2006, 8, 1–10. [Google Scholar] [CrossRef]
  74. van Overbeek, L.; van Elsas, J.D. Adaptation of Bacteria to Soil Conditions: Applications of Molecular Physiology in Soil Microbiology. In Modern Soil Microbiology; Marcel Dekker: New York, NY, USA, 1997. [Google Scholar]
  75. Garbaye, J. Tansley Review No. 76 Helper Bacteria: A New Dimension to the Mycorrhizal Symbiosis. New Phytol. 1994, 128, 197–210. [Google Scholar] [CrossRef]
  76. Young, L.-S.; Chu, J.-N.; Young, C.-C. Beneficial Bacterial Strains on Agaricus blazei Cultivation. Pesqui. Agropecuária Bras. 2012, 47, 815–821. [Google Scholar] [CrossRef]
Figure 1. Fairy ring division for this study. A total of 5 samples were taken per ring. The center of the ring. “Back 2”: the position in which the lush vegetation was two years prior. “Ring”: the zone of the lush vegetation. “Front”: the zone where the fruiting bodies appear, and the fungus is advancing. Outside (“out”): a location at least 2 m away from any fairy ring.
Diversity 17 00322 g001
Figure 2. Rarefaction curves for the overall sampling. Each color line represent the curve of observed OTUs by sequences for each of the samples of the analysis.
Diversity 17 00322 g002
Figure 3. Mean OTU proportions of 9 representative bacterial phyla in the 5 different fairy ring zones (center, Ring2013, Ring2015, front and outside). Error bars represent ± 1 standard error. Above each plot, the results for the test of significance of RZ in the fitted linear mixed models are shown. When these tests are significant, letters indicate significant differences between RZ levels according to Tukey’s post-hoc test. All tests were carried out at 95% significance level. Note the differences in abundance values on the y-axis.
Diversity 17 00322 g003
Figure 4. Mean OTU proportions of 6 representative bacterial classes in the 5 different fairy ring zones (center, Ring2013, Ring2015, front and outside). Error bars represent standard errors. Above each plot, the results for the test of significance of RZ in the fitted linear mixed models is shown. When these tests are significant, letters indicate significant differences between RZ levels according to Tukey’s post-hoc test. All tests were carried out at a 95% significance level. Note the differences in abundance values on the y-axis.
Diversity 17 00322 g004
Figure 5. Mean OTU proportions of the bacterial families Bacillaceae and Pseudomonadaceae. Error bars represent standard errors. Above each plot, the results for the test of significance of RZ in the linear mixed models fitted are shown. When these tests are significant, letters indicate significant differences between RZ levels according to Tukey’s post-hoc test. All tests were carried out at a 95% significance level. Note the differences in abundance values on the y-axis.
Diversity 17 00322 g005
Figure 6. RDA plot showing the relationship between the composition of the bacterial community at the OTU level and soil factors, ring diameter and ring zone. Block triangles indicate categorical explanatory variables; arrows represent quantitative variables. When any variable appears with “*D” it means it is interacting with the diameter of the ring.
Diversity 17 00322 g006
Figure 7. Diversity estimators across RZ: N0 represents species richness; N1 represents the exponential of Shannon’s diversity index; and N2 is the inverse of Simpson’s diversity index. Error bars represent standard errors. Above each plot, the results for the test of significance of RZ in the fitted linear mixed models are shown. When these tests are significant, letters indicate significant differences between RZ levels according Tukey’s post-hoc test (p < 0.05).
Diversity 17 00322 g007
Table 1. Soil properties in the grassland studied by ring zone. All zones for each ring were sampled. The table displays the mean of the values by ring zone and its standard error. These values do not represent statistical analysis but are presented for reference. For further information about the soil in this experimental field, see [31].
Ring Zone
CenterRing13Ring15FrontOut
pH7.8 ± 0.227.9 ± 0.187.9 ± 0.177.9 ± 0.178.0 ± 0.13
Moisture (%)7.2 ± 0.926.6 ± 1.406.5 ± 1.806.7 ± 1.477.5 ± 1.30
Tsoil (°C)19.6 ± 4.5123.2 ± 3.5820.9 ± 4.3122.3 ± 5.2920.9 ± 3.28
Ca (mg·Kg−1)5933.3 ± 1028.915750 ± 1169.25150 ± 1602.25633.3 ± 1209.405733.3 ± 920.14
P (mg·Kg−1)13 ± 3.1620 ± 12.117.8 ± 10.3020.5 ± 10.6522.7 ± 5.99
Mg (mg·Kg−1)205 ± 48.4180 ± 36.9176.7 ± 70.33193.3 ± 56.45183.3 ± 32.66
K (mg·Kg−1)305 ± 102.1280 ± 100.6271.7 ± 167.50296.7 ± 122.09315 ± 105.9
NO3− (ppm)0.16 ± 0.0320.56 ± 0.4780.23 ± 0.1210.65 ± 0.8260.8 ± 1.43
NH4+ (ppm)9.9 ± 1.247.1 ± 3.779.0 ± 2.706.9 ± 4.528.0 ± 2.45
Litter (g·cm−2)5.6 ± 4.006.1 ± 1.075.5 ± 2.004.3 ± 2.765.6 ± 3.82
Disclaimer/Publisher’s Note: The statements, opinions and data contained in all publications are solely those of the individual author(s) and contributor(s) and not of MDPI and/or the editor(s). MDPI and/or the editor(s) disclaim responsibility for any injury to people or property resulting from any ideas, methods, instructions or products referred to in the content.

