Article

Comparative Assessment of Biodiversity and Ecological Indicators in Three Forest Ecosystems of Southern Romania

by
Florin Daniel Stamin
1 and
Sina Cosmulescu
2,*
1
Doctoral School of Plant and Animal Resources Engineering, Faculty of Horticulture, University of Craiova, A.I. Cuza Street, no. 13, 200585 Craiova, Romania
2
Department of Horticulture and Food Science, Faculty of Horticulture, University of Craiova, A.I. Cuza Street, no. 13, 200585 Craiova, Romania
*
Author to whom correspondence should be addressed.
Diversity 2025, 17(4), 277; https://doi.org/10.3390/d17040277
Submission received: 27 February 2025 / Revised: 2 April 2025 / Accepted: 14 April 2025 / Published: 15 April 2025
(This article belongs to the Section Plant Diversity)

Abstract

:
This paper aims to analyze and compare the structure of tree and herbaceous plant communities in three temperate forest ecosystems located in the south of Olt County, Romania. The research consisted of determining the tree and herbaceous composition of the ecosystems by the frame quadrats sampling method and the taxonomic determination of the species. The community structure was analyzed based on structural indices such as the arithmetic mean of individuals (X), standard deviation (SD), confidence limits (LC), percentage density (DP), frequency (F), constant (C), relative significance index (W) and dominance index (ID). The results indicated that the structure of the plant communities shows differences depending on the studied area, but this structure remains complex but uneven. In the case of trees, species such as Crataegus monogyna, Quercus robur or Acer campestre tend to influence the community more due to an uneven distribution or a significant number of individuals. As regards the herbaceous species, out of the 34 identified, only two were noted to be present in all three sites, namely Geum urbanum and Viola canina, which reflects a higher adaptability in their case.

1. Introduction

Taxonomic composition generally refers to the identity of the species comprising the community, while we define structure as the presence of multiple layers of individuals within a community [1]. Plant communities have traditionally been viewed as a random collection of individuals, but no single perspective provides a comprehensive modern view of these communities [2]. Relationships between plant diversity and productivity have focused on how competition for resources can influence relative abundance [3,4], but heterogeneity in abiotic properties directly influences the diversity and vegetation patterns [5,6]. Communities associated with traditional management regimes are valued because they represent rare examples of communities with high species richness [7,8]. Actions that disrupt ecosystems, such as anthropogenic ones [9], have direct influences on shaping species composition in forests, altering community and population dynamics by changing resource availability [10,11,12].
Forests serve as a model for understanding the natural disturbances and the dynamics of climate change [13,14]. The composition of tree species in the forest canopy is a defining characteristic of forest ecosystems [15]. Inherent differences in tree species traits lead to very different tree structures and, with them, a microclimate that affects the species assemblages at trophic levels [16]. Forest community composition is the result of an interaction between abiotic conditions and biotic interactions. The importance of factors within these two broad categories acts as a filter on the species composition and coexistence [17]. Woody vegetation serves as a food source for many other species and provides many important ecosystem services: provisioning (food, fodder, wood, fiber, medicine), support (soil maintenance, nutrient cycling) [18], and other regulatory and cultural services for human well-being [19,20]. Woody vegetation underlies the physical structure of habitats and thus defines key patterns of environmental heterogeneity and structural complexity in an ecosystem [18]. The species composition of the forest stands has been shown to be the main driver of forest biodiversity [21]. It can directly determine the diversity and composition of the regeneration layer, epiphytic taxons and parasitic or symbiont fungi, and understory vegetation is linked to tree species composition through complex pathways [22,23]. Spontaneous fruit species also play an important role in the diversity of the forest ecosystem, providing welfare factors such as potential food resources, nesting sites, access to breeding territory, protection from predators, permanent and seasonal habitat, increasing the habitat area for isolated populations of wildlife, etc. [24]. Integrating climate change into ecosystem service assessments and natural resource management remains a major challenge [25]. However, conservation challenges can arise from many other factors, including agricultural intensification, habitat fragmentation, urbanization, toxic chemicals, exotic diseases, insect pests, introduction of non-native species, and forest loss, which substantially contribute to the extinction of herbaceous species [26,27]. Climate change will alter the global water cycle process, leading to changes in rainfall distribution patterns and will have a serious impact on the ecosystem [28,29], especially on the composition of plant communities, which play a fundamental role in ecosystem dynamics, influencing both diversity and ecological balance. Thus, functional plant groups, such as herbs and medicinal plants, respond differently to rainfall variability due to their intrinsic differences in functional attributes. Shallow-rooted plants are more sensitive to extreme drought compared to deep-rooted plants, leading to changes in community composition and plant diversity [30,31]. Considering these aspects, the aim of the present research is to evaluate the structure of plant communities (woody and herbaceous species) in three forest ecosystems in Romania by analyzing specific structural indices in order to understand how the diversity and ecological interactions between tree, shrub and herbaceous plant species are influenced by environmental factors and community composition.

2. Materials and Methods
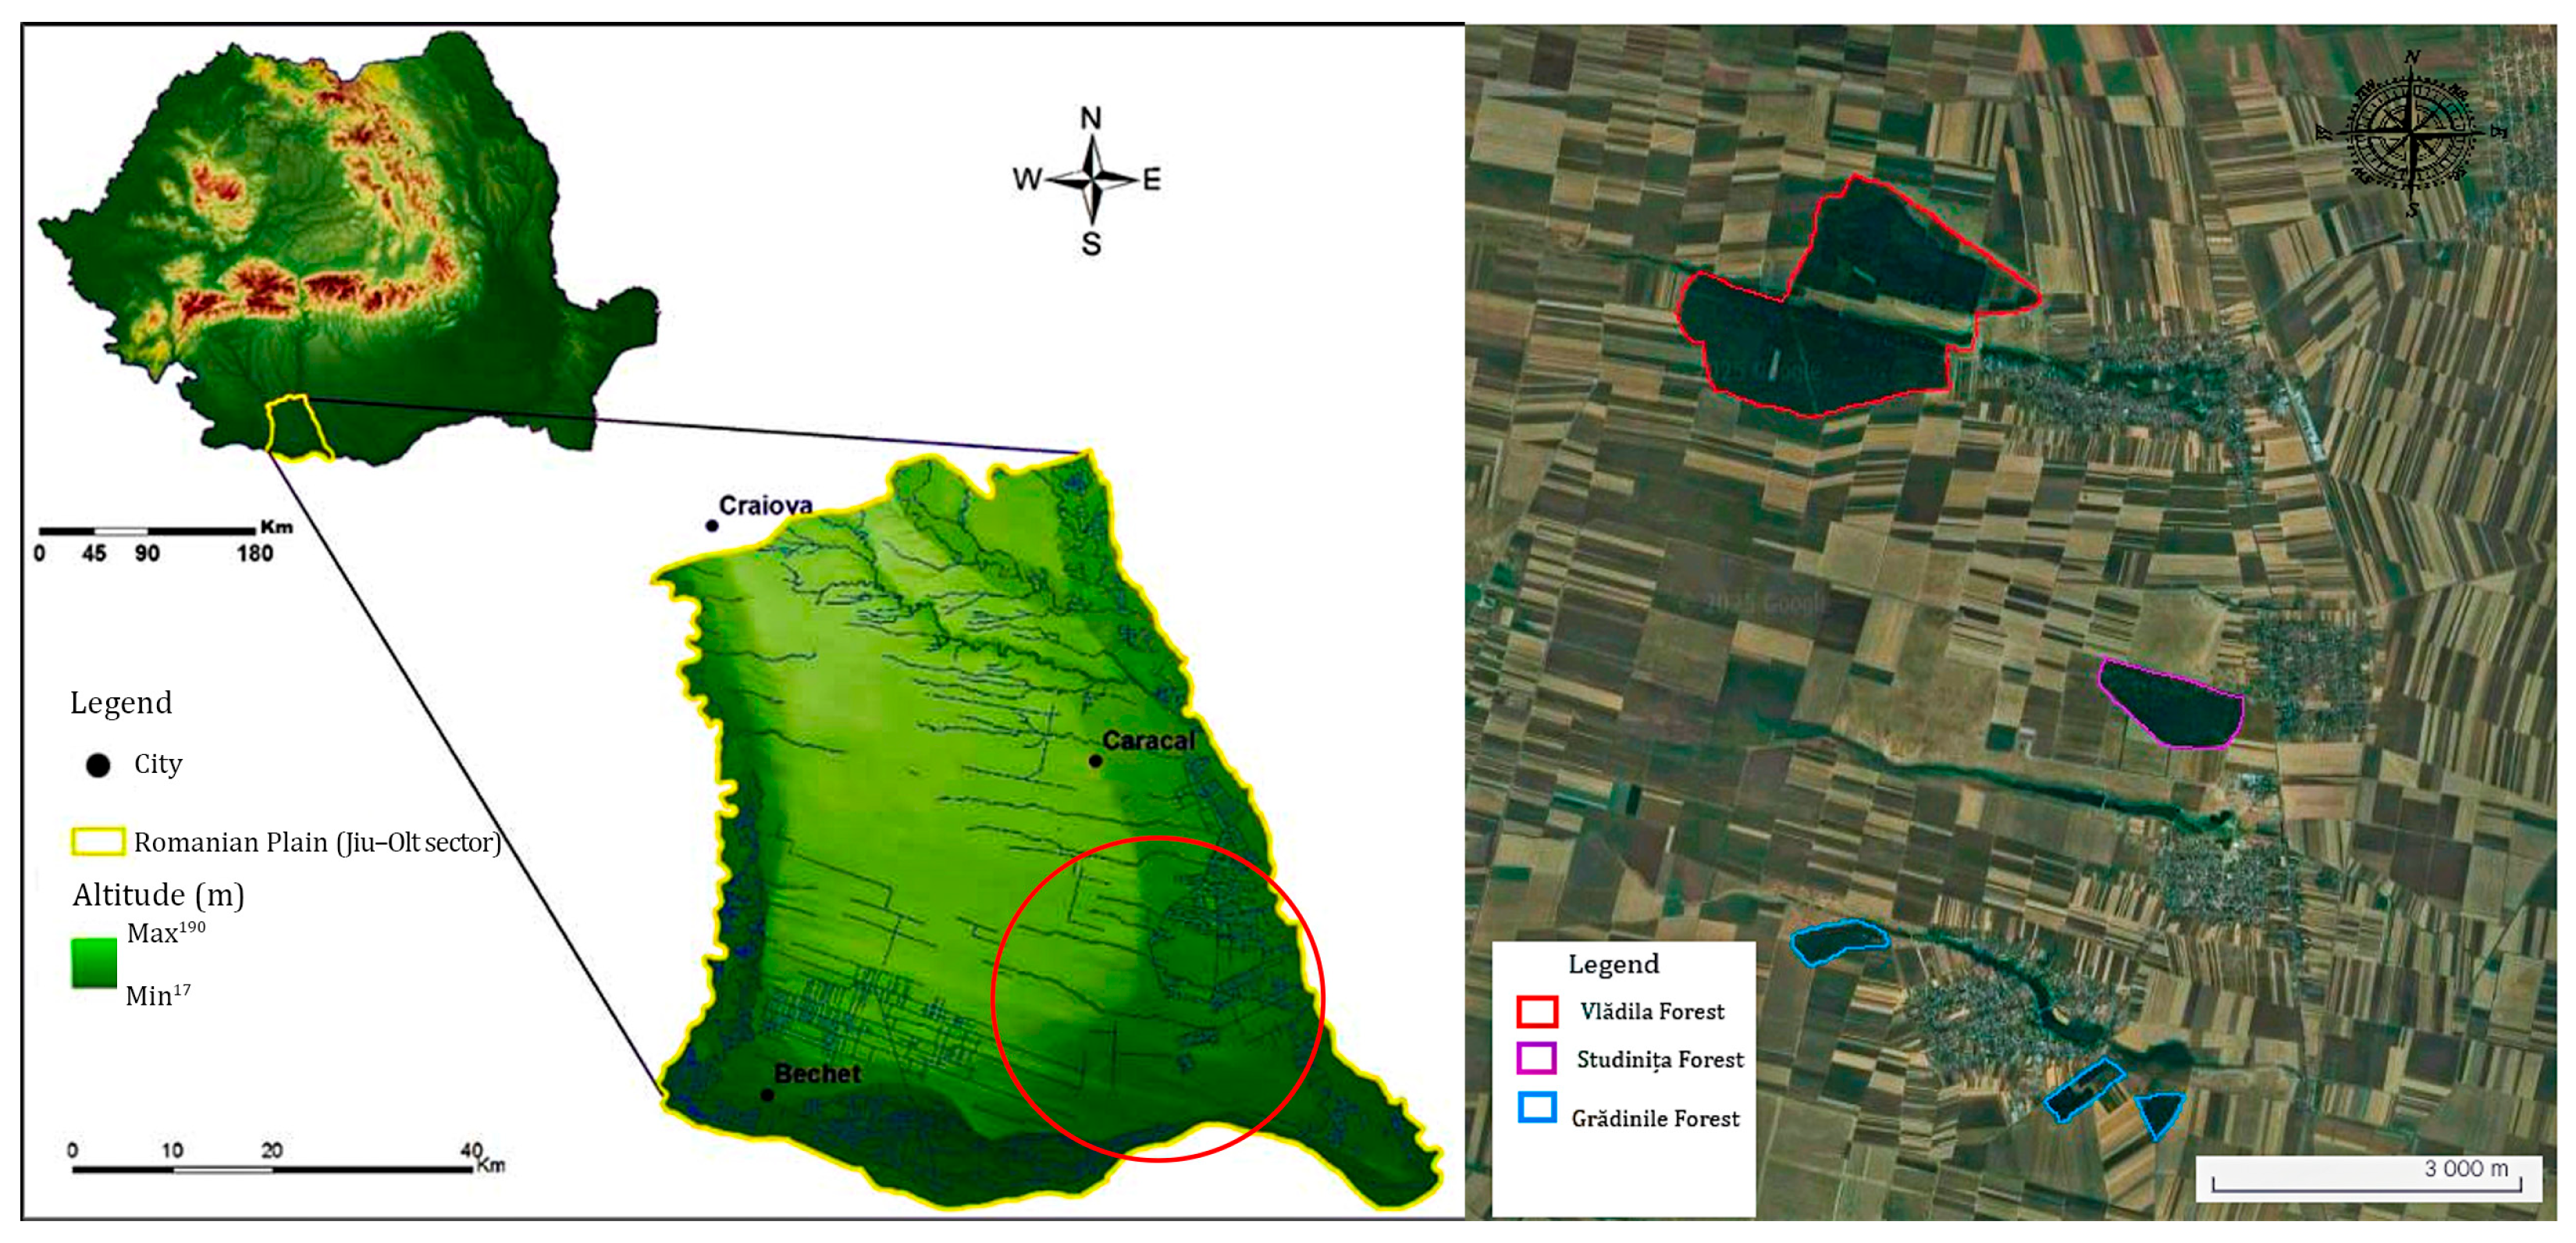
2.1. Study Area

The study was conducted in the southern part of Romania, in three forest ecosystems representative (Figure 1) for the southern area of Romania: Grădinile Forest (43°56′26″ N 24°24′24″ E), Studinița Forest (43°58′22″ N 24°24′09″ E), and Vlădila Forest (44°00′58″ N 24°23′10″ E). Both Studinița Forest and Vlădila Forest are protected areas, being Natura 2000 sites, identified by the codes ROSCI0174 and ROSCI0183. All three ecosystems are located at the boundary between the geomorphological units Câmpia Romanaților and Câmpul Înalt Leu-Rotunda, the climate being temperate, with low rainfall, especially in summer. In terms of size, Vlădila Forest is the largest, followed by Studinița and then Grădinile. Grădinile Forest is located at a lower altitude (98.8–115.9 m) and experiences a temperate-continental climate, with an average annual temperature of 10.6 °C. Summers are dry, and winters are variable. Studinița Forest has a dry forest-steppe climate, with an average annual temperature of 11.5 °C and 525 mm of precipitation. The area lacks surface water sources but contains underground deposits, with cambic and clay-illuvial soils dominating the landscape. Vlădila Forest also experiences a forest-steppe climate, with temperatures averaging 11.5 °C and similar precipitation (525 mm). Located at altitudes between 100 and 115 m, it has loess and loessoid relief and is influenced by dry winds from the west [32].

2.2. Data Collecting

Field research was conducted in 2024, and data collection was performed according to the method proposed by Battes [33] through randomized sampling and frame quadrat sampling. This method ensures a random selection of sampling units and a standardization of the data collection process. It is effective in estimating the abundance and distribution of species, minimizing selection bias and providing a balanced representation of local diversity. The study was carried out in three relatively close forests characterized by similar climatic conditions in order to reduce variability induced by external factors. For woody species, the shape of the samples was a square with a side of 10 m (area = 10 m2), and for herbaceous species, the shape of the sample was a circle with a radius of 1 m. 10 samples were established for the Grădinile and Studinița Forests, and 11 samples for Vlădila Forest, respectively, in the case of woody species. For herbaceous species, 5 control samples were established in each area. The other samples were also 5, and they had at their center a spontaneous fruit species, as follows: Crataegus monogyna (for the Grădinile, Studinița, Vlădila areas), Rosa canina (for Vlădila), Prunus spinosa (for Vlădila). R. canina samples were not established in the Grădinile and Studinița areas due to the low number of individuals inside the forest and to avoid the edge effect. P. spinosa was present only in the Vlădila Forest. The individuals of the key species of these samples represented mature specimens, with a height between 1.5 and 2 m, which bore fruit in the previous year. These species have been selected because of their essential ecological role in maintaining biodiversity and the ecosystem services they provide, including food and habitat for numerous species of insects, birds and mammals. To avoid the edge effect, all samples were placed inside the forest, at considerable distances from each other, although these distances were not accurately measured. In addition, no major human interventions were identified in the study areas, which reduces potential sources of confusion. Thus, by using a randomized sampling method and selecting similar habitats, significant microclimatic variations and other factors that could influence the results were minimized. The taxonomic identification of plant species was carried out based on their defining morphological characteristics, using reference sources [34,35].

2.3. Structural Indices of the Community

The percentage density, or percentage abundance, represents the number of individuals of a species compared to the total number of individuals of all species in the studied community (if the study did not target a single population); it is calculated according to the formula: D P i = D i D , where: DPi = percentage density of species i; Di = absolute density of species i; ΣD = sum of densities of all species in the studied community. The final value of the DPi parameter will be a proportion (between 0 and 1), and if we multiply it by 100, it will be expressed in percentages [36].
Frequency (F) represents the proportion of samples in which the studied species is found in relation to the total number of samples, having the formula F = p i P × 100 , where: pi = number of samples in which species i is found; P = total number of samples analysed [37].
Constancy (C) expresses in words the frequency of species [38]; thus, species with F ≥ 50% are constant species; species with F = 25–50% are accessory species; and species with F < 25% are accidental species. However, in practice, the use of numbers, direct values of frequency, is preferred over this characterization in words.
Index of (relative) significance (W) represents the multiplication of frequency and relative abundance, according to the formula: W = A F 100 , where: A = abundance; F = frequency. It must be reported to 100 because both parameters are percentages [33].
The dominance index (ID) expresses the degree of influence (dominance) that the first two species in the community, with the highest numerical development, have [39]. Thus, ID highlights the dominant species, demonstrating the role of species. The calculation formula is I D % = D 1 + D 2 D × 100 , where: D1 = numerical density of the most numerous species; D2 = numerical density of the secondary species; D = total density of all species in the community.

2.4. Biodiversity Indices

The Shannon-Wiener index [36] is used in ecology to measure entropy; its formula is: H = i = 1 s n i n l o g n i n , where s = total number of species; ni = number of individuals of species i; n = total number of individuals in the community.
The Pielou index [33] measures the uniformity of species proportions in the biocenosis; its formula is: E = H log S , where: H′ = Shannon-Wiener function; S = number of species.
Maximum entropy [37] represents the maximum possible diversity in a biocenosis and has the formula Hmax = log(S), where S is the total number of species in the community.
The Gleason index [33] takes values between 0 and 30, depending on the size of the sample analyzed. It is used to assess diversity; its formula is: G = S ln N , where: S = number of species; N = the total number of individuals in the population.

2.5. Statistical Analysis

The data obtained were processed in the Microsoft Excel 2010 program and statistically analyzed using its built-in functions to calculate the indices X (Arithmetic Mean of Individuals), SD (Standard Deviation), LC (Confidentiality Limits), DP (Percentage Density), F (Frequency), C (Constancy), W (Index of Relative Significance), and ID (Dominance Index) and SPSS Trial Version 26.0 (IBM SPSS Inc., Chicago, IL, USA) for biodiversity indices and graphical representation.

3. Results and Discussions

3.1. Analysis of Structural Indices of the Community for Woody Species

The structure of a community provides essential clues about its functionality and its role in the ecosystem in which it falls [40,41]. The quantitative study involves calculating the structural indices of the community, which play a role in expressing the quantitative relationships between species, thus clarifying the role of each. Moreover, based on them, two communities from different areas can be compared quantitatively [33]. From the analysis of the structural indices of the community for the Grădinile Forest (Table 1), the highest averages recorded were for the species C. monogyna (13.9 individuals) and Q. robur (5 individuals), which stood out as having the highest frequency of 100% and 90% respectively, these being the only constant species, the other 5 species falling into the category of accidental species. The relative significance index (W) recorded the highest value in the case of C. monogyna at 61.23%, the dominance of this species being evident due to the large number of individuals present in the studied samples.
The dominance index (ID) for C. monogyna and Q. robur was 54.95%, noting an increased influence of the two species in the studied area and a high ecological importance. Also, in the case of C. monogyna, increased values of the standard deviation (SD = 12.25) and confidence limits (LC = 7.59) were recorded, indicating an uneven distribution of individuals in the samples and an increased ecological variability. U. minor was the species that had the highest value for percentage density (DP = 96.15), but its frequency is low (F = 20), which indicates a large number of individuals only in certain areas and an uneven distribution of the species. In the Studinița forest (Table 1), two constant species (C. monogyna, Q. robur), two accessory species (A. campestre, R. canina) and four accidental species were identified. The highest frequency was found in the case of C. monogyna, which was 100%, and this species was present in each sample analyzed.
In the case of the average of the individuals, the highest values were in the species A. campestre (34.1 individuals) and C. monogyna (28.7 individuals), and the highest value of the relative significance index was also identified in the case of C. monogyna of 35.43%, which indicates both a significant number of individuals present of this species, but also a significant influence from an ecological point of view. The ecological significance of species within the Rosaceae family has been the subject of extensive research, highlighting their widespread occurrence in rural landscapes, forested areas, and along roadsides, where they provide numerous essential ecosystem services [42,43]. These species play an important role in biodiversity conservation, support wildlife habitats, and contribute to the aesthetic enrichment of these environments.
Compared to the other areas, in the Vlădila Forest (Table 1), the highest number of woody species was recorded, namely 15, of which the most numerous were C. monogyna and Prunus spinosa, with an average of 39.91 and 7.73 individuals respectively. The most common species were C. monogyna (F = 100%). The dominance index has recorded a value of 78.33%, highlighting the significant influence exerted by the species C. monogyna and P. spinosa. In all three studied areas, the constancy of the species Q. robur and C. monogyna was observed; the presence of oak is justified both by the types of forest analyzed and by its ecological dominance. According to Leca et al. [44], the relatively high groundwater level favors, over time, the vigorous development of forest vegetation, especially the oak Q. robur. The same authors also mentioned the presence of species such as Carpinus betulus, Tilia cordata, Q. cerris, A. platanoides and R. pseudoacacia in a suburban forest in the Bucharest area. Regarding C. monogyna, Fichtner and Wissemann [45] stated that this species shows increased adaptability to environmental conditions and resistance to abiotic factors, thus justifying both its constant presence in the studied areas and its high percentage density.

3.2. Analysis of Structural Indices of the Community for the Herbaceous Species

Regarding the identified herbaceous species, for the samples with the central species C. monogyna (Table 2), the herbaceous species were determined as follows: 6 species (in Grădinile), 7 species (in Studinița), and 11 species (in Vlădila). For the Grădinile area, the highest frequency was determined for the Carex sylvatica species (40%), which also represented the only accessory species identified, the rest of the species being accidental. Of the 7 species identified in the vicinity of the hawthorn in the Studinița area, two represented constant species, namely A. eupatoria and F. vesca. For both species, the frequency was 60%, and the percentage density was 44.62% and 17.20%, respectively. The highest number of species identified at the base of the hawthorn was 11 distinct species in the Vlădila area, two of which represented constant species: F. convolvus and F. vesca, both with a frequency of 60%. Comparatively, the highest percentage density was for the species A. eupatoria (44.62%) in the Studinița area, followed by G. hederacea (36.79%) in the Grădinile area, and L. purpurocaeruleum (25.27%) in the Vlădila area. Thus, it can be admitted that the hawthorn favors a limited series of herbaceous plants that can develop at its base.
Compared to the samples with the central species C. monogyna, in the samples that did not include a fruit species, i.e., the control ones (Table 3), 9 species of herbaceous plants were recorded for the Grădinile area, as in the Studinița area, while the Vlădila area identified the largest number of herbaceous species, namely 20. The species frequently encountered in the three areas were G. urbanum and V. canina. The constant species were two in number for Grădinile (C. sylvatica, G. urbanum), 4 for Studinița (B. nigra, F. vesca, G. urbanum and V. canina), and no constant species were identified in the Vlădila area. The highest value for the relative significance index (W) was found in the Grădinile area for the species G. urbanum at 17.10%, thus highlighting an increased ecological importance. The dominance index (ID) had the highest value in the same area, G. urbanum and C. sylvatica = 42.39%. In the other areas, the dominant species were according to the values obtained for ID: F. vesca and Ornithogalum pyramidale = 41.18%, for Studinița, and respectively Lamium purpureum and Urtica dioica = 27.78%, for Vlădila.
Because the marginal position of the rosehip in the Grădinile and Studinița locations would have influenced the field analyses performed, circle samples were established centered on the species R. canina only in the Vlădila area (Table 4).
In the 5 samples, 9 herbaceous species were determined, of which only two were constant, these being F. vesca and Rubus caesius—a semi-shrub, both species belonging to the Rosaceae family. The dominant species, according to ID, were F. vesca and Alkekengi officinarum = 61.84%. The constant presence of species from the Rosaceae family indicates an adaptation to various ecological conditions, being common in temperate forests and on their edges [46,47]. For the blackthorn samples established in the Vlădila Forest (Table 5), a fact determined by the absence of the P. spinosa species in the other two areas, a number of 12 herbaceous species were identified, of which only one is constant, B. nigra, with a frequency of 60%. The dominance index was calculated for the species B. nigra and Filipendula vulgaris, having a value of 70.77%, determining a significant influence of the two dominant species. The large number of species found in the blackthorn samples was also determined by the size and shape of the individuals of this species, which allowed the growth and development of herbaceous species in proximity, compared to the number of species identified in the other types of samples. Thus, as it could be observed, the largest number of species was found in the control samples, followed by the samples with the central species P. spinosa from the Vlădila area. A small number of species were identified in samples with the central species C. monogyna, although Fichtner and Wissemannau [45] stated that the strong stem and flexible branches of C. monogyna are shaped by the wind, and by bending, they provide shelter for many herbaceous species.

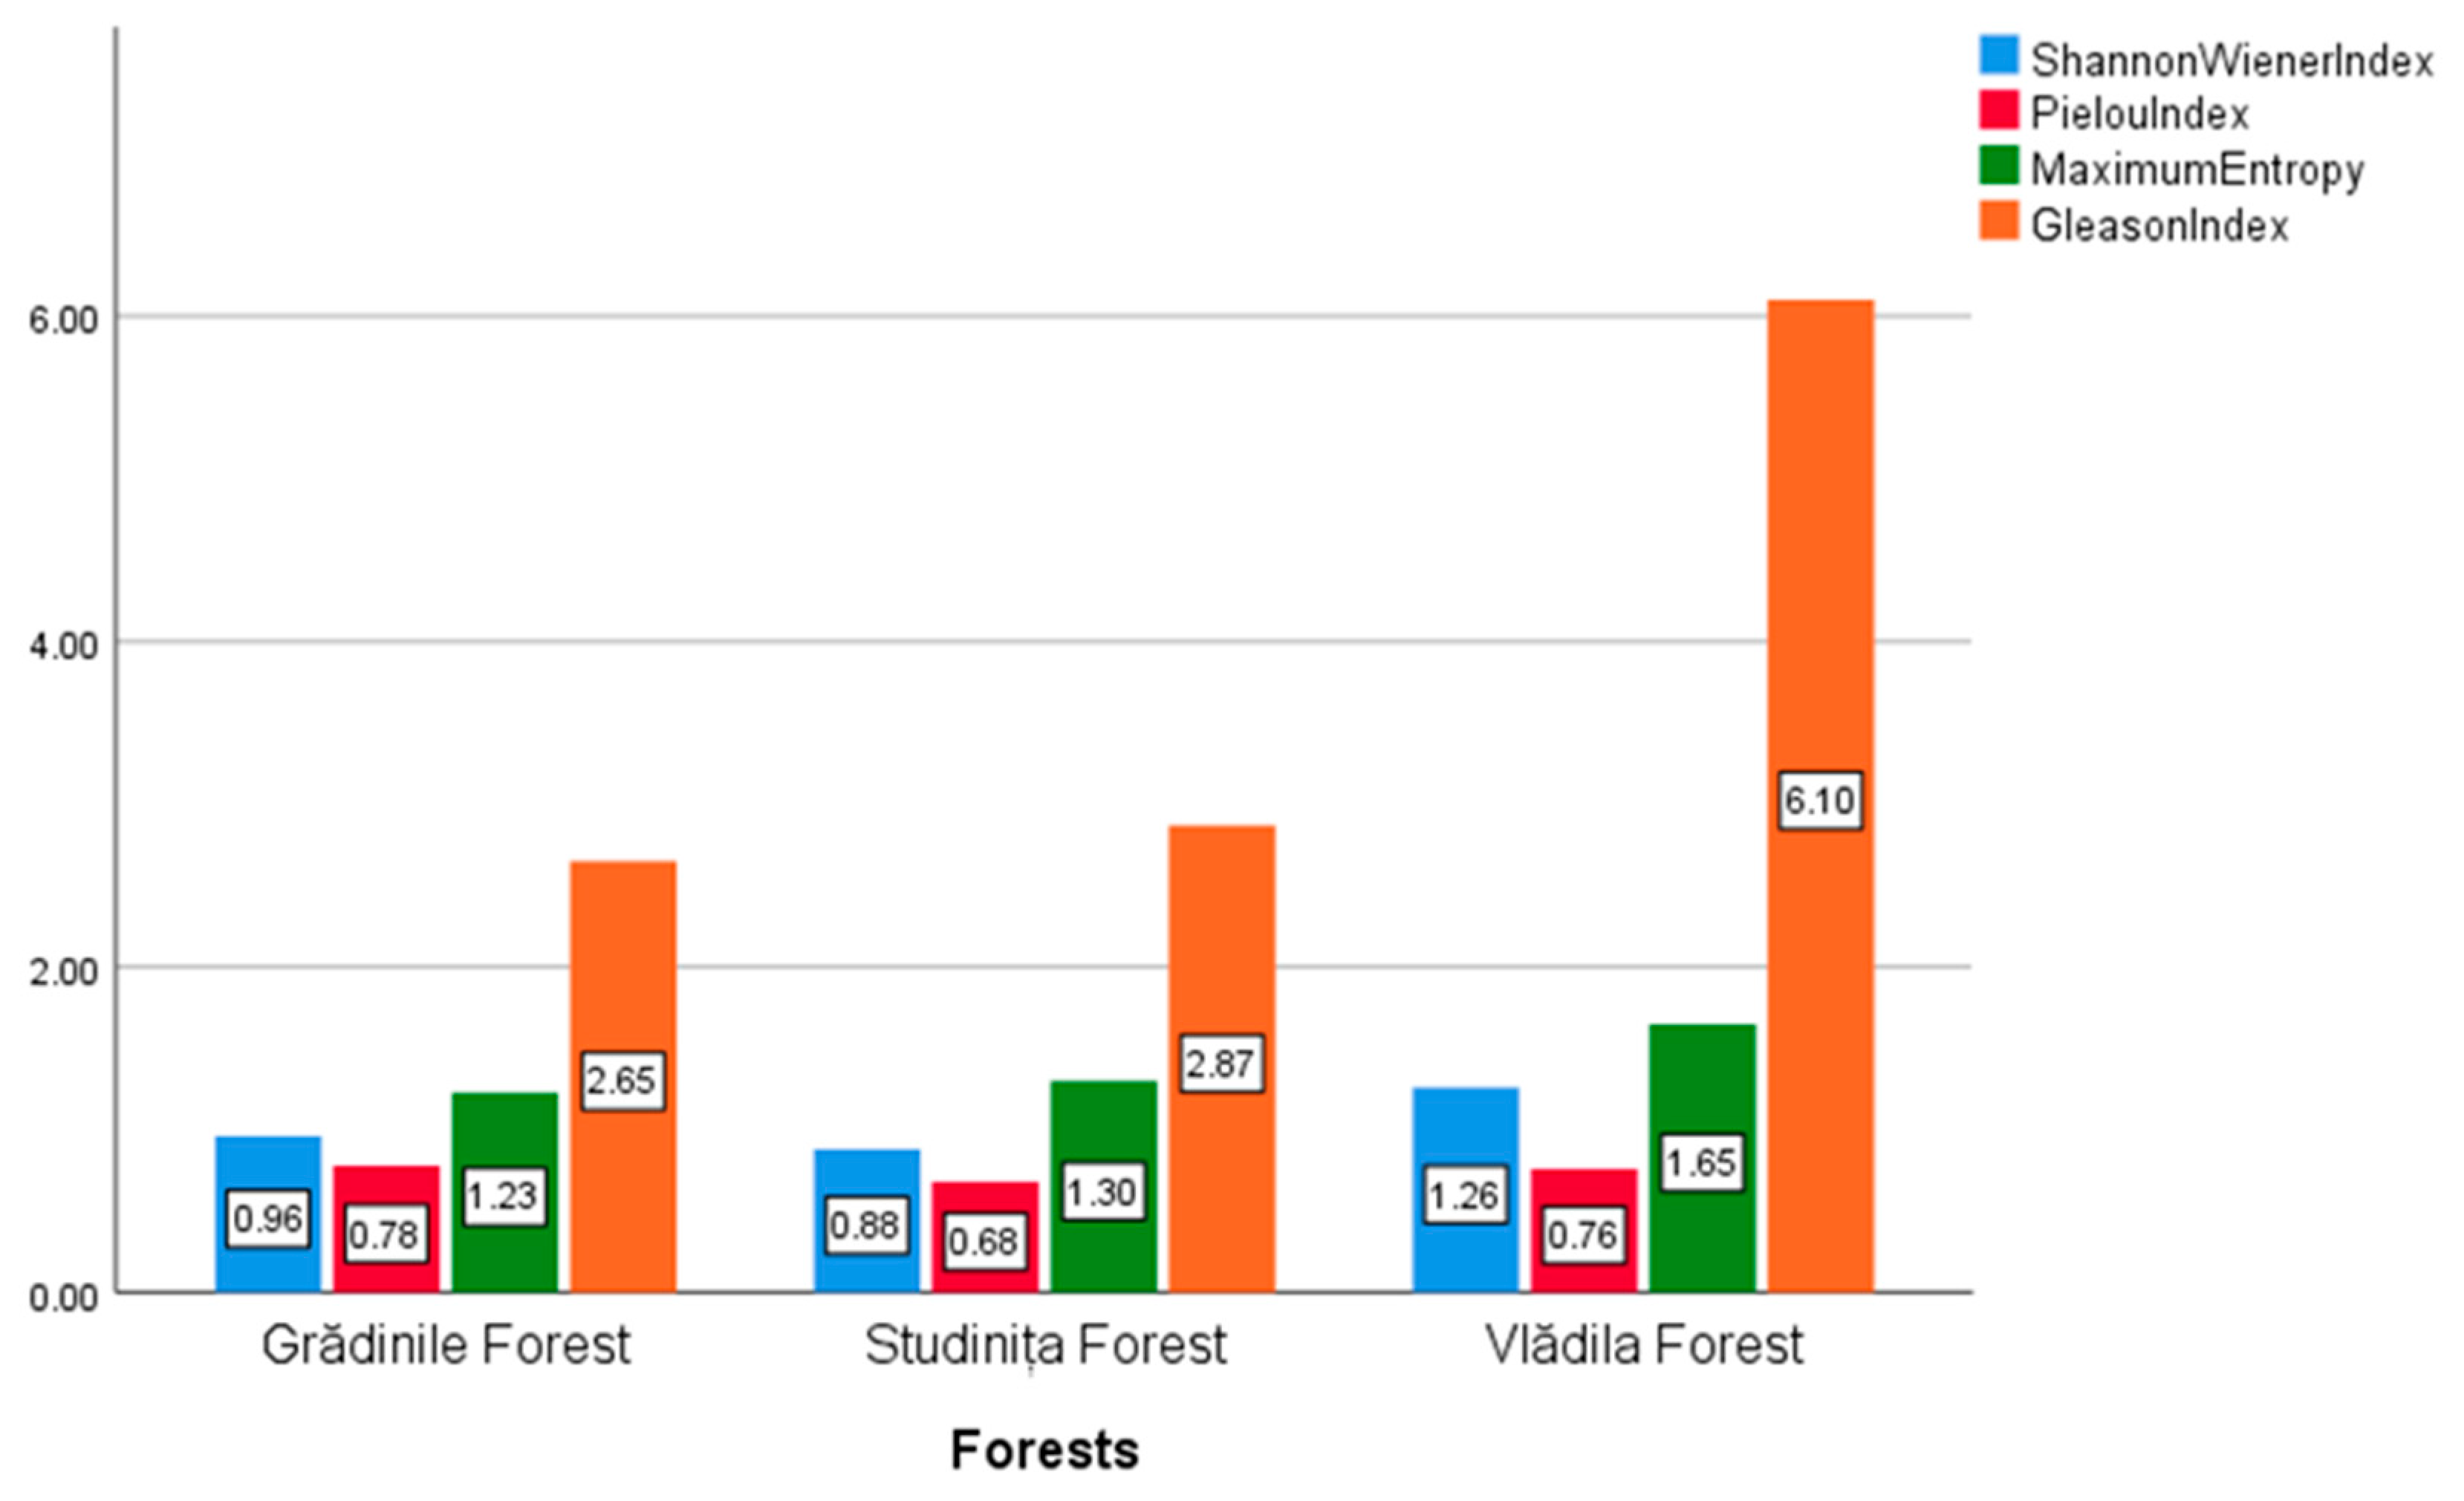
3.3. Analysis of Biodiversity Indices for the Three Forests

Analysis of the biodiversity indices for each forest, as depicted in Figure 2, indicates that the Vlădila Forest exhibited the highest plant diversity. Specifically, the Shannon-Wiener index attained a peak value of 1.26 within the Vlădila ecosystem. In contrast, lower values of this index were observed in other ecosystems, with the Studinița Forest and Grădinile Forest recording values of 0.88 and 0.96, respectively. The uniformity, as measured by the Pielou index, presented low but close values between the three ecosystems, with a maximum of 0.78 reached in the Grădinile Forest. The maximum entropy had, in turn, the highest value, as reflected by the Shannon-Wiener index, in the Vlădila Forest (1.65), suggesting a maximum theoretical potential in this area. Substantial differences between values were recorded for the Gleason index, where Vladila presented the highest specific richness of 6.10, compared to the other two ecosystems, which had values for this index of 2.65 and 2.87, suggesting a lower diversity. The results are similar to those obtained by Zhang et al. (2024) [48] in a forest in Beijing, China, where much lower values of the Gleason index (0.66) were determined, but close values of Shannon-Wiener (1.16), whereas the Pielou index for this forest was much higher, namely 0.95, noting an increased uniformity for this forest. Therefore, even if Vlădila Forest did not reach maximum uniformity, it was distinguished by much higher biodiversity compared to the other two studied forests.

4. Conclusions

In conclusion, the structure of the plant community, both woody and herbaceous, was complex but uneven. This pattern was highlighted by noticeable differences in species abundance and the ecological dominance of certain species within the community. While quantitative diversity calculations were not included in this study, the observed distribution patterns suggest variations in species composition and dominance that may be influenced by environmental factors and competitive interactions. Future studies incorporating diversity indices could provide further insight into these dynamics. Thus, in the case of trees, species such as C. monogyna, Q. robur or A. campestre tend to influence the community more due to an uneven distribution or a significant number of individuals present in the community. Of the 34 herbaceous species identified, only two were noted to be present in all three sites, namely G. urbanum and V. canina. Of the 15 woody species, only C. monogyna and Q. robur were noted as constant species in all three areas, which indicates a significant population of these species, a fact also supported by the increased frequencies and densities that were determined. It is also worth noting the absence of species such as P. spinosa or the reduced number and marginal position of the species R. canina in the Grădinile and Studinița areas, which prevented the re-sampling of some samples in the two forests. In the Vlădila Forest, 30 herbaceous species were found out of the total of 34 identified in the three areas, and the number of woody species identified in Vlădila was equal to the number of species identified in all three sites, namely 15.

Author Contributions

Conceptualization, S.C. and F.D.S.; methodology, F.D.S.; software, F.D.S.; validation, S.C.; formal analysis, F.D.S.; investigation, F.D.S.; writing—original draft preparation, S.C. and F.D.S.; writing—review and editing, S.C. and F.D.S.; supervision, S.C. All authors have read and agreed to the published version of the manuscript.

Funding

This research received no external funding.

Institutional Review Board Statement

Not applicable.

Data Availability Statement

The original contributions presented in this study are included in the article. Further inquiries can be directed to the corresponding author.

Conflicts of Interest

The authors declare no conflicts of interest.

References

  1. Threlfall, C.G.; Ossola, A.; Hahs, A.K.; Williams, N.S.; Wilson, L.; Livesley, S.J. Variation in vegetation structure and composition across urban green space types. Front. Ecol. Evol. 2016, 4, 66. [Google Scholar] [CrossRef]
  2. Lortie, C.J.; Brooker, R.W.; Choler, P.; Kikvidze, Z.; Michalet, R.; Pugnaire, F.I.; Callaway, R.M. Rethinking plant community theory. Oikos 2004, 107, 433–438. [Google Scholar] [CrossRef]
  3. Hodge, A.; Fitter, A.H. Microbial mediation of plant competition and community structure. Funct. Ecol. 2013, 27, 865–875. [Google Scholar] [CrossRef]
  4. Bayat, M.; Bettinger, P.; Heidari, S.; Hamidi, S.K.; Jaafari, A. A combination of biotic and abiotic factors and diversity determine productivity in natural deciduous forests. Forests 2021, 12, 1450. [Google Scholar] [CrossRef]
  5. Cheng, X.; Ping, T.; Li, Z.; Wang, T.; Han, H.; Epstein, H.E. Effects of environmental factors on plant functional traits across different plant life forms in a temperate forest ecosystem. New For. 2022, 53, 125–142. [Google Scholar] [CrossRef]
  6. Stoenescu, A.M.; Cosmulescu, S.N.; Gheorghiu, N. The influence of interannual climate variation on the phenology of some wild fruit species and their relation with avifauna. Sci. Pap. Ser. B Hortic. 2024, 68, 173–181. [Google Scholar]
  7. Smith, R.S.; Shiel, R.S.; Millward, D.; Corkhill, P. The interactive effects of management on the productivity and plant community structure of an upland meadow: An 8-year field trial. J. Appl. Ecol. 2000, 37, 1029–1043. [Google Scholar] [CrossRef]
  8. Hartel, T.; Hanspach, J.; Abson, D.J.; Máthé, O.; Moga, C.I.; Fischer, J. Bird communities in traditional wood-pastures with changing management in Eastern Europe. Basic Appl. Ecol. 2014, 15, 385–395. [Google Scholar] [CrossRef]
  9. Gharnit, Y.; Moujane, A.; Outourakhte, A.; Hassan, I.; El Amraoui, K.; Hasib, A.; Boulli, A. Plant Richness, Species Assessment, and Ecology in the M’goun Geopark Rangelands, High Atlas Mountains, Morocco. Rangel. Ecol. Manag. 2025, 98, 357–376. [Google Scholar] [CrossRef]
  10. Anitha, K.; Joseph, S.; Ramasamy, E.V.; Prasad, S.N. Changes in structural attributes of plant communities along disturbance gradients in a dry deciduous forest of Western Ghats, India. Environ. Monit. Assess. 2009, 155, 393–405. [Google Scholar] [CrossRef]
  11. Ferreira, P.M.; Andrade, B.O.; Podgaiski, L.R.; Dias, A.C.; Pillar, V.D.; Overbeck, G.E.; Mendonça, M.S., Jr.; Boldrini, I.I. Long-term ecological research in southern Brazil grasslands: Effects of grazing exclusion and deferred grazing on plant and arthropod communities. PLoS ONE 2020, 15, e0227706. [Google Scholar] [CrossRef] [PubMed]
  12. Vymazalová, P.; Košulič, O.; Hamřík, T.; Šipoš, J.; Hédl, R. Positive impact of traditional coppicing restoration on biodiversity of ground-dwelling spiders in a protected lowland forest. For. Ecol. Manag. 2021, 490, 119084. [Google Scholar] [CrossRef]
  13. Sabatini, F.M.; Burrascano, S.; Keeton, W.S.; Levers, C.; Lindner, M.; Pötzschner, F.; Verkerk, P.J.; Bauhus, J.; Buchwald, E.; Chaskovsky, O.; et al. Where are Europe’s last primary forests? Divers. Distrib. 2018, 24, 1426–1439. [Google Scholar] [CrossRef]
  14. Romeiro, J.M.N.; Eid, T.; Antón-Fernández, C.; Kangas, A.; Trømborg, E. Natural disturbances risks in European Boreal and Temperate forests and their links to climate change–A review of modelling approaches. For. Ecol. Manag. 2022, 509, 120071. [Google Scholar] [CrossRef]
  15. Chiarucci, A.; Piovesan, G. Need for a global map of forest naturalness for a sustainable future. Conserv. Biol. 2020, 34, 368–372. [Google Scholar] [CrossRef]
  16. Leidinger, J.; Blaschke, M.; Ehrhardt, M.; Fischer, A.; Gossner, M.M.; Jung, K.; Kienlein, S.; Kózak, J.; Michler, B.; Mosandl, R.; et al. Shifting tree species composition affects biodiversity of multiple taxa in Central European forests. For. Ecol. Manag. 2021, 498, 119552. [Google Scholar] [CrossRef]
  17. Johnson, D.J.; Magee, L.; Pandit, K.; Bourdon, J.; Broadbent, E.N.; Glenn, K.; Kaddoura, Y.; Machado, S.; Nieves, J.; Wilkinson, B.E.; et al. Canopy tree density and species influence tree regeneration patterns and woody species diversity in a longleaf pine forest. For. Ecol. Manag. 2021, 490, 119082. [Google Scholar] [CrossRef]
  18. Angessa, A.T.; Lemma, B.; Yeshitela, K.; Fischer, J.; May, F.; Shumi, G. Woody plant diversity, composition and structure in relation to environmental variables and land-cover types in Lake Wanchi watershed, central highlands of Ethiopia. Afr. J. Ecol. 2020, 58, 627–638. [Google Scholar] [CrossRef]
  19. Shumi, G.; Rodrigues, P.; Hanspach, J.; Haerdtle, W.; Hylander, K.; Senbeta, F.; Fischer, J.; Schultner, J. Woody plant species diversity as a predictor of ecosystem services in a social–ecological system of southwestern Ethiopia. Landsc. Ecol. 2021, 36, 373–391. [Google Scholar] [CrossRef]
  20. Ilie, D.; Cosmulescu, S. Spontaneous plant diversity in urban contexts: A review of its impact and importance. Diversity 2023, 15, 277. [Google Scholar] [CrossRef]
  21. Morin, X.; Toigo, M.; Fahse, L.; Guillemot, J.; Cailleret, M.; Bertrand, R.; Cateau, E.; de Coligny, F.; García-Valdés, R.; Ratcliffe, S.; et al. More species, more trees: The role of tree packing in promoting forest productivity. J. Ecol. 2025. [Google Scholar] [CrossRef]
  22. Tinya, F.; Kovács, B.; Bidló, A.; Dima, B.; Király, I.; Kutszegi, G.; Lakatos, F.; Mag, Z.; Márialigeti, S.; Nascimbene, J.; et al. Environmental drivers of forest biodiversity in temperate mixed forests–A multi-taxon approach. Sci. Total Environ. 2021, 795, 148720. [Google Scholar] [CrossRef] [PubMed]
  23. Hämäläinen, A.; Runnel, K.; Ranius, T.; Strengbom, J. Diversity of forest structures important for biodiversity is determined by the combined effects of productivity, stand age, and management. Ambio 2024, 53, 718–729. [Google Scholar] [CrossRef] [PubMed]
  24. Singh, M.; Kumar, A.; Sharma, M. Conservation of wildlife diversity in agroforestry systems in eastern Himalayan biodiversity hotspot. Proc. Zool. Soc. 2021, 74, 171–188. [Google Scholar] [CrossRef]
  25. Cosmulescu, S.; Ștefănescu, D.; Stoenescu, A.M. Variability of phenological behaviours of wild fruit tree species based on discriminant analysis. Plants 2021, 11, 45. [Google Scholar] [CrossRef]
  26. Hanberry, B.B.; Bragg, D.C.; Alexander, H.D. Open forest ecosystems: An excluded state. For. Ecol. Manag. 2020, 472, 118256. [Google Scholar] [CrossRef]
  27. Seidl, R.; Honkaniemi, J.; Aakala, T.; Aleinikov, A.; Angelstam, P.; Bouchard, M.; Boulanger, Y.; Burton, P.J.; De Grandpre, L.; Gauthier, S.; et al. Globally consistent climate sensitivity of natural disturbances across boreal and temperate forest ecosystems. Ecography 2020, 43, 967–978. [Google Scholar] [CrossRef]
  28. Li, T.; Kamran, M.; Chang, S.; Peng, Z.; Wang, Z.; Ran, L.; Jiang, W.Q.; Jin, Y.; Zhang, X.; Tu, Y.; et al. Climate-soil interactions improve the stability of grassland ecosystem by driving alpine plant diversity. Ecol. Indic. 2022, 141, 109002. [Google Scholar] [CrossRef]
  29. Yang, D.; Yang, Y.; Xia, J. Hydrological cycle and water resources in a changing world: A review. Geogr. Sustain. 2021, 2, 115–122. [Google Scholar] [CrossRef]
  30. Zhong, M.; Song, J.; Zhou, Z.; Ru, J.; Zheng, M.; Li, Y.; Hui, D.; Wan, S. Asymmetric responses of plant community structure and composition to precipitation variabilities in a semi-arid steppe. Oecologia 2019, 191, 697–708. [Google Scholar] [CrossRef]
  31. Yao, Z.; Xin, Y.; Yang, L.; Zhao, L.; Ali, A. Precipitation and temperature regulate species diversity, plant coverage and aboveground biomass through opposing mechanisms in large-scale grasslands. Front. Plant Sci. 2022, 13, 999636. [Google Scholar] [CrossRef] [PubMed]
  32. Stamin, F.D.; Vijan, L.E.; Topală, C.M.; Cosmulescu, S.N. The influence of genotype, environmental factors, and location on the nutraceutical profile of Rosa canina L. Fruits. Agronomy 2024, 14, 2847. [Google Scholar] [CrossRef]
  33. Battes, K. Ecologie Generală Ghid de Lucrări Practice; Editura Presa Universitară Clujeană: Cluj-Napoca, Romania, 2018. [Google Scholar]
  34. Ciocârlan, V. Flora Ilustrată a României: Pteridophyta et Spermatophyta; Editura Ceres: București, Romania, 2009. [Google Scholar]
  35. Sârbu, I.; Ștefan, N.; Oprea, A. Plante Vasculare din România Determinator ilustrat de teren; Editura Victor B Victor: București, Romania, 2013. [Google Scholar]
  36. Preda, C.; Ruști, D.M.; Cogălniceanu, D. Lucrări Practice de Ecologie Generală; Editura Universitară: București, Romania, 2020. [Google Scholar]
  37. Sîrbu, I.; Benedek, A.M. Ecologie Practică; Editura Universităţii “Lucian Blaga” din Sibiu: Sibiu, Romania, 2012. [Google Scholar]
  38. Botnariuc, N.; Vădineanu, A. Ecologie; Editura Didactică şi Pedagogică: București, Romania, 1982. [Google Scholar]
  39. McNaughton, S.J.; Wolf, L.L. Dominance and the Niche in Ecological Systems: Dominance is an expression of ecological inequalities arising out of different exploitation strategies. Science 1970, 167, 131–139. [Google Scholar] [CrossRef] [PubMed]
  40. Cartozo, C.C.; Garlaschelli, D.; Ricotta, C.; Barthélemy, M.; Caldarelli, G. Quantifying the taxonomic diversity in real species communities. J. Phys. A Math. Theor. 2008, 41, 224012. [Google Scholar] [CrossRef]
  41. Heinen, R.; Hannula, S.E.; De Long, J.R.; Huberty, M.; Jongen, R.; Kielak, A.; Steinauer, K.; Zhu, F.; Bezemer, T.M. Plant community composition steers grassland vegetation via soil legacy effects. Ecol. Lett. 2020, 23, 973–982. [Google Scholar] [CrossRef]
  42. Stoenescu, A.M.; Cosmulescu, S. Variability of morphological characteristics in hawthorn (Crataegus monogyna L.) fruit genotypes. South-West J. Hortic. Biol. Environ. 2020, 11, 15–26. [Google Scholar]
  43. Stamin, F.D.; Cosmulescu, S.N. Morphological variability of some rosehip fruits (Rosa canina L.) from the spontaneous flora of Olt county, Romania. Sci. Pap. Ser. B Hortic. 2024, 68, 159–164. [Google Scholar]
  44. Leca, Ș.; Popa, I.; Chivulescu, Ș.; Popa, A.; Pitar, D.; Dobre, A.C.; Pascu, I.S.; Apostol, B.; Badea, O. Structure and diversity in a periurban forest of Bucharest, Romania. Ann. For. Res. 2023, 66, 139–153. [Google Scholar] [CrossRef]
  45. Fichtner, A.; Wissemann, V. Biological flora of the British isles: Crataegus monogyna. J. Ecol. 2021, 109, 541–571. [Google Scholar] [CrossRef]
  46. Altay, V. Ecology of Pinus sylvestris L. forests—A case study from Istanbul (Turkey). Pak. J. Bot. 2019, 51, 1711–1718. [Google Scholar] [CrossRef]
  47. Afifi, L.; Lapin, K.; Tremetsberger, K.; Konrad, H. A systematic review of threats, conservation, and management measures for tree species of the family Rosaceae in Europe. Flora 2023, 301, 152244. [Google Scholar] [CrossRef]
  48. Zhang, Y.; Qi, S.; Zhang, L.; Guo, Y.; Zhang, D.; Liu, S.; Ma, L.; Hu, J.; Lu, J.; Wang, X. Optimizing Pinus tabuliformis Forest Spatial Structure and Function in Beijing, China. Forests 2024, 15, 1963. [Google Scholar] [CrossRef]
Figure 1. Geographical location of the analyzed forest areas.
Diversity 17 00277 g001
Figure 2. Biodiversity indices for the three forests.
Diversity 17 00277 g002
Table 1. Analysis of community structural indices in samples for woody species from the three studied areas.
Structural IndicesXSDLCDPFCWID
Species
Grădinile Forest
1. Crataegus monogyna13.912.257.5961.23100Constant61.2354.95
2. Quercus robur53.892.4164.1090Constant57.69
3. Ulmus minor2.57.234.4896.1520Accidental19.23
4. Acer campestre0.92.851.763.9610Accidental0.39
5. Gleditsia triacanthos0.20.630.390.8820Accidental0.18
6. Acer tataricum0.10.320.200.4410Accidental0.04
7. Rosa canina0.10.320.201.3210Accidental0.13
Studinița Forest
1. Acer campestre34.187.9354.5042.1030Accessory12.6377.53
2. Crataegus monogyna28.719.4112.0335.43100Constant35.43
3. Ligustrum vulgare7.919.0211.799.7520Accidental1.95
4. Quercus robur5.86.534.057.1690Constant6.44
5. Rosa canina3.65.443.374.4440Accessory1.78
6. Acer tataricum0.51.580.980.6210Accidental0.06
7. Gleditsia triacanthos0.20.420.260.2520Accidental0.05
8. Prunus cerasifera0.10.320.200.1210Accidental0.01
9. Robinia pseudoacacia0.10.320.200.1210Accidental0.01
Vlădila Forest
1. Crataegus monogyna39.9143.1225.4865.62100Constant65.6278.33
2. Prunus spinosa7.7317.8910.5712.7154.54Constant6.93
3. Quercus robur2.642.691.594.3363.64Constant2.76
4. Robinia pseudoacacia2.648.094.784.3327.27Accessory1.18
5. Rosa canina2.452.071.224.0427.73Accessory2.94
6. Acer campestre2.094.612.733.4427.27Accessory0.94
7. Frangula alnus1.182.321.371.9427.27Accessory0.53
8. Ligustrum vulgare0.731.851.091.2018.18Accidental0.22
9. Ulmus minor0.551.040.610.9027.27Accessory0.24
10. Prunus cerasifera0.450.820.480.7527.27Accessory0.20
11. Acer tataricum0.090.300.180.159.09Accidental0.01
12. Euonymus europaeus0.090.300.180.159.09Accidental0.01
13. Fraxinus excelsior0.090.300.180.159.09Accidental0.01
14. Gleditsia triacanthos0.090.300.180.159.09Accidental0.01
15. Pyrus pyraster0.090.300.180.159.09Accidental0.01
Note: X = Arithmetic mean of individuals; SD = Standard Deviation; LC = Confidentiality limits; DP = Percentage Density; F = Frequency; C = Constancy; W = Index of Relative Significance; ID = Dominance index.
Table 2. Analysis of structural indices of the community in the samples with central species Crataegus monogyna in the three areas studied.
Structural IndicesXSDLCDPFCWID
Species
Grădinile Forest
1. Glechoma hederacea7.817.4415.2936.7920Accidental7.3658.49
2. Geum urbanum4.610.299.0221.7020Accidental4.34
3. Viola canina48.947.8418.8720Accidental3.77
4. Carex sylvatica3.66.996.1216.9840Accessory6.79
5. Allium scorodoprasum0.61.341.182.8320Accidental0.57
6. Fallopia convolvus0.61.341.182.8320Accidental0.57
Studinița Forest
1. Agrimonia eupatoria16.631.1427.3044.6260Constant26.7761.83
2. Fragaria vesca6.47.166.2817.2060Constant10.32
3. Viola canina4.89.158.0212.9040Accessory5.16
4. Hypericum perforatum3.44.674.099.1440Accessory3.66
5. Carex sylvatica2.43.913.436.4540Accessory2.58
6. Geum urbanum1.82.492.184.8440Accessory1.94
7. Mentha pulegium1.84.023.534.8420Accidental0.97
Vlădila Forest
1. Lithospermum purpurocaeruleum9.412.9211.3225.2740Accessory10.1120.81
2. Fallopia convolvus69.198.0616.1360Constant9.68
3. Festuca arundinacea5.612.5210.9815.0520Accidental3.01
4. Fragaria vesca3.44.103.599.1460Constant5.48
5. Anthriscus cerefolium3.27.166.278.6020Accidental1.72
6. Geranium pusillum2.24.924.315.9120Accidental1.18
7. Prunella vulgaris23.463.045.3840Accessory2.15
8. Geum urbanum1.82.682.354.8440Accessory1.94
9. Rubus caesius1.63.583.144.3020Accidental0.86
10. Viola canina1.63.583.144.3020Accidental0.86
11. Asparagus tenuifolius0.40.890.7810020Accidental20
Note: X = Arithmetic mean of individuals; SD = Standard Deviation; LC = Confidentiality limits; DP = Percentage Density; F = Frequency; C = Constancy; W = Index of Relative Significance; ID = Dominance index.
Table 3. Analysis of structural indices of the community in the control samples in the three areas studied.
Structural IndicesXSDLCDPFCWID
Species
Grădinile Forest
1. Geum urbanum11.88.647.57521.3880Constant17.1042.39
2. Carex sylvatica11.611.5910.1621.0160Constant12.61
3. Glechoma hederacea11.625.9422.7421.0120Accidental4.20
4. Torilis arvensis7.816.3514.3314.1340Accessory5.65
5. Viola canina7.414.9313.0813.4140Accessory5.36
6. Lamium purpureum2.45.374.704.3520Accidental0.87
7. Fallopia convolvus1.43.132.742.5420Accidental0.51
8. Malva sylvestris12.241.961.8120Accidental0.36
9. Urtica dioica0.20.450.390.3620Accidental0.07
Studinița Forest
1. Viola canina3.43.583.142560Constant2.9441.18
2. Fragaria vesca2.22.862.5116.1860Constant9.71
3. Ballota nigra1.82.492.1813.2460Constant7.94
4. Geum urbanum1.81.791.5713.2460Constant7.94
5. Agrimonia eupatoria1.62.302.0211.7640Accessory4.71
6. Astragalus glycyphyllos1.21.791.578.8240Accessory3.53
7. Ornithogalum pyramidale11.411.247.3540Accessory15
8. Filipendula vulgaris0.40.890.792.9420Accidental0.59
9. Hypericum perforatum0.20.450.391.4720Accidental0.29
Vlădila Forest
1. Galium verum1520.7818.2220.8340Accessory8.3327.78
2. Lamium purpureum11.225.0421.9515.5620Accidental3.11
3. Urtica dioica8.819.6817.2512.2220Accidental2.44
4. Festuca arundinacea8.612.4010.8711.9440Accessory4.78
5. Asparagus tenuifolius7.413.9212.2010.2840Accessory4.11
6. Alkekengi officinarum4.610.299.026.3920Accidental1.28
7. Rubus caesius45.875.155.5640Accessory2.22
8. Sambucus ebulus24.473.922.7820Accidental0.56
9. Geum urbanum1.84.023.532.5020Accidental0.50
10. Ornithogalum pyramidale1.84.023.532.5020Accidental0.50
11. Hypericum perforatum1.22.682.351.6720Accidental0.33
12. Fragaria vesca11.411.241.3940Accessory0.56
13. Mentha pulegium12.241.961.3920Accidental0.28
14. Lithosperumum purpurocaeruleu0.81.791.571.1120Accidental0.22
15. Allium scorodoprasum0.61.341.180.8320Accidental0.17
16. Prunella vulgaris0.60.890.780.8340Accessory0.33
17. Silene vulgaris0.61.341.180.8320Accidental0.17
18. Ballota nigra0.40.890.780.5620Accidental0.11
19. Moscari comosum0.40.890.780.5620Accidental0.11
20. Viola canina0.20.450.390.2820Accidental0.06
Note: X = Arithmetic mean of individuals; SD = Standard Deviation; LC = Confidentiality limits; DP = Percentage Density; F = Frequency; C = Constancy; W = Index of Relative Significance; ID = Dominance index.
Table 4. Analysis of structural indices of the community in the samples with central species Rosa canina in Vlădila Forest.
Structural IndicesXSDLCDPFCWID
Species
1. Fragaria vesca9.8313.3610.6938.8250Constant19.4161.84
2. Alkekengi officinarum5.8310.858.6823.0333.33Accessory7.68
3. Rubus caesius3.335.854.6813.1650Constant6.58
4. Lamium purpureum1.834.493.597.2416.67Accidental1.21
5. Geum urbanum1.502.812.255.9233.33Accessory1.97
6. Matricaria recutita1.172.862.294.6116.67Accidental0.77
7. Glechoma hederacea0.832.041.633.2916.67Accidental0.55
8. Pentanema salicinum0.832.041.633.2916.67Accidental0.55
9. Silene vulgaris0.170.410.330.6616.67Accidental0.11
Note: X = Arithmetic mean of individuals; SD = Standard Deviation; LC = Confidentiality limits; DP = Percentage Density; F = Frequency; C = Constancy; W = Index of Relative Significance; ID = Dominance index.
Table 5. Analysis of structural indices of the community in the samples with cu central species Prunus spinosa in Vlădila Forest.
Structural IndicesXSDLCDPFCWID
Species
1. Ballota nigra15.619.9166060Constant3670.77
2. Filipendula vulgaris2.86.261.8910.7720Accidental2.15
3. Rubus caesius23.080.937.6940Accessory3.08
4. Lithospermum purpurocaeruleum1.84.021.216.9220Accidental1.38
5. Scrophularia nodosa11.410.433.8540Accessory1.54
6. Astragalus glycyphyllos0.60.890.272.3140Accessory0.92
7. Cannabis sativa subsp. Spontanea0.60.890.272.3120Accidental0.46
8. Viola canina0.61.340.402.3120Accidental0.46
9. Ornithogalum pyramidale0.40.550.171.5440Accessory0.62
10. Allium scorodoprasum0.20.450.130.7720Accidental0.15
11. Asparagus tenuifolius0.20.450.130.7720Accidental0.15
12. Muscari comosum0.20.450.130.7720Accidental0.15
Note: X = Arithmetic mean of individuals; SD = Standard Deviation; LC = Confidentiality limits; DP = Percentage Density; F = Frequency; C = Constancy; W = Index of Relative Significance; ID = Dominance index.
Disclaimer/Publisher’s Note: The statements, opinions and data contained in all publications are solely those of the individual author(s) and contributor(s) and not of MDPI and/or the editor(s). MDPI and/or the editor(s) disclaim responsibility for any injury to people or property resulting from any ideas, methods, instructions or products referred to in the content.

