Article

Soil Moisture and Litter Coverage Drive the Altitude Gradient Pattern of Soil Arthropods in a Low-Elevation Mountain

School of Life Sciences, Qufu Normal University, Qufu 273165, China
*
Authors to whom correspondence should be addressed.
Diversity 2024, 16(5), 263; https://doi.org/10.3390/d16050263
Submission received: 4 April 2024 / Revised: 15 April 2024 / Accepted: 22 April 2024 / Published: 27 April 2024

Abstract

:
This study sought to investigate the vertical distribution pattern of the soil faunal community in a low-altitude mountain area. On 8 July 2022, a low hill was selected as the study area, and soil arthropods were collected through traps. The leaf litter, vegetation type, and distribution quantity of each sampling site were investigated while the soil faunae were collected. In addition, the soil’s physical and chemical parameters were measured. The results of a one-way ANOVA showed that there were significant differences (p < 0.05) in the soil properties, leaf litter, and plant quantities at different altitudes within the research area. A total of 1086 soil arthropods, belonging to five classes and ten orders, were collected during the study period. The dominant species of soil arthropods at different altitudes were significantly different. The dominant species in low-altitude areas were Armadillidium sp. and Aethus nigritus. However, Eupolyphaga sinensis and Philodromidae were the dominant species in high-altitude areas. The results of a non-metric multidimensional scaling (NMDS) analysis showed that the soil faunae at different altitudes were clustered into two communities: a high-altitude community and a low-altitude community. With the increase in altitude, the species richness of the soil arthropods gradually decreased, and their abundance showed a decreasing trend. A redundancy analysis (RDA) of the soil arthropods and environmental factors showed that soil moisture (p < 0.01), pH (p < 0.01) and defoliation (p < 0.05) had significant effects on the distribution of the soil fauna. The results of a Pearson correlation analysis indicated that different environmental factors had interactive effects on the distribution of the soil arthropods. The quantity and species richness of the soil arthropods in different sample lines were tested using a variance analysis. The results showed that there were significantly smaller quantities of soil arthropods in the sampling line closer to the trekking ladder. This indicates that human tourism, namely mountaineering activities, had a direct impact on the soil fauna. This study can provide a reference for and data support in the development of biodiversity conservation measures for forest parks in low mountain areas.

1. Introduction

Soil faunae are an important component of the earth’s biodiversity. They play a complex role in affecting and regulating the physicochemical properties and nutrient processes of soil ecosystems [1]. Soil faunae primarily include mollusks, nematodes, annelids, tardigrades, and arthropods [2]. They play an irreplaceable role in maintaining the balance of the soil ecosystem and accelerating the flow of energy and material circulation [3].
Recent studies have found that both seasonal changes and differences in environmental factors have a certain degree of influence on the composition and distribution of soil fauna [4,5]. Some researchers studied the soil fauna in four different habitats in the Nianchu River Basin and found significant seasonal differences in the ecological niche width but no significant differences in the soil fauna’s diversity between spring and summer [6]. Furthermore, other researchers found that the diversity of soil fauna species and their abundance were higher in natural forests with diverse vegetation types and complex vegetation community structures [7]. In addition to climate change and environmental factors, many scholars have also studied the composition and distribution characteristics of soil fauna at different altitudes. For example, a study on the vertical distribution pattern of the soil fauna in the Western Tianshan Mountain found that the litter density of the large soil fauna in summer gradually decreased with increasing altitude [8]. Another study reported a clear “surface aggregation phenomenon” in the vertical distribution of the soil fauna communities in the soil layers of Wuyi Mountain [9]. In recent years, researchers have explored the responses of soil faunae to altitude gradients in their interaction with plants and found that their diversity at different altitude gradients had a direct impact on their interactions with plants [10]. Overseas studies found that the soil fauna’s habitats significantly influenced their community structure. For example, topography, elevation, and vegetation type all had significant effects on the soil fauna communities [11]. At the regional scale, the change in elevation gradient was found to be one of the main factors affecting the pattern of soil fauna diversity [12]. Currently, research on the altitudinal gradient patterns of soil fauna is mainly focused on higher-altitude mountain areas [13,14]. However, in the context of severe global climate change, almost all types of soil fauna have been impacted [15]. The altitudinal distribution characteristics of the soil fauna in low-altitude mountain areas under climate change remain unknown.
In this study, the low-elevation hills (hereinafter referred to as Shimen Mountain) in the Shimen Mountain National Forest Park, Qufu, Shandong Province, were selected as the research area. The characteristics of the soil fauna’s community structure and its main influencing factors at different altitudinal gradients were explored. This study aimed to accumulate data for research on the altitudinal gradient distribution patterns of soil fauna. The research results will provide a reference and data support for the development of biodiversity conservation measures in the Shimen Mountain National Forest Park.

2. Study Area and Research Methods

2.1. Plot Description

In this study, the experimental plots were located in the Shimen Mountain Scenic Area, Qufu (117.09° E, 35.78° N), which is situated 25 km northeast of Qufu City (Figure 1A). The study area falls under a temperate continental monsoon climate, characterized by four distinct seasons: abundant sunlight, dry springs and autumns, rainy summers, and cold and dry winters with little snowfall [16]. The main peak of Shimen Mountain has an elevation of 406 m above sea level, with acidic soil. The predominant vegetation in the area includes Platycladus orientalis, Celtis bungeana, Quercus variabilis, Styphnolobium japonicum, Acer pictum and so on.

2.2. Research Methods

2.2.1. Sampling Plot Setting, Soil Arthropod Collection and Treatment

In 8–13 July 2022, the research team conducted soil arthropod sampling at different altitudinal gradients in Shimen Mountain using pitfall traps [17] (Figure 1B,C). Starting from the foot of the mountain (150 m above sea level) and reaching the mountaintop (400 m above sea level), one plot was erected every 50 m, resulting in a total of 6 study plots, named Plots 1, 2, 3, 4, 5 and 6, arranged from low to high altitude. Three sampling lines were established at each altitudinal gradient (Figure 1A). Line 1 was 5 m away from the mountain climbing stairs, Line 2 was 15 m away, and Line 3 was 25 m away. Three sampling traps were set up along each transect, resulting in 9 sampling repetitions for each altitude (Figure 1B).
When collecting the soil arthropods in the field, they were filtered in the trap using a mesh. The soil arthropod samples were transferred into 200 mL plastic sample bottles and fixed with 75% alcohol. In the laboratory, morphological classification, identification, and counting were carried out under an OLYMPUS SZX16 stereo microscope. In this study, the soil arthropods were identified to the family level. A few soil arthropods were identified to the species level. The identification of the soil arthropods was mainly based on the “Chinese soil Animal Retrieval Map” [18] and “Insect Classification Retrieval” [19].

2.2.2. Environmental Factor Determination

When collecting soil fauna samples, the vegetation conditions of each plot were recorded using systematic methods. Around each pitfall trap in each plot, three quadrats were established to record the vegetation species and quantity. The quadrat size for arbors was 10 m × 10 m; that for shrubs was 5 m × 5 m; and that for herbaceous plants was 1 m × 1 m. The species and quantities of arbors, shrubs, and herbaceous plants were recorded separately. The leaf litter weight per unit area (1 m2) was determined in the laboratory (accurate to 0.01 kg). Three traps were selected at each plot. Around them, the fresh soil samples 10 cm below the surface were collected to determine soil pH and moisture content. In the laboratory, soil pH value was analyzed using potentiometry, with a ratio of water to soil being 2.5:1 [20]. The soil moisture content was determined using the natural-drying method. The fresh soil samples were weighed, then dried over 10 days and weighed again. The water content was calculated as follows [21]:
%H2O = (fresh weight − dry weight)/fresh weight × 100

2.2.3. Data Analysis

A statistical analysis of the soil fauna species, quantities, etc., at different altitudinal gradients was conducted using commonly used community ecology software, including Statistica 7.0 (StatSoft Inc., Tulsa, OK 74104, USA), Primer 5.0 [22], and Canoco for Windows 4.5 (Microcomputer Power Co., New York, NY, USA). The statistical analyses included community clustering and canonical correspondence analysis. The differences in the soil fauna at different altitudes were tested using a one-way analysis of variance (ANOVA) and post hoc multiple comparisons using the least significant difference test (LSD test). A p < 0.05 showed that there were significant differences. Non-metric multi-dimensional ranking (NMDS) based on the individual number of soil fauna was used for community similarity analysis (ANOSIM) and community clustering. Canoco for Windows 4.5 was used to analyze the effects of environmental factors on soil animals, such as redundancy analysis (RDA). The environmental factors that had a significant impact on the soil fauna community were determined through a Monte Carlo test. In Statistica 7.0 software, soil arthropod abundance and environmental factors were analyzed by Fitting and Pearson correlation analyses. Log (x + 1) transformation was performed on all data before statistical analysis.

3. Results

3.1. Environmental Factors

The results of the variance analysis showed that there were significant differences in the environmental factors in sampling areas with different altitudinal gradients (Figure 2). With the increase in the elevation gradient, the soil moisture content in Plot 1 (150 m above sea level) decreased significantly but was significantly higher than that in the other plots (p < 0.05) (Figure 2A). The soil acidity of Plot 3 (250 m above sea level) was significantly higher than that of the other plots (p < 0.05) (Figure 2B). The density of arbors in the sample plot decreased with the elevation gradient, and the density of arbors in the low-altitude areas was significantly higher than that in the high-altitude areas (p < 0.05) (Figure 2C). The shrub densities of Plot 1 (150 m above sea level) and Plot 4 (300 m above sea level) were significantly lower than those of the other four plots (p < 0.05) (Figure 2D). This result indicated that the growth of shrubs could have been limited by some environmental factors, such as the soil moisture, nutrients, or light. With the increase in the elevation gradient, the herbaceous plant density in the sample plot showed a downward trend, and there was a significant difference (p < 0.05) (Figure 2E). The defoliation per unit area of Plot 1 (150 m above sea level) and Plot 6 (400 m above sea level) was significantly higher than that of the other plots (p < 0.05) (Figure 2F).

3.2. Species Composition of Soil Arthropods

A total of 1086 soil faunae were collected in this study, belonging to ten orders within five classes (Figure 3). Among them, 697 were Armadillidium sp., accounting for 64.18% of the total. There were 99 Eupolyphaga sinensis, accounting for 9.12%. There were 91 Aethus nigritus, accounting for 8.38%. Finally, there were 23 Philodromidae, accounting for 2.12% (Figure 3). Different species numbers of soil arthropods were collected at different elevations. From Plot 1 to 6, 12, 14, 18, 13, 19, and 11 species of soil arthropods were collected, respectively. A comparative analysis using the dominance index revealed that the dominant species in the low-altitude areas (Plots 1 and 2) were Crustacea and Insecta, with the most abundant being Armadillidium sp. of Isopoda and Aethus nigritus of Coleoptera. By contrast, the dominant species in the high-altitude areas (Plots 3, 4, 5, and 6) were Eupolyphaga sinensis of Insecta and spiders of Philodromidae.

3.3. Soil Arthropod Community Structure

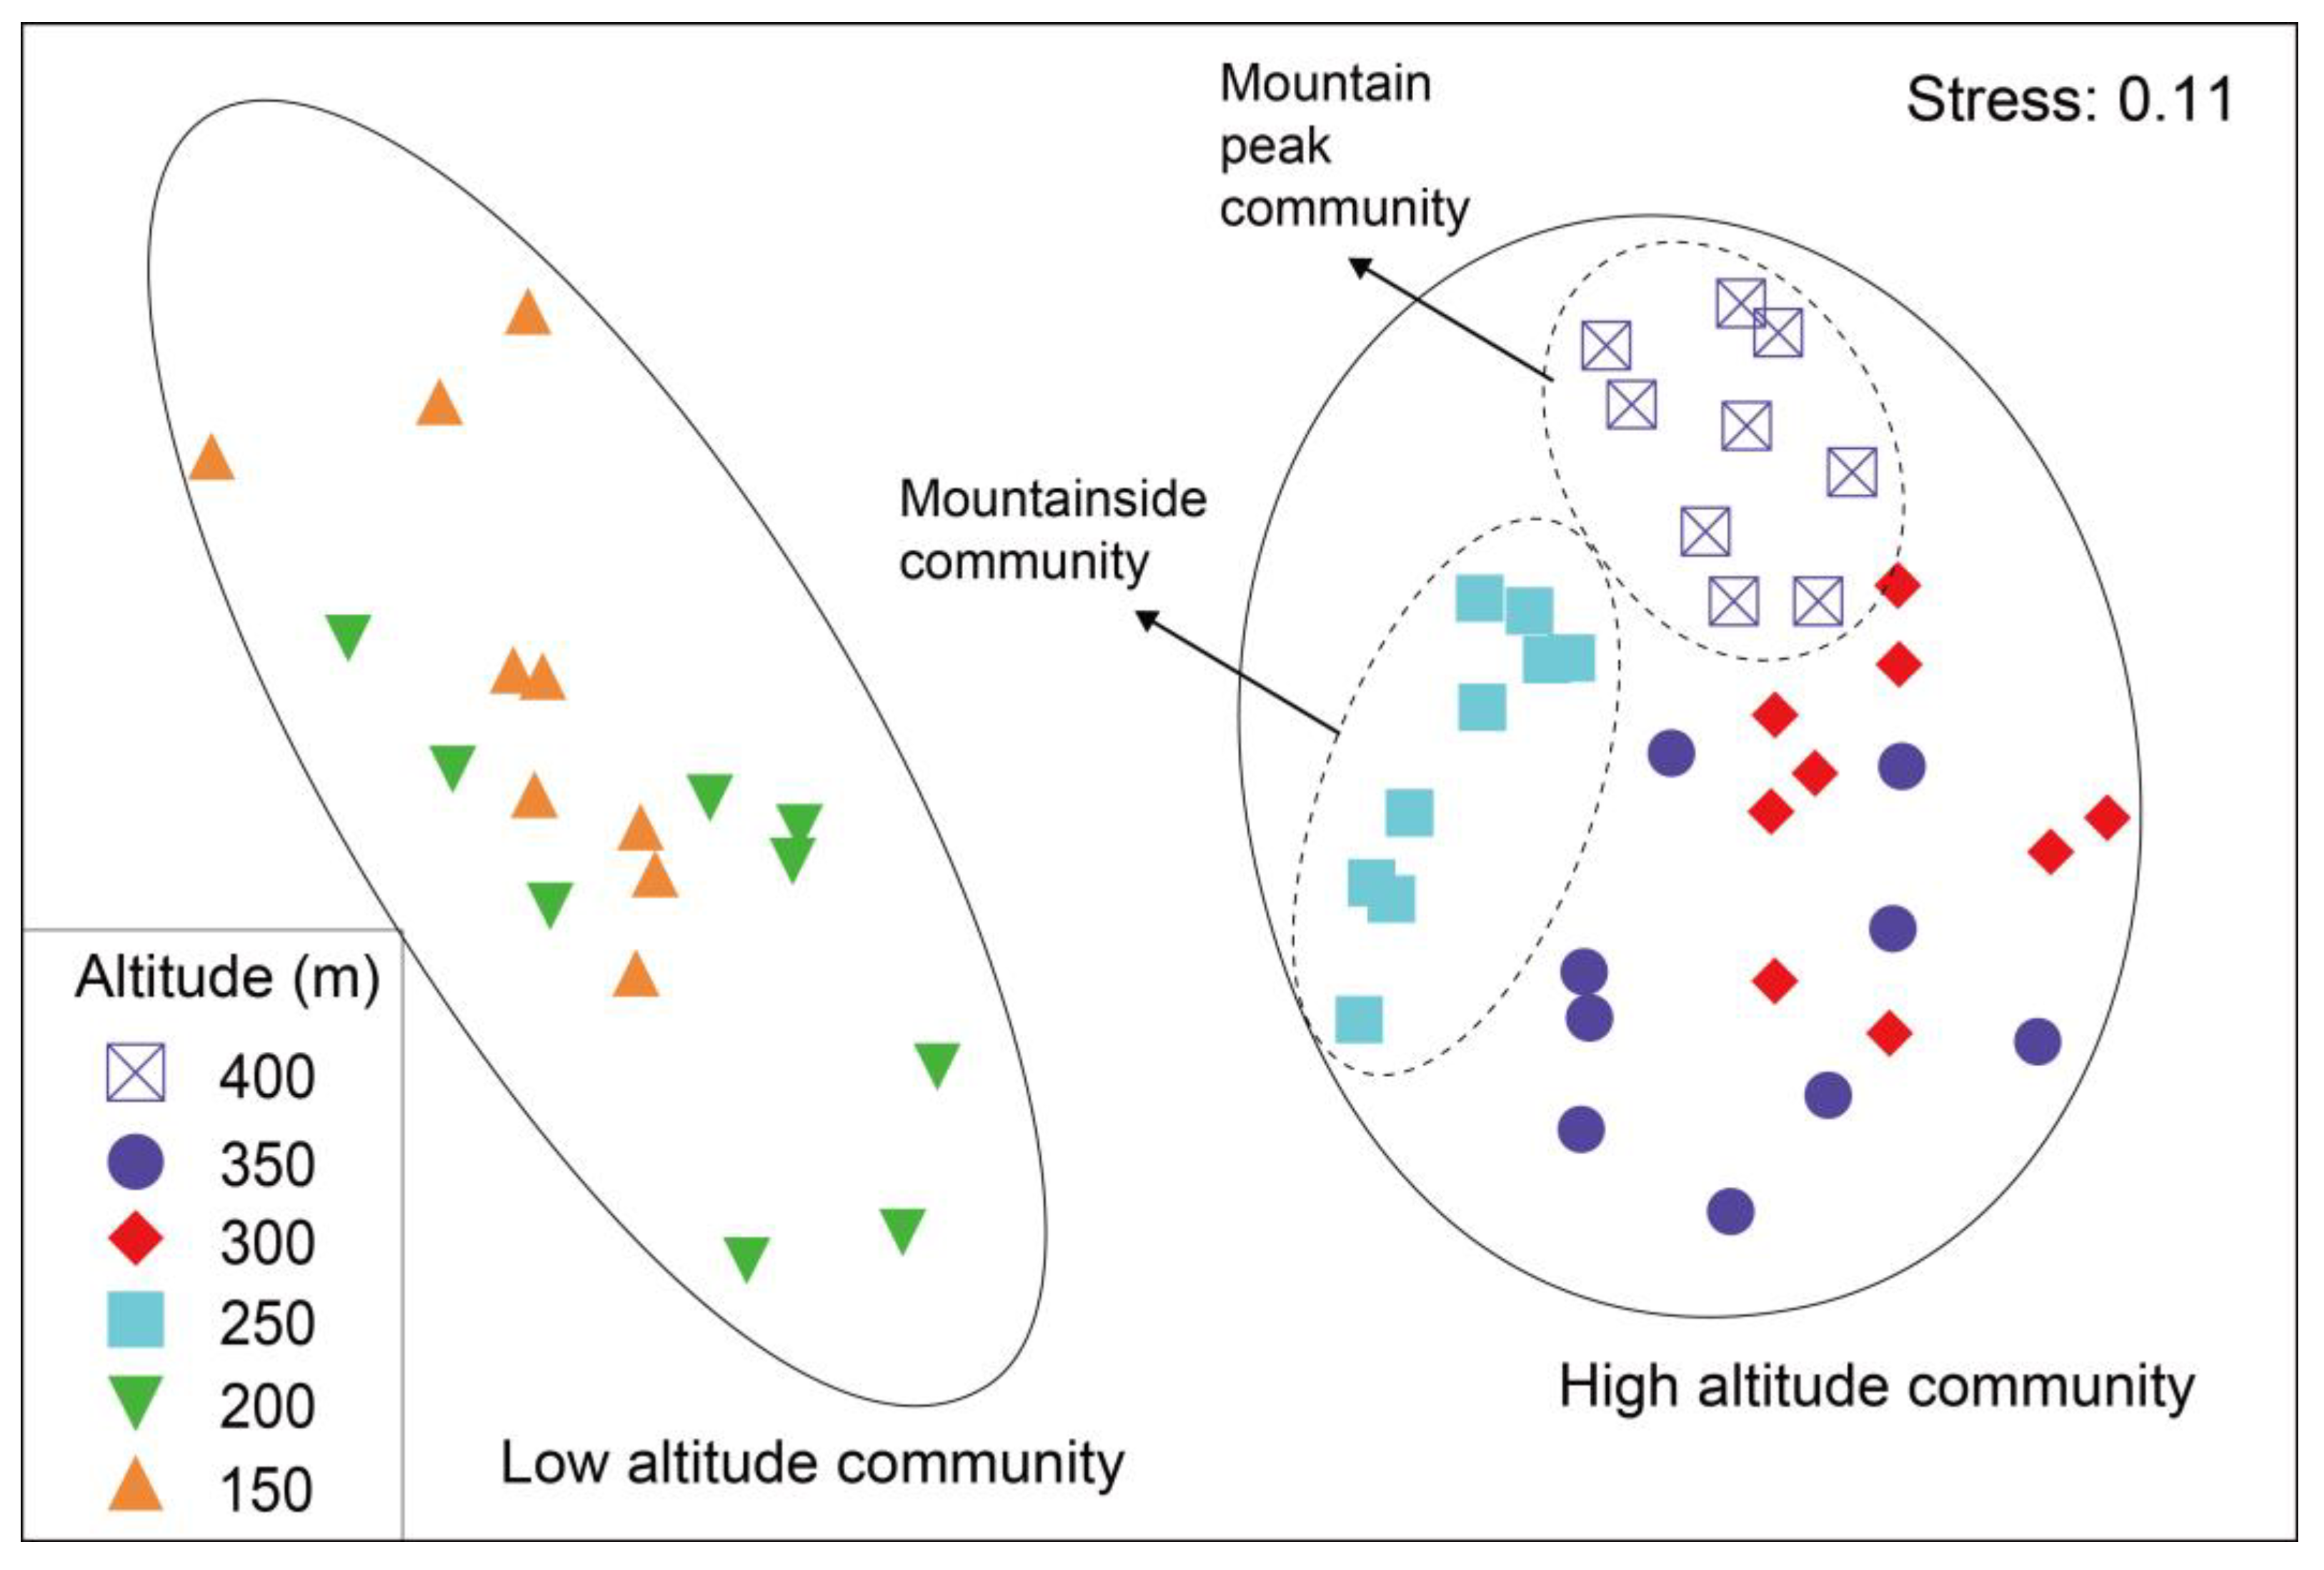
In the non-metric multidimensional scaling (NMDS) analysis of soil arthropod abundance, the results indicated that the soil arthropods at different altitudinal gradients in Shimen Mountain clustered into two main communities: high-altitude and low-altitude communities (Figure 4). There was a significant difference in soil arthropod community structure between the high-altitude and low-altitude areas (global test: R = 0.962, p = 0.001). The species composition and abundance of the soil arthropods differed significantly between the low-altitude (Plots 1 and 2) and high-altitude areas (Plots 3, 4, 5, and 6). The dominant species in the low-altitude areas were soil arthropods adapted to moist environments, such as Armadillidium sp. Meanwhile, the dominant species in the high-altitude areas were soil arthropods adapted to dry environments, such as Eupolyphaga sinensis. Additionally, within the high-altitude areas, the soil arthropod communities at the mountain peak and mountain slope had distinct characteristics and significantly differed from the soil arthropods at other altitudes (global test: R = 0.507, p = 0.001). The number of Eupolyphaga sinensis at the mountain peak (Plot 6) was significantly higher than that at the mountain slope (Plot 3). Meanwhile, Scarabaeidae insects were only distributed at higher altitudes between the mountain peak and mountain slope (Plots 4 and 5). Overall, with increasing altitude, there was a gradual decrease in the number of soil arthropod species and their quantities.

3.4. Impact of Environmental Factors on Soil Arthropods

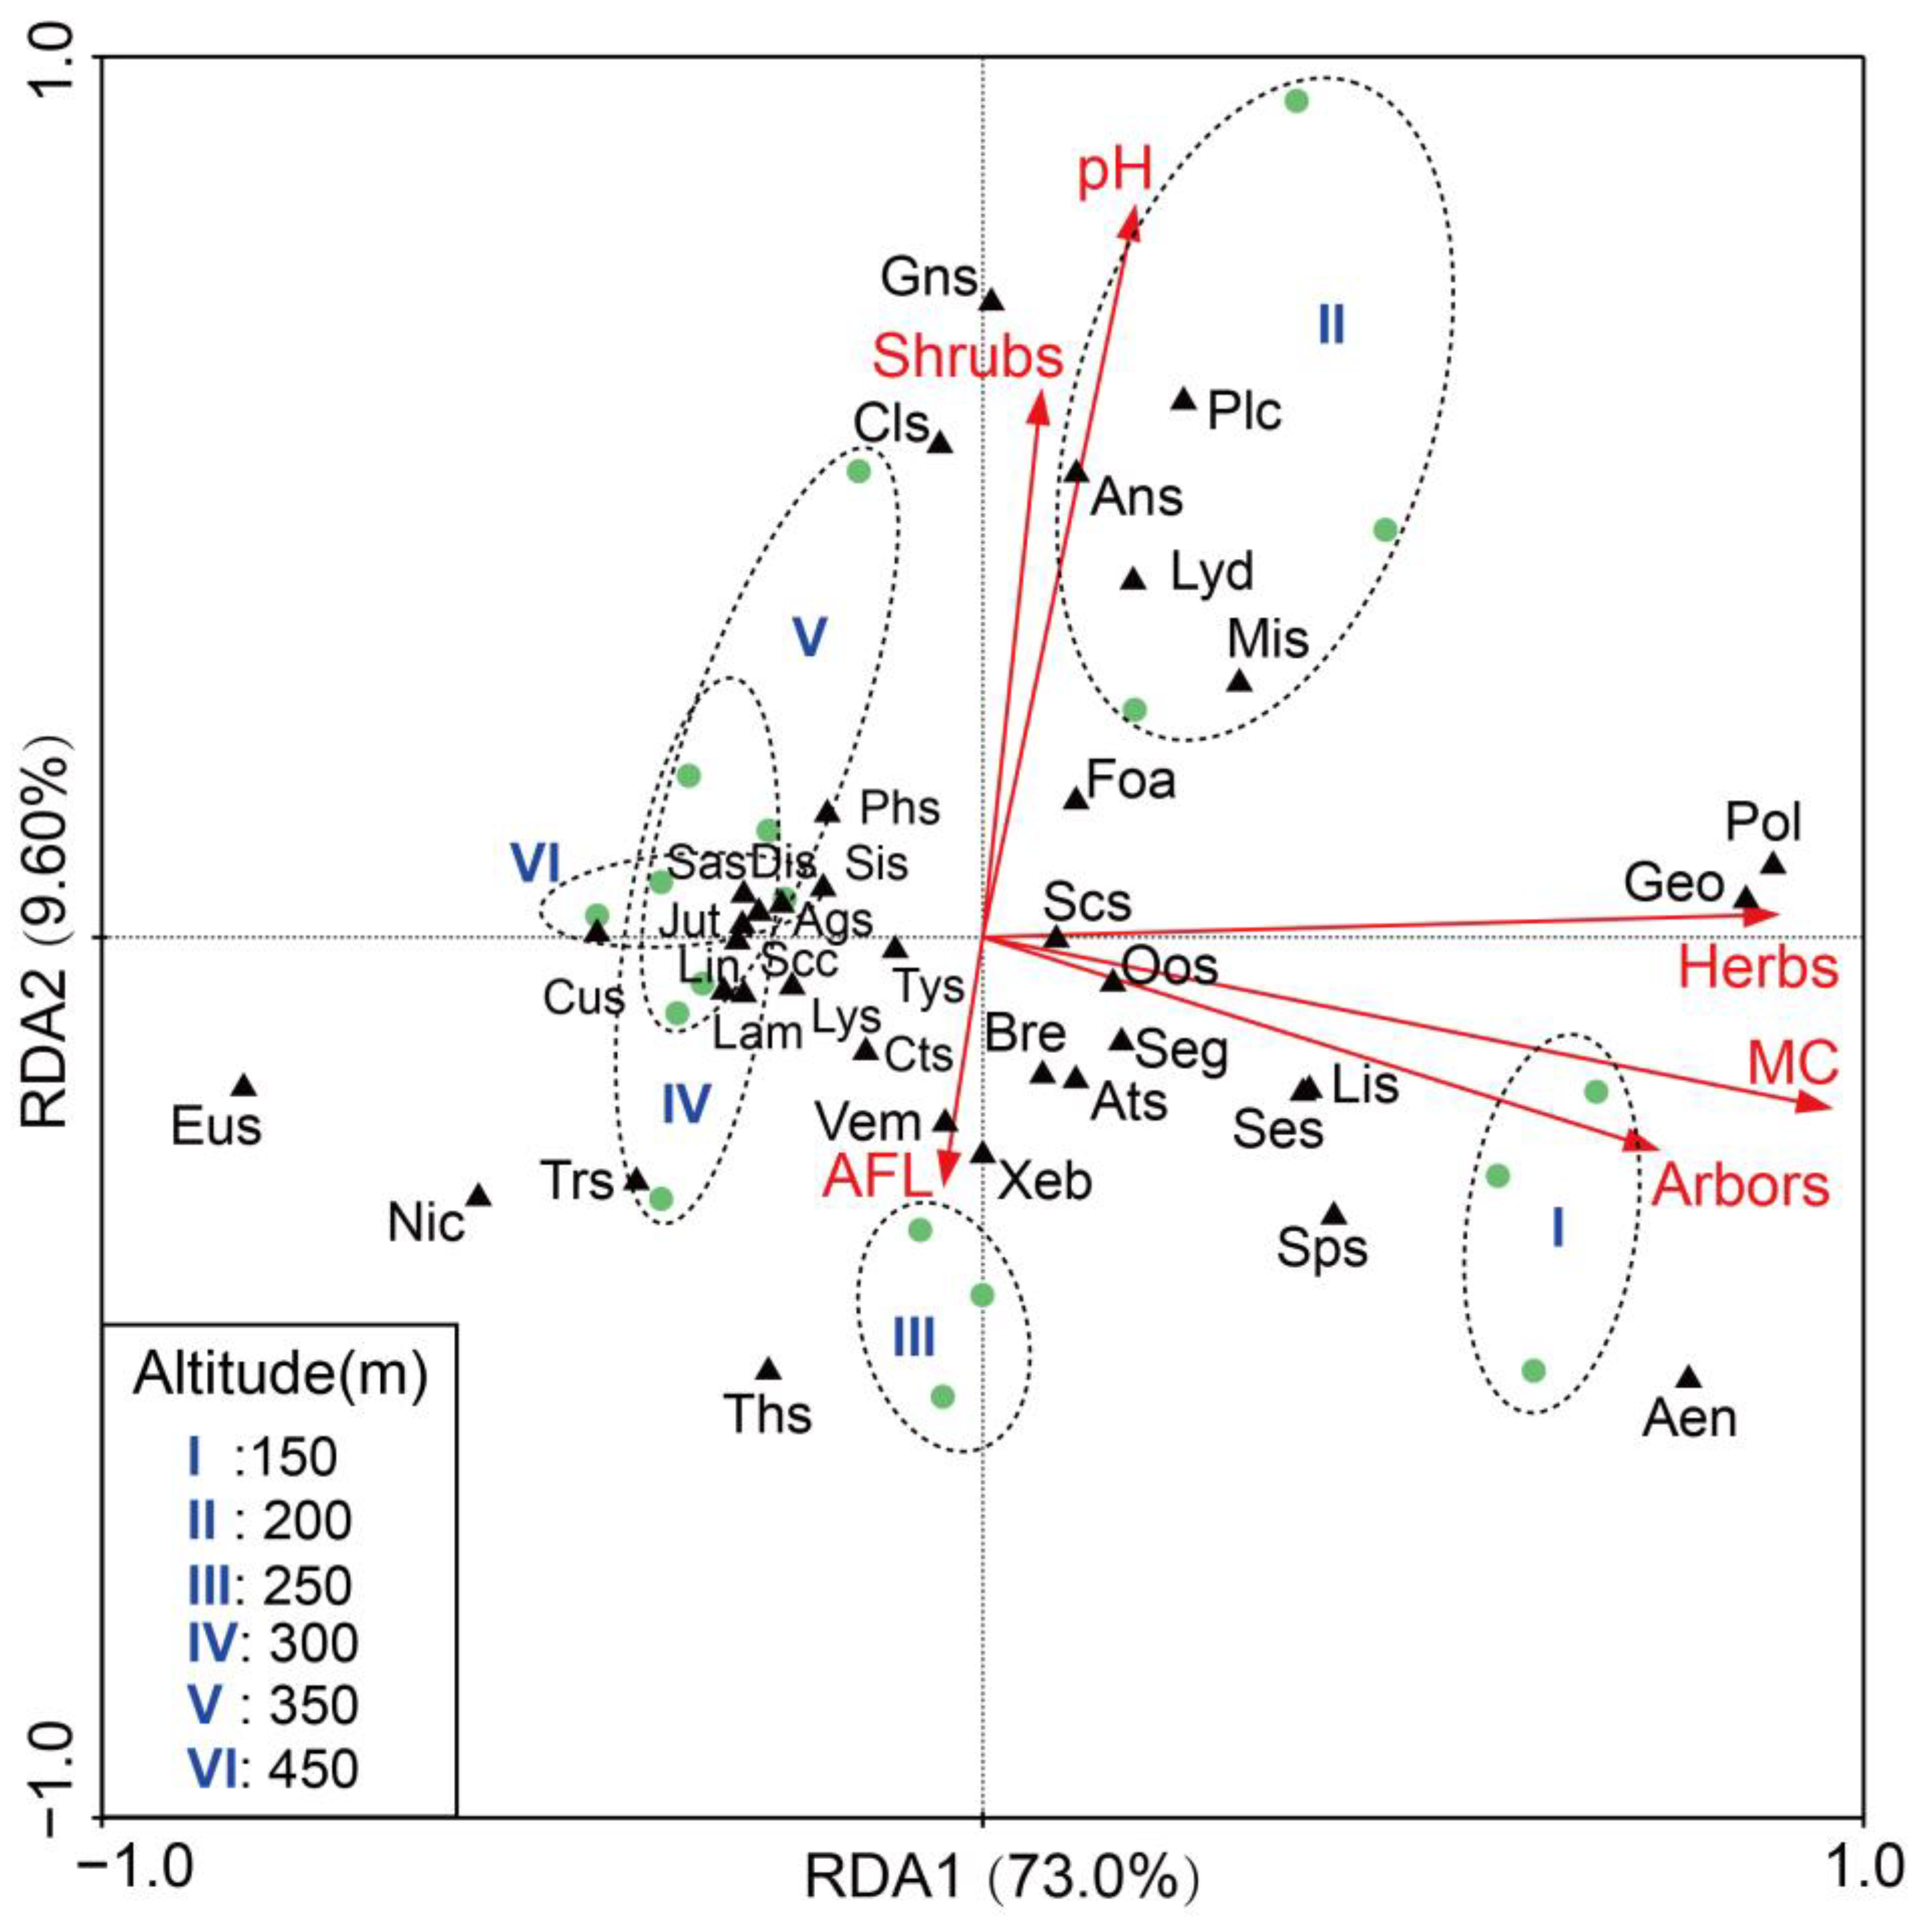
The DCA analysis of six environmental factors and the zooplankton density data measured in this study showed that the maximum eigenvalue length was less than three; therefore, a redundancy analysis (RDA) was carried out accordingly [23]. The results indicated that some environmental factors significantly influenced the distribution of the soil arthropods (Figure 5). Monte Carlo permutation tests revealed significant correlations (p < 0.05) between three environmental factors (soil moisture content, soil pH, and leaf litter quantity) and the soil arthropod community structure. Among these, the soil moisture content (p = 0.002) and soil pH (p = 0.002) had the greatest impact on the soil arthropods, followed by the leaf litter quantity (p = 0.05). Additionally, the soil arthropod community structure was influenced by the vegetation type. The results showed that the quantity of vegetation near the plots decreased gradually with the increase in elevation. Moreover, the vegetation type ranged from herbaceous as the dominant type to shrubs and arbors as the dominant transitional type. The vegetation coverage and soil moisture content decreased gradually, leading to a reduction in the soil arthropods’ abundance. Furthermore, a correlation analysis between the leaf litter quantity and soil arthropods’ abundance revealed that traps with a larger leaf litter quantity and higher coverage at the same altitudinal gradient tended to capture more soil arthropods.

3.5. Fitting Analysis and Pearson Correlation Analysis of Soil Arthropod Quantity and Environmental Factors

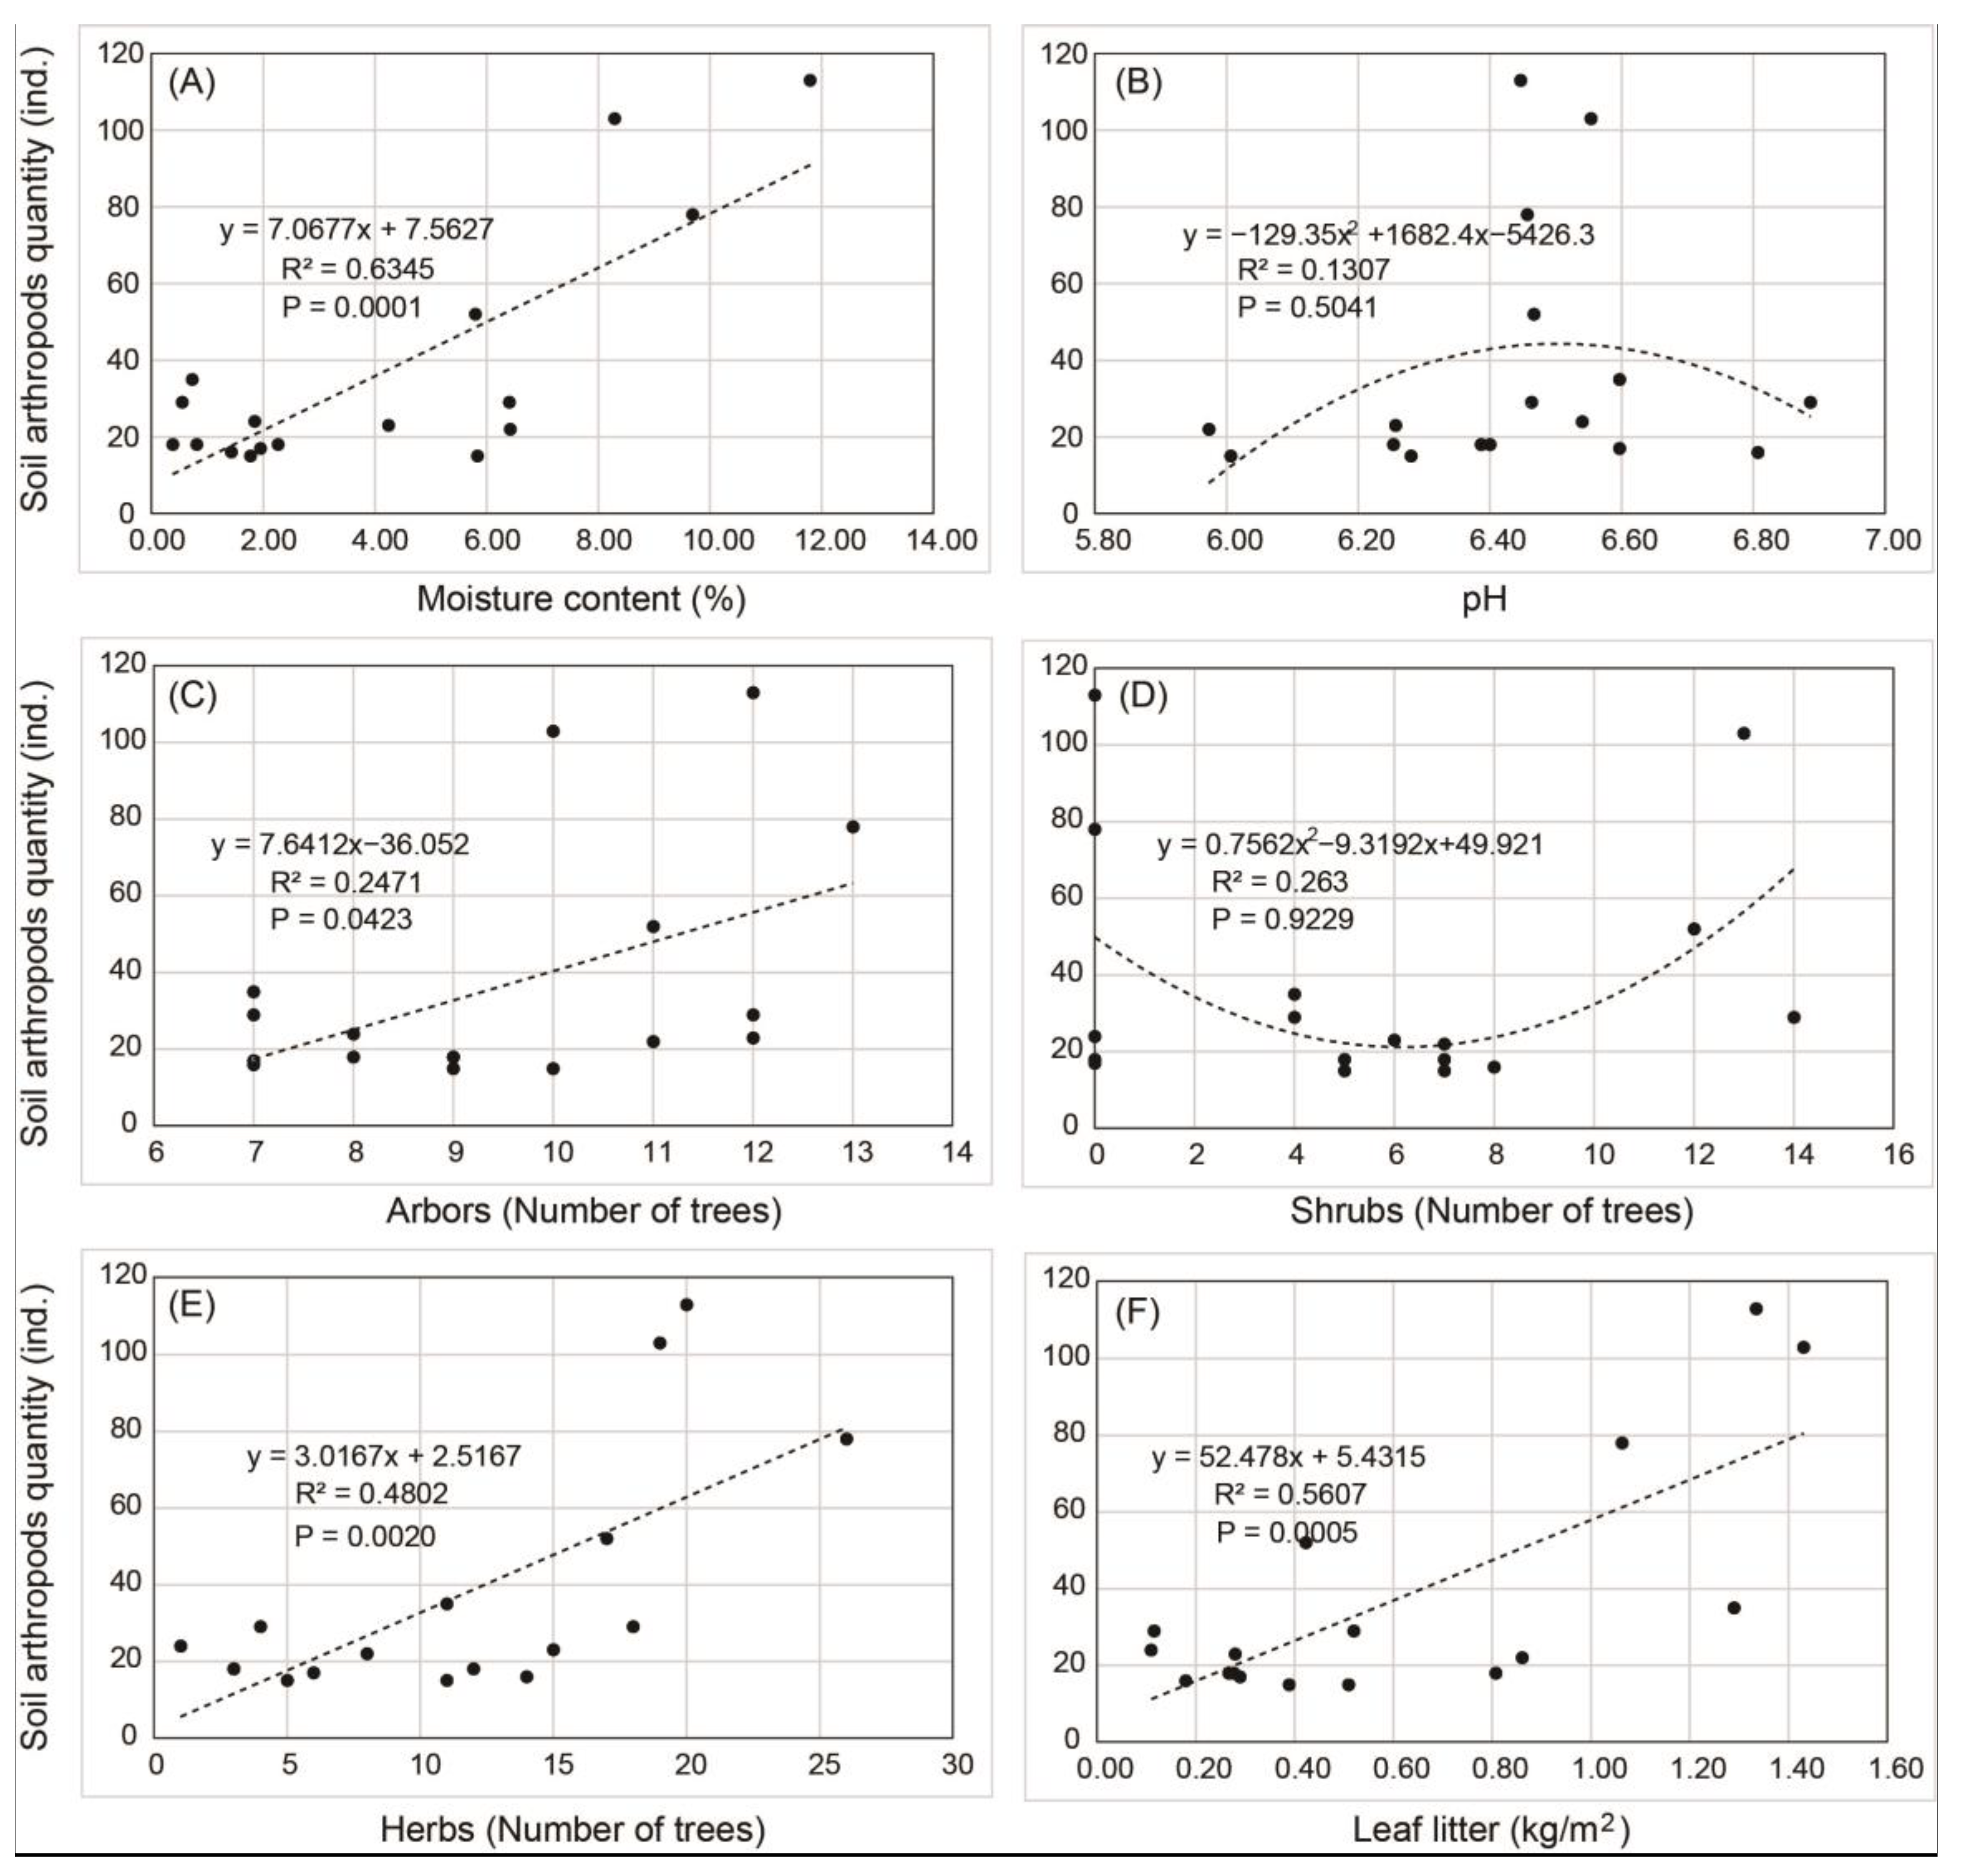
The results of the fitting analysis showed that soil moisture content, herbaceous plant density, and defoliation per unit area were significantly positively correlated with the soil arthropods (Figure 6A,E,F). The Pearson correlation analysis indicated that soil moisture content, arbor density, herb density, and litter amount had significant (p < 0.05) or extremely significant (p < 0.01, Table 1) effects on the soil arthropod quantity. Soil moisture content and herb density had significantly positive impacts on Crustacea (Armadillidium sp.) (p < 0.001, p = 0.008). However, the soil moisture content had a significantly negative impact on Arachnida (p = 0.043). Shrub density had a significantly negative impact on Insecta (p = 0.018). Defoliation had extremely negative effects on Crustacea (Armadillidium sp.) (p = 0.003).

3.6. Effects of Human Tourism and Mountaineering Activities on Soil Arthropods

The results of the one-way ANOVA revealed that the species richness of the soil arthropods on Line 3 (5.11 ± 0.46) was significantly higher than that on Line 1 (3.44 ± 0.26) and Line 2 (3.94 ± 0.32) (p < 0.05, Table 2). Additionally, the abundance of the soil arthropods on Line 3 (30.78 ± 10.67) was significantly higher than that on Line 1 (14.67 ± 6.25) and Line 2 (19.11 ± 7.78). Overall, the soil arthropods’ species richness and abundance decreased as the distance to the mountain steps decreased.

4. Discussion

4.1. Analysis of Soil Arthropod Community Characteristics and Influencing Factors at Different Altitudes

Some studies have reported a decrease in soil arthropod abundance with increasing altitude [24,25], which is consistent with the findings of this study. This study revealed a trend wherein the soil arthropods’ species richness increased initially and then decreased with the altitude at the class and order levels (Figure 4). This pattern aligns with the altitudinal gradient characteristics of the soil arthropod communities observed by Wang et al. in Mount Lu [26]. In a study of soil arthropods in mountainous forests in Eastern China, some scholars found that the numbers of both individuals and species initially increased and then decreased with the altitude [27]. However, our study found that the number of soil arthropod species increased with the increase in altitude, while their abundance decreased with the increase in altitude. This may be attributed to the higher vegetation coverage, soil moisture, and leaf litter quantities in lower-altitude areas, providing more favorable conditions for soil arthropods. Additionally, the site chosen for this research was a low-altitude mountain with an elevation of only 400 m. Due to the limited altitude, the distribution pattern of the soil arthropods along the studied altitudinal gradients may differ from that seen in higher-altitude mountain areas.
Another study reported that the differences in the dominant species of soil fauna were not determined by a single environmental condition [28]. It was pointed out that variations in soil pH significantly influence the dominant species of soil arthropods at different altitudes [29]. In our study, among the six altitudinal gradient plots established, Plot 3 (250 m above sea level) exhibited significantly lower pH values compared to other sites (Figure 2). The dominant species composition of the soil arthropods at this site was significantly different from that in areas with different altitudes. The dominant species at low altitudes, namely Aethus nigritus, and the dominant species at high altitudes, namely Eupolyphaga sinensis, were both more abundant. This suggests that the unique acidic environment at this site may be an important influencing factor. This result is consistent with the findings of Luo et al., who reported a negative correlation between the soil arthropods’ community density and taxa and pH [30].
Furthermore, it has been found that soil faunae are strongly correlated with water content [31]. Additionally, research has reported that the abundance of medium and small soil arthropods is significantly influenced by the soil moisture content, with higher soil moisture content leading to higher abundance [32], which is consistent with the findings of this study. We found that the soil moisture content decreased significantly with increasing altitude (Figure 2). As a result, the species and abundance of soil arthropods adapted to moist environments, such as Armadillidium sp., gradually decrease with decreasing soil moisture content. The dominant species transition to soil arthropods that are more adapted to higher altitudes and drier environments, such as Eupolyphaga sinensis. This finding is consistent with those of Cao Lili et al., whose study indicated a significant increase in the number of isopods and their larvae in seasons with abundant rainfall, favoring humid conditions [33]. Some international researchers found that the amounts of leaves and nutrients in the litter of different vegetation types had obvious changes [34]. Such differences had significant effects on the diversity and community structure of soil animals [35]. This study found that, in low-altitude areas dominated by herbaceous vegetation (Plots 1 and 2), soil arthropod abundance was the highest. As the altitude increased, the dominant species transitioned to shrubs and arbors, and the vegetation density and coverage gradually decreased. The abundance of soil arthropods decreased gradually. In addition, areas with more leaf litter captured more soil arthropods at the same altitudinal gradient (Figure 5). However, some studies found that the soil arthropod abundance was higher in habitats dominated by arbors [36]. It was speculated that this difference might be due to the fact that the leaf litter of herbaceous vegetation is more easily decomposed into humus by small and medium-sized soil arthropods. However, the arbor litter was more prone to lignification and was not easily decomposed [36]. Another study found that soil arthropods in the same altitudinal zone tended to aggregate near the surface, where the abundant leaf litter provided food and suitable living conditions by increasing the humus content through decomposition and excretion [37,38]. It can be seen that soil moisture and leaf litter drive the community construction of soil fauna.

4.2. Effects of Human Interference on Soil Fauna

Human activities also have a significant impact on the community structures of soil fauna [39,40], and the diversity of the soil fauna in green space types with low human interference is often higher than that in green space types with frequent human interference [41]. It has been noted that tourist disturbances can affect the development of soil fauna individuals, leading to changes in the soil fauna community structure [42]. Human activities could also influence the habitat environments of soil fauna, resulting in reduced soil fauna diversity [43]. In this study, the statistical analysis performed revealed that the plots on sampling Line 1, closest to the mountain stairs, had the fewest species and individuals of soil fauna. Meanwhile, the plots on sampling Line 3, subjected to mild disturbances, had the most species and individuals (Table 2). This result may be due to the frequent mountaineering activities in this area, affecting the distribution of the soil fauna. Human mountaineering causes the soil fauna to live and roost in deeper forests, far from the climbing steps. This finding is consistent with the results of Dong’s study on a large soil arthropod community in Sanqing Mountain. His study indicated that the density and species of large soil arthropods in severely disturbed areas were lower than those in moderately and mildly disturbed areas [44]. In addition, the waste generated by tourism activities affect the community compositions and structures of soil arthropods. Some soil arthropods are extremely sensitive to the environment, and their species and quantity will change with environmental changes [45]. It has been reported that the number of individuals and groups and the species richness and diversity of soil arthropods in tea gardens without heavy metal pollution were significantly higher than those in contaminated tea gardens [46]. This study did not elaborate on the effects of tourism waste on soil fauna. Further study is needed to determine whether tourism waste in Shimen Mountain has an impact on its soil fauna communities.
Based on the results of this study, the following recommendations can be proposed for the conservation of the biodiversity in the Shimen Mountain National Forest Park: (1) ensure good vegetation coverage to provide suitable habitats for soil fauna; (2) promote an awareness of environmental protection among tourists and reduce human disturbances and the destruction of natural habitats; and (3) promptly restore ecological sites affected by human disturbances and damage.

5. Conclusions

In this study, we found that the species richness and abundance of soil arthropods in a low-altitude mountain decreased gradually with the increase in elevation. Soil moisture, soil pH, and defoliation drove the community construction of soil fauna. Human mountaineering activities had a direct impact on the distribution of soil fauna. However, in recent years, global climate change has caused drastic changes in the local climate. Climate events such as uneven precipitation, sudden rainstorms, and severe drought occur frequently. These factors will inevitably cause drastic and rapid changes in the local ecological environment. Therefore, it is necessary to carry out further research on the succession and driving factors of soil animal communities against the background of drastic changes in local climate events.

Author Contributions

Conceptualization, H.Q. and X.Y.; methodology, B.C. and Y.L.; software, B.C.; validation, H.Q., X.Y. and J.C.; formal analysis, B.C.; investigation, B.C., Y.K. and Y.L.; resources, X.Y.; data curation, J.S. and Q.Q.; writing—original draft preparation, J.S.; writing—review and editing, H.Q.; visualization, J.C.; supervision, H.Q.; project administration, X.Y.; funding acquisition, H.Q. and X.Y. All authors have read and agreed to the published version of the manuscript.

Funding

This work was supported by the open fund project of the State Key Laboratory of Lake Science and Environment (2022SKL014) and the National College Students Innovation and Entrepreneurship training program of China (202110446121).

Institutional Review Board Statement

Not applicable.

Data Availability Statement

The original contributions presented in the study are included in the article. Further inquiries can be directed to the corresponding author.

Acknowledgments

We thank the management unit of Shimenshan National Forest Park for the materials provided for the development of this work. We also thank Rong Liu for her help in spider identification. We are grateful to the anonymous reviewers for their valuable comments. We are grateful to the editors for their review and revision of the manuscript.

Conflicts of Interest

The authors declare no conflicts of interest.

References

  1. Orgiazzi, A.; Bardgett, R.D.; Barrios, E.; Behan-Pelletier, V.; Briones, M.J.I.; Chotte, J.L.; De Deyn, G.B.; Eggleton, P.; Fierer, N.; Fraser, T.; et al. Global Soil Biodiversity Atlas; European Commission, Publications Office of the European Union: Luxembourg, 2016. [Google Scholar]
  2. Yin, W.Y. Review and Prospect of Soil Zoology. Biol. Bull. 2001, 8, 1–3. [Google Scholar]
  3. Sun, X.; Xie, Z.J.; Qiao, Z.H.; Gao, M.X.; Yin, R.; Chang, L.; Wu, D.H.; Liu, M.Q.; Zhu, Y.G. Research advances in trait-based approaches in soil fauna community ecology. Chin. J. Appl. Ecol. 2024. accepted. Available online: https://link.cnki.net/urlid/21.1253.Q.20240206.1058.002 (accessed on 25 March 2024).
  4. Yan, J.; Wu, J.H. Study Advances in Plant Diversity Effects on Soil Fauna. Soils 2018, 50, 231–238. [Google Scholar] [CrossRef]
  5. Liu, X.J.; Wu, Q.Q.; Li, Y.Y.; Ruan, H.H.; Ding, X.N.; Cao, G.H.; Shen, C.Q. Interaction effects of stand development and seasonality on soil arthropods community in poplar plantations. J. Nanjing For. Univ. 2023, 47, 224–230. [Google Scholar]
  6. Xu, H.J.; Yu, L.Z.; Huang, X.R.; Zhu, J.J.; Yang, J.Y.; Gao, S.L.; Wang, Y.J. Biodiversity of macro ground-dwelling arthropods in secondary forests and plantation forests of montane region of eastern Liaoning Province. Chin. J. Ecol. 2015, 34, 727–735. [Google Scholar] [CrossRef]
  7. Menta, C.; Conti, F.D.; Fondón, C.L.; Staffilani, F.; Remelli, S. Soil arthropods responses in agroecosystem: Implications of different management and cropping systems. Agronomy 2020, 10, 982. [Google Scholar] [CrossRef]
  8. Liu, S.Q. The Characteristics of Soil Fauna Communities and the Division of Functional Groups in Different Altitudinal Gradients of Picea Schrenkiana in Western Tianshan Mountains. Master Thesis, Yili Normal University, Yili, China, 2024. [Google Scholar]
  9. Wang, S.J.; Ruan, H.H.; Wang, J.S.; Xu, Z.K.; Wu, Y.Y. Composition structure of soil fauna community under the typical vegetations in the Wuyi Mountains. Acta Ecol. Sin. 2010, 30, 5174–5184. [Google Scholar]
  10. Ding, Z.Q.; Xu, G.R.; Zhang, S.; Zhang, Y.X.; Ma, K.M. Altitudinal pattern of soil fauna plant interaction in Dongling Mountain, Beijing. Acta Ecol. Sin. 2022, 42, 2741–2750. [Google Scholar] [CrossRef]
  11. Sanders, N.J.; Rahbek, C. The patterns and causes of elevational diversity gradients. Ecography 2012, 35, 1–3. [Google Scholar] [CrossRef]
  12. Jiang, Y.F.; Yin, X.Q.; Wang, F.B. Composition and spatial distribution of soil mesofauna along an elevation gradient on the north slope of the Changbai Mountains, China. Pedosphere 2015, 25, 811–824. [Google Scholar] [CrossRef]
  13. Wang, R.H.; Liu, Q.Y.; Wang, X.Y.; Zhao, Z.Y.; Dou, Y.J. Responses of soil mite community diversity to altitude gradients in Luya Mountain, China. J. Shanxi Univ. 2022, 45, 1138–1150. [Google Scholar] [CrossRef]
  14. Liu, D.D.; Wu, H.T.; Yu, H.X.; Sun, X.; Liu, D.; Cheng, P.; Bai, X.Y.; Dai, G.H.; Zhang, Z.S.; Wang, W.F. Distribution pattern of soil Oribatida and Collembola diversity along altitudinal gradient in the Changbai Mountains. Sci. Geog. Sin. 2023, 43, 1299–1309. [Google Scholar] [CrossRef]
  15. Zhang, H.; Wu, H.T. Research progresses in effects of climate warming on soil fauna community structure. Chin. J. Ecol. 2020, 39, 655–664. [Google Scholar] [CrossRef]
  16. Yang, C.C.; Tao, Y.; Jia, D.X. Climate Profile of Qufu City in 2020 and Its Impact Assessment. Mod. Agric. Sci. Technol. 2021, 17, 185–187. [Google Scholar] [CrossRef]
  17. Duan, M.C.; Qin, R.X.; Zhang, H.B.; Chen, B.X.; Jin, B.; Zhang, S.B.; Ren, S.P.; Jin, S.Q.; Zhu, S.H.; Hua, J.N.; et al. Comprehensive comparison of different sampling methods for arthropod diversity in farmland. Biodivers. Sci. 2021, 29, 477–487. [Google Scholar] [CrossRef]
  18. Yin, W.Y. Atlas of Soil Fauna in China; Science Press: Beijing, China, 1998. [Google Scholar]
  19. Li, H.X.; Sui, J.Z.; Zhou, S.X. Insect Classification and Retrieval; Agriculture Press: Beijing, China, 1987. [Google Scholar]
  20. Bao, S. Agro-Chemical Analyses of Soils; China Agriculture Press: Beijing, China, 2000. (In Chinese) [Google Scholar]
  21. Scheunemann, N.; Russell, D.J. Hydrological regime and forest development have indirect effects on soil fauna feeding activity in Central European hardwood floodplain forests. Nat. Conserv. 2023, 53, 257–278. [Google Scholar] [CrossRef]
  22. Clarke, K.R.; Warwick, R.M. Change in Marine Communities: An Approach to Statistical Analyses and Interpretation, 2nd ed.; PRIMER-E: Plymouth, UK, 2021; 172p. [Google Scholar]
  23. Zhang, J.; Yuan, Z.; Wang, H.Y.Y.; Cao, J.; Zheng, Z.X.; Ye, B.B. Study on the relationship between plankton community structure change and environmental factors in Dafangying Reservoir. J. Anhui Agric. Univ. 2024. [Google Scholar] [CrossRef]
  24. Liu, D.D.; Liu, D.; Yu, H.X.; Wu, H.T. Strong variations and shifting mechanisms of altitudal diversity and abundance patterns in soil oribatid mites (Acari: Oribatida) on the Changbai Mountain, China. Appl. Soil Ecol. 2023, 186, 104808. [Google Scholar] [CrossRef]
  25. Xu, Y.Y.; Cao, M.; Xu, G.R. Diversity distribution patterns of Collembola in litter layers along three typical climate zones in Yunnan Province. Acta Ecol. Sin. 2020, 40, 5008–5017. [Google Scholar]
  26. Wang, H.Y.; Zhu, Y.H. The study of the characteristics of soil fauna community and soil humus characteristics at different elevations in Lushan. Hubei Agric. Sci. 2022, 7, 25–30. [Google Scholar] [CrossRef]
  27. Zang, J.C.; Huang, W.J.; Zang, Y.J.; Bin, L.; Zhang, Y.L.; Song, M.C. Community structure and diversity of soil fauna at different altitudes in Alpine grassland in northern Tibet. J. Northwest Sci.-Tech. Univ. Agric. For. 2023, 51, 72–81. [Google Scholar] [CrossRef]
  28. Chen, H.; Luo, S.W.; Li, G.X.; Jiang, W.Y.; Qi, W.; Hu, J.; Ma, M.J.; Du, G.Z. Large-scale patterns of soil nematodes across grasslands on the Tibetan Plateau: Relationships with Climate, Soil and Plants. Diversity 2021, 13, 369. [Google Scholar] [CrossRef]
  29. Liu, S. Distribution Pattern and Influencing Factors of Soil Oribatid Mites Diversity along Altitudinal Gradient in Evergreen Broad-leaved Forest of Tianmu Mountain. Ph.D. Thesis, Harbin Normal University, Harbin, China, 2022. [Google Scholar] [CrossRef]
  30. Luo, M.J.; Li, S.S.; Qiang, D.H.; Liu, C.H. Relationship between soil fauna community composition and soil physical and chemical properties in Nanniwan wetland. Ecol. Environ. Sci. 2018, 27, 1432–1439. [Google Scholar] [CrossRef]
  31. Sun, L.N. The Characteristics of Soil Faunal in Longwan Nature Reserve Forest and the Division of Functional Groups. Ph.D. Thesis, Harbin Normal University, Harbin, China, 2013. [Google Scholar]
  32. Feng, J.; Qiao, Z.H.; Yan, Q.B.; Yao, H.F.; Wang, B.; Sun, X. Effects of urbanization and greenspace types on community structure and functional traits of soil Collembola. Acta Ecol. Sin. 2024, 6, 1–15. [Google Scholar] [CrossRef]
  33. Cao, L.L.; Ruan, H.H.; Li, Y.Y.; Ni, J.P.; Wang, G.B.; Cao, G.H.; Shen, C.Q.; Xu, Y.M. Variations of surface soil macrofauna in different aged Metasequoia glyptostroboides plantations. J. Nanjing For. Univ. 2024. accepted. Available online: http://kns.cnki.net/kcms/detail/32.1161.S.20231115.1415.002.html (accessed on 24 March 2024).
  34. Wenninger, E.J.; Inouye, R.S. Insect community response to plant diversity and productivity in a sagebrush-steppe ecosystem. J. Arid Environ. 2008, 72, 24–33. [Google Scholar] [CrossRef]
  35. Agnieszka, J.; Bartłomiej, W.; Edyta, S.; Agnieszka, K.B.; Wojciech, B.; Anna, K.I.; Marcin, C.; Marcin, P. How applied reclamation treatments and vegetation type affect on soil fauna in a novel ecosystem developed on a spoil heap of carboniferous rocks. Eur. J. Soil Biol. 2023, 119, 103571. [Google Scholar] [CrossRef]
  36. Yan, J.C.; Cui, D.; Lv, L.Q.; Jiang, Z.C.; Zhang, M.R.; Liu, J.H.; Cao, J.; Wang, Q.L. Distribution characteristics of soil fauna communities in the forest-grassland ecotone of the West Tianshan Nature Reserve. Chin. J. Ecol. 2024. accepted. Available online: https://link.cnki.net/urlid/21.1148.Q.20240124.1721.008 (accessed on 24 March 2024).
  37. Cao, Y.; Gao, M.X.; Zhang, X.P.; Dong, C.X. Distribution characteristics of soil macro-faunal communities along a latitudinal gradient in farmland of Heilongjiang Province. Acta Ecol. Sin. 2017, 37, 1677–1687. [Google Scholar] [CrossRef]
  38. Wu, Q.; Wu, H.T.; Sun, X.; Lin, Y.L.; Liu, D.D.; Kang, Y.J.; Liu, J.P. Community composition and surface aggregation characteristics of soil collembola in Changbai Mountain Tundra. Environ. Ecol. 2023, 5, 39–46. [Google Scholar]
  39. Huang, M. Research on Taxonomy and Diversity of Soil Oribatid Mites in Agricultural Region of Heilongjiang Province. Master Thesis, Chinese Academic Science (Northeast Institute of Geography and Agroecology, Chinese Academic Science), Changchun, China, 2023. [Google Scholar]
  40. Wang, L.L.; Lu, L. Effects of tourism disturbances on activities of soil enzymes and soil macrofauna in Taiping Lake national wetland park. Wetl. Sci. 2013, 11, 212–218. [Google Scholar] [CrossRef]
  41. Tang, J.R. Relationships between Soil Fauna Community Characteristics and Environmental Factors in Natural Forests of Mountain Parks in the Main Urban Area of Chongqing. Master Thesis, Southwest University, Chongqing, China, 2022. [Google Scholar] [CrossRef]
  42. Van-Klink, R.; Schrama, M.; Nolte, S.; Bakker, J.P.; WallisDeVries, M.F.; Berg, M.P. Defoliation and soil compaction jointly drive large-herbivore grazing effects on plants and soil arthropods on clay soil. Ecosystems 2015, 18, 671–685. [Google Scholar] [CrossRef]
  43. Ye, Y.; Jiang, Y.X. Changes of Community Structure and Functional Groups of Soil fauna under Tourism Disturbance—Taking Heishiding, Jiulong Lake and Northridge Mountain as an Example. J. Zhaoqing Univ. 2017, 38, 52–57. [Google Scholar]
  44. Dong, C.X.; Wang, B.J.; Xue, Z.; Tang, N.; Miao, Z.P. Response of soil macro-fauna communities to tourism disturbance-Taking Sanqing Mountain as an example. J. Shangrao Norm. Univ. 2022, 3, 71–76. [Google Scholar] [CrossRef]
  45. Wang, Z.M.; Zhao, Y.M.; Zhong, S.G.; Chen, G. Indicative effect of soil fauna on heavy metal pollution. J. Environ. Hyg. 2022, 6, 463–472. [Google Scholar] [CrossRef]
  46. Xing, S.W.; Xu, J.M.; Huang, B.; Gao, J.T.; Han, L. Effect of heavy metal pollution on the community structure and diversity of soil fauna in tea garden located in a tungsten mining area. Ecol. Environ. Sci. 2021, 30, 1903–1915. [Google Scholar] [CrossRef]
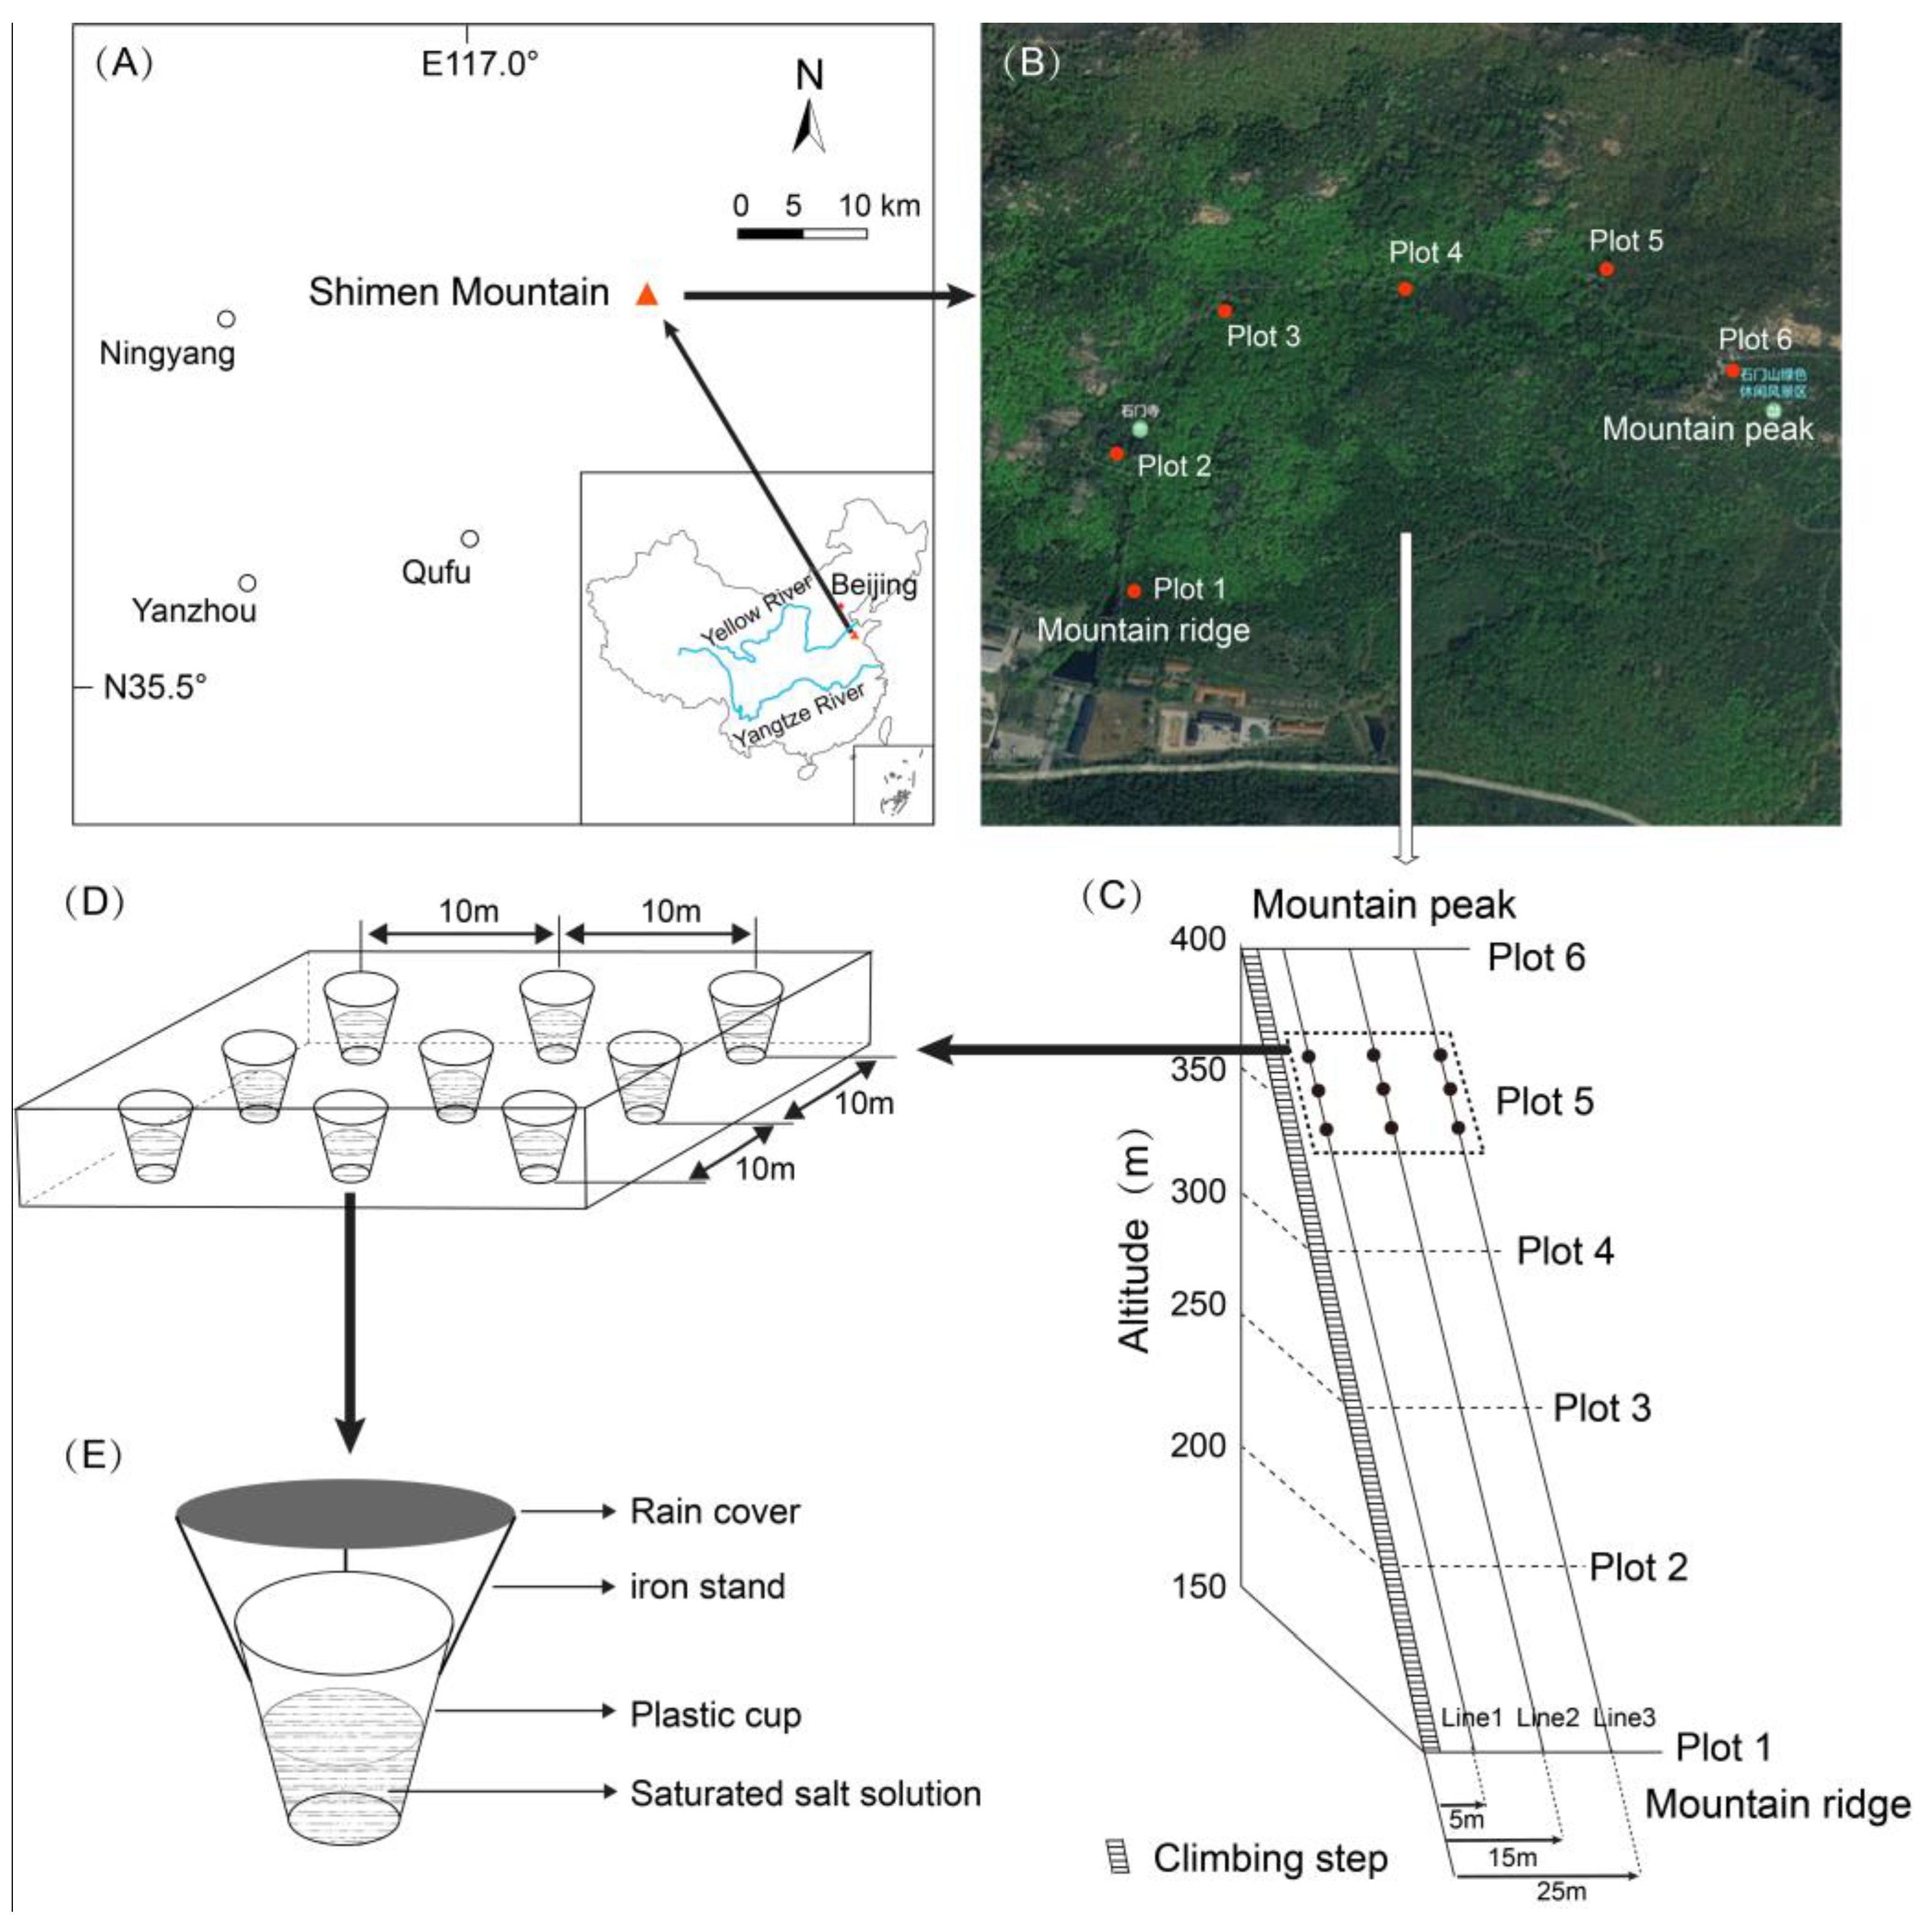
Figure 1. Schematic diagram of soil arthropod sample line (Plot) setting and trap laying ((A), Study area location and the map of China; (B), field sampling Plot setting; (C), sample line setting; (D), nine traps placed at each Plot; (E), trap).
Diversity 16 00263 g001
Figure 2. Environmental factors of sampling areas with different altitudes ((A), Moisture content (%); (B), pH value; (C), Arbors (Number of trees); (D), Shrubs (Number of trees); (E), Herbs (Number of trees); (F), Leaf litter (kg/m2) indicate different environmental factors respectively. Different letters (a, b, c, d and e) in each subfigure indicate significant difference).
Diversity 16 00263 g002
Figure 3. Percentage stacking of soil fauna at different elevation gradients ((A), class level; (B), order level).
Diversity 16 00263 g003
Figure 4. Non-metric multidimensional scale sorting plot based on the number of soil fauna individuals.
Diversity 16 00263 g004
Figure 5. Results of redundancy analysis based on number of soil fauna and environmental factors.
Diversity 16 00263 g005
Figure 6. Fitting analysis of soil arthropod quantity and environmental factors (AF respectively indicate the fitting analysis of Moisture content, pH, Arbors, Shrubs, Herbs, Leaf litter with soil arthropod quantity).
Diversity 16 00263 g006
Table 1. Pearson correlation analysis of soil arthropod quantity and environmental factors.
Moisture Content (%)Soil pHArbors (Number of Trees)Shrubs (Number of Trees)Herbs (Number of Trees)Leaf Litter (kg/m2)
Insecta0.324−0.0210.285−0.566 *0.3040.403
Arachnida−0.495 *0.302−0.1750.184−0.117−0.424
Myriapoda−0.2500.030−0.2950.068−0.085−0.290
Chilopoda−0.247−0.166−0.2190.228−0.128−0.180
Crustacea0.755 **0.1630.4370.1910.622 **−0.675 **
Total quantity0.796 **0.1730.497 *0.0250.693 **0.749 **
Note: Boldface indicates that environmental factors have significant effects on soil arthropods. * indicates a significant effect. ** indicates an extremely significant effect.
Table 2. Species richness and abundance of soil fauna in different sample lines.
Sample LineSpecies RichnessAbundance
Line 13.44 ± 0.26 a14.67 ± 6.25
Line 23.94 ± 0.32 a19.11 ± 7.78
Line 35.11 ± 0.46 b30.78 ± 10.67
Note: Significant differences in soil arthropods’ species richness exist among different transects, labeled a and b.
Disclaimer/Publisher’s Note: The statements, opinions and data contained in all publications are solely those of the individual author(s) and contributor(s) and not of MDPI and/or the editor(s). MDPI and/or the editor(s) disclaim responsibility for any injury to people or property resulting from any ideas, methods, instructions or products referred to in the content.