Article

Age Difference, Not Food Scarcity or Sibling Interactions, May Drive Brood Reduction in Wild Scarlet Macaws in Southeastern Peru

by
Gabriela Vigo-Trauco
1,*,†,
Gustavo Martínez-Sovero
2 and
Donald J. Brightsmith
3,*
1
The Macaw Society and Department of Ecology and Conservation Biology, Texas A&M University, College Station, TX 77843, USA
2
Facultad de Ingeniería Forestal, Universidad Nacional de Jaén, Carretera Jaén-San Ignacio Km 24 Sector Yanuyacu-Jaén, Cajamarca 06800, Peru
3
The Macaw Society and Schubot Center for Avian Health, Department of Veterinary Pathobiology, Texas A&M University, TAMU 4467, College Station, TX 77843, USA
*
Authors to whom correspondence should be addressed.
Current address: Schubot Center for Avian Health, Department of Veterinary Pathobiology, Texas A&M University, College Station, TX 77843, USA.
Diversity 2024, 16(11), 657; https://doi.org/10.3390/d16110657
Submission received: 29 June 2024 / Revised: 8 October 2024 / Accepted: 15 October 2024 / Published: 24 October 2024
(This article belongs to the Special Issue Ecology and Conservation of Parrots)

Abstract

:
Avian brood reduction was initially thought to be driven by insufficient food supply. Now it is more commonly considered a consequence of asynchronous hatching and resulting siblicide, direct filial infanticide (where parents kill specific chicks) or indirect filial infanticide (where parents starve specific chicks). In psittacines, brood reduction has been reported, but the mechanisms and causes remain unexplored. In this paper, we test the hypotheses that Scarlet Macaw chick starvation is driven by (1) sibling aggression, (2) food scarcity, and (3) parental food allocation based on (a) chick hatch weight and (b) chick age differences. We documented wild Scarlet Macaw behavior in lowland Peru in 37 nests over 19 seasons using morphological measurements and nest videos. Chick starvation was the leading cause of chick mortality (27% of all second-hatched chicks starve, and nearly all third- and fourth-hatched chicks starve). We found no evidence that starvation was caused by (1) sibling conflicts or (2) food availability. We did find parental food distribution favors first-hatched chicks, with larger age differences increasing the chances of second chick starvation. This study offers insights into brood reduction among Neotropical cavity-nesting birds and enhances our capacity to develop scientifically informed management strategies to support endangered psittacines.

Graphical Abstract

1. Introduction

In many avian species, parents regularly fail to raise all the chicks that hatch to fledging, and the deaths of these additional chicks are not caused by external forces such as weather or predation [1,2]. This phenomenon, classically labeled brood reduction, has been intensely studied in the past six decades as a way to better understand avian hatching patterns and avian life histories more broadly [3,4]. The original “Brood reduction hypothesis” [5] posits that mortality of last-hatched individuals is due to insufficient food availability as the youngest nestlings are either outcompeted by larger brood members or actively neglected by their parents and starve to death [4,5,6]. This “Resource tracking hypothesis” proposes that brood size adjustments reflect parental ability to supply food and that nestlings that have received low parental investment or that will require high future investment will be eliminated [3]. It posits that for birds with asynchronous hatching, the optimal clutch size should reflect the average maximum number of young that can be raised under favorable conditions [2]. This hypothesis holds for a number of bird species including birds of prey [7], sea birds [8,9], penguins [10] and some passerines [11]. However, in psittacines, most evidence suggests that food limitation is not the driver of brood reduction by chick starvation [12,13,14,15,16].
In many instances, brood reduction is thought to be a non-adaptive consequence of hatching asynchrony that might be maintained for other reasons [17]. Brood reduction is most commonly observed in birds with asynchronous hatching, where chick mortality can be caused by (1) siblicide, where smaller or younger brood members are killed by other brood members [8,9,18], (2) direct filial infanticide, where parents evict specific chicks [19] or kill them outright [20,21], or (3) indirect filial infanticide, when parents provide sub-optimal parental care (also known as chick starvation [13,15,22,23]).

1.1. Siblicide

Sibling rivalry within broods has been recorded in a wide range of bird species, including seabirds such as boobies, gulls, and pelicans [8,9], some Ciconiformes like egrets and herons [24], and several species of birds of prey [18]. High levels of sibling rivalry can lead to the deaths of subordinate members of broods, through physical harm, eviction from the nest, or forced starvation [25]. In parrots, sibling competition within broods is generally low [26]. It occurs mainly during feeding times, during attempts to obtain food, either by begging (vocalizing and moving wings) or by scramble competition between brood members in order to obtain positions closer to a feeding parent [26].

1.2. Filial Infanticide

Avian filial infanticide is probably under reported in the literature due to a combination of the difficulty of direct observations, observer bias, and the lack of long-term studies [19]. Active filial infanticide, when a parent executes its own live offspring, has been reported in sixteen species of birds, including sparrows, coots, falcons, eagles, roadrunners, woodpeckers, spoonbills, storks (see list of species in Moreno 2012), and one species of parrot, the Eclectus Parrot (Eclectus rotatus [21]). In the majority of the species, parents evict the younger nestling from the nest, but in the case of the White Stork (Ciconia ciconia [20]), the Peregrine Falcon (Falco peregrinus tundrius [27]), and the Eclectus Parrot [21], observations of attacks and beak marks on chick carcasses suggest parents were directly responsible for chick death. By comparison, passive filial infanticide, or sub-optimal nourishment of specific nestlings that results in starvation, has been reported as a cause of mortality in many species of parrots: [28] and Appendix A. However, it is commonly called “chick starvation” and is rarely recognized as infanticide [29].
Reasons why parents target certain individual chicks for filial infanticide vary. Overall, larger chicks are known to have higher relative survival rates [30], so chicks that hatch with lower bodyweights may be systematically targeted for filial infanticide. Similarly, age differences between chicks driven by hatching asynchrony can create marked size hierarchies and these size differences may be primary drivers of brood reduction through passive or active filial infanticide [2,19].
In the current study, we investigate the causes of brood reduction through chick starvation in the Scarlet Macaw in Southeastern Peru. The species is extremely altricial; chicks are blind and not able to thermoregulate for almost 20% of the 90-day nestling period [31,32,33]. The species has bi-parental care where both sexes feed the chicks, and brood reduction has been documented repeatedly across the range of the species [34,35,36,37,38,39]. In our site in southeastern Peru, starvation is the leading cause of chick death, resulting in 45% of all chick mortality and all third- and fourth-hatched chicks starved. However, only about 26% of second-hatched chicks starve [40].
In this study, our objective is to determine the drivers of macaw chick starvation. To do this, we present a brief overview of chick starvation at our site and use comparisons of second chicks that starved and second chicks that did not starve to test the following hypotheses:
H1: 
Chick–chick interaction hypothesis: Chick starvation results from aggressive interactions within broods. Second-hatched chicks that are targets of aggression from their older nest mates have a higher chance of starvation.
H2: 
Parent–environment interaction hypothesis: Second chicks raised during periods of high food availability have a higher chance of survival compared to second chicks raised during periods of low food availability.
H3: 
Parent–chick interaction hypothesis: Chick starvation is driven by direct food allocation to specific chicks and specific targeted parental neglect (Filial infanticide). Second chicks that receive less feedings have a higher chance of starvation than second chicks that received more feedings. To further understand the drivers behind Filial infanticide we also tested the following two hypotheses.
H3.1: 
Hatch weight hypothesis: Chick starvation is driven by body condition at hatch (hatch weight). Hatch weight of second chicks is likely to be negatively related to probability of starvation, with heavier chicks having lower starvation rates.
H3.2: 
Brood age difference hypothesis: Chick starvation is driven by brood age differences. Second chicks that are born later with respect to their older siblings have a higher chance of starvation.

2. Materials and Methods

2.1. Study Site

Research was conducted in the forests surrounding the “Colorado Macaw Clay Lick” (UTM 433,714 E 8,546,853 N) in the Tambopata National Reserve (275,000 ha) adjacent to the Bahuaja-Sonene National Park (1,091,416 ha) in the state of Madre de Dios, southeastern Peru. The forest is classified as tropical moist forest and is a combination of flood plain, terra firme, successional, and palm swamp forest that receives around 3200 mm of rain annually [41,42].

2.2. Background Methodology

We collected data during 18 consecutive breeding seasons (mid-October to mid-April 2000 to 2018). Each season we monitored about 16 natural and 24 artificial macaw nest sites using single rope climbing systems: [43,44] and Figure 1A. In 11 breeding seasons (2007 to 2019, excluding 2011 and 2015), we installed video cameras in 4 ± 2 nests per season (range of 1 to 9 nests with camera/season). Video systems were installed before eggs were laid and provided us the ability to directly monitor parent–chick interactions and count difficult-to-observe behaviors like feedings. For this study, we used data from 37 distinct nest sites, 36 different artificial nest boxes, and 1 natural nest (see Olah et al. [38] for more details on these nests and Figure 1B for a typical clutch of three chicks).
Many studies have shown that reproductive ecology can vary between conspecifics nesting in natural versus artificial nests [45,46]. Given the intense monitoring of behavior inside the nest required for our work, we were unable to obtain sufficient data from natural nests for detailed comparisons of chick starvation. Our data suggest that the rate of complete hatch failure and complete brood loss may be higher in natural nests (see Supplemental Materials: Scarlet Macaw Nesting Parameters in Natural versus Artificial Nests, Tables S1 and S2). However, we found broadly similar clutch sizes and numbers of chicks hatched between natural and artificial nests (Tables S3 and S4). Most importantly, the numbers of chicks fledged in successful nests did not differ between natural and artificial nests (Table S5). This suggests that brood reduction decisions were broadly similar between pairs nesting in different nest types and suggests that the phenomena we report on here are likely to be equally relevant to nests in natural and artificial nest sites.
All nests were checked once every 2 to 3 days until the first egg was found. After an egg was found, nest monitoring was suspended until 26 days later and continued once the first chick hatched. After chicks hatched, the nest check schedule was as follows: checked daily from hatch (or day chick was first found) until the youngest chick in the brood was 15 days old; checked once every 2 days until the oldest chick of the brood was 70 days old; checked daily until the last chick fledged. During each check, all chicks were weighed with a digital scale and crop size was scored on a scale from 0 to 4 (0 = empty crop, 1 = ¼ full crop, 2 = ½ full crop, 3 = ¾ full crop and 4 = full crop) [40]. Chicks were banded when weight was 445 ± 73 g (24 ± 5 days old). When chicks were found dead, the body was removed and a necropsy performed. Death by starvation was declared when a chick hatched apparently healthy but did not gain weight as expected and ultimately lost weight and died with no clinical signs of disease. When chicks disappeared from nests, cause of death was considered as “unknown” unless clear evidence of predation was found.
To monitor brood member interactions, we used a video camera system to record interactions inside the nest. We made recordings in two ways. From 2007 to 2010, we made non-continuous recordings during observations whenever (a) chicks were fed and (b) chicks were left alone in the nest. We made continuous recordings in two different manners. From 2007 to 2010, we made two-hour recordings at three times of the day (6:30, 12:30 and 16:30 h) without a specific weekly schedule. From 2012 to 2018, we made 6 h continuous recordings at three specific times of the day (a.m.: 5:00 to 11:00, p.m.: 11:00 to 17:00, and NIGHT: 17:00 to 05:00). These 6 h recordings were made on the following schedule: (1) every day until youngest chick of the brood was 15 days old or until starving chicks died and (2) after 15 days or starvation was completed, every other day, alternating day and night recordings until all chicks fledged. We were not always able to follow the recording schedule due to camera systems malfunctioning or extreme weather conditions. Two experienced observers, GV-T (2007 to 2010) and GM (2012 to 2018), took all the data, and we crosschecked data from both observers to ensure that their data were comparable. Both continuous and non-continuous types of recordings were used in each analysis unless otherwise indicated.
For each analysis, we compared second chicks that starved to death with second chicks that did not starve and went on to fledge successfully (N = 81 chicks, 18 breeding seasons, average chicks per season = 4, range of 2 to 9 chicks/season). We did not include all of the second chicks from the 18-year period in each analysis, because (1) hatching date was not known with the same precision in all broods, (2) not all chicks were weighed on their hatching date, (3) not all broods under study had a video system in their nest, (4) observers were not always able to distinguish between the two chicks during video data collection, and (5) plant phenology information was collected in just eight of eighteen breeding seasons. For those reasons, 54 s chicks (67% of the total) were included in at least one of the analyses (17 chicks that starved and 37 chicks that did not starve). Indeed, just 5 s chicks (3 chicks that starved and 2 chicks that did not starve) had data for all variables and were included in all the analyses. These 54 s chicks came from a total of 24 different nest sites (2.2 ± 2.1 chicks per nest site). Since not all parents were marked, it is impossible to know how often chicks in different seasons in the same nest came from the same pairs. However, in the nest sites with the largest numbers of chicks (8 and 9 over the 18-year period), evidence from bands and plumage variations suggests there were at least 2 or 3 different sets of parents. With only 54 chicks, most with incomplete data, it was impossible to test all factors simultaneously in a multi-variate analysis. For this reason, each analysis is conducted with a different subset of the available chicks.
All statistical analysis was performed using JMP Pro 13, using 2-tailed tests and α = 0.05. Data are presented as (mean ± standard deviation, N) unless stated otherwise.

2.3. Section 1: General Description of Macaw Chick Starvation

2.3.1. Weight at Hatch

We used the chick’s body weight during the first 24 h after hatching as a surrogate measure of chick quality. To test differences between chicks that starved (disregarding hatching order) and chicks that fledged, we performed a t-test. In addition, we used just chicks from double broods where weight at hatch was recorded for both brood members to perform an ANOVA comparing (1) first chicks that fledged, (2) second chicks that fledged, and (3) second chicks that starved.
We also analyzed hatch weight between members from successful double broods and members from double broods with starvation. For this we used an ANOVA to compare four “detailed chick outcome” groups: (1) first chicks that fledged from successful double broods, (2) second chicks that fledged from successful double broods, (3) first chicks that fledged from double broods with starvation and (4) second chicks that starved. An outlier second chick (Hugo II 2013) that starved at a much greater age than all other second chicks that starved (36 days) was removed from calculations because the starvation was apparently caused by the parents’ reducing feeding and brooding as they defended the nest from an extremely hostile attempt by another pair of Scarlet Macaws to take over the nest (more on nest fights can be found in Vigo [40]).

2.3.2. Growth Description of Chicks That Starved

We grouped chicks that starved into three groups according to their hatching order: second chicks that starved, third chicks that starved, and fourth chicks that starved. Chicks were included only if (1) the chick was weighed within 24 h of hatching, (2) the body was found within 24 h of death, (3) the chick was not given supplemental feedings, (4) the parents were not given supplemental food, and (5) the chick order did not change through the life of the chick (i.e., older chicks did not die causing second chicks to become first chicks, etc.). The outlier second chick, Hugo II 2013, which starved at 36 days was removed from calculations.

2.4. Section 2: Drivers of Second Chick Starvation

We tested the hypotheses that starvation is due to: (1) chick–chick interference, (2) parent–environment interactions, and (3) parent–chick interactions. These analyses compared only second chicks that starved and second chicks that fledged.

2.4.1. Chick–Chick Interaction Analysis

To monitor interactions between chicks, we used the continuous and non-continuous video recordings from eight breeding seasons (2007 to 2010 and 2012 to 2014). We recorded two behaviors that suggest aggression between chicks: (1) chick pushes another chick with its own body and (2) chick pushes an adult’s beak while the adult is feeding another chick. Chick pushing is a characteristic behavior of sibling competition that can lead to siblicide in some non-psittacines [29]. Chicks pushing an adult’s beak while feeding another chick is known in parrots and is as an indicator of dominance in scramble competition [47]. During observations we recorded the initiator and receiver of each behavior.
Chick pushing: For chick pushing, we counted each individual “push” as a unit. For each chick we calculated the rate of pushes initiated and received per minute. We used a t-test to compare (1) if push initiation differed between first and second chicks, (2) if second chicks were pushed more than first chicks, and (3) if second chicks that starved were pushed more or less than second chicks that did not starve. To investigate the relationship between second chicks being pushed and starvation, we performed a logistic regression with starvation status (starved vs. not starved) as the dependent variable and frequency of pushes of the second chick as the independent variable.
Adult beak pushing: for pushing adult beaks, we counted each individual “push” as a unit and scored with one of three outcomes: (1) lose = initiator chick does not make the adult stop feeding the other chick, (2) win = when initiator chick makes adult stop feeding the other chick and adult switches to feed the initiator chicks, (3) win neutral = when initiator chick makes adult stop feeding the other chick but adult does not start feeding initiator chick. To investigate the relationship between starvation and second chicks pushing adults’ beak during feedings, we performed a logistical regression analysis with starvation status as the dependent variable and pushing an adult’s beak counting as the independent variable.

2.4.2. Parent–Environment Interaction Analysis

We used interannual food availability across the field site as the sole indicator of local environmental quality. We estimated food availability in the forests around the research center using phenology data collected once a month from November to February during 8 breeding seasons (2009 to 2018, excluding 2015) from 20 plots (~70 trees per plot and ~1300 trees) in a ~5 km diameter around the house. A single well-trained observer (GMS) collected all data in four distinct habitats: successional forest, terra firme forest, palm swamp, and floodplain forest. Because >80% of Scarlet Macaw food items are ripe and unripe fruits [48,49,50], we recorded the presence/absence of ripe and unripe fruits for each tree [51].
We calculated an index of daily food availability using the percentage of trees with ripe or unripe fruit for plant species known to be eaten by Scarlet Macaws ([48,49,50,52,53,54] and Brightsmith et al. unpublished data). We fit lines between consecutive monthly phenology values and used the equations of those lines to calculate daily values for the percentage of trees with ripe or unripe fruit. We used these daily values to calculate the average index of daily food availability for each chick (total 17 s chicks: 8 chicks that starved and 9 chicks that fledged; 6 breeding seasons) during the following periods: (1) seven days before and seven days after hatching (14 days total) and (2) the first 15 days of the life of the brood. For this analysis, we only used chicks with the hatching day known within ±1.5 days and parents that were not supplementarily fed.
We compared the food availability for three time periods (hatching ±7 days, first 15 days of the brood, and first 36 days of the brood) between chicks that starved and chicks that did not starve using a t-test.

2.4.3. Parent–Chick Interaction Analysis

Parental care analysis: To analyze interactions between parents and chicks, we used chick feedings as the main indicator of parental care. We recorded chick feeding when the adult grasped the bill of the chick crosswise from above and bobbed its head, transferring food by regurgitation. One feeding bout was scored each time the parent grabbed the chick and transferred food, regardless of duration of the feeding (i.e., each time the adult released the chick and grabbed it again and began to feed, it was considered a new feeding bout). Feeding rates were calculated as the number of feeding bouts divided by the number of hours of video observed.
Chick feeding rate comparison: To explore differences in feedings between members of broods with and without starvation, we calculated the difference in feedings between the first and second member of each brood, irrespective of which adult was feeding. We calculated this difference during the “starvation period” (the first 36 days of life of the second chick) in all two-chick broods with and without starvation. To determine overall differences in feeding rates between first and second chicks, we performed a t-test. To determine the relationship between feeding rate differences and starvation of the second chicks, we performed a nominal logistic regression using the difference in feedings/hour from second chicks as independent variables versus “Second chick survival status” (second chicks starved or second chicks fledged).
Chick feeding ratios: We calculated the ratio of second chick feedings to first chick feedings in each brood (the “C2/C1 feeding ratio”) by combing all feedings from both parents to each chick. For broods with second chicks that starved, we calculated the ratio using feeding data from when both chicks were alive. For broods in which second chicks fledged, calculations were carried out for: (1) the first 15 days of life of the brood and (2) the starvation risk period. We did not include data from video recordings for which chicks could not be identified for >50% of feedings. We only included broods with chicks for which the hatching day was known within ±2 days, with wild parents that were not given supplemental food, and with at least 340 min of total observations (average recording length = 4142 min, range: 345 min to 12,517).
To evaluate feeding differences between second chicks that starved and second chicks that did not starve, we performed a t-test comparing C2/C1 feeding ratios. To analyze the relationship between second chick starvation (starved vs. not starved) and the relative proportion of feedings to the second chick, we performed a binary logistic regression analysis with starvation status as the dependent variable and the C2/C1 feeding ratio as the independent variable.
Chick quality analysis: To investigate the relationship between chick starvation and chick quality, we used weight at hatch as an indicator of chick quality. We included only second chicks with a hatch date known within ±1 day and with weight information collected when individuals were <2 days old. We compared the hatching weights of second chicks that starved and second chicks that did not starve using a t-test. We also analyzed the relationship between hatching weight and chick starvation by performing a logistical regression analysis with starvation status (starved vs. not starved) as a dependent variable and hatch weight as the independent variable.
Hatching asynchrony analysis: To investigate the relationship between chick starvation and brood hatching synchrony, we analyzed the age difference between the first and second chicks of the same brood. To do this, we used broods with combined hatching date certainties of <2 days. We estimated hatching date certainty as the middle date between the last date each egg was seen and first date its corresponding chick was seen. Combined hatching date certainty is the addition of hatching date certainty from both chicks of the brood. To analyze the relationship between first and second chick age difference and starvation, we performed a logistic regression with starvation status (starved vs. not starved) as the dependent variable and age difference between first and second chicks as the independent variable.
To determine the general power of our analyses for variables where we did not find significant differences between chicks that starved and those that did not, we calculated power using the “Power explorer for two independent sample means” in JMP [55].

3. Results

The most common cause of death in macaw chicks at our study site was chick starvation. Over 45% of chicks that died starved to death (N = 137 chicks that died). We did not find any cases of death by starvation in broods with only one chick or for first-hatched chicks in multiple chick broods. Of the chicks that died of a known cause, (N = 107 chicks), 60% of second-hatched chicks, 91% of third-hatched chicks and 100% of fourth-hatched chicks died of starvation.

3.1. Section 1: General Description of Macaw Chick Starvation

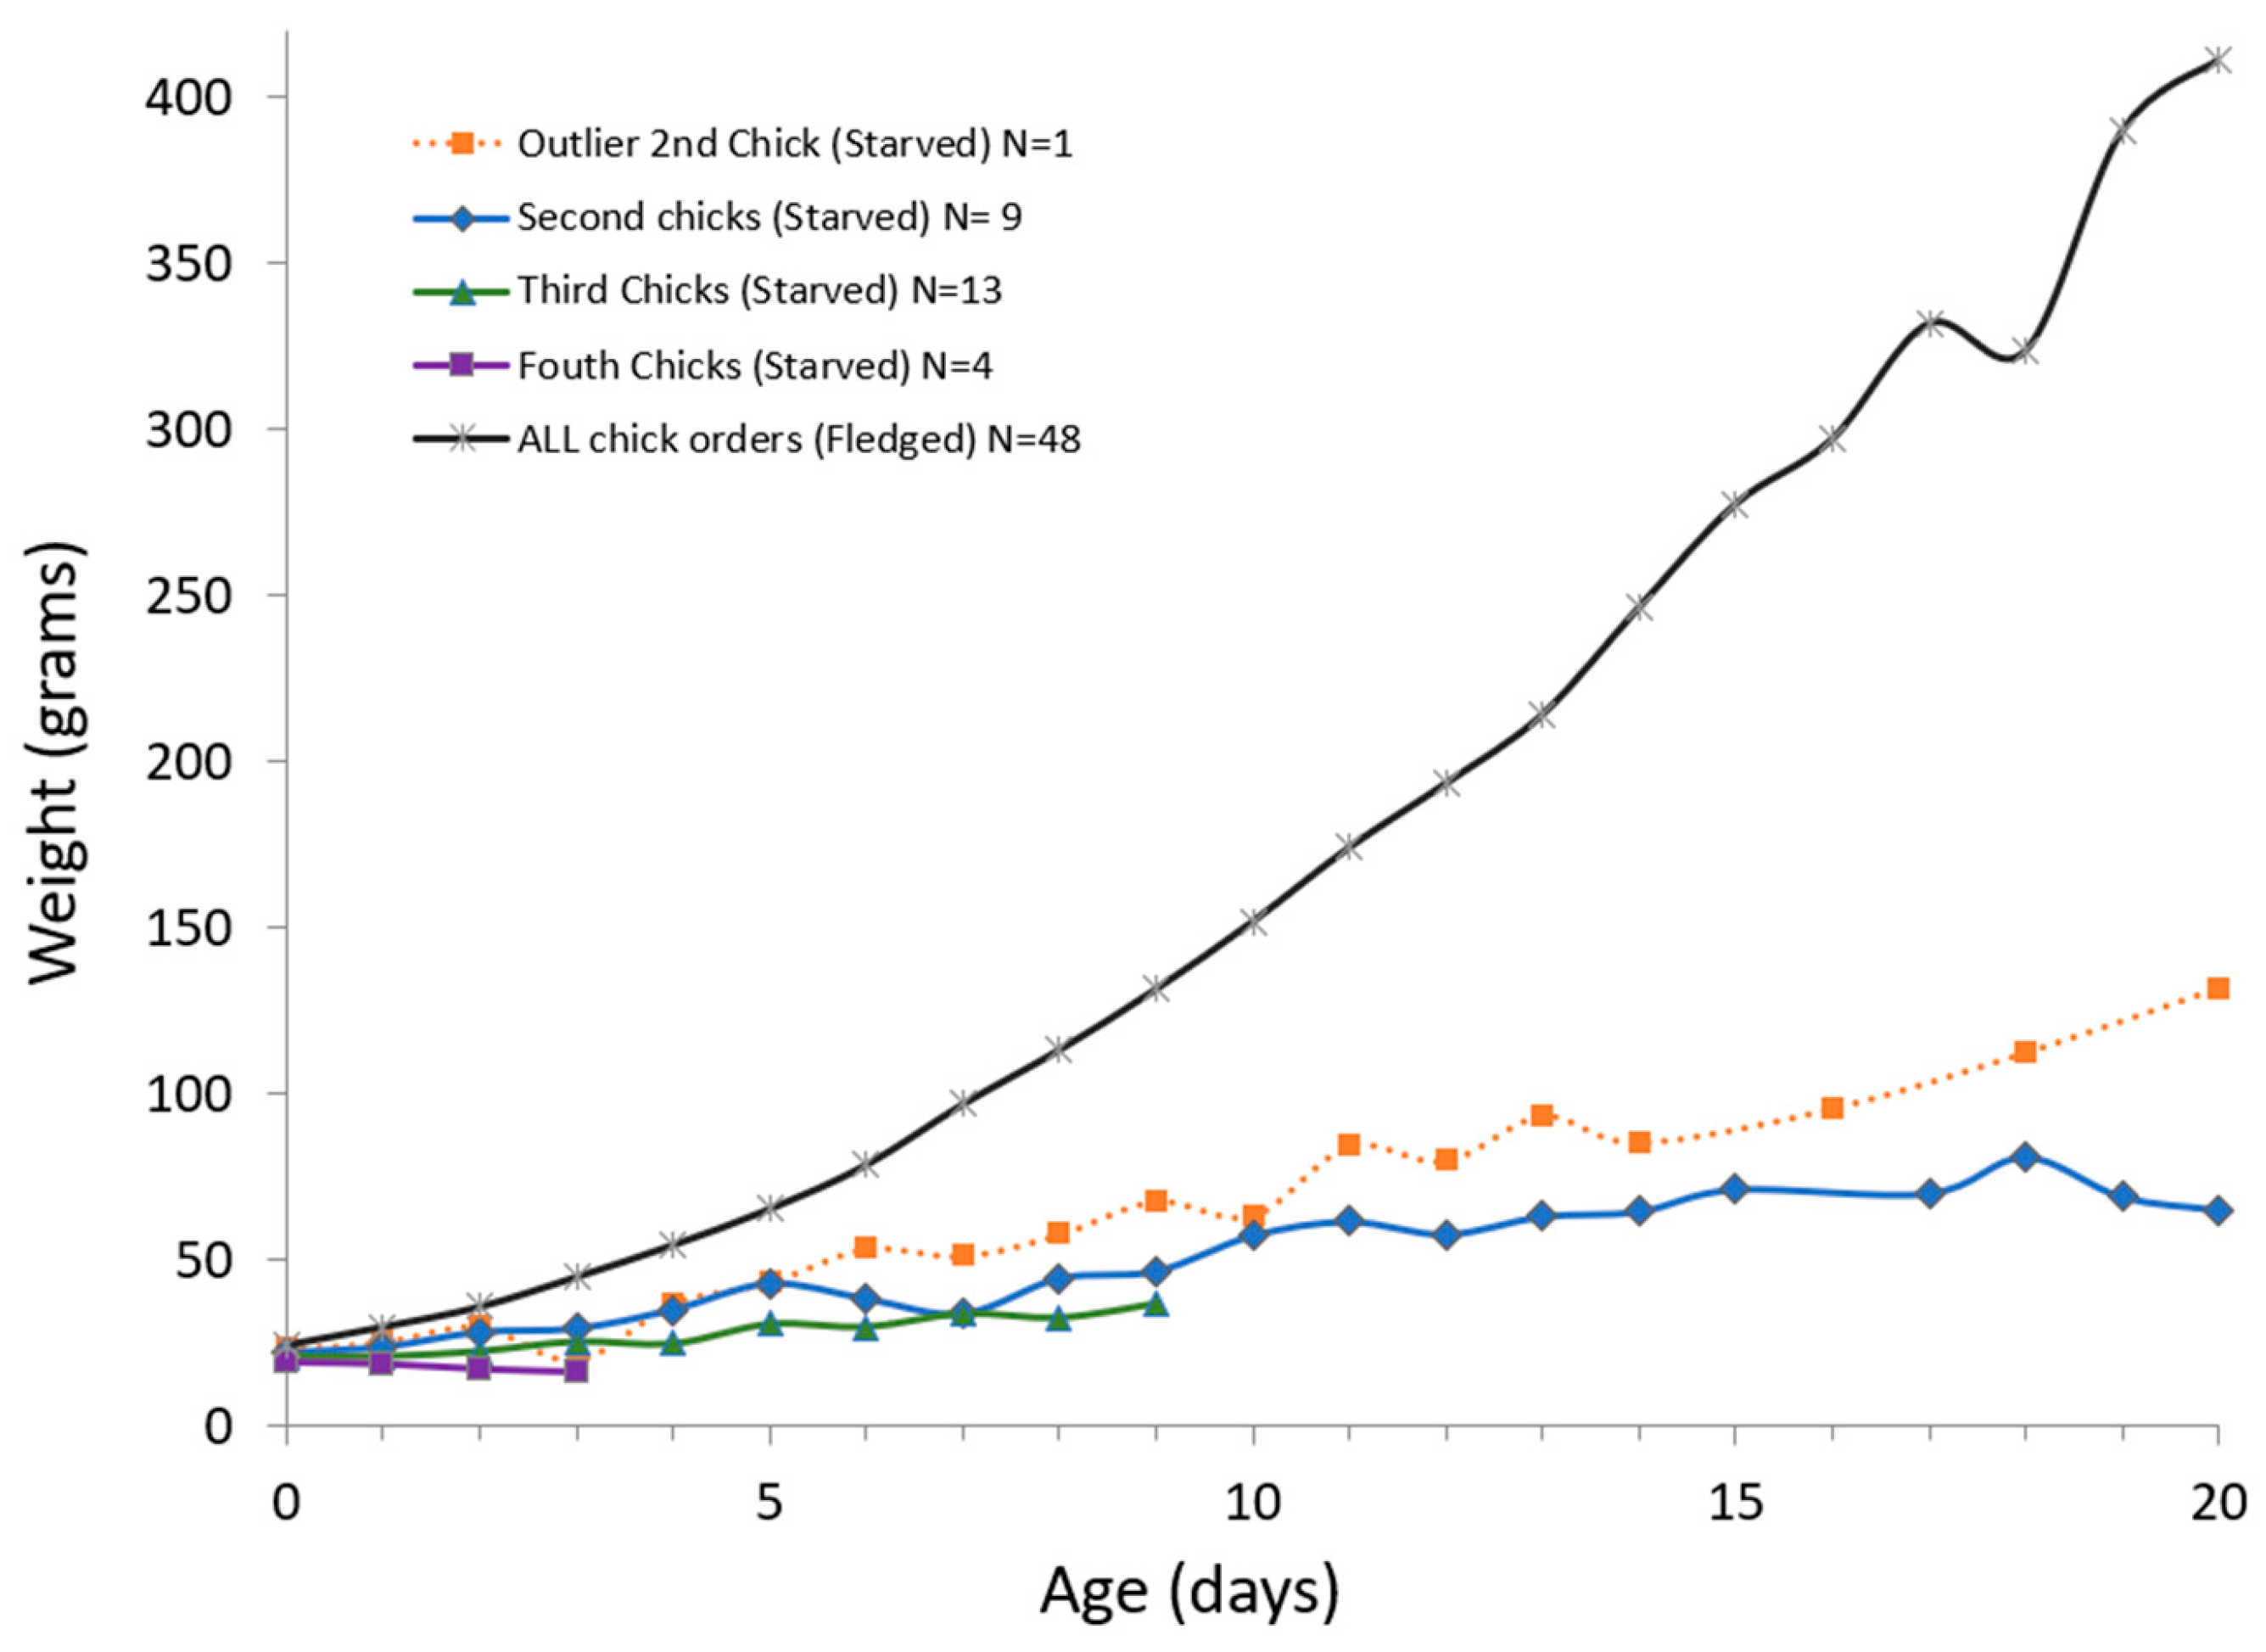
Chicks that starved usually showed very small or empty crops throughout their lives, averaging 0.8 ± 0.8 on a scale from zero to four (Table 1). Their daily weight was 30 to 60% less than the average daily weight of chicks that fledged (Figure 1, Figure 2 and Figure 3). Nearly all that starved died at a very young age (from 1 to 20 days old). One outlier died at 36 days old during a hostile nest takeover attempt after losing around 20% of its body weight (Table 1 and Figure 4).
Hatch weight differed significantly by brood order (ANOVA: N = 80 chicks, DF = 3.76, F ratio = 4.15, p = 0.0089). First-hatched chicks (26.5 ± 5.7 g, N = 18) weighed significantly more at hatching than 3rd chicks (20.8 ± 3.5, N = 19) or 4th chicks (18.5 ± 2.1 g, N = 4, Pairwise Student’s t-test: p < 0.01 for both). Second chick hatch weights (23.5 ± 6.6, N = 39) tended to be lower than those of first-hatched chicks (p = 0.06) and higher than 3rd chicks (p = 0.1) but differences were not significant. Age at death differed significantly by brood order (Table 1). Fourth chicks and third chicks died significantly younger than second chicks (N = 16 chicks that starved: 8 s chicks, 14 third chicks and 3 fourth chicks; Pairwise Student’s t-test: t ratio ≤ −2.4, DF = 23, p ≤ 0.03, Table 1). Age at death differed significantly by brood order (Table 1). Fourth chicks and third chicks died significantly younger than second chicks (N = 16 chicks that starved: 8 s chicks, 14 third chicks, and 3 fourth chicks; Pairwise Student’s t-test: t ratio ≤ −2.4, DF = 23, p ≤ 0.03, Table 1).

3.2. Section 2: Drivers of Second Chick Starvation

Here, we address the hypotheses that starvation of second chicks in our system is due to the following: (1) chick–chick interactions, (2) parent–environment interactions, and (3) parent–chick interactions.

3.2.1. Chick–Chick Interaction

Chick pushing: We hypothesized that second chicks that starved would be pushed more by their nestmates than those that did not starve. However, we observed chicks directly pushing other chicks only 47 times during ~934 h of video of 51 chicks (8 double broods, 11 triple broods, and 1 quadruple brood) over seven breeding seasons. Our videos included chicks from 0 to 79 days of age and pushing behavior was observed by chicks from 3 to 69 days old. The pushing rate was one push per 19.9 h of observation. During these same video observations, we recorded 10,859 chick feeding events. The pushing to feeding ratio was about 1:231.
The frequency with which second chicks were pushed by a first chick was not significantly related to second chick starvation (mean pushes against chicks that starved = 0.0013 pushes/min, N = 7 chicks; mean pushes against chicks that did not starve = 0.0007 pushes/min, N = 13 chicks; logistic regression: N = 20, χ2 = 0.31, DF = 1, p = 0.58). As a result, this hypothesis was not supported by the data.
Chick interference during feeding: We hypothesized that second chicks that starved would be interrupted during feeding more by their nestmates than those that did not starve. We observed 2426 chick feeding events during 10,414 min of video analyzed among 38 chicks across four breeding seasons and 14 broods (3 double broods, 11 triple broods; 4 broods with second chicks that died by starvation; age range observed = 0 to 36 days old). We observed only five instances in which a chick pushed the adult’s beak while the adult was feeding another chick. This interference behavior was observed when chick ages ranged from 8 to 17 days old, when all brood members observed still had their eyes closed (on average chicks opened their eyes at the age of 17.4 ± 2.6 days, [40]). In all the cases, the pushed chick was the smallest chick in the brood. The pushing chick redirected the parent to feed it during two of the five events recorded, and in both cases, it was the first chick that successfully redirected the parent to feed them.
Pushing the adult’s beak during feedings was not significantly related to second chick starvation (logistic regression: N = 14 s chicks, 5 chicks starved and 9 chicks did not starve, χ2 = 0.21, DF = 1, p = 0.65) or the third chick (logistic regression: N = 14: 13 chicks starved and 1 did not starve, χ2 = 0.53, DF = 1, p = 0.70). As a result, this hypothesis was not supported by the data.

3.2.2. Parent–Environment Interaction

We hypothesized that fewer second chicks would starve during times of high food availability. However, food availability during key developmental periods was nearly identical or averaged only slightly higher for chicks that did not starve and none of these differences approached significance (Table 2). Given the available sample sizes and standard deviations, our analysis had a power of 80% or more to detect if food availability was 10% lower for starved chicks. Despite the relatively small sample size of chicks involved, these data coupled with the power analysis suggest that food supply did not drive chick starvation in this system.

3.2.3. Parent–Chick Interaction

Chick feeding rates: Our data supported the hypothesis that chicks that fledged would be fed by the parents significantly more than those that died of starvation. Overall, first chicks were fed 5.4 ± 3 times/hour which is significantly greater than feedings to second chicks (2.9 ± 1.7 per hour; N = 14 broods from five breeding seasons including 5 successful double broods and 9 double broods with second chick starvation as above; t-test: t ratio = 2.5, DF = 11.7, p= 0.03). (N = 14 broods)
In broods where both chicks fledged, feedings to the second chicks averaged 1 ± 1.2 feedings per hour less than first chicks (N = 6 broods). In broods where the second chick starved, feedings to the second chick averaged 4 ± 2.8 feedings/hour less than first chicks (N = 9). The difference in feedings between the first and second chicks was significantly greater when the second chick starved than when the second chick fledged (nominal logistic regression: N = 15 double broods, 9 double broods with second chick starvation, and 6 successful double broods, R square = 0.3, χ2 = 6.1, p = 0.014).
Chick feeding ratios: Second chicks that died of starvation were fed significantly less than second chicks that did not die from starvation when compared to the first chicks in their broods (data from first 15 days of life for the second chick, C2:C1 feeding ratio for second chicks that starved: 0.46 ± 0.16, N = 9; C2:C1 feeding ratio of second chicks that did not starve = 0.77 ± 0.28, N = 5, t-test: −2.68, DF = 5.45, p = 0.04). A similar pattern was observed during the full chick starvation period (36 first days of life of the second chick, C2:C1 feeding ratio for second chicks that starved: 0.43 ± 0.23, N = 9, C2:C1 feeding ratio of second chick that did not starve = 0.84 ± 0.24, N = 5, t-test: −3.49, DF = 8.1, p = 0.008). Death by starvation was significantly negatively related to the C2:C1 feeding ratio for both the 0 to 15 and 0 to 36-day periods (N = 14 chicks: 9 s chicks that starved and 5 that did not starve; logistic regression (0 to 15 days): χ2 = 7.6, DF = 1, p = 0.0058; logistic regression (0 to 36 days): χ2 = 8.31, DF = 1, p = 0.0039).
Hatch weight: We hypothesized that hatch weight would be lower for chicks that died of starvation. However, starvation was not significantly related to weight at hatch (logistic regression: N = 35 chicks; 14 starved and 21 did not starve, χ2 = 2.43, DF = 1, p = 0.12) and hatch weight did not differ significantly between second chicks that died by starvation and second chicks that did not starve (mean starved: 22.2 ± 5 g, N = 14 chicks; mean did not starve: 24.5 ± 3.5 g, N = 21 chicks, t-test: t ratio = −1.44, DF = 21.5, p = 0.164). However, with only 35 s chicks, power analysis suggests we had only a 33% chance of detecting a significant difference if hatch weight of starved chicks was 10% lower than chicks that did not starve. To detect a 10% weight difference, a sample size of ~110 chicks would have been needed for a power of ~80%. Given the trend towards lower hatch weights for starved chicks, relatively low p values (<0.2), the low power of this analysis, and the significant differences in hatch weight by brood order, we suggest more research is needed to determine the role of hatch weight in Scarlet Macaw chick starvation.
Brood age difference: Our data support the hypothesis that the larger the age difference between chicks in a brood, the more likely the younger chicks would starve. The age difference between first chicks and second chicks that died by starvation was significantly greater than the age difference between first chicks and second chicks that did not die by starvation (starved = 4.1 ± 2.2 days later, N = 13; did not starve = 2.7 ± 1.1 days later, N = 33, t-test: t ratio = 2.14, DF = 14.4, p = 0.04). The probability of second chick starvation was significantly positively related to the age difference between the first and second chick (logistic regression: N = 46 s chicks, 13 starved and 33 did not starve; χ2 = 6.96, DF = 1, p = 0.008). When second chicks hatched ≥5 days later than the first chick, 4 of 5 died of starvation.

4. Discussion

Brood reduction in parrots through chick starvation is commonly reported in the literature (Appendix A) and chick starvation was the leading cause of chick mortality in our study: 27% of all second-hatched chicks starved, and nearly all third- and fourth-hatched chicks starved. We found no evidence that starvation was caused by sibling rivalry or food availability in the forest. We did find that (1) direct parental control of food distribution within the brood favors first hatch chicks and specifically disfavors second hatch chicks, which starve to death, and (2) a larger age difference between brood members was associated with a higher probability of starvation for the second chick.

4.1. Section 1: General Description of Macaw Chick Starvation

Chicks that starved during our study exhibited a variety of symptoms. In order from less to more severe, they were: (1) empty crop, (2) slow decline in body condition, (3) no weight gain, (4) grayish purple skin that is extremely tight on the body, 5) a disproportionally large head, (6) bony and thin appearance, (7) dull eyes, (8) upper part of the nostril area sunken in, forming a “V” shaped indentation, (9) eyelids opening very high instead of in the middle of the eye, (10) weight loss, and (11) hyperactive movements and constant loud begging when awake (Table A1). These signs of malnutrition observed in our study have been previously described by captive breeders, as many of these symptoms have been used for the last two decades to detect malnutrition problems [56,57,58]. Different symptoms have been used to diagnose early, intermediate, and late stages of stunted growth [59]. Malnutrition is a major problem in captive breeding because, if not identified and treated in time, it commonly causes reduced growth, stunting syndrome, and chick death [58]. In the wild, malnutrition has been studied in less detail, but previous research has documented empty crops [60], declining body condition [12], and general malnutrition [37] in wild chicks that died of starvation.
Our findings that third and fourth chicks die sooner than second chicks likely relates to the number of feedings each chick type received. Our preliminary results on chick feeding patterns of starved chicks showed that second chicks were fed much less than first chicks, third chicks even less, and fourth chicks were rarely fed [61]. In captivity, macaw hatchlings need to be fed as soon as they start to appear restless and vocalize a little [56] (Abramson et al., 1995), which is around 4 h after hatching (Mark Moore personal communications). After that, they need to be fed preferably every 2 h or at least nine times/day for the first few days, otherwise they often dehydrate, lose weight, and die [32]. In Tambopata, fourth chicks starved to death even quicker than third chicks because they were rarely fed by their parents.
Many studies have found that reproductive parameters differ between nests in natural and artificial nest sites [45,62,63]. However, our finding that the number of chicks fledged per successful nest does not differ between nest types suggests that brood reduction is likely similar for pairs nesting in both natural and artificial nest sites in this study (Supplemental Materials: Scarlet Macaw Nesting Parameters in Natural versus Artificial Nests).

4.2. Section 2: Drivers of Second Chick Starvation

4.2.1. Chick–Chick Interaction Analysis: Siblicide

Our results clearly show that sibling rivalry was not a cause of starvation of second chicks in Scarlet Macaws in Tambopata. The frequency of chick pushing observed was extremely low (once every 20 h) and it was not significantly related to second chick starvation. In addition, chicks pushed adults’ beaks while feeding other chicks just five times in over 160 h. Our observations suggest that chicks displayed a subtle scramble competition to get closer to feeding parents, but that Scarlet Macaw parents in Tambopata are apparently not distributing food based on the outcome of chick interactions.

4.2.2. Parent–Environment Interaction Analysis

We found that food availability in the adjacent forest was not significantly associated with second chick starvation. This was the case for the first 36 days of the brood, for the first 15 days of the brood, and also for the 7-day period pre- and post-hatching. Death by starvation of second chicks in our study was not higher when there was less food available, and it was not lower when there was more food available in the forest.
These results agree with previous findings for the Green-rumped Parrotlet, where brood manipulation and supplemental feeding in the field showed that size differences among brood members influenced the survival of last and penultimate chicks more than supplemental food [13]. In fact, the majority of studies of wild psittacines have failed to support the idea that food limitation is the driver of chick starvation. In Red-crowned Amazons in Mexico, brood reduction by starvation did not occur due to food stress, and starvation was not associated with peaks in chick food needs [12]. In Black-billed Amazons in Jamaica, starvation of the last (fourth) chick appeared to be a result of unequal food distribution among siblings as a result of size differences associated with asynchronous hatching [14]. In a brood of Puerto Rican Amazons, one chick died due to “inadequate nourishment” while two larger siblings were kept at high growth rates [64]. Finally, in Crimson Rosellas in Australia, chick starvation was not higher in the driest year of a study, when there was presumably less food [16]
In contrast, a few studies have found evidence that food limitation might be indirectly related to brood reduction by starvation. In Australia, black cockatoos from a population where 5% of second chicks survived may have had more available food than in a population in which no second chicks survived [22]. In that study, populations that fledged second chicks foraged closer to their nests, using an area one fourth the size of that used by populations in which no second chicks survived [22]. This suggests that the differences between populations may have involved not only food availability but provisioning rates as well [22].
The lack of a relationship between food availability and second chick starvation in our study may be due to: (1) the scale at which we measured food availability, (2) chick diet specificity, or (3) a true lack of relationship between food availability and starvation. The area in which we quantified food availability could have been too small, as Scarlet Macaws are capable of moving long distances [65]. Unpublished data from our site suggest that males spend most of their time within 5 km of their nests when chicks are >40 days old [65]. Unfortunately, there is no information about macaw movements during the chick starvation period. A quantification of food availability in an area bigger than 2.5 km radius would be needed to better test this hypothesis.
Chick diet specificity could be important because hatchlings and very young macaw chicks may have different dietary requirements from adults. The list of plant species consumed by Scarlet Macaws we used comes from year-round observation of adults, not just from the breeding season or the time when chicks were very young. Despite these limitations, the lack of evidence in the literature to support the food limitation hypothesis in psittacines, coupled with our data and other findings, suggests that limited food supply is not an important factor causing chick starvation in our study species.

4.2.3. Parent–Chick Interaction Analysis

Chick feeding: We found that Scarlet Macaw parents directly control food distribution within the brood. Parents actively allocated more food to first chicks and less to second chicks, even in broods where second chicks fledged. In addition, the difference between first and second chick feeding rates when second chicks starved was significantly larger than when second chick fledged. The difference in feeding ratios for broods in which second chicks fledged and those in which second chicks starved clearly shows that Scarlet Macaw parents were directly allocating more food to older chicks and limiting food to second chicks that were destined to starve. Our anecdotal observations support the intentional nature of this food distribution: we have repeatedly observed females trying to feed first-hatched chicks when their crops are completely full, while second chicks are on the other side of the nest, begging, with an empty crop.
Direct control of food distribution within the brood was also reported in captive Budgerigars [47], wild Crimson Rosellas [66], and wild Green-rumped Parrotlets [67]. In all cases, including our study, parents’ feedings were apparently independent of nestling behavior, especially when chicks were very young, blind, and with low locomotor control (<10 days old).
In contrast to our findings, Budgerigars [47] and Crimson Rosellas [68] selectively fed last chicks. Female Budgerigars fed all chicks equal numbers of times regardless of hatching order, but fed younger chicks first, and undersized nestlings were fed as though they were younger [47]. In the Crimson Rosellas, brood manipulation experiments showed that hungry last-hatched chicks were fed more by both males and females, but when the whole brood was hungry, parents were not able to compensate, and all chicks lost mass. In this case, males switched to feeding all brood members and females switched to feed first chicks preferentially [68]. Apparently, when adverse conditions started compromising chick survival, females fed the chicks that had already received a bigger energy investment, thereby increasing the chances of fledging at least one chick. It is possible that the Scarlet Macaws in Tambopata have a similar chick feeding strategy and that is why they preferentially feed first-hatched chicks.
It appears that the two patterns of direct food allocation in psittacines are not rigid. Preferential feeding of last-hatched young varies in relation to brood size, small vs. large broods [68] and reduced feeding to last-hatched young [67] varies in relation to chick hunger (individual vs. whole brood hunger). This suggests that psittacine parental food allocation patterns might not be fixed throughout the nestling stage. Indeed, the fact that growth parameters of first and second Scarlet Macaw chicks that fledged are not significantly different [33] suggests parents may change their feeding strategy later in the nesting season to favor second chicks, allowing them to catch up to their older siblings.
Chick quality: Second chicks that starved weighed about 6% less at hatch than those that did not starve, but this difference was not significant. Given the small sample sizes and high deviations in our dataset, our analysis had very little power to detect differences of <20%, so our analysis of the role of hatch weight in starvation of second chicks was inconclusive. However, the hatch weights were highest for first-hatched chicks and dropped by about 11% for each subsequently hatched chick, and the hatch weight differences between first and third and first and forth chicks were statistically significant. This suggests that the quality of chicks at hatch is lower for later-hatched chicks. Currently, we do not have the data to determine if these differences were driven by variations in incubation or parental investment in the egg. Our findings contrast somewhat with those from wild Green-rumped Parrotlets, in which volume (another surrogate measure for chick quality) did not vary with laying order [69], but are supported by data from other taxa that show that hatch weight is a good indicator of chick quality that correlates with chick survival [70,71]. Given the paucity of studies on psittacines, additional research is needed to help resolve questions about the causes and consequences of chick quality and hatch weight.
Brood member age difference: Age differences between first- and last-hatched wild psittacine chicks can span from 7 to 16 days, resulting in huge size disparities among brood members [13]. Our analysis suggests that the larger the age difference between brood members, the more likely the second chick will starve. When second chicks hatched soon after the first, they had very low chances of starvation; however, when they hatched ≥5 days later, the chance of starving increased to >80%. Similar findings come from brood manipulation experiments conducted with Green-rumped Parrotlets, in which the probability of survival to fledging was found to be a function of hatch order, brood size, and brood synchrony [13], with lower starvation rates in more synchronized broods. Other studies have also found that chick size differences due to hatching asynchrony are key drivers of starvation-mediated brood reduction in psittacines [13,14,67].
However, evidence from our chick manipulation experiments suggest that this age difference driven starvation may be more nuanced. When chicks over 20 days of age are moved between nests, Scarlet Macaws can raise two chicks that are separated by as many as 11 days of age and up to 250 g of bodyweight [72]. This age-driven difference in outcome may be because a hatchling and a 5-day-old chick have different mass growth patterns [33] and because of that, their parental care requirements are likely different. In fact, feeding and brooding requirements are extremely age specific for young chicks [31]: recommended brooding temperatures in captivity for newly hatched macaw chicks and 5–9-day-old chicks differ by over 6 degrees C. Indeed, it is well known in aviculture that at <5 days old, chicks need to be monitored separately, because temperature is critical during this stage of development to such an extreme that temperature fluctuations can be fatal to the chicks [32,58]. In contrast, a 20-day-old and a 30-day-old chick are quite similar developmentally and have similar parental care needs. Perhaps it is for this reason that brood reduction through starvation is concentrated in the first 2 to 3 weeks of the life of the brood.

5. Conclusions

Brood reduction through starvation is a commonly observed phenomenon in psittacines. We found no evidence to support the hypotheses that competition among chicks or lack of food in the environment were driving starvation among Scarlet Macaw nestlings in an intact landscape in southeastern Peru. Instead, we found that brood order was a major driver of starvation, with younger chicks suffering higher rates of starvation in multi-chick clutches. Our work suggests that Scarlet Macaw nesting pairs can adjust individual parental care for chicks with age differences up to 4 days and still reach almost 75% fledgling success for the second chick. However, in the case of large age differences (≥5 days) if parents fail to provide age-specific feeding and brooding care to the younger chick, its chance of survival drops greatly. This evidence suggests that developmental stage and parental care requirements of young chicks (as opposed to simple age difference) may drive brood reduction through starvation among the Scarlet Macaws. Our finding that hatch order and age difference appear more important than inherent qualities of the chick strengthens the case that these doomed chicks are a valuable resource that can be used by conservation projects to help boost population numbers and aid population recovery [72].

Supplementary Materials

The following supporting information can be downloaded at: https://www.mdpi.com/article/10.3390/d16110657/s1: Scarlet Macaw Nesting Parameters in Natural versus Artificial Nests, Table S1: Hatch failure rates for Scarlet Macaws nesting in natural versus artificial nest sites, Table S2: Nest failure rates for Scarlet Macaw clutches in natural and artificial nest sites, Table S3: Clutch sizes for Scarlet Macaws nesting in natural versus artificial nest sites, Table S4: Number of chicks hatched (brood size) for Scarlet Macaw broods in natural and artificial nest sites, and Table S5: Chicks fledged per successful nest for Scarlet Macaws nesting in natural versus artificial nests.

Author Contributions

Conceptualization, G.V.-T. and D.J.B.; Methodology, G.V.-T., D.J.B. and G.M.-S.; Formal Analysis, G.V.-T. and D.J.B.; Investigation, G.M.-S. and G.V.-T.; Data Curation, G.V.-T. and G.M.-S.; Writing—Original Draft Preparation, G.V.-T.; Writing—Review and Editing, D.J.B.; Supervision, G.V.-T. and D.J.B.; Project Administration, G.V.-T.; Funding Acquisition, D.J.B. All authors have read and agreed to the published version of the manuscript.

Funding

G.V.-T.’s participation in this work was supported by a National Science Foundation (NSF) Graduate Research Fellowship, by a Diversity Fellowship from Texas A&M University, and a Regents Fellowship from the College of Agriculture and Life Science at Texas A&M University. Chick-rearing work was funded by two crowdfunding campaigns at Experiment.com along with donations from Chris Biro (Bird Recovery International), and Dr. Janice Boyd (Amigos de las Aves USA and The Parrot Fund). Macaw chick formula was donated by ZuPreem. Discounted rates for logistics and support for project field leaders were given by Rainforest Expeditions S.A.C. thanks to Kurt Holle. Data collection was funded in part by the Schubot Center for Avian Health thanks to Dr. Ian Tizard and additional donations to the Brightsmith Lab at Texas A&M.

Institutional Review Board Statement

The animal use protocols used in this study were approved by the Institutional Animal Care and Use Committees of Duke University (A503-00-12-1, 1 December 2000 and subsequent renewals through 2006) and Texas A&M University (AUP 2006-202, 20 October 2006 and subsequent renewals). The work has been authorized by the Peruvian government under the following research permits: 35-2000-INRENA-DGANPFS-DANP, N° 04 S/C 2001-INRENA-DGANP, N° 19 S/C 2003-INRENA-IANP, N° 23 S/C 2004 INRENA-IANP, N° 25 C/C 2005 INRENA-IANP, N° 017 S/C 2006 INRENA-IANP, N° 044 C/C 2007 INRENA-IANP, N° 017 S/C-2008-INRENA-IANP, N° 030-2009-SERNANP-RNTAMB, N° 018-2010-SERNANP-RNTAMB, N° 005-2011-SERNANP-DGANP-JEF, N° 018-2012-SERNANP-RNTAMB, N° 19-2013-SERNAMP-JEF, N° 013-2014-SERNAMP-JEF, N° 33-2015-SERNAMP-JEF, N° 22-2016-SERNAMP-JEF, and N° 16-2018-SERNAMP-JEF.

Informed Consent Statement

Not applicable.

Data Availability Statement

The data presented in this study are available on request from the corresponding author. The data are not publicly available due to permit restrictions from the National Service of Protected Areas of Perú (SERNANP).

Acknowledgments

Thanks to T. Lacher, J. Packard, J. Boyd, M. Moore, A. Brightsmith, S. Brightsmith, I. Tizard, and S. Hoppes, for their support and guidance during this study. Special thanks to M. Aguirre, L. Villanueva Paipay, D. Whitaker, and D. Delgado Huancas de Martinez and the many field leaders, veterinarians, and the macaw project assistants who aided in data collection and data entry. Thanks also to K. Holle, M. Gonzales, and the staff of the tourism lodge Tambopata Research Center.

Conflicts of Interest

The authors declare no conflicts of interest. The funders had no role in the design of the study; in the collection, analyses, or interpretation of data; in the writing of the manuscript; or in the decision to publish the results.

Appendix A

Table A1. Reports of psittacine brood reduction from the literature and unpublished data. Sources are referenced by number and available in the References section.
English NameScientific NameLocation ReportedSource
Hyacinth MacawAnodorhunchus hyacinthinusBrazil[73]
Green-wing MacawAra chloropterusPeru[74]
Scarlet MacawAra macaoMexico[75]
Guatemala[35]
Costa Rica[34,76]
PeruThis study, [37,39]
Blue-and-yellow MacawAra araraunaPeru[77,78]
Yellow-headed AmazonAmazona oratrixMexico[12]
Red-crowned AmazonAmazona autumnalesMexico[12]
Red-lored AmazonAmazona viridiginalesMexico[12]
Black-billed AmazonAmazona agilisJamaica[14]
Yellow-billed AmazonAmazona collariaJamaica[14]
Puerto Rican AmazonAmazona vittataPuerto Rico[64]
Yellow-Shouldered AmazonAmazona barbadensisVenezuela[79]
Red-spectacled AmazonAmazona petreiBrazil[80]
Red-tailed AmazonAmazona brasilensisBrazil[80]
Blue-fronted AmazonAmazona aestivaBrazil[81]
Monk ParakeetMiopsitta monachhusArgentina[82]
Burrowing ParrotCyaniliseus patagonusArgentina[23]
Green-rumped ParrotletForpus passerinusVenezuela[13,69]
Black-cockatooZanda spAustralia[22]
Red-tailed black cockatooCalyptorhynchus magnificusAustralia[83]
Long-billed CorellaCacatua pastinatorAustralia[84]
GalahCacatua roseicapillaAustralia[83,85]
Crimson RosellaPlatycercus elegansAustralia[16]
Ouvea ParakeetEunymphicus cornutus uvaeensisNew Caledonia[86]

References

  1. Stanning, M.J. Hatching asynchrony, brood reduction and other rapidly reproducing hypotheses. Trends Ecol. Evol. 1996, 11, 243–246. [Google Scholar] [CrossRef] [PubMed]
  2. Lack, D. The significance of clutch-size. IBIS 1947, 89, 302–352. [Google Scholar] [CrossRef]
  3. Stoleson, S.; Beissinger, S. Hatching asynchrony and the onset of incubation in birds, revisited. In Current Ornithology; Power, D.M., Ed.; Springer Science + Business Media: New York, NY, USA, 1995; pp. 191–271. [Google Scholar]
  4. Clark, A.B.; Wilson, D.S. Avian Breeding Adaptations: Hatching Asynchrony, Brood Reduction, and Nest Failure. Q. Rev. Biol. 1981, 56, 253–277. [Google Scholar] [CrossRef]
  5. Lack, D. The Natural Regulation of Animal Numbers; Clarendon: Oxford, UK, 1954. [Google Scholar]
  6. Ricklefs, R. Brood reduction in the Curve-billed Thrasher. Condor 1965, 67, 505–510. [Google Scholar] [CrossRef]
  7. Marc, B. Food suply and the occurence of Brood Reduction in Swainson’s Hawk. Wilson Bull. 1983, 95, 233–242. [Google Scholar]
  8. Drummond, H.; Havelas, C.G. Food shortage influences sibling aggresion in the blue-footed booby. Anim. Behav. 1989, 37, 806–819. [Google Scholar] [CrossRef]
  9. Drummond, H. A review of parent-offspring conflict and brood reduction in the Pelicaniformes. Colon. Waterbirds 1987, 10, 1–15. [Google Scholar] [CrossRef]
  10. Browne, T.; Lalas, C.; Matterns, T.; Vann Heezik, Y. Chick starvation in yellow-eyed penguins: Evidence for poor diet quality and selective provisioning of chicks from conventional diet analysis and stable isotopes. Austral Ecol. 2011, 36, 99–108. [Google Scholar] [CrossRef]
  11. Harper, R.G.; Julianho, S.A.; Thompson, C. Hatching asynchrony in the house wren. Behav. Ecol. Sociobiol. 1992, 3, 76–83. [Google Scholar] [CrossRef]
  12. Enkerlin-Hoeflich, E.C. Comparitive Ecology and Reproductive Biology of Three Species of Amazona parrots in Northeastern Mexico; Texas A&M University: College Station, TX, USA, 1995. [Google Scholar]
  13. Stoleson, S.H.; Beissinger, S.R. Hatching asynchrony, brood reduction, and food limitation in a Neotropical parrot. Ecol. Monogr. 1997, 76, 131–154. [Google Scholar] [CrossRef]
  14. Koenig, S.E. The breeding biology of Black-billed Parrot Amazona agilis and Yellow-billed Parrot Amazona collaria in Cockpit Country, Jamaica. Bird Conserv. Int. 2001, 11, 205–225. [Google Scholar] [CrossRef]
  15. Krebs, E. Breeding biology of crimson rosellas (Platycercus elegans) on Black Mountain Australian Capital Territory. Aust. J. Zool. 1998, 46, 119–136. [Google Scholar] [CrossRef]
  16. Krebs, E.A. Last but not least: Nestling growth and survival in asynchronously hatching Crimson Rosellas. J. Anim. Ecol. 1999, 68, 266–281. [Google Scholar] [CrossRef]
  17. Viñuela, J. Opposing selectie pressures on hatching asynchronoy: Egg viability, brood reduction and nestling growth. Behav. Ecol. Sociobiol. 2000, 48, 333–343. [Google Scholar]
  18. Simmons, R.E. Offspring quality and the evolution of cainism. Ibis 1988, 130, 339–357. [Google Scholar] [CrossRef]
  19. Moreno, J. Parental Infanticide in birds through early eviction from the nest: Rare or under-reported? J. Anim. Ecol. 2012, 43, 43–49. [Google Scholar] [CrossRef]
  20. Tortosa, F.S.; Redondo, T. Motives for Parental Infanticide in White Storks Ciconia ciconia. Ornis Scand. (Scand. J. Ornithol.) 1992, 23, 185–189. [Google Scholar] [CrossRef]
  21. Heinsohn, R.; Langmore, N.; Cockburn, A.; Kokko, H. Adaptative secondary sex ratio adjustments via sex-specific infanticidae in birds. Curr. Biol. 2011, 21, 1744–1747. [Google Scholar] [CrossRef]
  22. Saunders, D.A. The breeding behaviour and biology of the short-billed form of the White-tailed Black Cockatoo Calyptorhynchus funereus. Ibis 1982, 124, 422–455. [Google Scholar] [CrossRef]
  23. Masello, J.F.; Quillfeldt, P. Chick growth and breeding success of the burrowing parrot. Condor 2002, 104, 574–586. [Google Scholar] [CrossRef]
  24. Mock, D.W. Parent-offspring conflict, an unequal parental investment by egrets and herons. Behav. Ecol. Sociobiol. 1987, 20, 247–256. [Google Scholar] [CrossRef]
  25. Morandini, V.; Ferrer, M. Sibling agression and brood reduction: A review. Ethol. Ecol. Evol. 2015, 27, 2–16. [Google Scholar] [CrossRef]
  26. Krebs, E. Sibling competition and parental control: Patterns of begging in parrots. In The Evolution of Begging; Wright, J., Leonard, M.L., Eds.; Kluwer Academic Publishers: New York, NY, USA, 2002; pp. 319–336. [Google Scholar]
  27. Alastair, F.; Galipeau, P.; Nikolaiczuk, L. Brood reduction by Infanticidae in Peregrine Falcon. Artic 2013, 66, 226–229. [Google Scholar]
  28. Beissinger, S. Long term studies of the Green Rumped Parrotlet. Hatching asynchrony, social system and population structure. Ornitol. Neotrop. 2008, 73, 73–83. [Google Scholar]
  29. Braun, B.; Hunt, G.L. Brood Reduction in Black-Legged Kittiwakes. Auk 1983, 100, 469–476. [Google Scholar] [CrossRef]
  30. Krist, M. Egg size and offspring quality: A meta-analysis in birds. Biol. Rev. 2011, 86, 692–716. [Google Scholar] [CrossRef]
  31. Voren, H.; Jordan, R. Maintenance of Nestlings (Brooding). In Parrots: Hand Feeding & Nursery Management; Silvio Mattacchione, & Company: Port Perry, ON, Canada, 1992. [Google Scholar]
  32. Clubb, S.L.; Clubb, K.J.; Skidmore, D.; Wolf, S.; Phillips, A. Psittacine neonatal care and hand-feeding. In Psittacine Aviculture: Perspectives, Techniques and Research; Shubot, R.M., Clubb, K.J., Clubb, S.L., Eds.; Avicultural Breeding and Research Center: Loxahatchee, FL, USA, 1992. [Google Scholar]
  33. Vigo, G.; Williams, M.; Brightsmith, D.J. Growth of Scarlet Macaw (Ara macao) chicks in southeastern Peru. Neotrop. Ornithol. 2011, 22, 143–153. [Google Scholar]
  34. Vaughan, C. Conservacion de la lapa roja (Ara macao) con manejo in situ en el Pacifico Central de Costa Rica. Rev. Cienc. Ambient. 2019, 53, 166–188. [Google Scholar] [CrossRef]
  35. Boyd, J.; McNab, R.B. The Scarlet Macaw in Guatemala and El Salvador: 2008 Status and Future Possibilities. Findings and Recommendations from a Species Recovery Workshop 9–15 March 2008; Wildlife Conservation Society—Guatemala Program: Guatemala City and Flores, Peten, Guatemala, 2008; p. 178. [Google Scholar]
  36. Britt, C.; Anleu, R.G.; Desmond, M.J. Nest survival of a long=lived psittacid: Scarlet Macaws (Ara macao cyanoptera) in the Maya Biosphere Reserve of Guatemala and Chiquibul Forest of Belize. Condor Ornithol. Appl. 2014, 116, 265–274. [Google Scholar] [CrossRef]
  37. Nycander, E.; Blanco, D.H.; Holle, K.M.; Campo, A.D.; Munn, C.A.; Moscoso, J.I. Manu and Tambopata: Nesting success and techniques for increasing reproduction in wild macaws in southeastern Peru. In The Large Macaws: Their Care, Breeding and Conservation; Abramson, J., Spear, B.L., Thomsen, J.B., Eds.; Raintree Publications: Fort Bragg, CA, USA, 1995; pp. 423–443. [Google Scholar]
  38. Olah, G.; Vigo, G.; Heinsohn, R.; Brightsmith, D.J. Nest site selection and efficacy of artificial nests for breeding success of Scarlet Macaws (Ara macao) in lowland Peru. J. Nat. Conserv. 2014, 22, 176–185. [Google Scholar] [CrossRef]
  39. Vigo Trauco, G. Crecimiento de Pichones de Guacamayo Escarlata, Ara macao (Linneus: 1758) en la Reserva Nacional Tambopata—Madre de Dios—Perú. Professional. Licensure Thesis, Universidad Nacional Agraria La Molina, Lima, Peru, 2007. [Google Scholar]
  40. Vigo, G. Scarlet Macaw Nesting Ecology and Behavior: Implications for Conservation Management. Ph.D. Thesis, Texas A&M University, College Station, TX, USA, 2020. [Google Scholar]
  41. Tosi, J.A. Zonas de Vida Natural en el Perú. Memoria Explicativa Sobre el Mapa Ecológico del Perú; Instituto Interamericano de las Ciencias Agricolas de la Organización de los Estados Americanos: Lima, Peru, 1960; p. 271. [Google Scholar]
  42. Brightsmith, D.J. Effects of weather on avian geophagy in Tambopata, Peru. Wilson Bull. 2004, 116, 134–145. [Google Scholar] [CrossRef]
  43. Perry, D.R. A method of access into the crowns of emergent and canopy trees. Biotropica 1978, 10, 155–157. [Google Scholar] [CrossRef]
  44. Perry, D.R.; Williams, J. The tropical rain forest canopy: A method providing total access. Biotropica 1981, 13, 283–285. [Google Scholar] [CrossRef]
  45. Purcell, K.L.; Verner, J.; Oring, L.W. A Comparison of the Breeding Ecology of Birds Nesting in Boxes and Tree Cavities. Auk 1997, 114, 646–656. [Google Scholar] [CrossRef]
  46. Sudyka, J.; Di Lecce, I.; Szulkin, M. Microclimate shifts in nest-boxes and natural cavities throughout reproduction. J. Avian Biol. 2023, 2023, e03000. [Google Scholar] [CrossRef]
  47. Stamps, J.; Clark, A.B.; Arrowood, P.; Kus, B. Parent-offspring conflict in Budgerigars. Behav. Ecol. Sociobiol. 1984, 94, 40. [Google Scholar] [CrossRef]
  48. Lee, A.T.K.; Brightsmith, D.J.; Vargas, M.P.N.; Leon, K.Q.; Mejia, A.J.R.; Huanca, L.Y.Q.; Lee, A.K.; Marsden, S.J. Diet and geophagy across a western Amazonian parrot assemblage. Biotropica 2014, 46, 322–330. [Google Scholar] [CrossRef]
  49. Vaughan, C.; Nemeth, N.; Marineros, L. Scarlet macaw, Ara macao, (Psittaciformes: Psittacidae) diet in Central Pacific Costa Rica. Rev. Biol. Trop. 2006, 54, 919–926. [Google Scholar] [CrossRef]
  50. Brightsmith, D.J.; McDonald, D.; Matsufuji, D.; Matuzak, G. Diets of Wild Psittacines in Tambopata, Peru. A Progress Report to South Lakes Wildlife Animal Park; Duke University Department of Biology: Durham, NC, USA, 2006. [Google Scholar]
  51. Brightsmith, D.J.; Hobson, E.A.; Martinez, G. Food availability and breeding season as predictors of geophagy in Amazonian parrots. Ibis 2018, 160, 112–129. [Google Scholar] [CrossRef]
  52. Gilardi, J.D. Ecology of Parrots in the Peruvian Amazon: Habitat Use, Nutrition, and Geophagy. Ph.D. Dissertation, UC Davis, Davis, CA, USA, 1996. [Google Scholar]
  53. Gilardi, J.D.; Toft, C.A. Parrots Eat Nutritious Foods despite Toxins. PLoS ONE 2012, 7, e38293. [Google Scholar] [CrossRef]
  54. Brightsmith, D.J. Unpublished Database of Observations of Parrots Foraging in Southeastern Peru; Texas A&M University: College Station, TX, USA, 2000–2020. [Google Scholar]
  55. SAS Institute. JMP, Version 16.0.0; SAS Institute Inc.: Cary, NC, USA, 2021. [Google Scholar]
  56. Abramson, J.; Spear, B.L.; Thomsen, J.B. The Large Macaws: Their Care, Breeding and Conservation; Raintree Publications: Ft. Bragg, CA, USA, 1995. [Google Scholar]
  57. Clubb, S.L.; Wolf, S.; Phillips, A. Psittacine pediatric medicine. In Psittacine Aviculture: Perspectives, Techniques and Research; Shubot, R.M., Clubb, K.J., Clubb, S.L., Eds.; Avicultural Breeding and Research Center: Loxahatchee, FL, USA, 1992. [Google Scholar]
  58. Voren, H.; Jordan, R. Potential health problems in the nursery. In Parrots: Hand Feeding & Nursery Management; Silvio Mattacchione, & Company: Port Perry, ON, Canada, 1992. [Google Scholar]
  59. Speer, B.L. Stunting in the large macaws. Semin. Avian Exot. Pet Med. 1995, 4, 9–14. [Google Scholar] [CrossRef]
  60. Beissinger, S.; Stoleson, S. Nestling mortality patterns in relation to brood size and hatchingasynchrony in Green-rumped Parrotlets. In Proceedings of the Acta XX Congressus Internationalis Ornithologici, Christchurch, New Zealand, 2–9 December 1990. [Google Scholar]
  61. Vigo-Trauco, G. Unpublished Database of Observations of Parental Feeding Behavior by Macaw Parents in Southeastern Peru; Texas A&M University: College Station, TX, USA, 2018–2019. [Google Scholar]
  62. Evans, M.R.; Lank, D.B.; Boyd, W.S.; Cooke, F. A Comparison of the Characteristics and Fate of Barrow’s Goldeneye and Bufflehead Nests in Nest Boxes and Natural Cavities. Condor 2002, 104, 610–619. [Google Scholar] [CrossRef]
  63. Miller, K.E. Nesting Success of the Great Crested Flycatcher in Nest Boxes and in Tree Cavities: Are Nest Boxes Safer from Nest Predation? Wilson Bull. 2002, 114, 179–185. [Google Scholar] [CrossRef]
  64. Snyder, N.; Wiley, J.; Kepler, C. Reproductive Biology. In The parrots of Luquillo: Natural History and Conservation of the Puerto Rican Parrot; Morrison, M., Ed.; The Western Foundation of Vertebrate Zoology: Los Angeles, CA, USA, 1987. [Google Scholar]
  65. Brightsmith, D.; Boyd, J.; Hobson, E.; Randel, C. Satellite telemetry reveals complex migratory movement patterns of two large macaw species in the western Amazon basin. Avian Conserv. Ecol. 2021, 16, 14. [Google Scholar] [CrossRef]
  66. Krebs, E.A.; Cunningham, R.B.; Donnelly, C.F. Complex patterns of food allocation in asynchronously hatching broods of Crimson Rosellas. Anim. Behav. 1999, 57, 753–763. [Google Scholar] [CrossRef]
  67. Budden, A.E.; Beissinger, S. Resouce allocation varies with parental sex and brood size in the asynchronously hatching green-rumped parrotlet. Behav. Ecol. Sociobiol. 2009, 63, 637–647. [Google Scholar] [CrossRef]
  68. Krebs, E.; Margrath, R. Food allocation in Crimson Rosella broods: Parent differ in their responses to chick hunger. Anim. Behav. 2000, 59, 739–751. [Google Scholar] [CrossRef]
  69. Beissinger, S.R.; Waltman, J.R. Extraordinary clutch size and hatching asynchrony of a Neotropical parrot. Auk 1991, 108, 863–871. [Google Scholar]
  70. GRANT, M.C. Relationships between egg size, chick size at hatching, and chick survival in the Whimbrel Numenius phaeopus. Ibis 1991, 133, 127–133. [Google Scholar] [CrossRef]
  71. Williams, T.D. Intraspecific variation in egg size and egg composition in birds: Effects on offspring fitness. Biol. Rev. Camb. Philos. Soc. 1994, 69, 35–59. [Google Scholar] [CrossRef] [PubMed]
  72. Vigo-Trauco, G.; Garcia-Anleu, R.; Brightsmith, D.J. Increasing Survival of Wild Macaw Chicks Using Foster Parents and Supplemental Feeding. Diversity 2021, 13, 121. [Google Scholar] [CrossRef]
  73. Guedes, N.M.R.; Harper, L.H. Hyacinth Macaws in the Pantanal. In The Large Macaws: Their Care, Breeding and Conservation; Abramson, J., Spear, B.L., Thomsen, J.B., Eds.; Raintree Publications: Fort Bragg, CA, USA, 1995; pp. 395–421. [Google Scholar]
  74. Vigo-Trauco, G.; Brightsmith, D.J. Unpublished Data from Red-and-Green Macaw Nest Monitoring in Southeastern Peru; Texas A&M University: College Station, TX, USA, 2000–2020. [Google Scholar]
  75. Iñigo-Elias, E.E. Ecology and Breeding Biology of the Scarlet Macaw (Ara macao) in the Usumacinta Drainage Basin of Mexico and Guatemala. Ph.D. Dissertation, University of Florida, Gainesville, FL, USA, 1996. [Google Scholar]
  76. Vaughan, C.; Bremmer, M.; Dear, F. Scarlet Macaw (Ara macao) Parental nest visitation in Costa Rica. Rev. Biol. Trop. 2008, 57, 6. [Google Scholar]
  77. Brightsmith, D.J.; Bravo, A. Ecology and management of nesting Blue-and-yellow Macaws (Ara ararauna) in Mauritia palm swamps. Biodivers. Conserv. 2006, 15, 4271–4287. [Google Scholar] [CrossRef]
  78. Brightsmith, D.J. Unpublished Data from Blue-and-Yellow Macaw Nest Monitoring in Southeastern Peru; Texas A&M University: College Station, TX, USA, 1999–2004. [Google Scholar]
  79. Sanz, V.; Rodríquez-Ferraro, A. Reproductive parameters and productivity of the Yellow-shouldered Parrot on Margarita Isalnd, Venezuela: A long-term study. Condor 2006, 108, 178–192. [Google Scholar] [CrossRef]
  80. Sipinski, E.A.B. Unpublished Data from Monitoring Nests of Red-Spectacled and Red-Tailed Amazon Parrots; Sociedade de Pesquisa em Vida Selvagem e Educação Ambiental (SPVS): Curitiba, Brazil, 2002. [Google Scholar]
  81. Fernandes Seixas, G.H.; Mourão, G.d.M. Nesting success and hatching survival of the Blue-fronted Amazon (Amazona aestiva) in the Pantanal of Mato Grosso do Sul, Brazil. J. Field Ornithol. 2002, 73, 399–409. [Google Scholar] [CrossRef]
  82. Navarro, J.L.; Martella, M.B.; Bucher, E. Breeding season and productivity of monk parakeets in Cordoba, Argentina. Wilson Bull. 1992, 104, 413–424. [Google Scholar]
  83. Smith, G.T.; Saunders, D.A. Clutch size and productivity in three sympatric species of cockatoo (Psittaciformes) in the south-west of Western Australia. Aust. Wildl. Res. 1986, 13, 275–285. [Google Scholar] [CrossRef]
  84. Smith, G.T. Breeding ecology of the Western Long-billed Corella, Cacatua pastinator pastinator. Wildl. Res. 1991, 18, 91–110. [Google Scholar] [CrossRef]
  85. Rowley, I. The Behavioral Ecology of the Galah Eolophus roseicapilus in the Wheatbelt of Western Australia; Surrey Beatty & Sons: Chipping Norton, NSW, Australia, 1990. [Google Scholar]
  86. Robinet, O.; Salas, M. Reproductive biology of the endangered Ouvea Parakeet Eunymphicus cornutus uvaeensis. IBIS 1999, 141, 660–669. [Google Scholar] [CrossRef]
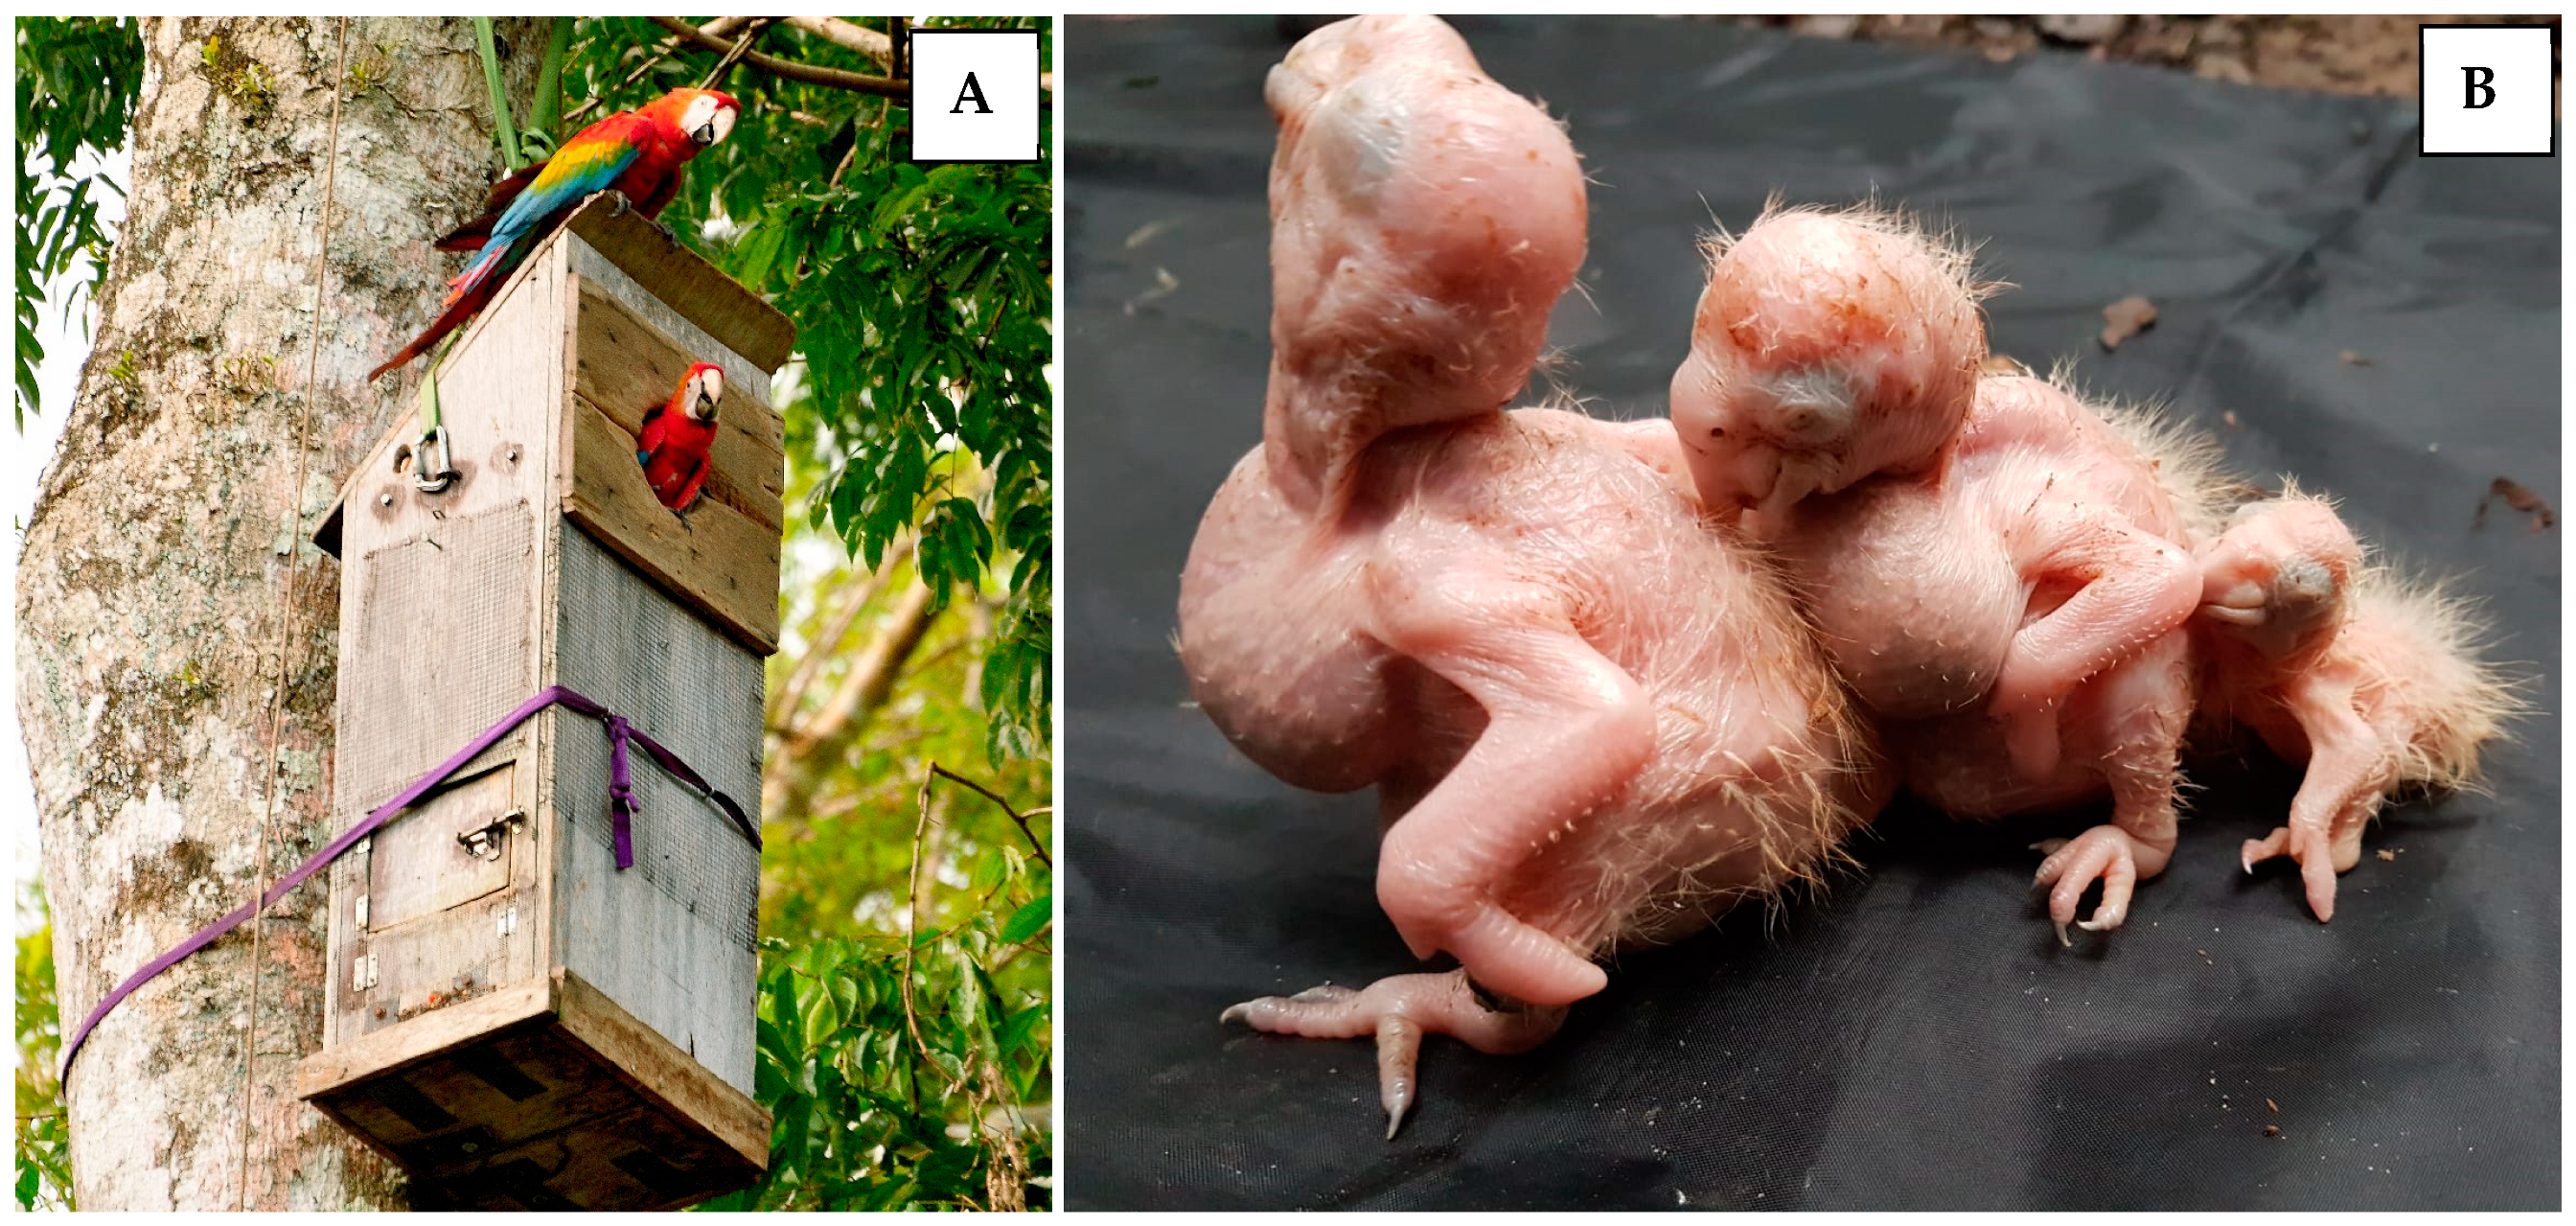
Figure 1. Images of macaw reproduction. (A) An artificial wooden nest in the Tambopata National Reserve. This is one of the 24 artificial nest sites monitored during this study. One adult Scarlet Macaw is sitting on top of the nest and a nearly fledging-aged chick is sitting in the entrance. Photo by Liz Villanueva Paipay. (B) A typical clutch of three macaw chicks showing the size difference between the first-hatched chick (left), second-hatched (middle), and third-hatched (right). This photo was taken during routine measurements after the chicks had been lowered to the ground (this is why the chicks are not in the nest cavity). Photo by Roshan Tailor.
Diversity 16 00657 g001
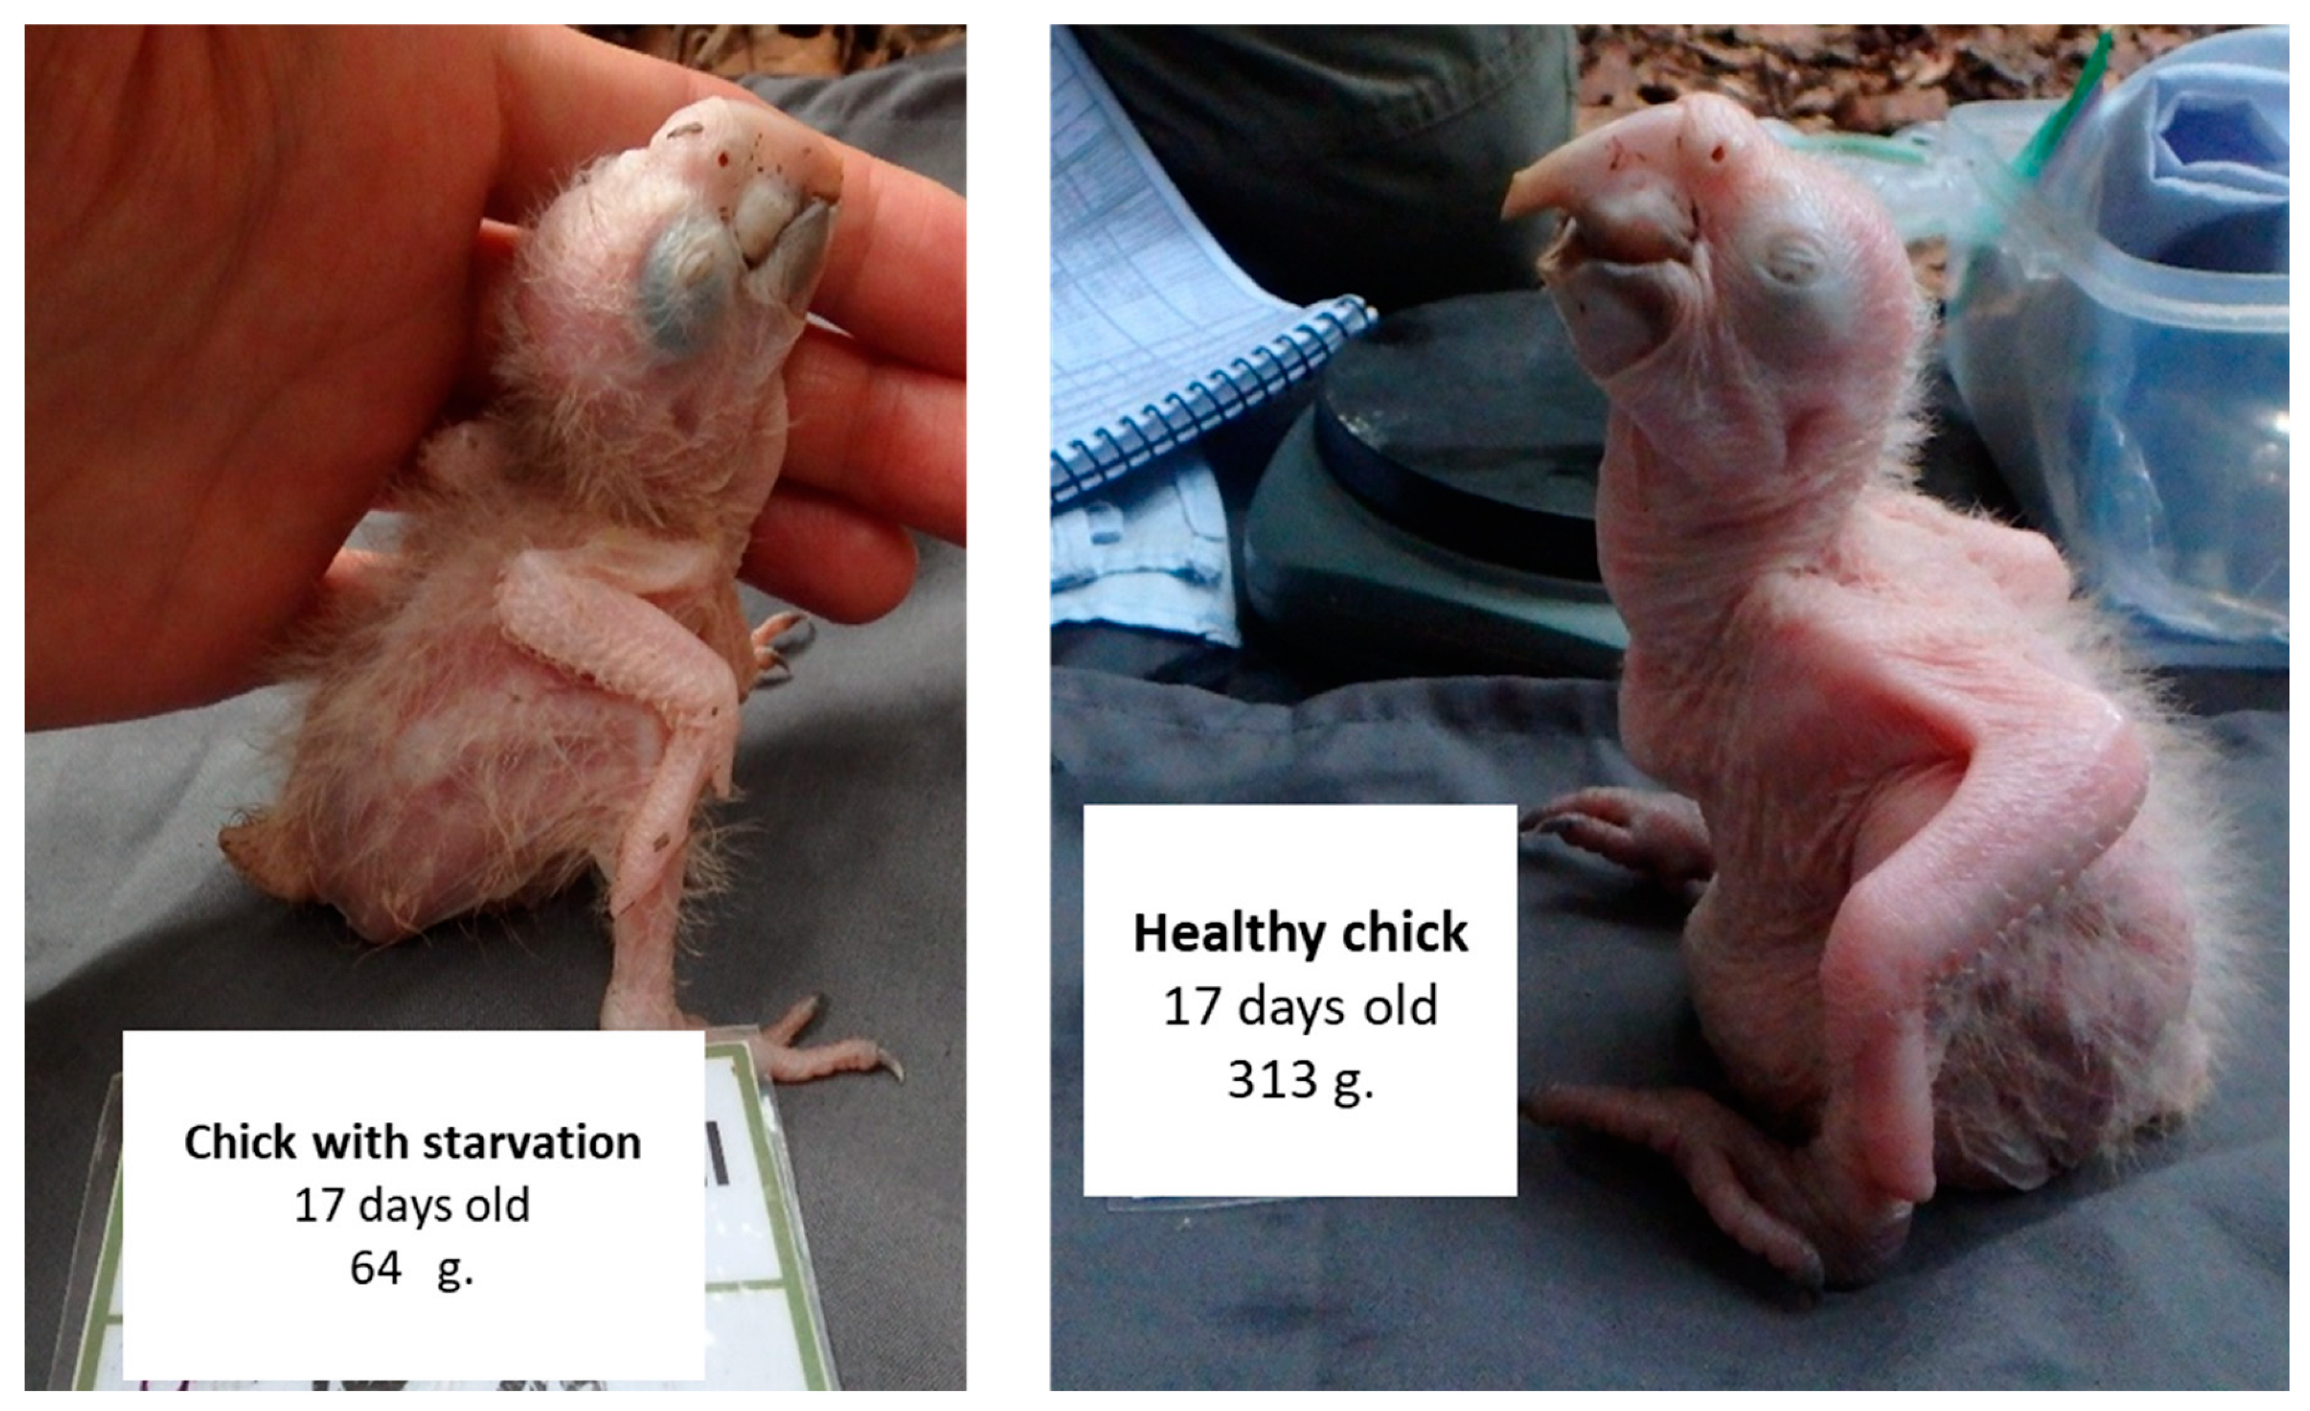
Figure 2. Photographic comparison between Scarlet Macaw chicks. Second chick that is starving (left) and healthy second chick (right) at the same age. Ages and weights are showed in each picture.
Diversity 16 00657 g002
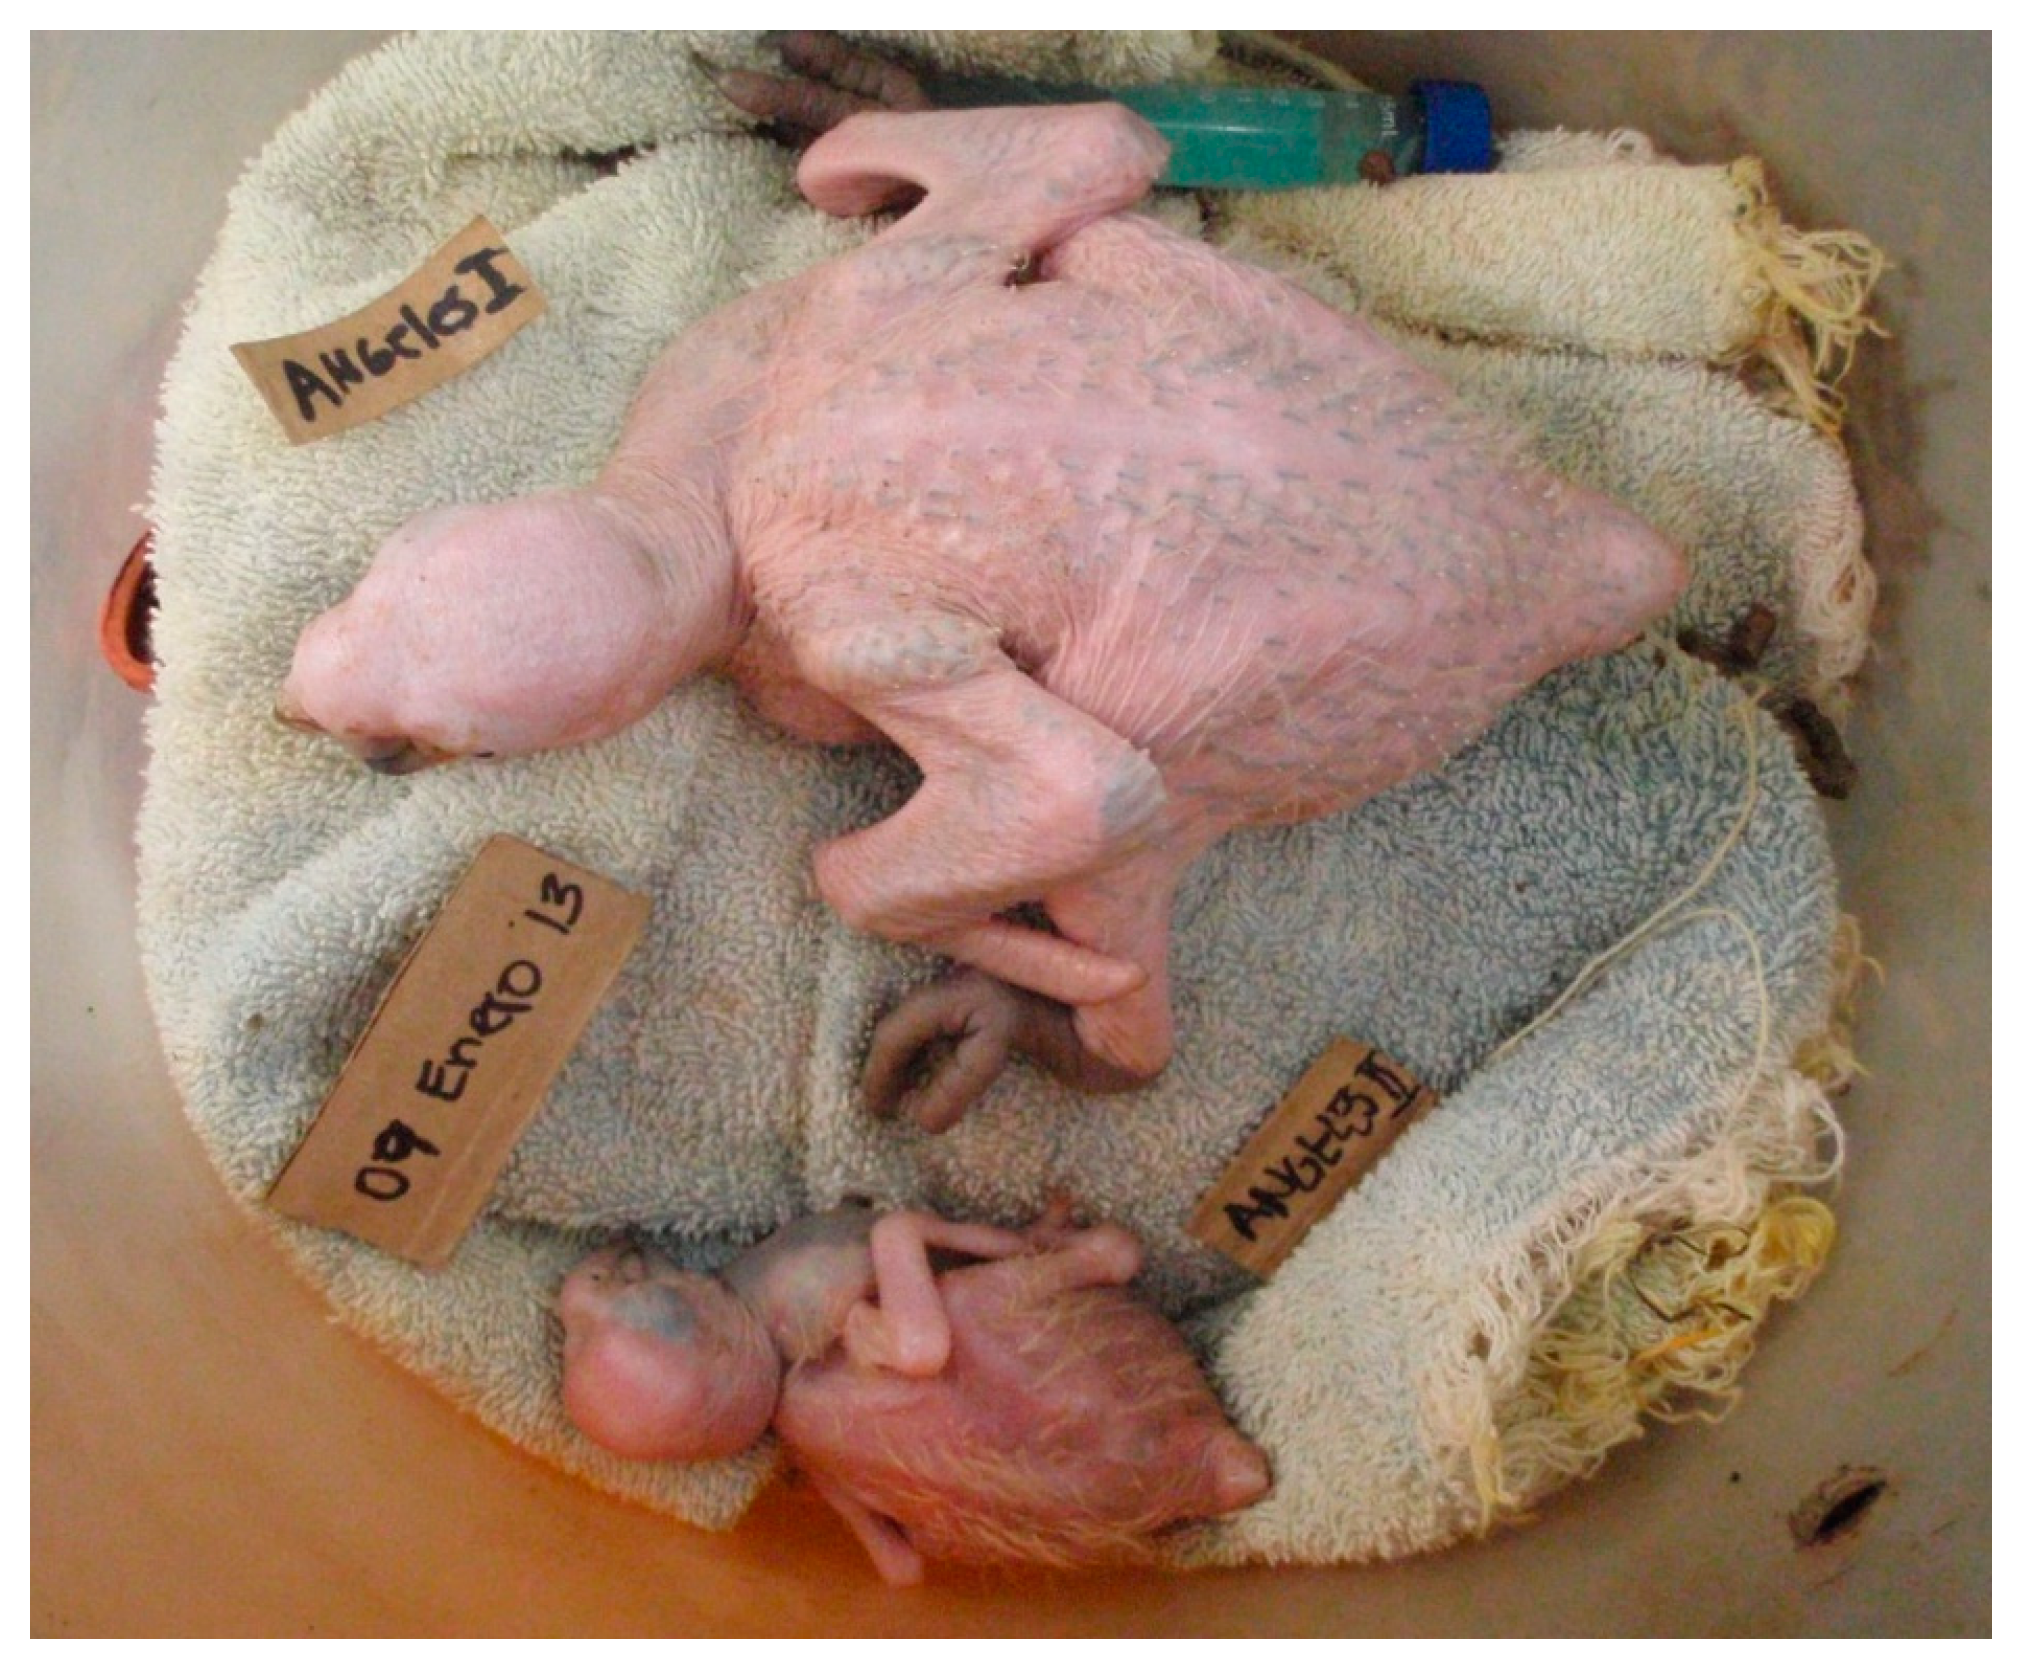
Figure 3. Severe case of chick starvation in Scarlet Macaw. The second chick (bottom) hatched four days after first chick (top). Signs of starvation are clearly seen in second chick (stunted growth, reddish skin coloration, and bulky eyes). The first chick weighed 465 g at 22 days consistent with the expected weight for its age. The second chick weighed 96 g at 18 days, much less than the expected weight for its age (327 g). The second chick (bottom) died at 25 days.
Diversity 16 00657 g003
Figure 4. Weight gain in Scarlet Macaw chicks. Curves correspond to the average weight per day for chicks that starved, grouped by hatching order. The black solid line corresponds to the average weight of all chicks that fledge, lumped across all hatching orders. The light orange line corresponds to a second chick that starved at 36 days and was an outlier in all measurements. Weight is presented in grams and age in days. Lines for second, third and fourth chicks end on the day of maximum age of starvation for each group. Lines for fledged chicks and the single outlier are truncated at 20 days for graphing purposes. Data from 2000 to 2018.
Diversity 16 00657 g004
Table 1. General growth information by hatch order of Scarlet Macaw chicks that died of starvation. Hatch order refers to the order of hatch of each member of the brood (second to fourth). Weight is presented in grams. Age is given in days. Crop size refers to the size of the crop on a scale of 0 to 4 (0 = empty, 4 = full), quantified in the field by a trained and experienced observer. Max weight is the highest weight registered throughout the life of each chick. Weight at death and age at death refer to the last values collected before the chick was found dead. A single chick that starved at age 36 days was an outlier in all measurements and was removed from the data presented here (see text). Data were obtained over 18 consecutive breeding seasons from 2000 to 2018.
Growth InformationHatch Order
Second Chick (N = 8)Third Chick (N = 13)Fourth Chick (N = 4)
Mean ± St. Dev.RangeMean ± St. Dev.RangeMean ± St. Dev.Range
Weight at hatch21.7 ± 4.715.6–29.720.8 ± 2.618–2718.9 ± 1.417.2–20.5
Max weight47.9 ± 23.619.5–8128.3 ± 13.718–6818.9 ± 1.417.2–20.5
Age at max weight7 ± 60–182 ± 20–61 ± 10–1
Weight at death37.1 ± 19.117–6521.9 ± 9.115–4916.9 ± 2.913.6–20.5
Age at death10 ± 61–176 ± 42–143 ± 12–4
Average crop size0.81 ± 0.780–2.10.84 ± 0.780–2.00.69 ± 0.850–1.8
Table 2. Food abundance during the nestling phase for Scarlet Macaw chicks that starved and those that did not starve. Food abundance was calculated as the percentage of trees of species known to be consumed by Scarlet Macaws in our phenology plots that had flowers or fruits. Food indices are presented for three time periods: (1) 7 days before to 7 days after hatch, (2) 15 days after the hatch of the second chick, and (3) 36 days after the hatch of the second chick. p values were calculated using t-tests (see Section 2).
Hatch ± 7 Days15 Days Post-Hatch36 Days Post-Hatch
MeanSDNMeanSDNMeanSDN
Starved35.12.0535.41.1835.41.18
Not Starved35.01.9935.92.8936.32.98
p-value0.90 0.59 0.39
Disclaimer/Publisher’s Note: The statements, opinions and data contained in all publications are solely those of the individual author(s) and contributor(s) and not of MDPI and/or the editor(s). MDPI and/or the editor(s) disclaim responsibility for any injury to people or property resulting from any ideas, methods, instructions or products referred to in the content.