Article

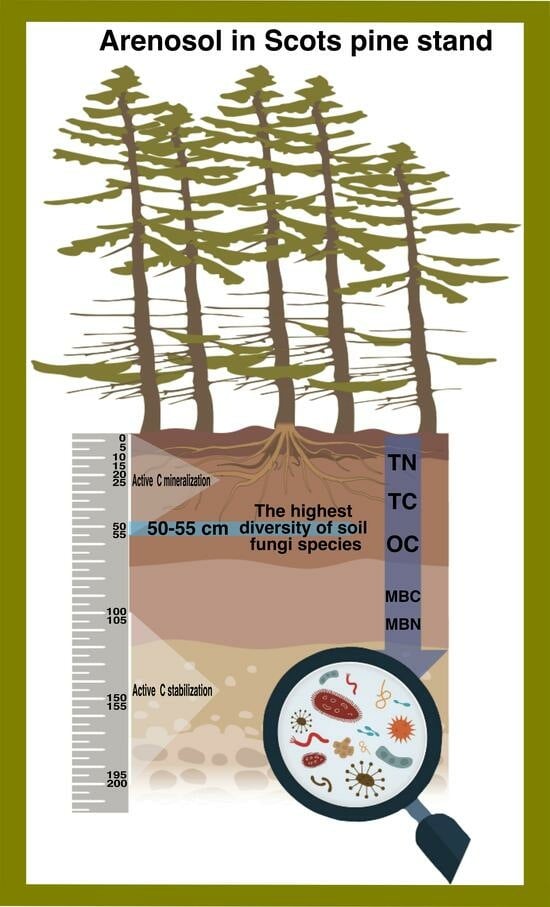
Soil Fungi and Soil Organic Carbon Stocks in the Profile of a Forest Arenosol

by
Jelena Ankuda
1,*,
Diana Sivojienė
1,
Kęstutis Armolaitis
1,
Audrius Jakutis
1,2,
Jūratė Aleinikovienė
1,2,
Donata Drapanauskaitė
1,
Vitas Marozas
3,
Valeriia Mishcherikova
1,
Vidas Stakėnas
1,
Vladimir Mikryukov
4,5 and
Leho Tedersoo
4,5
1
Institute of Forestry, Lithuanian Research Centre for Agriculture and Forestry, Liepų 1, Kaunas District, LT-53101 Girionys, Lithuania
2
Faculty of Agronomy, Agriculture Academy, Vytautas Magnus University, Studentų 11, Kaunas District, LT-53361 Akademija, Lithuania
3
Faculty of Forest Sciences and Ecology, Agriculture Academy, Vytautas Magnus University, Studentų 11, Kaunas District, LT-53361 Akademija, Lithuania
4
Institute of Ecology and Earth Sciences, University of Tartu, Liivi 2, 50409 Tartu, Estonia
5
Mycology and Microbiology Center, University of Tartu, Liivi 2, 50409 Tartu, Estonia
*
Author to whom correspondence should be addressed.
Diversity 2024, 16(1), 66; https://doi.org/10.3390/d16010066
Submission received: 10 November 2023 / Revised: 12 January 2024 / Accepted: 14 January 2024 / Published: 18 January 2024
(This article belongs to the Special Issue Fungi, Ecology, and Global Change)

Abstract

:
To help solve the actual problem of global climate warming, it is important to comprehensively study soil organic carbon (SOC), soil fungi, and other parameters at different depths in the soil. This study was aimed at investigating the chemical and microbiological parameters and their interactions at various soil depths (0–5 to 195–200 cm) in an Arenosol in a Scots pine stand in southwestern Lithuania, with a focus on the main groups of fungi and their influence on SOC. The highest diversity of soil fungi species was found at a depth of 50–55 cm. Saprotrophs were dominant at all investigated soil depths. Ectomycorrhizal fungi were mostly abundant at depths of up to 50–55 cm. The C:N ratio gradually decreased down to 50–55 cm, then increased in deeper soil layers (from 50–55 to 195–200 cm). This means that the most active mineralization processes occur at depths of between 0 and 55 cm. Carbon stabilization processes occur at depths of 100–105 to 195–200 cm, and most of this carbon does not enter the atmosphere nor contribute to the process of climate change.

Graphical Abstract

1. Introduction

The problem of global warming is currently one of great relevance around the world. To better understand, and potentially mitigate, future climate change, studies assessing soil organic carbon (SOC), soil fungi, and other parameters of soil are very important. Forest soils have a high potential for significant carbon sequestration [1,2,3,4]. Organic matter from aboveground and belowground vegetation is the main source of organic matter significantly affecting SOC stocks in mineral soil layers [5,6,7,8]. The mineral composition of soil principally governs the long-term soil carbon stocks [9,10,11]. Thus, it is in the mineral soil layers (mainly up to 20 cm in depth) that the SOC content could be significantly stabilized or lost through decomposition, depending on the chemical composition of the SOC [12,13,14]. In mineral soils, due to their high specific surface area, only the clay minerals are linked to organic carbon substances [15]. However, mineral associations with soil organic matter depend on the molecular weight of the organic substance, with chemically resistant soil organic matter increasing as the molecular weight decreases [16].
Soil due to different abiotic and biotic factors is one of the most biologically diverse ecosystems, hosting microscopic bacteria, fungi, and other organisms [17,18]. The soil organic matter decomposed by soil microorganisms (including fungi) contributes directly to the soil organic matter and, through the soil microbial biomass, can increase the SOC stock [19,20,21]. While there have been a lot of studies on the soil microbes in the topsoil (0–20 cm) [22,23,24], it is also important to obtain knowledge on the soil microbes in the deeper soil layers, and on the abundance and diversity of the microbes through the entire soil profile. Bacterial and fungal communities vary significantly across soil layers [25], with the saprotrophs that prevail in the deeper soil layers expanding the ability of nutrient transformation and uptake [26,27]. Saprotrophs stabilize mineral soil aggregates, but if supplied with additional carbon substrates, they can sustain specific saprotrophic network complexes and diverse communities for longer [28]. Saprotrophs decompose plants and litter, and are particularly important regulators of soil carbon fluxes between the biosphere and atmosphere. During the decomposition of complex organic compounds, the carbon/nitrogen (C:N) ratio gradually decreases and inorganic substances are released into the surrounding environment [27]. A decrease in the C:N ratio encourages the microcycling of organic carbon and nitrogen compounds in the soil, as well as the maintenance of physical, chemical, and biological soil drivers for the expansion of soil functionality [29].
Arenosol soils are characterized by a partially developed topsoil layer with a low humus content and no subsurface clay accumulation, the rapid mineralization of organic matter, a lack of organic colloids, poor water management, poor nutrient supply, and drought sensitivity [30]. However, it is also known that tree roots can extend deep into such soils in forests, including Scots pine (Pinus sylvestris L.) stands. Therefore, we decided to investigate a forest Arenosol soil profile. We expected that, in such soil, it would be possible to detect a large number and diversity of soil fungi not only in the upper soil layer (0–5 cm, forest floor), but also in the deeper layers (5–200 cm). Thus, the study was aimed at investigating the fungal diversity and soil chemical parameters at various soil depths in an Arenosol in a Scots pine stand, with a focus on the main groups of soil fungi and on the organic carbon.

2. Materials and Methods

2.1. Study Site and Sampling

2.1.1. Study Site

The territory of Lithuania belongs to the cool temperate moist Intergovernmental Panel on Climate Change (IPCC) climate zone [31] and to the transitional hemiboreal forest zone of Europe [32]. The hemiboreal zone represents the zone of transition from boreal to temperate [33,34,35]. This zone is characterized by the coexistence of coniferous trees, such as Scots pine and Norway spruce, and various broad-leaved species, such as birch, aspen, oak, hazel, maple, ash, beech, and hornbeam. According to the Lithuanian Hydrometeorological Service under the Ministry of the Environment, the average annual air temperature for 1990–2020 was 7.4 °C and the average annual amount of precipitation was 695 mm [36].
Soil samples were collected in October 2020 in southwestern Lithuania in the Scots pine (Pinus sylvestris L.) stand of the ICP Forests (European forest monitoring programme) Level II Lithuanian No. 3 plot (54.7766 °N, 23.5805 °E). The 60-year-old stand comprised 90% Scots pine and 1% silver birch (Betula pendula Roth). The tree density in the stand was 624 ha−1, the stand mean diameter at breast height (DBH) was 24.0 cm, the mean height 25.3 m, the average stocking level 1.1, and the stemwood production 444.7 m3 ha−1.
The soil in the investigated stand was a sandy textured Hapli-Albic Arenosol [37]. The sand fraction between 0 and 200 cm was 95.2–98.8% of the soil mass (Table 1). The percentage of silt and clay was low (1.2–4.8%).
The soil profiles were excavated under a Scots pine canopy where the groundcover was 6.7% Picea abies (L.) Karst., 16.7% Vaccinium vitis-idaea L., 2.3% Vaccinium myrtillus L., 46.7% Hylocomium splendens (Hedw.) Schimp., 16.7% Pleurozium schreberi (Brid.) Mitt., 2.0% Ptilium crista-castrensis (Hedw.) De Not., 1.7% Calluna vulgaris (L.) Hull., and 1.7% Dicranum polysetum Sw.

2.1.2. Sampling

The sampling depth intervals were 0–5, 10–15, 20–25, 50–55, 100–105, 150–155, and 195–200 cm. Three samples per depth were collected 30 m apart from each other in a triangular orientation. First, the loose organic litter (fallen leaves, etc.) was removed from the location being sampled. Samples of the top layer (0–5 cm) of the soil were taken from both the forest floor (soil organic layer) and the mineral layer and were mixed. The thickness of the forest floor was 2–5 cm. Samples were only taken from the mineral layer of the top layer (0–5 cm) for microbial biomass carbon (MBC) and microbial biomass nitrogen (MBN) estimation. Samples for MBC and MBN from the other depths (10–15 to 195–200 cm) were taken similarly to the samples taken for the other analyses. A hard 5 cm inner-diameter PVC pipe was hammered into the ground to sample the soil from 0 to 5 cm. A pit 200 cm deep was dug for sampling depths of 10–15 to 195–200 cm. Soil samples were then taken at each studied depth by driving the PVC pipe into the wall of the pit. The samples were air-dried (except for a portion of the samples for MBC and MBN estimation) at <40 °C. Coarse roots (>2 mm diameter) and stones were removed from the samples.
The samples were split, the portion for chemical parameter analysis being crushed, homogenized, and sieved through a 2 mm mesh. The portion for metagenomic analysis was crushed and homogenized according to the scheme used by Tedersoo et al. [40], in which the samples were placed into plastic (ZipLock) bags and vigorously rubbed to homogenize them. The finest resulting material was passed through a hole cut into the bottom of the ZipLock bag into a new bag and this was used for the metagenomic analysis. To avoid contaminating the samples, disposable gloves were worn when handling them. The sampling tools and other equipment were carefully cleaned and disinfected with 96% ethyl alcohol before use.

2.2. Soil Chemical Parameters

The soil pH in calcium chloride (CaCl2) was determined according to ISO 10390:2005 [41], measured using a 1:5 (vol/vol) soil suspension in 0.01 M CaCl2. The mixture was shaken for 1 h and then left to sit for 1 h. The pH of the suspension was measured at 20 ± 2 °C while stirring with a pH meter.
The soil total carbon (STC) content was determined according to ISO 10694:1995 [42] by dry combustion, the sample heated to 900 °C in a stream of air and the carbon dioxide (CO2) formed measured using infrared spectroscopy. The samples were analyzed using a Liqui TOC II analyzer (Elementar Analysen Systeme GmbH, Hanau/Germany).
The soil organic carbon (SOC) content was determined according to ISO 10694:1995 [42] by dry combustion, the sample heated to 900 °C in a stream of air and the CO2 formed measured using infrared spectroscopy. According to this method, the carbonates were removed first, a few drops of hydrochloric acid (HCl) being added to the sample, which was then left for 4 h. The HCl residue was then removed via evaporation. The samples were analyzed using a Liqui TOC II analyzer.
The soil inorganic (mineral) carbon (SIC) content was calculated as the difference between the STC and the SOC.
The soil total nitrogen (STN) was determined according to ISO 11261:1995 [43] using the modified Kjeldahl method, involving boiling with sulfuric acid (H2SO4) and potassium sulfate (K2SO4) in the presence of a copper sulfate (CuSO4) catalyst.
The C:N ratio was calculated as the SOC content divided by the STN.

2.3. Soil Microbial Biomass Carbon and Nitrogen Estimation

Altogether, 21 composite soil samples (from 0–5, 10–15, 20–25, 50–55, 100–105, 150–155, and 195–200 cm depth) were prepared for MBC and MBN estimation by the chloroform fumigation incubation method. Fresh soil samples were first sieved through a 2 mm mesh after removing the fine roots and coarse organic matter. The sieved soil samples (6 g) were placed into vessels (glass bottles for the fumigated soils and plastic bottles for the unfumigated soils) and 1.5 mL of nitrogen (500 µg nitrogen per 1.5 mL solution in the form of ammonium nitrate—NH4NO3) was added. Controls with no added nitrogen were prepared by the same method, pure water being added instead. Solutions without soils were also prepared for both fumigated and unfumigated samples. The fumigated samples were placed in a vacuum desiccator and exposed to chloroform vapor for 24 h [44]. The MBC and MBN were calculated using the following formulae [45]:
MBC = EC × 2.64
where EC = the difference between the carbon fumigated and unfumigated soil samples, and
MBN = FN/0.54
where FN = the difference between the nitrogen fumigated and unfumigated soil samples.

2.4. DNA Extraction, Amplification, and Sequencing

The DNA was extracted from 0.25 g of homogenized soil using a MagAttract PowerSoil DNA Kit (Qiagen, Carlsbad, CA, USA) following the manufacturer’s instructions. Amplification was performed using the forward primer ITS9mun and a reverse primer ITS4ngsUni [46]. Both a negative and a positive control were included for detecting contamination. For amplification in a Mastercycler thermal cycler (Eppendorf, Oldenburg, Germany), the PCR mixture comprised 5 μL of 5 × HOT FIREPol Blend Master Mix (Solis Biodyne, Tartu, Estonia), 0.5 μL each of the forward and reverse primers (20 mM), 1 μL of DNA extract, and 18 μL double-distilled water (ddH2O). The thermal cycling included an initial denaturation at 95 °C for 15 min, 25–30 cycles of denaturation for 30 s at 95 °C, annealing for 30 s at 57 °C, elongation for 1 min at 72 °C, a final elongation at 72 °C for 10 min, and storage at 4 °C. Then, 1 µL of PCR products was run on 1% agarose gel to check the quantity. The PCR products were normalized for library preparation and sequenced on a PacBio Sequel instrument using SMRT cell 1 M, v2 LR, Sequel Polymerase v2.1, and Sequencing chemistry v2.1 (Pacific Biosciences Inc., Menlo Park, CA, USA). Loading was performed by diffusion, with one SMRT cell used for sequencing, with a movie time of 600 min and a pre-extension time of 45 min.

2.5. Bioinformatics

The raw reads were processed using the Pipecraft 2 analysis platform [47]. The sequence reads were demultiplexed and the primer sequences were removed using cutadapt v.3.5 [48]. The read quality was evaluated and the chimeras were removed using vsearch v.2.18.0 [49]. The sequences were clustered into operational taxonomic units (OTUs) at 97% sequence similarity. Representative sequences were classified via the UNITE platform [50] using the assigned taxonomy function with BLAST+ v.2.10.1 [51]. The FungalTraits database was used to assign functional groups to the fungal species [52].

2.6. Statistical Analysis

The soil chemical parameters data were processed using one-way analysis of variance (ANOVA) with a post hoc Duncan multiple range test employed to evaluate differences between the soil depths. The SAS 9.4 statistical software package was used for the analysis [53].
Statistical analyses of the MBC and MBN were performed using the General Linear model in Systat 12 (Systat Software, Inc. 2007, San Jose, CA, USA). Pairwise comparisons were made between soil depths using Fisher’s LSD test to assess the statistical significance of the differences between the means of the analytical measurements.
Observed richness and Shannon diversity index values were calculated using PC-ORD v.6.0 (2011) (MjM Software, Gleneden Beach, OR, USA) [54]. Residual richness values were also determined when the sequencing depth was taken into account. For this, we calculated the residuals when regressing the logarithm of the observed richness to the logarithm of the sequencing depth [55] using Statistica 10 software. Changes in the fungal community with soil depth were analyzed using a permutational multivariate ANOVA (PERMANOVA) and PC-ORD v.6.0 (MjM Software, Gleneden Beach, OR, USA) [54].
The significant differences between the values of relative abundance, observed richness, and Shannon index of various depths or various fungal classes and functional guilds were determined using the one-way analysis of variance (ANOVA) for Excel 2000, version 2.2 (Microsoft Corp., Redmond, Washington, WA, USA). The Fisher test was used for the comparison of data.
Correlations between the variables for different soil depths were analyzed by applying Pearson’s correlation test and XLSTAT 2022.2.1.1311 software [56]. The results were presented as the arithmetic mean ± standard deviation (SD) or ± standard error (SE). Graphical abstract was created using BioRender.com and Inkscape 1.2. software [57].

3. Results

3.1. Soil Chemical Parameters

The soil pH values showed a significant increase with soil depth to 100–105 cm, but from 150–155 to 195–200 cm, the pH slightly decreased (Table 2 and Table S3). The highest concentrations of SOC, STC, and STN and C:N ratio were observed at 0–5 cm, significantly decreasing with depth (Table 2 and Table S3). The STN decreased significantly with depth, from 12.5 ± 6.86 g kg−1 at 0–5 cm to 0.03 ± 0.014 g kg−1 at 195–200 cm (Table 2 and Table S3). The decrease in soil total N in the deepest layers (150–155 and 195–200 cm) was statistically significant compared to 10–15 and 20–25 cm (Table 2 and Table S3). Both the SOC and STC concentrations significantly decreased down to 50–55 cm. However, at 150–155 and 195–195 cm, the concentrations of SOC and STC slightly increased, although this was not statistically significant compared to 50–55 and 100–105 cm. The highest SIC concentration was observed at 0–5 cm. However, in the deeper soil layers, the SIC concentration did not change statistically significantly, ranging from 0.70 ± 0.48 g kg−1 at 10–15 cm to 0.58 ± 0.51 g kg−1 at 195–200 cm. The C:N ratio gradually decreased down to 50–55 cm (Table 2 and Table S3).

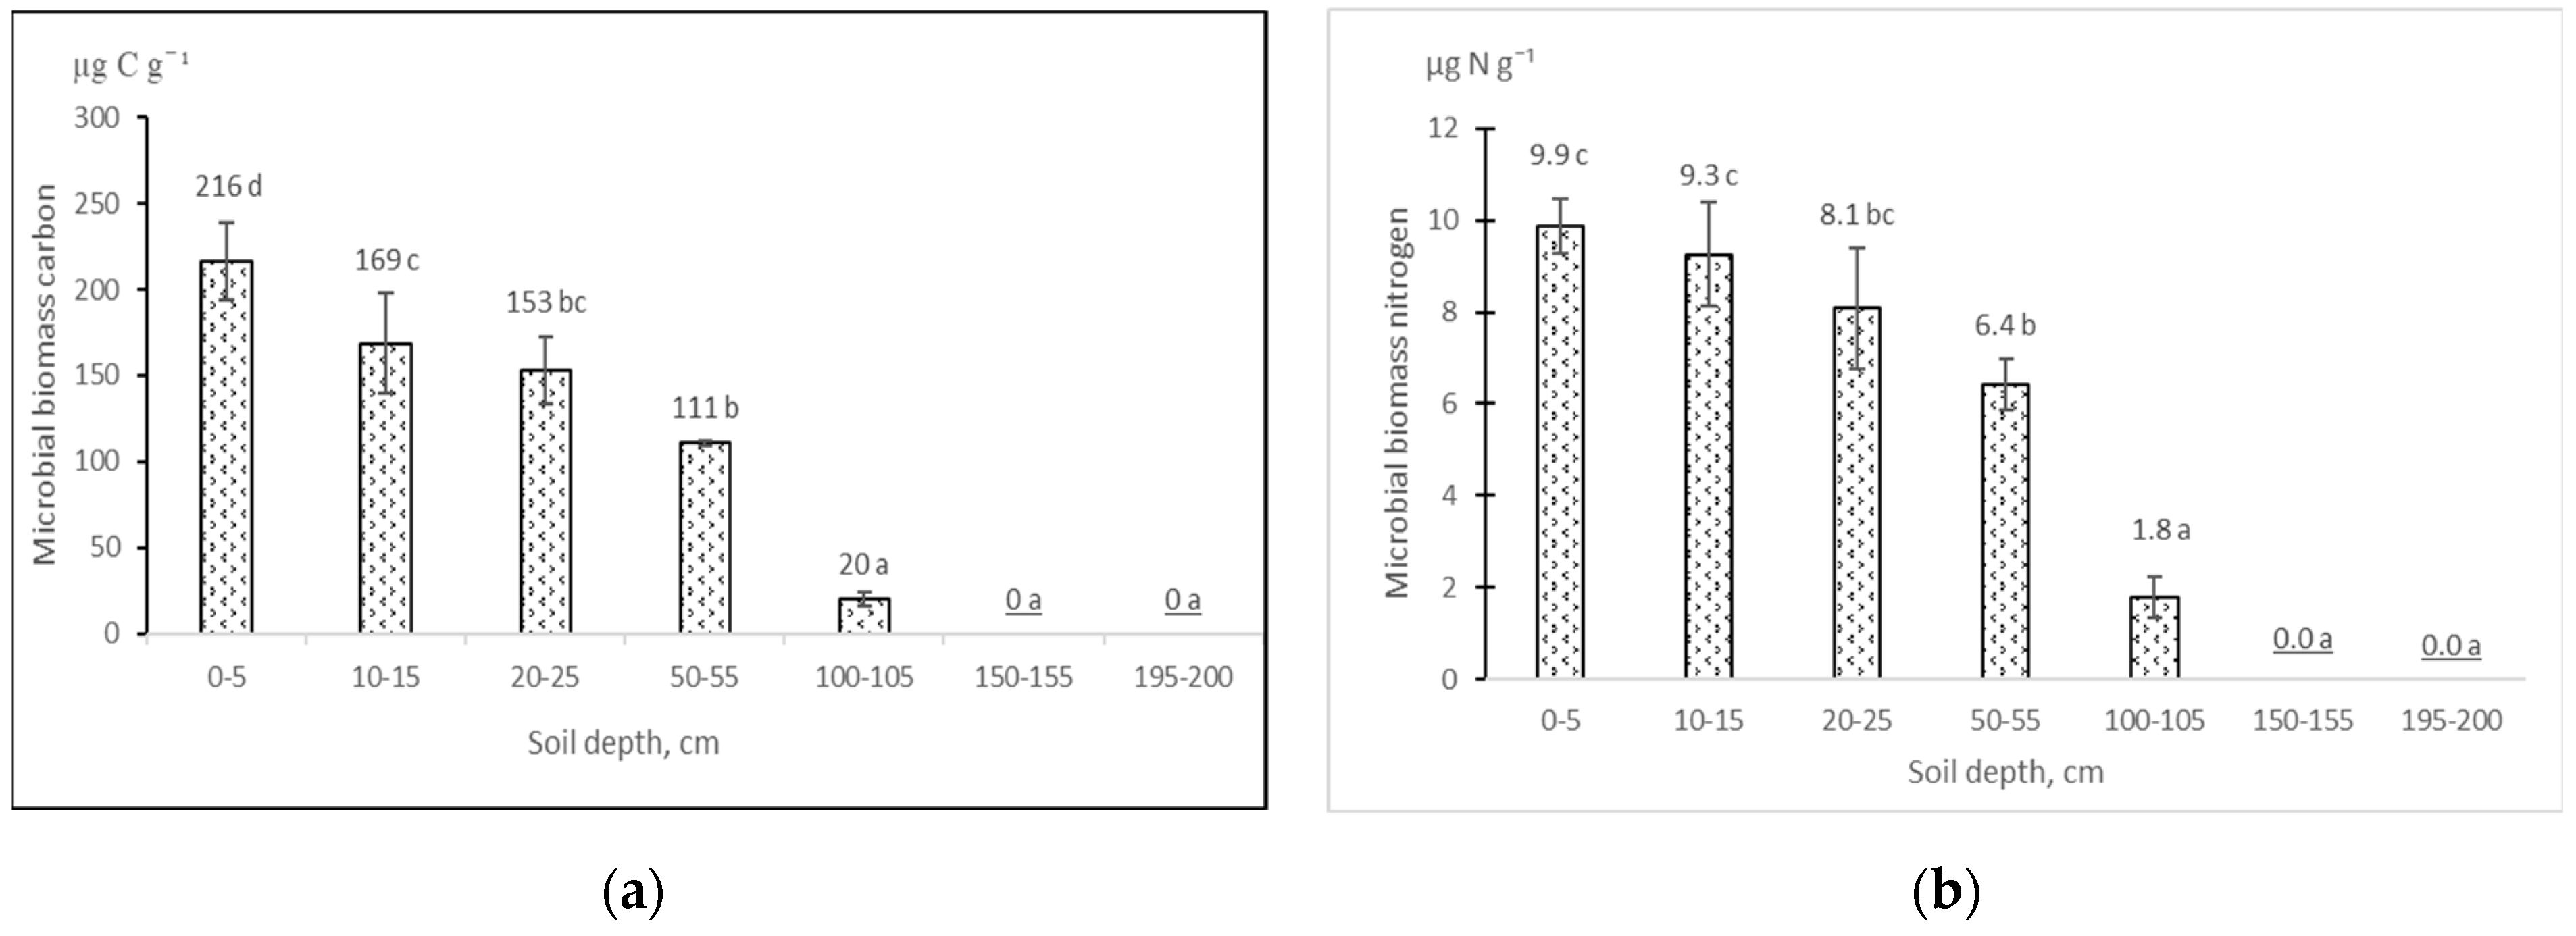
3.2. Soil Microbial Biomass Carbon and Nitrogen

As determined, the highest concentrations of soil MBC and MBN were determined from the mineral soil down to 50–55 cm (Figure 1). However, the most significant (Table S2) increase in the MBC and MBN was only found in the uppermost (up to 5 cm in depth) soil layer, where the MBC increased to 216 µg carbon g−1 and the MBN reached almost 10 µg nitrogen g−1. The MBC and MBN consistently decreased with soil depth, however, both significantly (Table S2) decreasing, by 6 (MBN) and 11 (MBC) times, at 100 cm. Below 150 cm, no MBC and MBN were detectable.

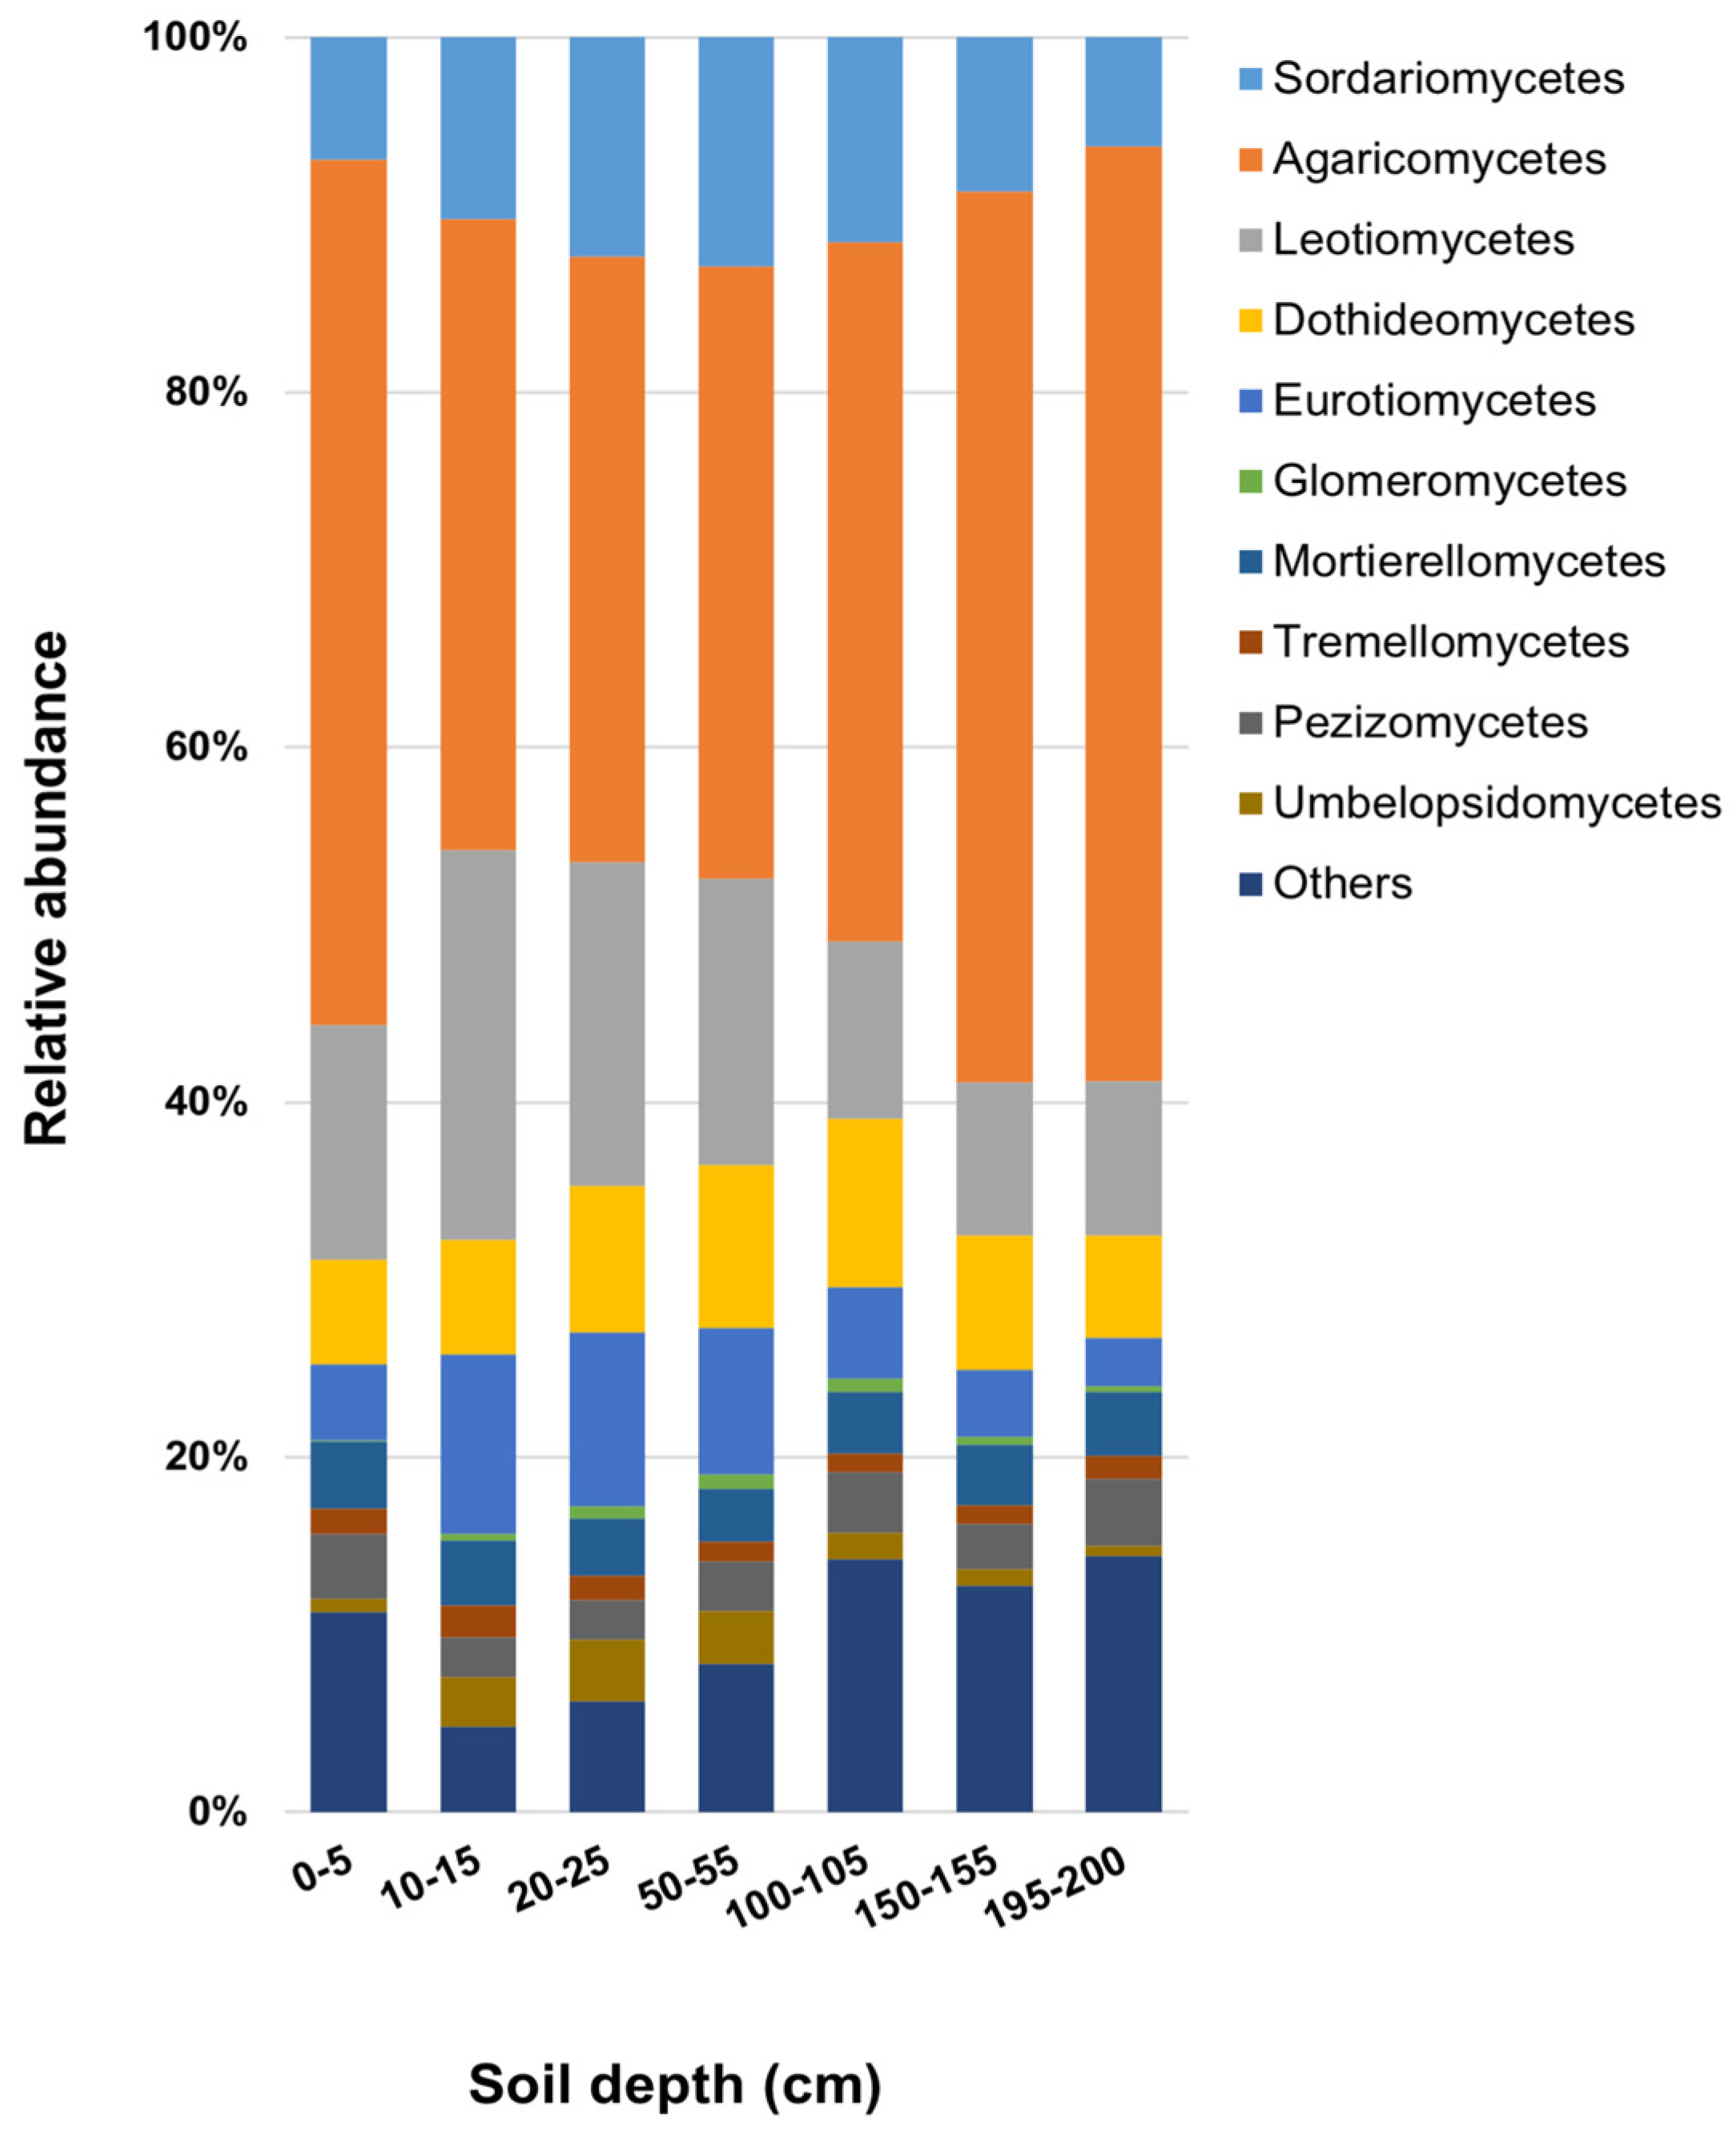
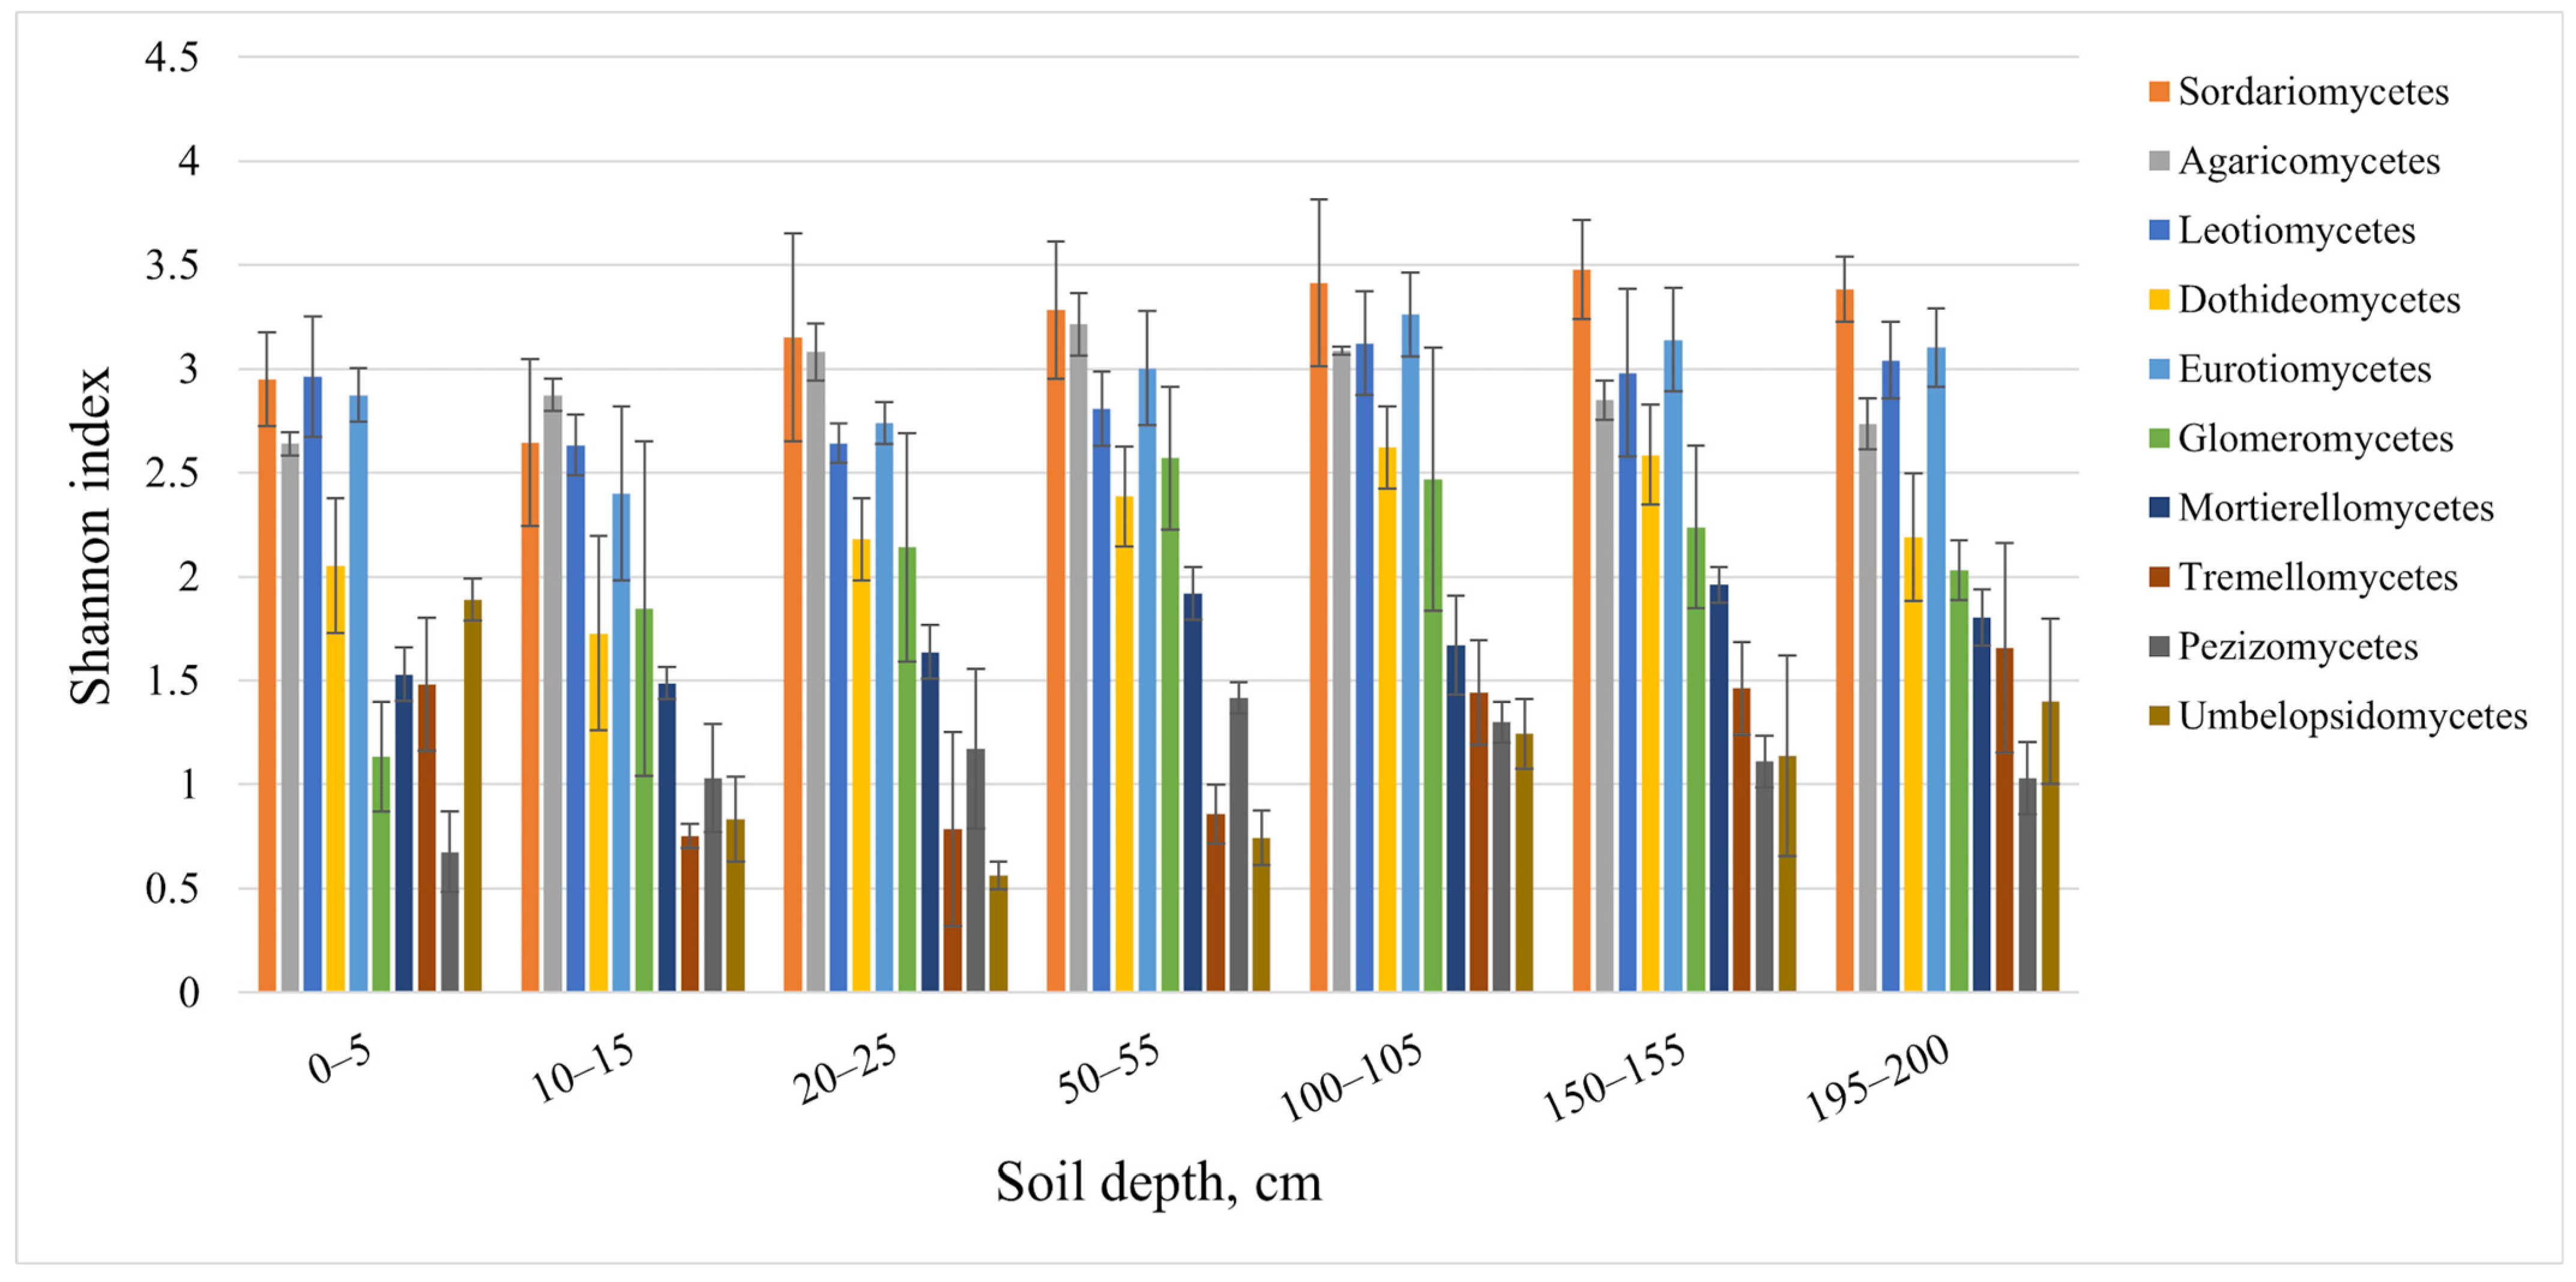
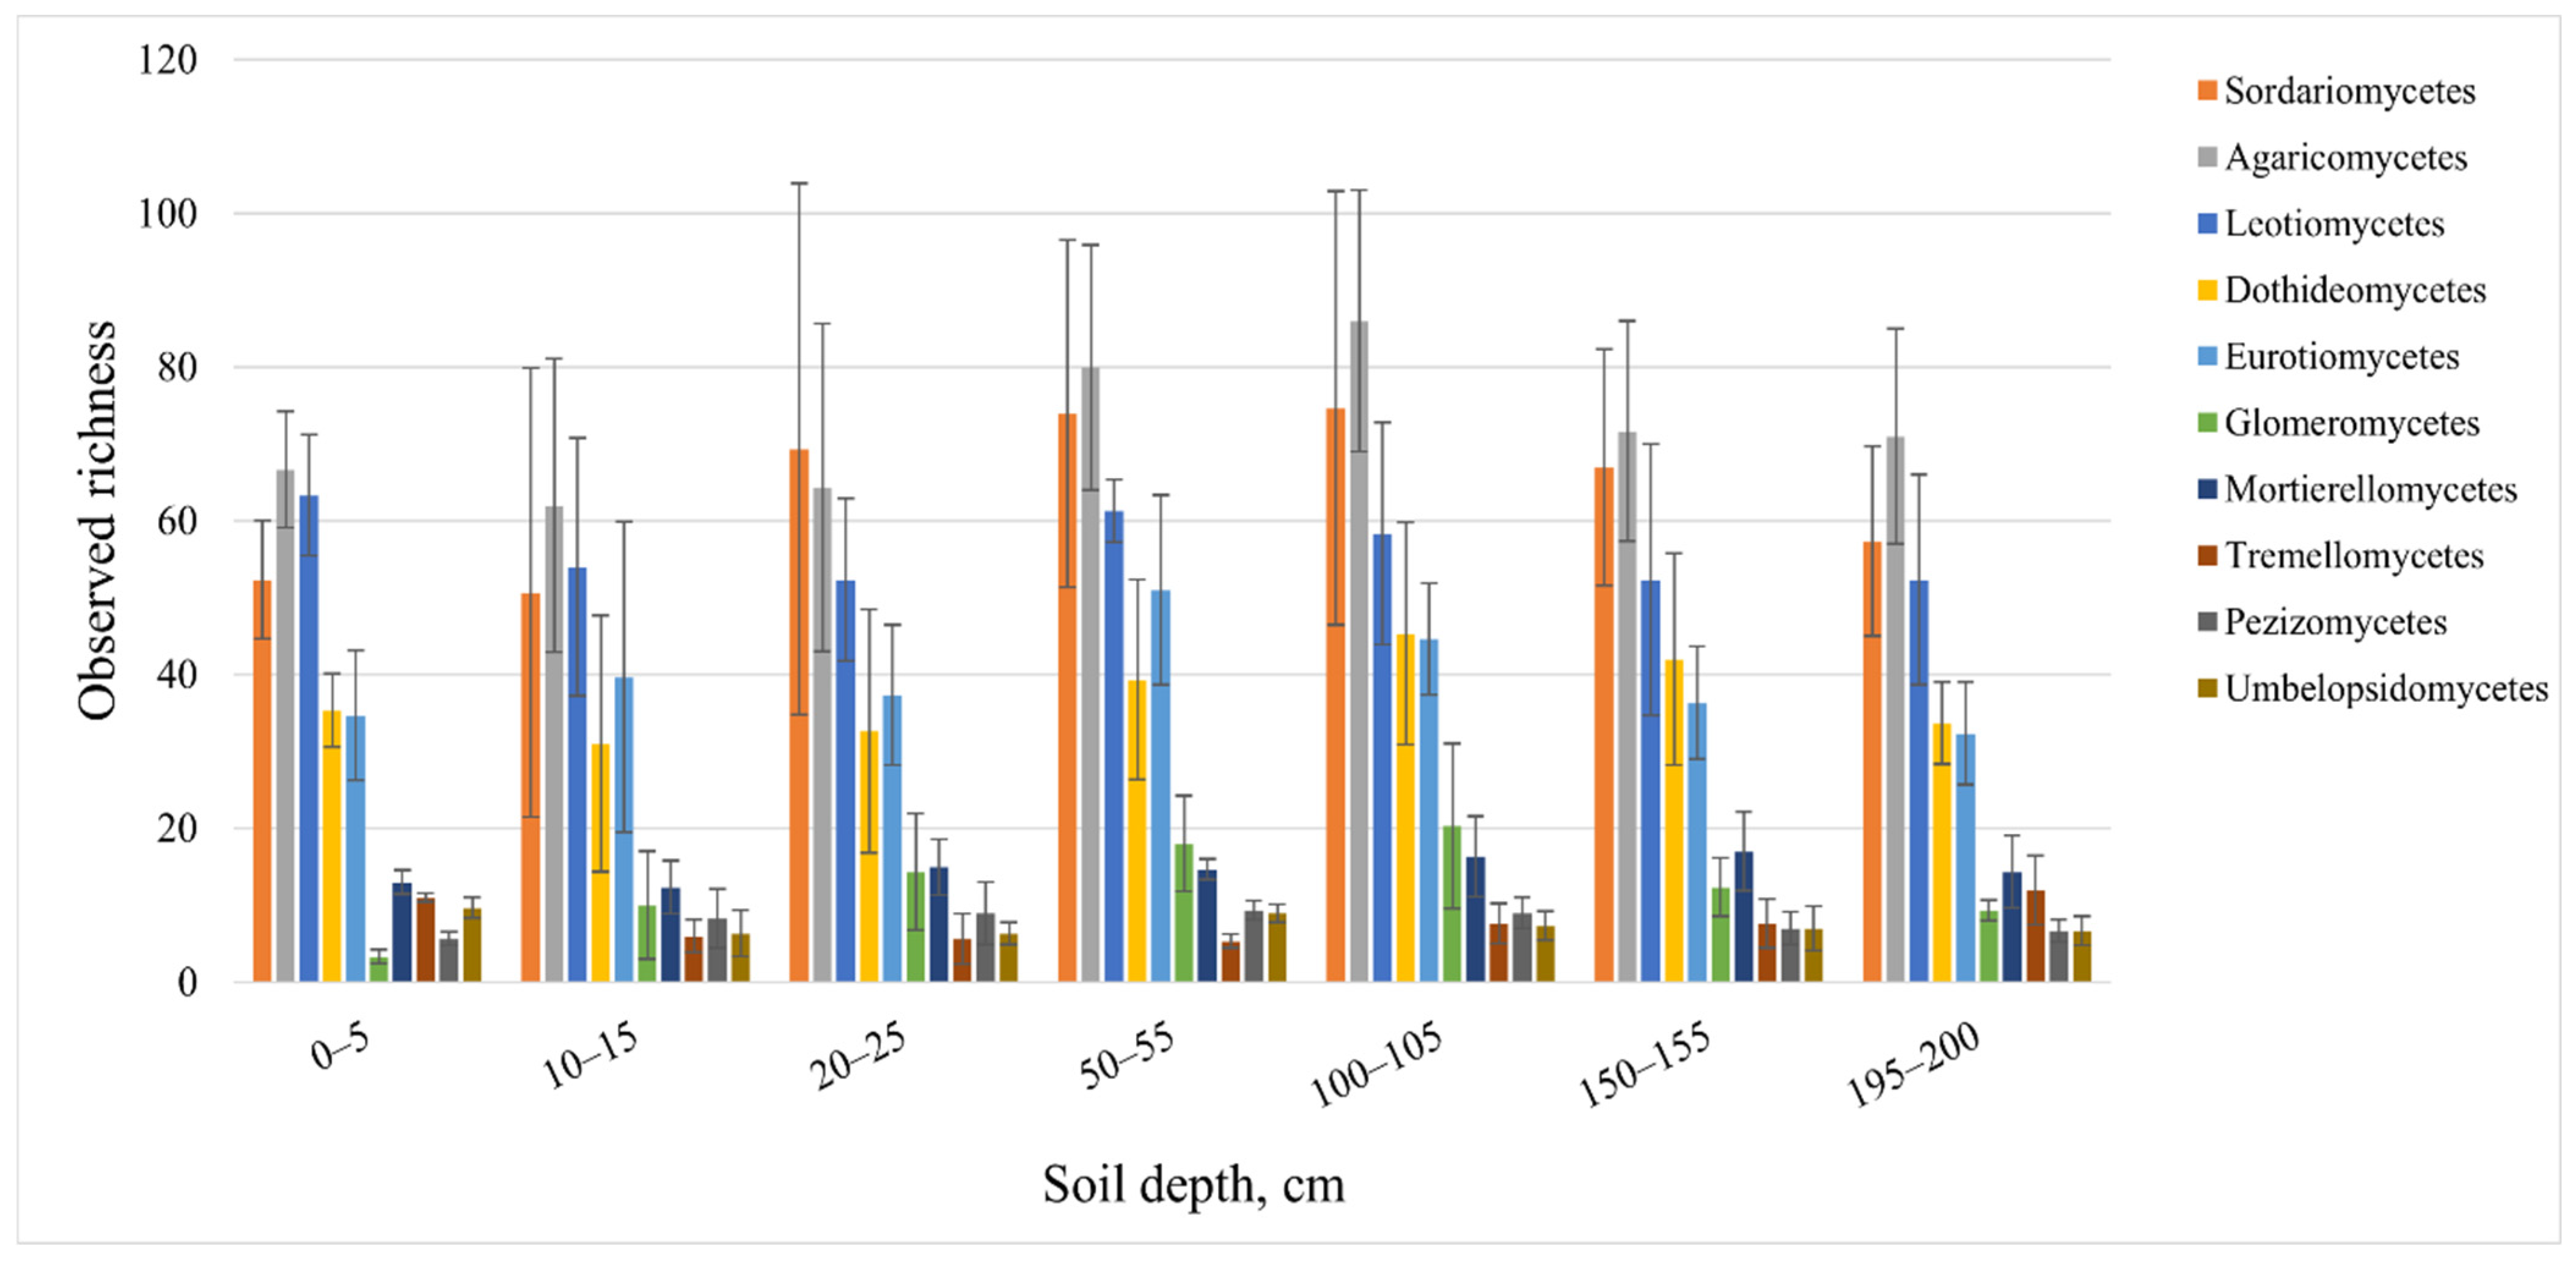
3.3. Abundance and Diversity of Soil Fungi
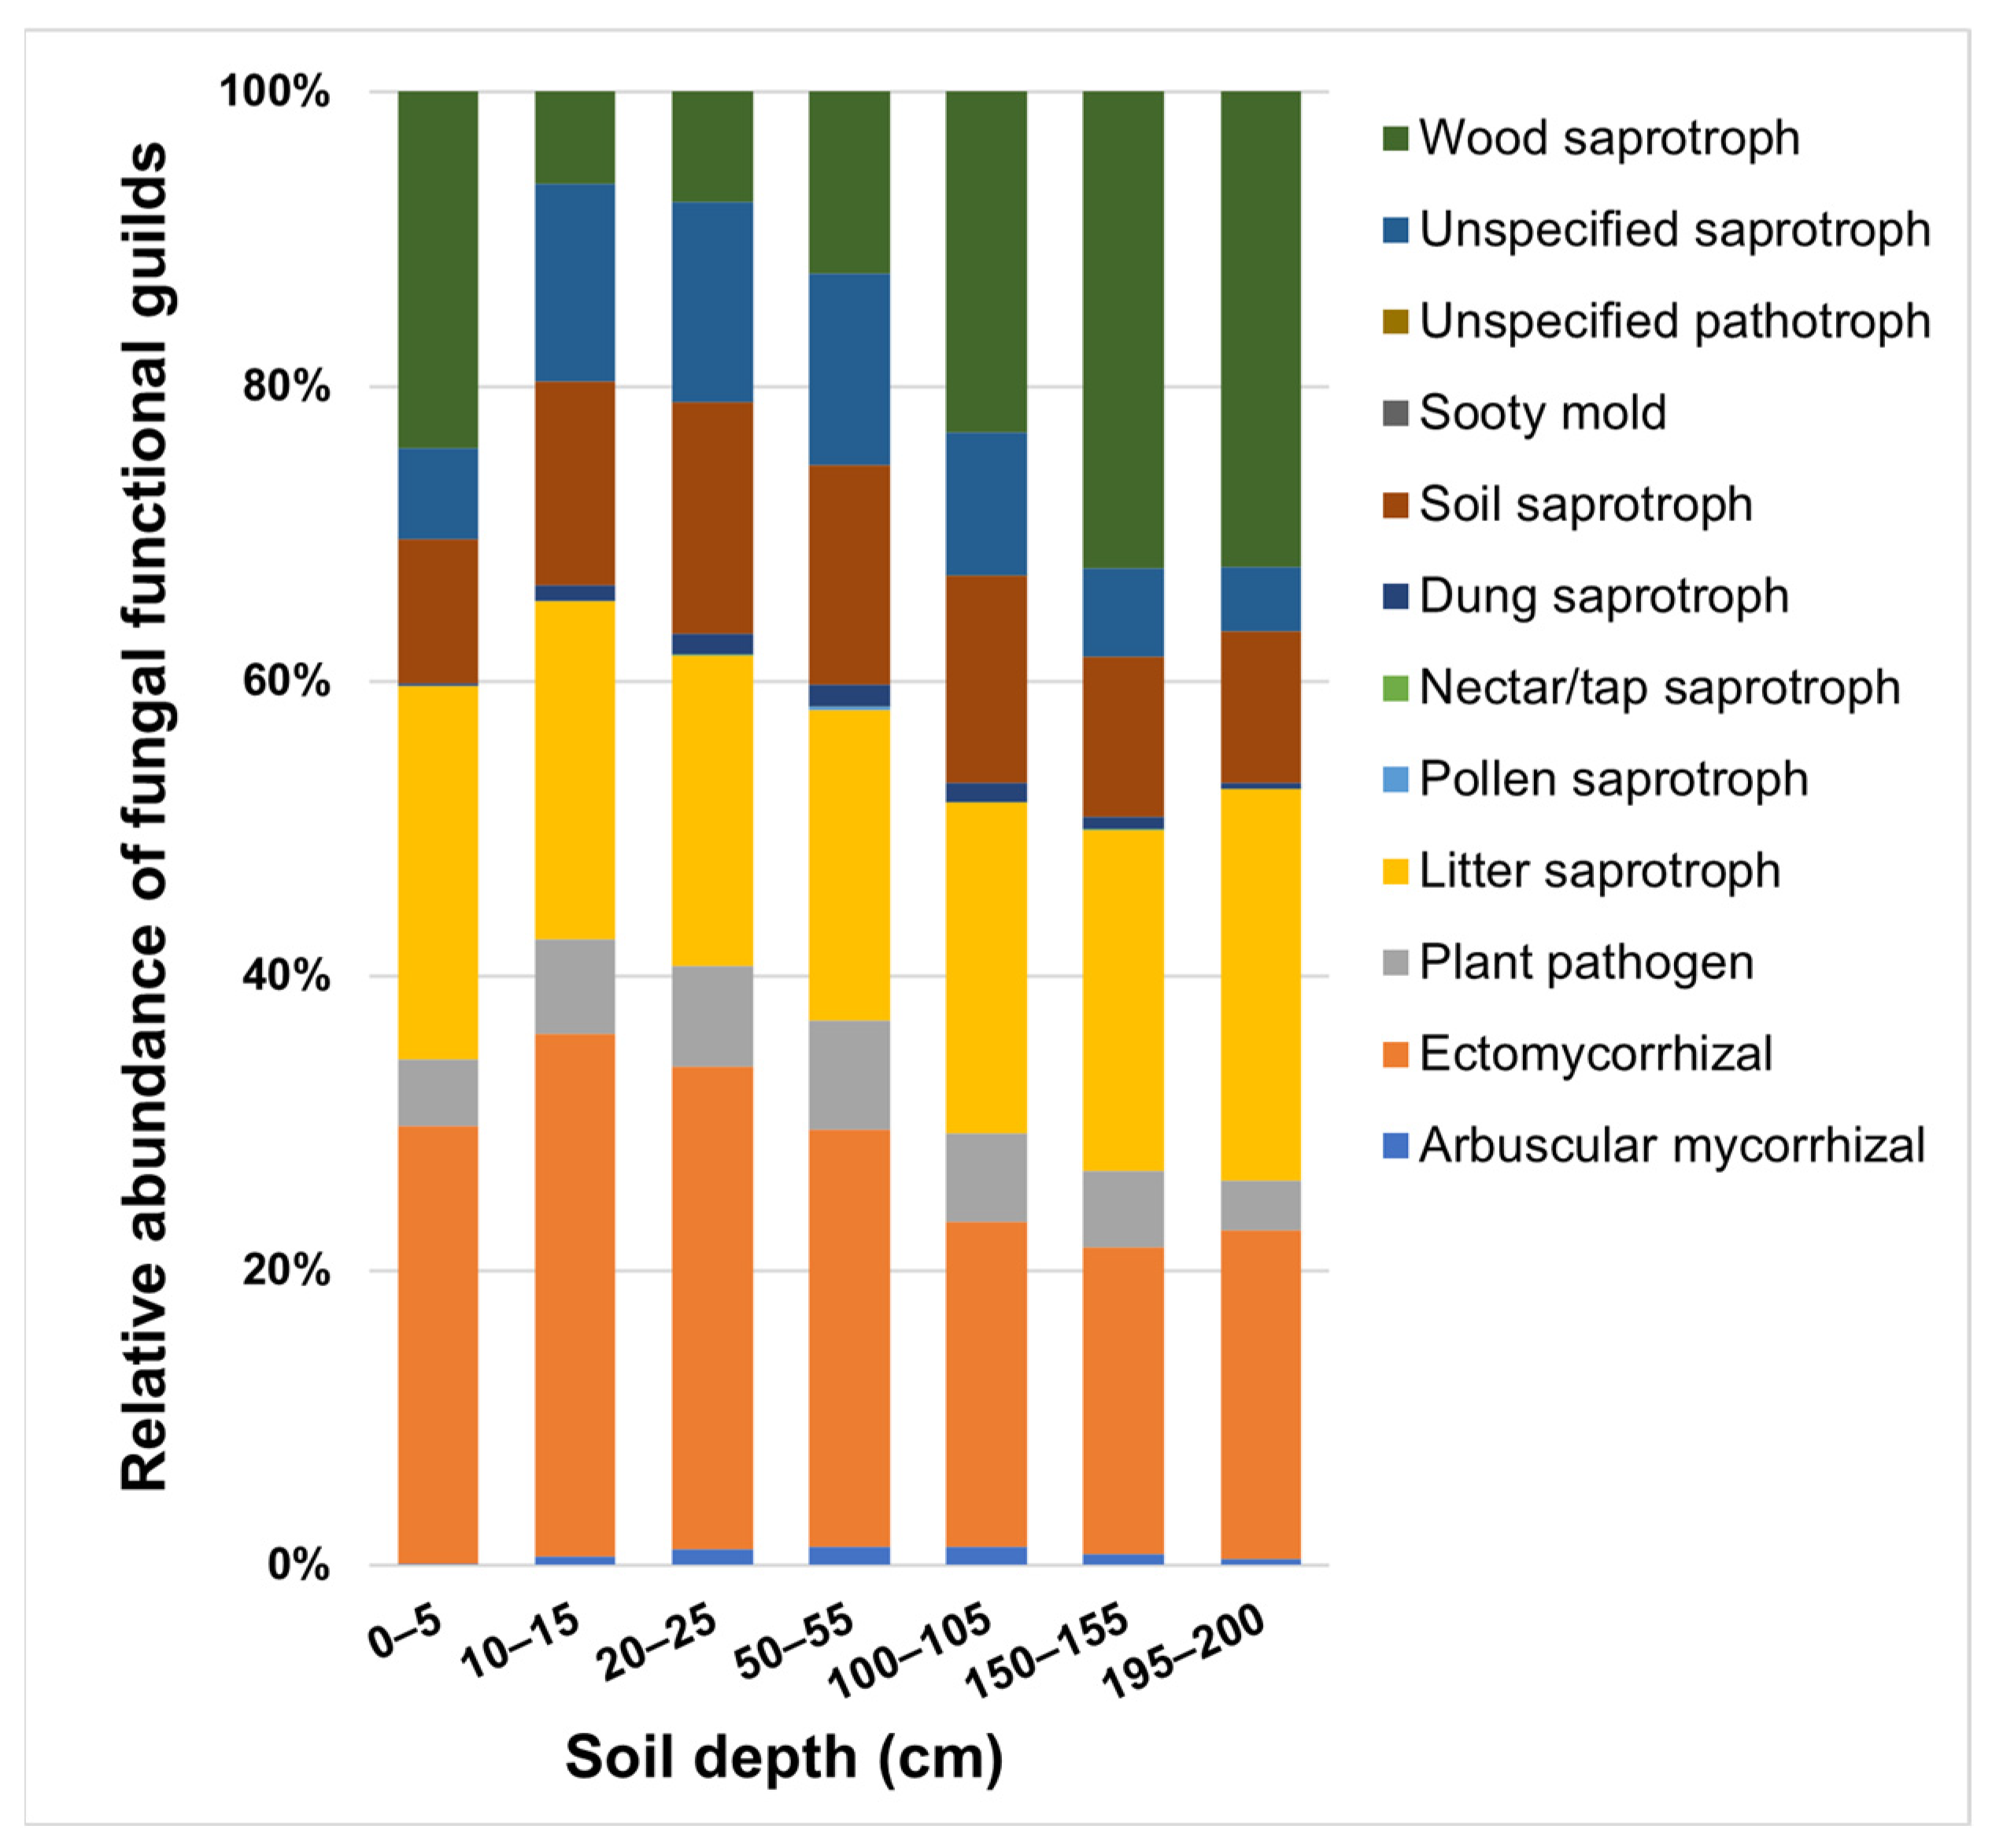
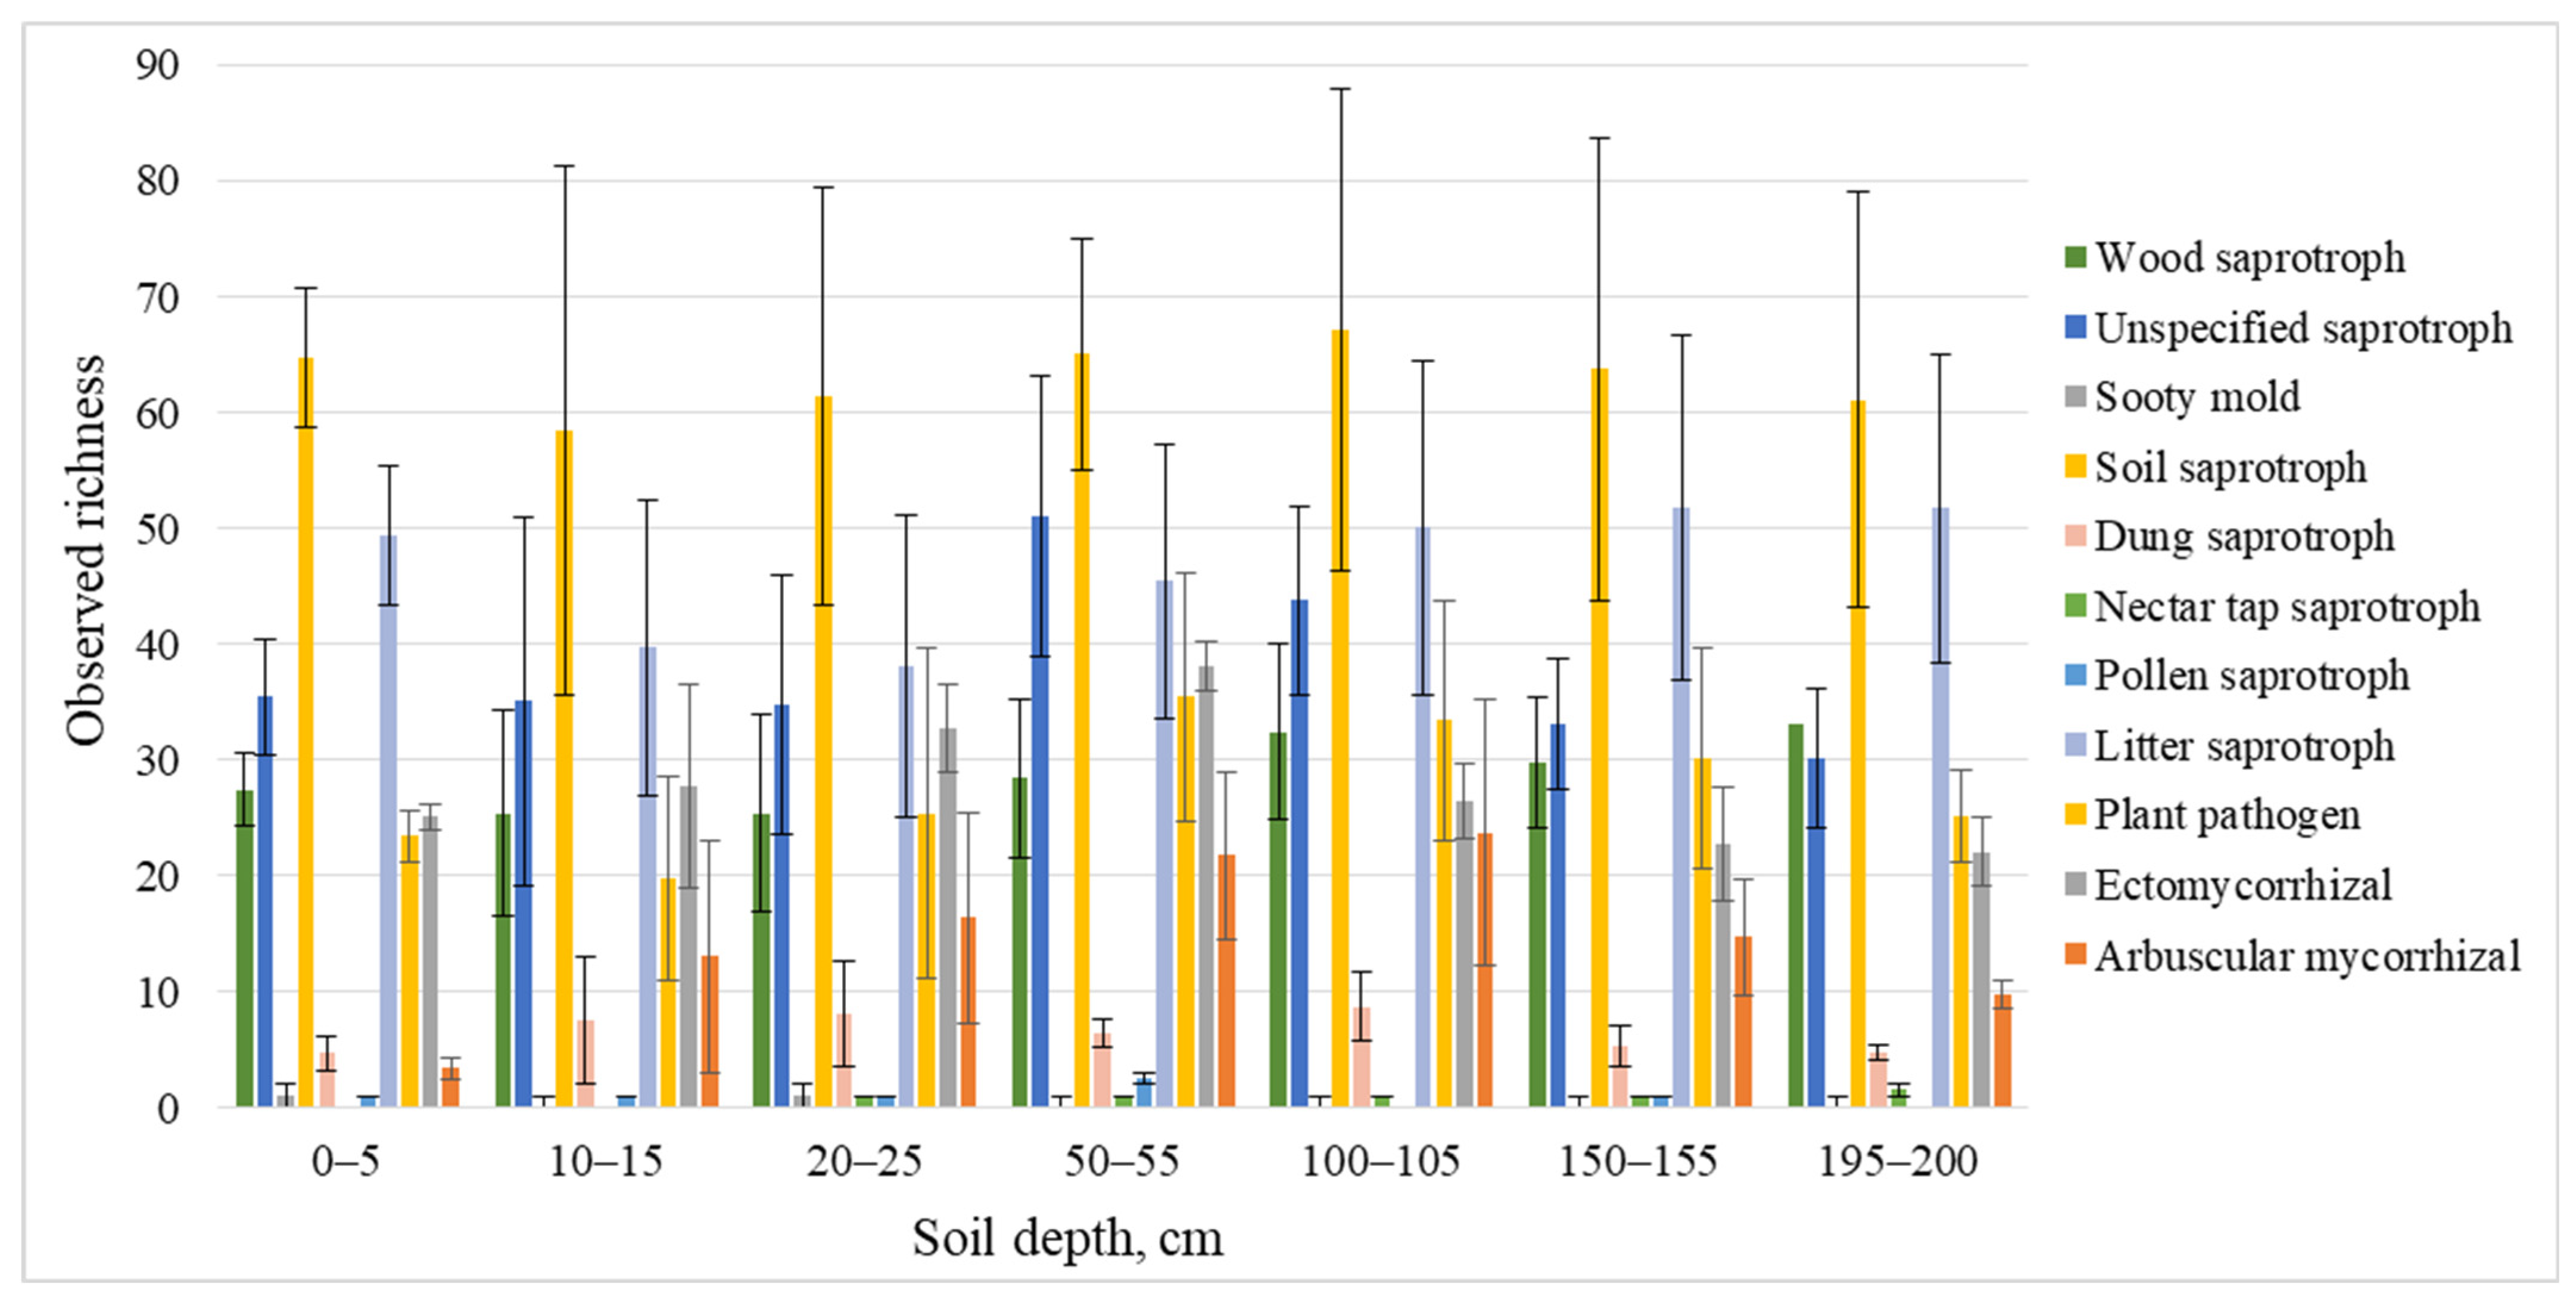
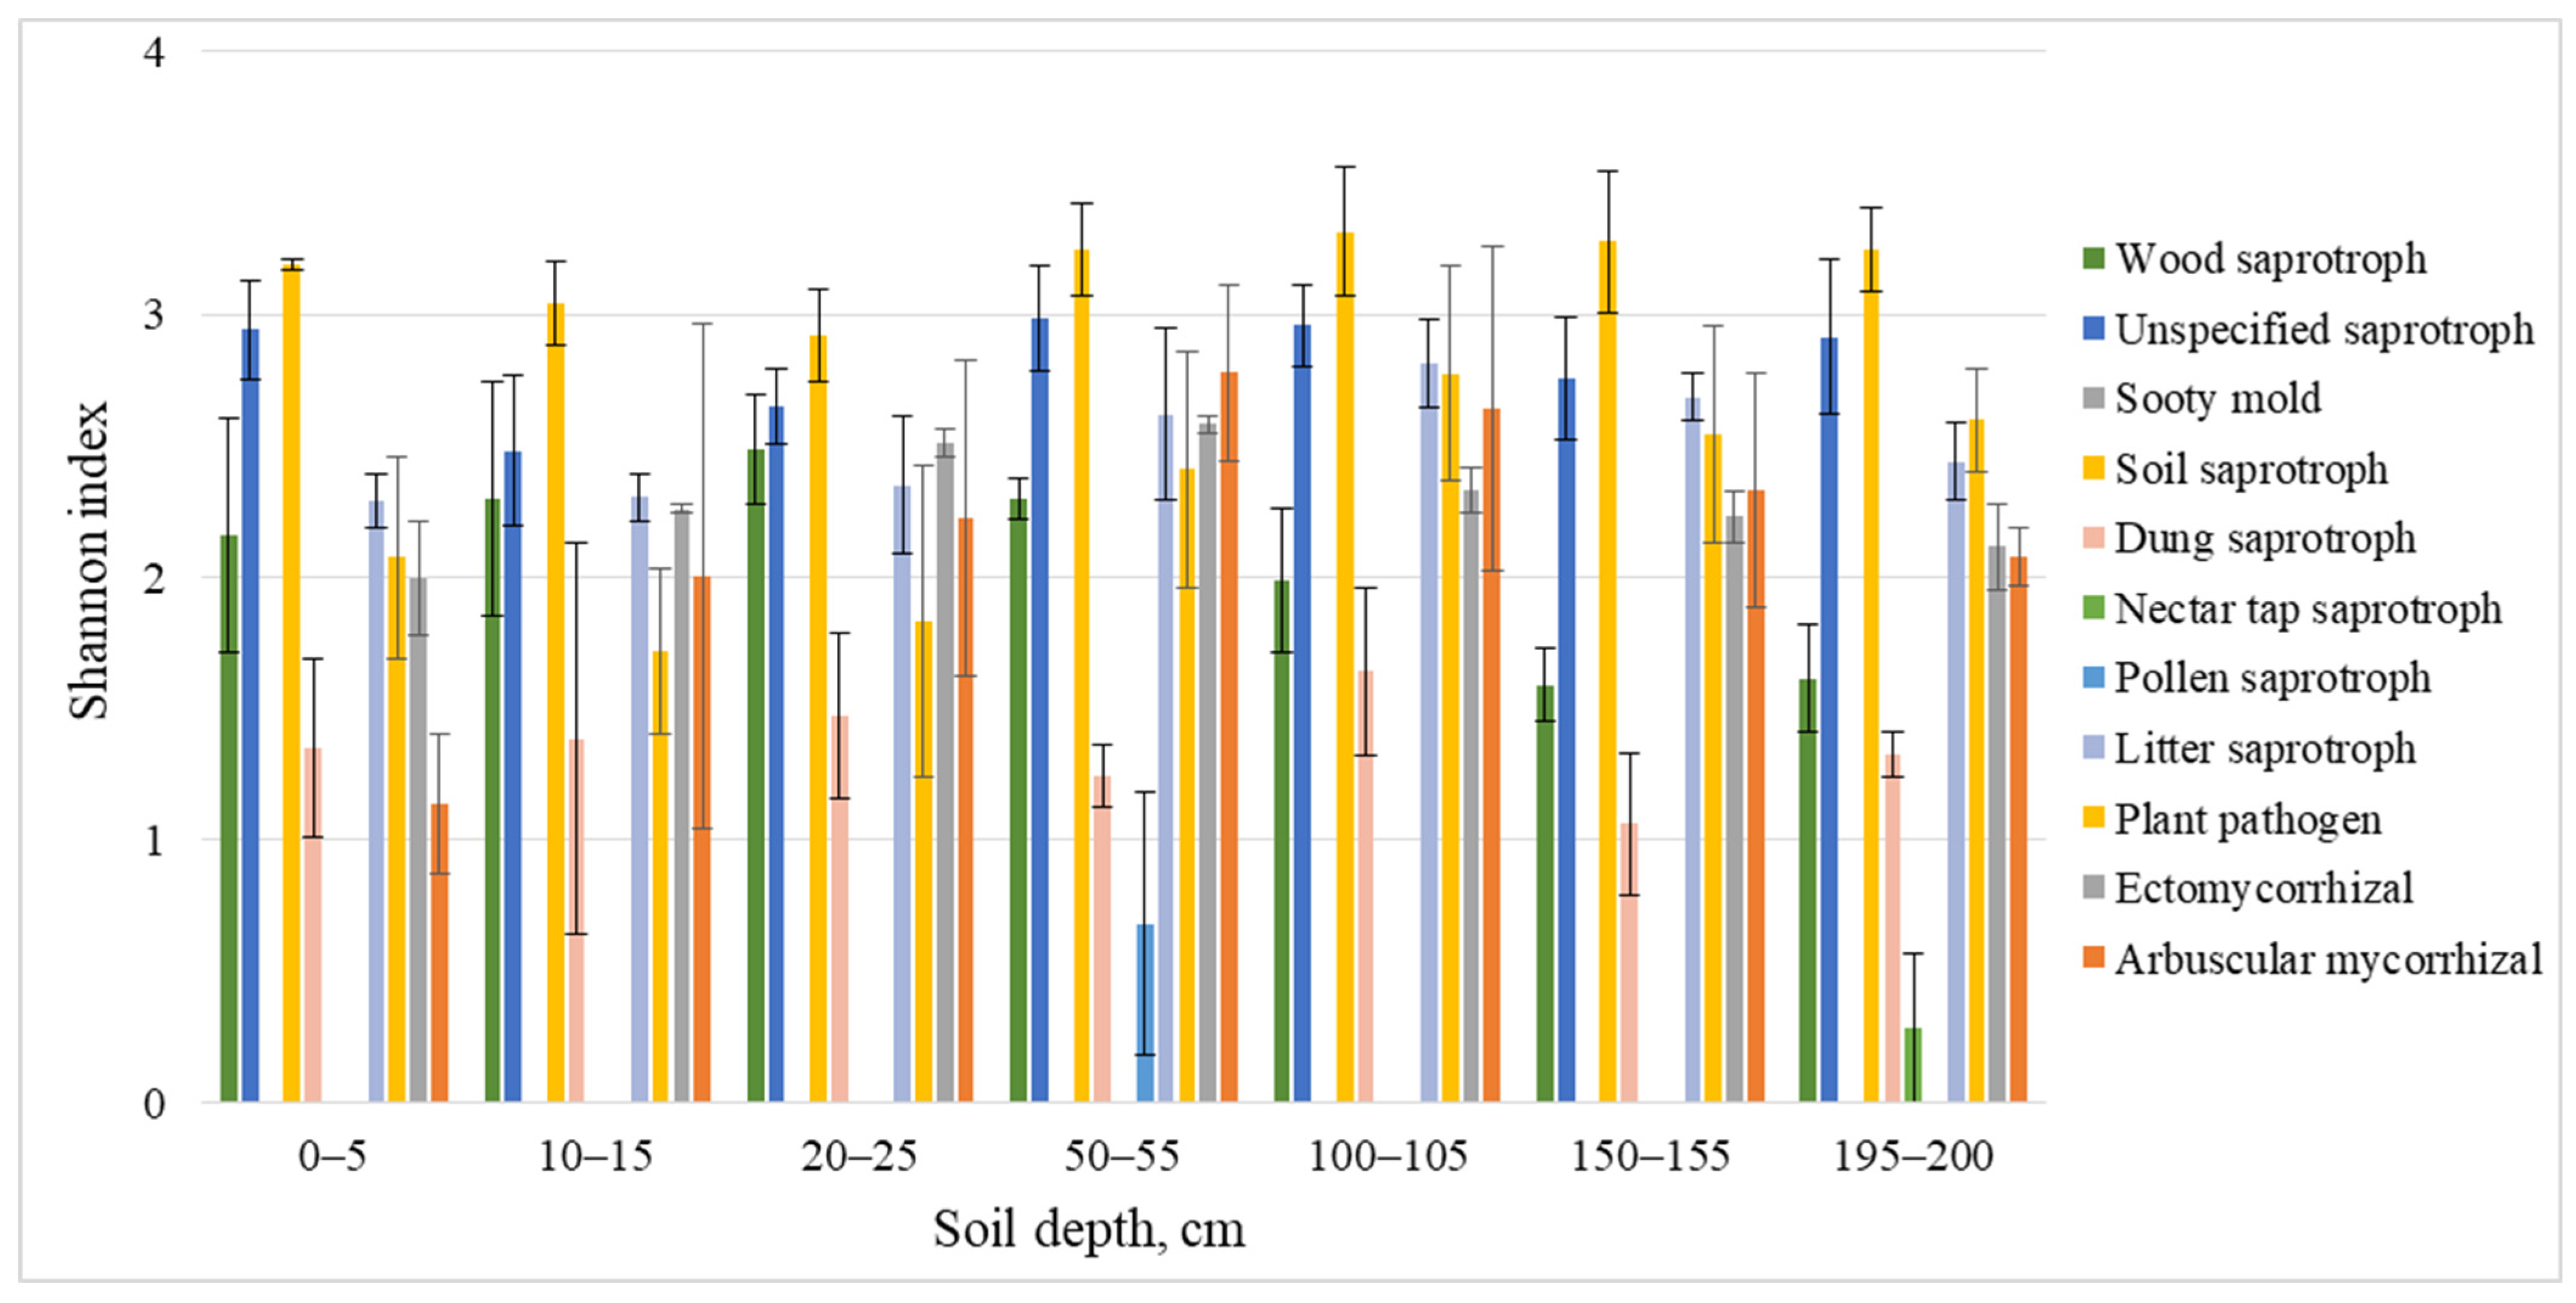
A total of 114,978 quality-filtered sequences revealed 4257 OTUs in the 21 soil samples from the Lithuanian Scots pine stand (one plot). Of these, 100,947 (87.8%) sequences and 2368 (55.6%) OTUs were classified as fungi, the others representing unassigned eukaryotes.
The PERMANOVA test showed that there were no significant differences in fungal community composition with soil depth, and no clear trend was found that indicated the fungal taxonomic groups increased or decreased with depth (F = 0.99; p > 0.48). The calculated observed richness of all fungi across all soil depths ranged from 343 ± 150 to 446 ± 133 (p < 0.05). The observed richness was the highest (446 ± 133), at 100–105 cm. In evaluating this observed richness of all fungi, we determined no significant differences with soil depth (F = 0.32; p > 0.05). The Shannon index values ranged from 4.042 ± 0.135 to 4.791 ± 0.181, the highest being at 50–55 cm, meaning that this depth contained the highest diversity of species in a particular community (F = 5.19; p < 0.05). An increasing trend in the Shannon index values was observed from 0–5 to 50–55 cm and a decreasing trend was observed from 50–55 to 195–200 cm (F = 5.19; p < 0.05) (Table 3).
All the reads were organized into ten main classes (Figure 2). The most abundant class at all soil depths was the Agaricomycetes (42.4%) (F = 0.27; p < 0.05). The next most abundant classes were the Leotiomycetes (13.5%) (F = 0.74; p < 0.05), Sordariomycetes (9.8%) (F = 0.80; p < 0.05), Dothideomycetes (7.6%) (F = 0.85; p < 0.05), and Eurotiomycetes (6.1%) (F = 1.16; p < 0.05).
The Agaricomycetes are discussed further, below the class level. The most abundant, by order, was Trechisporales. At 0–5 cm, the four most abundant orders identified were Trechisporales (30.8%), Agaricales (18.5%), Atheliales (15.2%), and Russulales (12.0%). At 10–15 and 20–25 cm, the most abundant orders identified were Atheliales (24.8% and 22.0%, respectively), Russulales (18.8% and 20.3%), Agaricales (13.8% and 15.3%), and Boletales (14.3% and 11.9%,). At 50–200 cm, Trechisporales (17.0%, 31.7%, 40.9%, 40.2%), Agaricales (19.3%, 21.0%, 22.3%, 22.7%), Atheliales (18.1%, 12.5%, 11.9%, 10.8%), and Russulales (15.7%, 12.3%, 8.4%, 9.7%).
The observed richness and Shannon index values were also determined for each class of fungi. Figure 3 and Figure 4 were constructed from those classes with the largest number (>30) of species because only these classes were able to provide accurate observed richness and Shannon index values.
Two classes stood out from all the observed richness results: Sordariomycetes (F = 0.56; p < 0.05) and Agaricomycetes (F = 0.59; p < 0.05). No statistically significant differences were found in their observed richness depending on the soil depth. The classes Glomeromycetes (F = 1.61; p < 0.05), Mortierellomycetes (F = 0.39; p < 0.05), Pezizomycetes (F = 0.5; p < 0.05), and Umbelopsidomycetes (F = 0.66; p < 0.05) had the lowest observed richness values at all depths.
In evaluating the Shannon index values, four classes stood out from all the results–the Sordariomycetes (F = 1.38; p < 0.05), Agaricomycetes (F = 5.04; p < 0.05), Leotiomycetes (F = 0.61; p > 0.05), and Eurotiomycetes (F = 2.4; p < 0.05). The Sordariomycetes had the highest Shannon index values at all depths except for 0–5 cm. At this depth, the highest Shannon index value was determined for the Leotiomycetes. The Shannon index values for the Leotiomycetes were also high between 100–105 and 195–200 cm. The Shannon index values for the Agaricomycetes increased down to 50–55 cm, then began decreasing, reaching their lowest value at 195–200 cm. The Shannon index values for the Eurotiomycetes were the highest between 50–55 and 195–200 cm. However, there were no statistically significant differences in the Shannon index values of the Leotiomycetes with depth (F = 0.61; p > 0.05), although the Shannon index values of the Agaricomycetes at the depth 20–105 cm were significantly higher than those at 0–5 and 195–200 cm (F = 5.04; p < 0.05). Also, the Shannon index values of Agaricomycetes at the depth 50–55 cm were significantly higher than those at 10–15 and 150–155 cm (F = 5.04; p < 0.05). The Shannon index values of Eurotiomycetes at the depth 50–200 cm were statistically significantly higher than those at 10–15 cm (F = 2.4; p < 0.05). At that time, the Shannon index values of Sardariomycetes at the depth 150–155 cm were significantly higher than those at 10–15 cm (F = 1.38; p < 0.05).

3.4. Fungal Guilds

We were able to identify not only the predominant taxonomic categories of soil fungi, but also their functions in the soil. A total of 1336 (56.4%) fungal OTUs were used for the functional analysis. The saprotrophic fungi accounted for 43–56% of the total fungi (2368 OTUs) at all soil depths, the most abundant being litter saprotrophs (Figure 5). Litter saprotrophs were abundant in the uppermost soil layer (0–5 cm), where there was a lot of litter, their abundances decreasing to 20–25 cm, but then increasing at 50–55 cm, becoming most abundant at 195–200 cm (F = 0.19; p < 0.05).
Wood saprotrophs were abundant in the 0–5 cm layer, where there was a lot of decomposing wood. Similar to the litter saprotrophs, the wood saprotrophs decreased with depth to 20–25 cm, but then their abundances increased, becoming most abundant at 195–200 cm (F = 0.64; p < 0.05). The number of soil saprotrophs increased with depth to 100–105 cm, then started to decrease (F = 0.18; p < 0.05). Most of the ectomycorrhizal fungi were found down to 50–55 cm (F = 0.29; p < 0.05). The plant pathogens were most abundant at 50–55 cm, then decreasing with depth, their lowest abundances being found at 195–200 cm (F = 0.59; p < 0.05).
The differences in richness and Shannon index of fungal groups are illustrated in Figure 6 and Figure 7. The analysis revealed that the observed richness (F = 0.28; p < 0.05) and Shannon index (F = 2.39; p < 0.05) values of the saprotrophs were the highest across the soil gradient. The observed richness of the ectomycorrhizal fungi (F = 2.27; p < 0.05), plant pathogens (F = 1.00; p < 0.05), and arbuscular mycorrhizae (F = 1.84; p < 0.05) were significantly lower than for the saprotrophs. The highest Shannon index values for the saprotrophs and ectomycorrhizal fungi were at 50–55 cm. In evaluating the observed saprotroph richness with depth, no significant differences were found (F = 0.28; p > 0.05). Meanwhile, it was found that the Shannon index values at a soil depth 50–105 cm were significantly higher than at depths 0–5 and 195–200 cm. (F = 2.39; p < 0.05). The Shannon index values of ectomycorrhizal fungi at a soil depth 20–55 cm were significantly higher than at depths 0–5 and 195–200 cm. (F = 3.02; p < 0.05). The highest observed richness of ectomycorrhizal fungi were at 50–55 cm. It was significantly higher than the observed richness of ectomycorrhizal fungi at depths of 0–5, 150–155, and 195–200 cm (F = 2.27; p < 0.05). The highest Shannon index values for the plant pathogens (F = 1.22; p < 0.05) and arbuscular mycorrhizal fungi (F = 2.34; p < 0.05) were at 100–105 cm. However, in evaluating the observed richness and Shannon index values of the plant pathogen fungi with depth, no significant differences were found. Meanwhile, observed richness and the Shannon index values of arbuscular mycorrhizal fungi at a soil depth 50–105 cm were significantly higher than at 0–5 cm.

3.5. Correlation

There was a very strong negative correlation between soil depth and both MBC and MBN (Table S1). There was also a very strong positive correlation between STC and SOC, and between MBC and MBN. A strong negative correlation was found between soil pHCaCl2 and STC, and between pHCaCl2 and SOC. A strong positive correlation was found between soil depth and C:N ratio.

4. Discussion

The microbial communities (including fungal community) in soil play a crucial role in driving nutrient cycling processes and are indispensable in the functioning of agroecosystems. Most studies on soil microbes in agricultural or forest systems have primarily concentrated on the topsoil. By contrast, there has been a relatively limited exploration of the interactions between chemical and microbiological parameters and their influence on the vertical distribution of soil microbes. It was expected that the concentrations of STN and STC would be markedly higher in the topmost (0–5 cm) soil layer due to the much higher concentration of SOC in this layer, and that they would significantly decrease with depth, with other authors having claimed that STN and STC concentrations and the soil C:N ratio all decrease with increasing soil depth [58,59,60,61]. The majority of natural biological processes in the soil ecosystem take place at the soil surface, with the organic matter originating from plant litter initially accumulating on the topsoil. Subsequently, it undergoes migration to the lower layers via water or other mediums, creating a distinct vertical distribution of soil nutrients [62,63], and a gradual decline in nutrient concentrations from the surface down to the deeper layers.
In our study, we observed an increase in soil pH with depth. This can be attributed to the accumulation of phenolic acids in root exudates and the greater accumulation of hydrogen ions (H+) resulting from the process of ammonia oxidation that mainly occurs at the soil surface [64,65]. At our sample locations, the carbonate layer was very deep (below 200 cm) and therefore did not have a statistically significant influence on the changes in SIC. Several factors can influence the SIC concentration in the soil, including pH, soil depth, precipitation, leaching, microbial activity, soil type, and land use, with several more potentially controlling the SIC [66]. The high concentration of SIC at 0–5 cm may have been caused by the relatively low soil pH leading to the dissolution of carbonates. The pH in the topsoil layer (0–5 cm) was more acidic than in deeper soil layers. This increase in pH with depth could have caused the decrease in SIC at depth.
Another important factor that could have caused the decrease in SIC is soil type. The main soil fraction at our study site at 0–200 cm was sand (95.2–98.8%), with only 1.2–4.8% silt and clay, which were mainly found in the topsoil layer. It is well known that the soil carbon in the topsoil occurs in a labile, easy-to-mineralize form. Below 30 cm, the soil carbon that is absorbed becomes physically and biologically protected against mineralization, forming an increasingly stabilized carbon sink [67]. As decomposition progresses, the carbon is lost, while nitrogen becomes immobilized in the microbial biomass, thereby remaining in the system, which frequently results in a lower C:N ratio in the subsoil than the topsoil [68]. Subsequently, the immobilization and mineralization of organic carbon can occur, depending on the C:N ratio in the decomposing organic matter [69]. The immobilization of MBC induced by the stabilization of organic carbon in the soil is determined by an increase in the organic matter C:N ratio (a ratio of 25–30 favors immobilization) and a significant increase in the microbial biomass and enzyme activity [70]. In this regard, the assimilation of carbon depends on its greater association with soil saprotrophic and mycorrhizal fungi [71]. However, it has been found that, as the soil C:N ratio decreases (to <20), microbial decomposition and mineralization become more strongly related to higher bacterial abundances [72]. Our C:N ratios indicate the soil’s higher capacity for carbon storage, except in the soil layers at 20–25 and 50–55 cm, with the C:N ratios in the bulk of the soil being higher or similar to those in the surface layers. A similar trend, with higher C:N ratios occurring in deeper soil horizons, has previously been reported by Piotrowska-Długosz et al. [73].
In soil ecosystems, the soil microbial biomass takes on the role of major functional maintenance, regulating the soil’s fundamental processes (i.e., organic matter decomposition, nutrient cycling, and gaseous fluxes) [74]. In addition, the microbial biomass acts as a composite soil fungal and bacterial biomass contributor, usually with the quality and quantity of the organic matter in the soil varying with the fungal/bacterial biomass ratios [75]. In our study, we estimated the MBC and MBN in the soil without determining the fungal or bacterial origin. According to Delgado-Baquerizo and Eldridge [76], the soil carbon content impacts the fungal/bacterial biomass richness. We assumed that, in the mineral soil profile of the nutrient-poor Arenosol, the fungi and bacteria would share optimal conditions for the development of biomass and diversity. Winding et al. [77] and Blaško et al. [19] indicated that, in forest mineral soils, the MBC and MBN decrease with depth due to SOC and STN stabilization, which limit substrate availability. Because substrates are difficult for microorganisms to accumulate, this limits soil microbial biomass growth [78]. This may be a factor in why the microbial biomass significantly decreases with depth. As soil nutrient conditions shift with depth, the nutrient assimilation efficiency changes among the different soil microorganism groups [79]. However, it is possible that the soil microorganism groups could modify or even shift their microbial biomass activities and abundances [80].
During the study described in this article, it was expected that the highest soil fungal abundances would be found in the uppermost soil layer (0–5 cm, forest floor). However, the highest number of fungal reads and OTUs were found at 50–55 cm, when the sequencing depth was taken into account on a log scale. According to another study, no clear changes in fungal community composition have been found with soil depth [81]. It is likely that the composition of, and differences in, fungal communities with depth could be influenced by Scots pine root systems, preferential flow paths, or differences in oxygen availability. Scots pine root systems can adapt to different environmental conditions, developing both deep and shallow root systems. It is known that in loose, well-drained sandy soils, the depth of root penetration in a Scots pine stand that is more than 100 years old can aim for 200 cm [82,83,84,85]. The Agaricomycetes (belongs to the phylum Basidiomycota) and Leomycetes (belongs to the phylum Ascomycota) were the most abundant at all soil depths, with the Basidiomycota being most abundant at the forest floor and below 150 cm, and the Ascomycota being the most abundant at all other depths. According to Clemmensen et al. [86], Ascomycota is associated with the accumulation of organic matter and Basidiomycota with further decomposition [86,87,88]. The Sordariomycetes and Agaricomycetes had the highest observed richness values. Members of the Sordariomycetes can grow in soil, dung, litter, and wood, acting as decomposers. Some species can be plant pathogens or parasites. Members of the Agaricomycetes also act as decomposers, especially of wood, while some are important ectomycorrhizal symbionts of forest trees.
We also found that saprotrophs and ectomycorrhizal fungi were dominant functional groups. In a similar study to ours, Frey et al. [25] found that saprotrophs and ectomycorrhizal fungi dominated over plant pathogens, animal pathogens, ericoid mycorrhizae, and endophyte fungi. We showed that litter saprotrophs were most abundant at all soil depths. Prada-Salcedo et al. [89] determined that traits of absorptive roots and leaf litter affected specific fungal guilds. It is likely that differences in the abundance of litter saprotrophs in our soil profile were caused by organic layers versus mineral soils, possibly driven by differences in predominant energy sources [90]. In terms of wood saprotrophs, their abundance increased with depth and their numbers were the highest in the deeper soil profile. It is likely that the decomposition of organic matter was more active in the deeper soil layers, where the wood saprotrophs decompose wood residues, removing small-molecule organic compounds from them.
High abundances of ectomycorrhizal fungi were found, as is typical in forest soils. At 50–55 cm, they were most likely actively involved in the decomposition of organic matter, while decreasing in the deeper soil layers, possibly due to the relative decrease in plant roots in those layers (ectomycorrhizal fungi have a symbiotic, mutualistic relationship with plant roots). Clemmensen et al. [86] found that the presence of living roots and ectomycorrhizal fungi lead to a rapid mass loss of organic substrates.

5. Conclusions

When assessing soil stability, it is not enough to estimate only the chemical parameters of the soil. The processes involved are much more complicated. For example, a lot of information can be obtained by determining the abundance and diversity of the soil fungi. Predictably, in terms of the chemical composition of the soil, the topmost layer (0–5 cm) was very different from the other layers because it includes the mineral layer and the forest floor. In this layer, we measured the highest concentrations of STC, SOC, and STN, which then significantly decreased with depth (p < 0.05). Between 50–55 and 100–105 cm, the MBC, MBN, and soil chemical composition changed considerably. The C:N ratio gradually decreased to 50–55 cm and then increased below this (from 50–55 to 195–200 cm). The C:N ratio mainly reflected the stabilization of organic carbon in the soil profile, which itself reflected the extent of carbon assimilation by the soil saprotrophic and mycorrhizal fungi. Thus, the rate of mineralization only increased between 20–25 and 50–55 cm, where the decomposition of organic carbon was stimulated.
Even in this light-textured and infertile Arenosol, fungi were recorded at different depths up to 200 cm. The fungal community composition was significantly independent of soil depth (F = 0.99; p > 0.48).
Saprotrophic fungi were found to be dominant at all depths up to 200 cm. Ectomycorrhizal fungi were most abundant in the topmost layer, decreasing with increasing depth. The highest diversity of fungal species occurred at 50–55 cm (F = 5.19; p < 0.05), perhaps because the ectomycorrhizal fungi were still abundant at this depth, while the saprotrophic fungi were increasing.

Supplementary Materials

The following supporting information can be downloaded at: https://www.mdpi.com/article/10.3390/d16010066/s1, Table S1: Pearson correlation coefficients between the analyzed chemical and biological parameters along the studied Arenosol (0–200 cm depth) in a Scots pine stand; Table S2: p values of soil microbial biomass carbon (MBC) and soil microbial biomass nitrogen (MBN) statistical analysis using Fisher’s LSD test; Table S3: p values of soil total nitrogen, soil total carbon, soil organic carbon, soil inorganic carbon, and pH based on Duncan’s multiple range test.

Author Contributions

Conceptualization, L.T.; Formal Analysis, D.S., J.A. (Jelena Ankuda), A.J., J.A. (Jūratė Aleinikovienė), D.D., V.M. (Vitas Marozas), V.M. (Vladimir Mikryukov) and L.T.; Funding Acquisition, L.T., K.A. and J.A. (Jelena Ankuda); Investigation, J.A. (Jelena Ankuda), D.S., K.A., A.J., J.A. (Jūratė Aleinikovienė), D.D., V.M. (Valeriia Mishcherikova), V.S., L.T. and V.M. (Vladimir Mikryukov); Methodology, L.T., K.A. and J.A. (Jelena Ankuda); Project Administration, L.T. and J.A. (Jelena Ankuda); Visualization, D.S., J.A. (Jelena Ankuda), K.A., A.J., J.A. (Jūratė Aleinikovienė) and D.D.; Supervision, L.T., K.A. and J.A. (Jelena Ankuda); Writing—Original Draft, D.S., J.A. (Jelena Ankuda), K.A., J.A. (Jūratė Aleinikovienė), A.J., D.D. and V.S.; Writing—Review and Editing, D.S., J.A. (Jelena Ankuda), K.A., A.J., J.A. (Jūratė Aleinikovienė), D.D. and L.T. All authors discussed the results and reviewed the manuscript. All authors have read and agreed to the published version of the manuscript.

Funding

The research work carried out to obtain the results was funded by the European Economic Area (EEA) Financial Mechanism Baltic Research Programme in Estonia (Grant no. EMP442). The article processing charges (APC) was funded by the European Economic Area (EEA) Financial Mechanism Baltic Research Programme in Estonia (Grant no. EMP442).

Institutional Review Board Statement

Not applicable.

Data Availability Statement

The DNA sequences recovered in this study have been deposited in the NCBI Sequence Read Archive (SRA) and are available under accession numbers SRR27547923 to SRR27547943, associated with BioProject PRJNA1064690 (https://www.ncbi.nlm.nih.gov/bioproject/PRJNA1064690, accessed on 13 January 2024).

Conflicts of Interest

The authors declare no conflicts of interest.

References

  1. Smal, H.; Ligęza, S.; Pranagal, J.; Urban, D.; Pietruczyk-Popławska, D. Changes in the stocks of soil organic carbon, total nitrogen and phosphorus following afforestation of post-arable soils: A chronosequence study. For. Ecol. Manag. 2019, 451, 117536. [Google Scholar] [CrossRef]
  2. Bārdule, A.; Butlers, A.; Lazdiņš, A.; Līcīte, I.; Zvirbulis, U.; Putniņš, R.; Jansons, A.; Adamovičs, A.; Razma, Ģ. Evaluation of soil organic layers thickness and soil organic carbon stock in hemiboreal forests in Latvia. Forests 2021, 12, 840. [Google Scholar] [CrossRef]
  3. Varnagirytė-Kabašinskienė, I.; Žemaitis, P.; Armolaitis, K.; Stakėnas, V.; Urbaitis, G. Soil organic carbon stocks in afforested agricultural land in Lithuanian hemiboreal forest zone. Forests 2021, 12, 1562. [Google Scholar] [CrossRef]
  4. Borůvka, L.; Vašát, R.; Šrámek, V.; Hellebrandová, K.N.; Fadrhonsová, V.; Sáňka, M.; Pavlů, L.; Sáňka, O.; Vacek, O.; Němeček, K.; et al. Predictors for digital mapping of forest soil organic carbon stocks in different types of landscape. Soil Water Res. 2022, 17, 69–79. [Google Scholar] [CrossRef]
  5. Liski, J.; Perruchoud, D.; Karjalainen, T. Increasing carbon stocks in the forest soils of western Europe. For. Ecol. Manag. 2002, 169, 159–175. [Google Scholar] [CrossRef]
  6. Baritz, R.; Seufert, G.; Montanarella, L.; Van Ranst, E. Carbon concentrations and stocks in forest soils of Europe. For. Ecol. Manag. 2010, 260, 262–277. [Google Scholar] [CrossRef]
  7. Forsmark, B.; Nordin, A.; Maaroufi, N.I.; Lundmark, T.; Gundale, M.J. Low and high nitrogen deposition rates in northern coniferous forests have different impacts on aboveground litter production, soil respiration, and soil carbon stocks. Ecosystems 2020, 23, 1423–1436. [Google Scholar] [CrossRef]
  8. Li, M.; Meador, T.; Sauheitl, L.; Guggenberger, G.; Angst, G. Substrate quality effects on stabilized soil carbon reverse with depth. Geoderma 2022, 406, 115511. [Google Scholar] [CrossRef]
  9. Sokol, N.W.; Sanderman, J.; Bradford, M.A. Pathways of mineral-associated soil organic matter formation: Integrating the role of plant carbon source, chemistry, and point of entry. Glob. Chang. Biol. 2019, 25, 12–24. [Google Scholar] [CrossRef]
  10. Wiesmeier, M.; Urbanski, L.; Hobley, E.; Lang, B.; von Lützow, M.; Marin-Spiotta, E.; van Wesemael, B.; Rabot, E.; Ließ, M.; Garcia-Franco, N.; et al. Soil organic carbon storage as a key function of soils—A review of drivers and indicators at various scales. Geoderma 2019, 333, 149–162. [Google Scholar] [CrossRef]
  11. Kögel-Knabner, I.; Amelung, W. Soil organic matter in major pedogenic soil groups. Geoderma 2021, 384, 114785. [Google Scholar] [CrossRef]
  12. Deng, J.; Zhu, W.; Zhou, Y.; Yin, Y. Soil organic carbon chemical functional groups under different revegetation types are coupled with changes in the microbial community composition and the functional genes. Forests 2019, 10, 240. [Google Scholar] [CrossRef]
  13. Błońska, E.; Piaszczyk, W.; Staszel, K.; Lasota, J. Enzymatic activity of soils and soil organic matter stabilization as an effect of components released from the decomposition of litter. Appl. Soil Ecol. 2021, 157, 103723. [Google Scholar] [CrossRef]
  14. Feng, J.; He, K.; Zhang, Q.; Han, M.; Zhu, B. Changes in plant inputs alter soil carbon and microbial communities in forest ecosystems. Glob. Chang. Biol. 2022, 28, 3426–3440. [Google Scholar] [CrossRef] [PubMed]
  15. Kome, G.K.; Enang, R.K.; Tabi, F.O.; Yerima, B.P.K. Influence of clay minerals on some soil fertility attributes: A review. Open J. Soil Sci. 2019, 9, 155–188. [Google Scholar] [CrossRef]
  16. Derenne, S.; Tu, T.T.N. Characterizing the molecular structure of organic matter from natural environments: An analytical challenge. C. R. Geosci. 2014, 346, 53–63. [Google Scholar] [CrossRef]
  17. Bardgett, R.D.; Van Der Putten, W.H. Belowground biodiversity and ecosystem functioning. Nature 2014, 515, 505–511. [Google Scholar] [CrossRef] [PubMed]
  18. Hao, J.; Chai, Y.N.; Lopes, L.D.; Ordóñez, R.A.; Wright, E.E.; Archontoulis, S.; Schachtman, D.P. The effects of soil depth on the structure of microbial communities in agricultural soils in Iowa (United States). Appl. Environ. Microbiol. 2021, 87, e02673-20. [Google Scholar] [CrossRef]
  19. Blaško, R.; Bach, L.H.; Yarwood, S.A.; Trumbore, S.E.; Högberg, P.; Högberg, M.N. Shifts in soil microbial community structure, nitrogen cycling and the concomitant declining N availability in ageing primary boreal forest ecosystems. Soil Biol. Biochem. 2015, 91, 200–211. [Google Scholar] [CrossRef]
  20. Chodak, M.; Klimek, B.; Niklińska, M. Composition and activity of soil microbial communities in different types of temperate forests. Biol. Fertil. Soils 2016, 52, 1093–1104. [Google Scholar] [CrossRef]
  21. Awad, A.; Majcherczyk, A.; Schall, P.; Schröter, K.; Schöning, I.; Schrumpf, M.; Ehbrecht, M.; Boch, S.; Kahl, T.; Bauhus, J.; et al. Ectomycorrhizal and saprotrophic soil fungal biomass are driven by different factors and vary among broadleaf and coniferous temperate forests. Soil Biol. Biochem. 2019, 131, 9–18. [Google Scholar] [CrossRef]
  22. Li, J.; Zhu, T.; Singh, B.K.; Pendall, E.; Li, B.; Fang, C.; Nie, M. Key microorganisms mediate soil carbon-climate feedbacks in forest ecosystems. Sci. Bull. 2021, 66, 2036–2044. [Google Scholar] [CrossRef] [PubMed]
  23. Bell-Doyon, P.; Bellavance, V.; Bélanger, L.; Mazerolle, M.J.; Villarreal-A., J.C. Bacterial, fungal, and mycorrhizal communities in the soil differ between clearcuts and insect outbreaks in the boreal forest 50 years after disturbance. For. Ecol. Manag. 2022, 523, 120493. [Google Scholar] [CrossRef]
  24. Yang, Y.; Cheng, S.; Fang, H.; Guo, Y.; Li, Y.; Zhou, Y. Interactions between soil organic matter chemical structure and microbial communities determine the spatial variation of soil basal respiration in boreal forests. Appl. Soil Ecol. 2023, 183, 104743. [Google Scholar] [CrossRef]
  25. Frey, B.; Walthert, L.; Perez-Mon, C.; Stierli, B.; Köchli, R. Deep soil layers of drought-exposed forests harbor poorly known bacterial and fungal communities. Front. Microbiol. 2021, 12, 674160. [Google Scholar] [CrossRef]
  26. Baldrian, P.; Valášková, V. Degradation of cellulose by basidiomycetous fungi. FEMS Microbiol. Rev. 2008, 32, 501–521. [Google Scholar] [CrossRef]
  27. Crowther, C.R.; Boddy, L.; Jones, T.H. Functional and ecological consequences of saprotrophic fungus–grazer interactions. ISME J. 2012, 6, 1992–2001. [Google Scholar] [CrossRef]
  28. Tisdall, J.M.; Nelson, S.E.; Wilkinson, K.G.; Smith, S.E.; McKenzie, B.M. Stabilisation of soil against wind erosion by six saprotrophic fungi. Soil Biol. Biochem. 2012, 50, 134–141. [Google Scholar] [CrossRef]
  29. Amorim, H.C.; Hurtarte, L.C.; Souza, I.F.; Zinn, Y.L. C:N ratios of bulk soils and particle-size fractions: Global trends and major drivers. Geoderma 2022, 425, 116026. [Google Scholar] [CrossRef]
  30. Gorliczay, E.; Boczonádi, I.; Kiss, N.É.; Tóth, F.A.; Pabar, S.A.; Biró, B.; Kovács, L.R.; Tamás, J. Microbiological effectivity evaluation of new poultry farming organic waste recycling. Agriculture 2021, 11, 683. [Google Scholar] [CrossRef]
  31. Eggleston, H.S.; Buendia, L.; Miwa, K.; Ngara, T.; Tanabe, K. (Eds.) IPCC Guidelines for National Greenhouse Gas Inventories. The National Greenhouse Gas Inventories Programme; Institute for Global Environmental Strategies: Hayama, Japan, 2006; ISBN 4-88788-032-4. [Google Scholar]
  32. EEA. Europe’s Biodiversity—Biogeographical Regions and Seas; EEA Report No. 1/2002; EEA: Geneva, Switzerland, 2002. [Google Scholar]
  33. Hytteborn, H.; Maslov, A.A.; Nazimova, D.I.; Rysin, L.P. Boreal forests of Eurasia. In Coniferous Forests. Ecosystems of the World; Andersson, F., Ed.; Elsevier: Amsterdam, The Netherlands, 2005; Volume 6, pp. 23–29. [Google Scholar]
  34. Jögiste, K.; Korjus, H.; Stanturf, J.A.; Frelich, L.E.; Baders, E.; Donis, J.; Jansons, A.; Kangur, A.; Köster, K.; Laarmann, D.; et al. Hemiboreal forest: Natural disturbances and the importance of ecosystem legacies to management. Ecosphere 2017, 8, e01706. [Google Scholar] [CrossRef]
  35. Krasnova, A.; Soosaar, K.; Uri, V.; Mander, Ü.; Krasnov, D.; Noe, S. Hemiboreal forests under the 2018 Europe heat wave. Geophys. Res. Abstr. 2019, 21, EGU2019-8604. [Google Scholar]
  36. Lithuanian Hydrometeorological Service under the Ministry of Environment. Comparative Evaluation of Climate Changes in Lithuania 1961–1990 and 1991–2020 Standard Climate Norms; Lithuanian Hydrometeorological Service under the Ministry of Environment: Vilnus, Lithuania, 2021; p. 18. (In Lithuanian) [Google Scholar]
  37. International Union of Soil Sciences Working Group World Reference Base. World Reference Base for Soil Resources 2014, Update 2015. International Soil Classification System for Naming Soils and Creating Legends for Soil Maps; World Soil Resources Reports No. 106; FAO: Rome, Italy, 2015. [Google Scholar]
  38. Food and Agriculture Organization (FAO). Guidelines for Soil Description, 4th ed.; FAO: Rome, Italy, 2006. [Google Scholar]
  39. Cools, N.; De Vos, B. Part X: Sampling and Analysis of Soil. Manual on Methods and Criteria for Harmonized Sampling, Assessment, Monitoring and Analysis of the Effects of Air Pollution on Forests. Thünen Institute of Forest Ecosystems: Eberswalde, Germany, 2020. Version 2020-1. pp. 1–29. Available online: https://www.icp-forests.org/pdf/manual/2020/ICP_Manual_part10_2020_Soil_version_2020-1.pdf (accessed on 2 October 2023).
  40. Tedersoo, L.; Mikryukov, V.; Anslan, S.; Bahram, M.; Khalid, A.N.; Corrales, A.; Agan, A.; Vasco-Palacios, A.-M.; Saitta, A.; Antonelli, A.; et al. The Global Soil Mycobiome consortium dataset for boosting fungal diversity research. Fungal Divers. 2021, 111, 573–588. [Google Scholar] [CrossRef]
  41. ISO 10390; Soil Quality—Determination of pH. ISO (International Standards Organization): Geneva, Switzerland, 2005.
  42. ISO 10694; Soil Quality—Determination of Organic and Total Carbon after Dry Combustion (Elementary Analysis). ISO: Geneva, Switzerland, 1995.
  43. ISO 11261; Soil Quality—Determination of Total Nitrogen. Modified Kjeldahl Method. ISO: Geneva, Switzerland, 1995.
  44. Setia, R.; Verma, S.L.; Marschner, P. Measuring microbial biomass carbon by direct extraction—Comparison with chloroform fumigation-extraction. Eur. J. Soil Biol. 2012, 53, 103–106. [Google Scholar] [CrossRef]
  45. Vance, E.D.; Brookes, P.C.; Jenkinson, D.S. An extraction method for measuring soil microbial biomass C. Soil Biol. Biochem. 1987, 19, 703–707. [Google Scholar] [CrossRef]
  46. Tedersoo, L.; Lindahl, B. Fungal identification biases in microbiome projects. Environ. Microbiol. Rep. 2016, 8, 774–779. [Google Scholar] [CrossRef]
  47. Anslan, S.; Bahram, M.; Hiiesalu, I.; Tedersoo, L. PipeCraft: Flexible open-source toolkit for bioinformatics analysis of custom high-throughput amplicon sequencing data. Mol. Ecol. Resour. 2017, 17, 234–240. [Google Scholar] [CrossRef]
  48. Martin, M. Cutadapt removes adapter sequences from high-throughput sequencing reads. EMBnet J. 2011, 17, 10–12. [Google Scholar] [CrossRef]
  49. Rognes, T.; Flouri, T.; Nichols, B.; Quince, C.; Mahé, F. VSEARCH: A versatile open source tool for metagenomics. PeerJ 2016, 4, e2584. [Google Scholar] [CrossRef]
  50. Nilsson, R.H.; Anslan, S.; Bahram, M.; Wurzbacher, C.; Baldrian, P.; Tedersoo, L. Mycobiome diversity: High-throughput sequencing and identification of fungi. Nat. Rev. Microbiol. 2019, 17, 95–109. [Google Scholar] [CrossRef]
  51. Camacho, C.; Coulouris, G.; Avagyan, V.; Ma, N.; Papadopoulos, J.; Bealer, K.; Madden, T.L. BLAST+: Architecture and applications. BMC Bioinform. 2009, 10, 421. [Google Scholar] [CrossRef]
  52. Põlme, S.; Abarenkov, K.; Nilsson, R.H.; Lindahl, B.D.; Clemmensen, K.E.; Kauserud, H.; Nguyen, N.; Kjøller, R.; Bates, S.T.; Baldrian, P.; et al. FungalTraits: A user-friendly traits database of fungi and fungus-like stramenopiles. Fungal Divers. 2020, 105, 1–16. [Google Scholar] [CrossRef]
  53. SAS Institute. The SAS System for Windows, version 9.4; SAS Institute: Cary, NC, USA, 2016. [Google Scholar]
  54. McCune, B.; Mefford, M.J. PC-ORD. Multivariate Analysis of Ecological Data; MjM Software: Gleneden Beach, OR, USA, 2011. [Google Scholar]
  55. Tedersoo, L.; Mikryukov, V.; Zizka, A.; Bahram, M.; Hagh-Doust, N.; Anslan, S.; Prylutskyi, O.; Delgado-Baquerizo, M.; Maestre, F.T.; Pärn, J.; et al. Towards understanding diversity, endemicity and global change vulnerability of soil fungi. bioRxiv 2022. [Google Scholar] [CrossRef]
  56. Addinsoft. XLSTAT Statistical and Data Analysis Solution; Addinsoft: New York, NY, USA, 2022. [Google Scholar]
  57. Inkscape Project. Inkscape. 2020. Available online: https://inkscape.org (accessed on 1 December 2023).
  58. Brewer, T.E.; Aronson, E.L.; Arogyaswamy, K.; Billings, S.A.; Botthoff, J.K.; Campbell, A.N.; Dove, N.C.; Fairbanks, D.; Gallery, R.E.; Hart, S.C.; et al. Ecological and genomic attributes of novel bacterial taxa that thrive in subsurface soil horizons. mBio 2019, 10, e01318-19. [Google Scholar] [CrossRef] [PubMed]
  59. Tripathi, B.M.; Kim, H.M.; Jung, J.Y.; Nam, S.; Ju, H.T.; Kim, M.; Lee, Y.K. Distinct taxonomic and functional profiles of the microbiome associated with different soil horizons of a moist tussock tundra in Alaska. Front. Microbiol. 2019, 10, 1442. [Google Scholar] [CrossRef] [PubMed]
  60. Tang, Y.; Yu, G.; Zhang, X.; Wang, Q.; Ge, J.; Liu, S. Changes in nitrogen-cycling microbial communities with depth in temperate and subtropical forest soils. Appl. Soil Ecol. 2018, 124, 218–228. [Google Scholar] [CrossRef]
  61. Naylor, D.; McClure, R.; Jansson, J. Trends in microbial community composition and function by soil depth. Microorganisms 2022, 10, 540. [Google Scholar] [CrossRef]
  62. Chen, X.; Feng, J.G.; Ding, Z.J.; Tang, M.; Zhu, B. Changes in soil total, microbial and enzymatic C-N-P contents and stoichiometry with depth and latitude in forest ecosystems. Sci. Total Environ. 2022, 816, 151583. [Google Scholar] [CrossRef]
  63. Liu, Z.X.; Gu, H.D.; Yao, Q.; Jiao, F.; Liu, J.J.; Jin, J.; Liu, X.B.; Wang, G.H. Microbial communities in the diagnostic horizons of agricultural Isohumosols in northeast China reflect their soil classification. Catena 2022, 216, 106430. [Google Scholar] [CrossRef]
  64. Ren, G.D.; Wang, G.F.; Ma, Y. Research progresses on relationship between plant root exudates and soil-borne diseases. Soils 2021, 53, 229–235. (In Chinese) [Google Scholar] [CrossRef]
  65. Fischer, D.; Uksa, M.; Tischler, W.; Kautz, T.; Köpke, U.; Schloter, M. Abundance of ammonia oxidizing microbes and denitrifiers in different soil horizons of an agricultural soil in relation to the cultivated crops. Biol. Fertil. Soils 2013, 49, 1243–1246. [Google Scholar] [CrossRef]
  66. Sharififar, A.; Minasny, B.; Arrouays, D.; Boulonne, L.; Chevallier, T.; van Deventer, P.; Field, D.J.; Gomez, C.; Jang, H.-J.; Jeon, S.-H.; et al. Chapter Four—Soil inorganic carbon, the other and equally important soil carbon pool: Distribution, controlling factors, and the impact of climate change. In Advances in Agronomy; Academic Press: Cambridge, MA, USA, 2023; Volume 178, pp. 165–231. [Google Scholar] [CrossRef]
  67. Hsiao, C.-J.; Sassenrath, G.F.; Zeglin, L.H.; Hettiarachchi, G.M.; Rice, C.W. Vertical changes of soil microbial properties in claypan soils. Soil Biol. Biochem. 2018, 121, 154–164. [Google Scholar] [CrossRef]
  68. Rumpel, C.; Kögel-Knabner, I. Deep soil organic matter—A key but poorly understood component of terrestrial C cycle. Plant Soil 2011, 338, 143–158. [Google Scholar] [CrossRef]
  69. Prommer, J.; Walker, T.W.; Wanek, W.; Braun, J.; Zezula, D.; Hu, Y.; Hofhansl, F.; Richter, A. Increased microbial growth, biomass, and turnover drive soil organic carbon accumulation at higher plant diversity. Glob. Chang. Biol. 2020, 26, 669–681. [Google Scholar] [CrossRef] [PubMed]
  70. Jia, X.; Zhong, Y.; Liu, J.; Zhu, G.; Shangguan, Z.; Yan, W. Effects of nitrogen enrichment on soil microbial characteristics: From biomass to enzyme activities. Geoderma 2020, 366, 114256. [Google Scholar] [CrossRef]
  71. Zhou, J.; Wen, Y.; Shi, L.; Marshall, M.R.; Kuzyakov, Y.; Blagodatskaya, E.; Zang, H. Strong priming of soil organic matter induced by frequent input of labile carbon. Soil Biol. Biochem. 2021, 152, 108069. [Google Scholar] [CrossRef]
  72. Osterholz, W.R.; Rinot, O.; Shaviv, A.; Linker, R.; Liebman, M.; Sanford, G.; Strock, J.; Castellano, M.J. Predicting gross nitrogen mineralization and potentially mineralizable nitrogen using soil organic matter properties. Soil Sci. Soc. Am. J. 2017, 81, 1115–1126. [Google Scholar] [CrossRef]
  73. Piotrowska-Długosz, A.; Długosz, J.; Frąc, M.; Gryta, A.; Breza-Boruta, B. Enzymatic activity and functional diversity of soil microorganisms along the soil profile—A matter of soil depth and soil-forming processes. Geoderma 2022, 416, 115779. [Google Scholar] [CrossRef]
  74. Crowther, T.W.; Van den Hoogen, J.; Wan, J.; Mayes, M.A.; Keiser, A.D.; Mo, L.; Averill, C.; Maynard, D.S. The global soil community and its influence on biogeochemistry. Science 2019, 365, eaav0550. [Google Scholar] [CrossRef]
  75. He, L.; Rodrigues, J.L.M.; Soudzilovskaia, N.A.; Barceló, M.; Olsson, P.A.; Song, C.; Tedersoo, L.; Yuan, F.; Yuan, F.; Lipson, D.A.; et al. Global biogeography of fungal and bacterial biomass carbon in topsoil. Soil Biol. Biochem. 2020, 151, 108024. [Google Scholar] [CrossRef]
  76. Delgado-Baquerizo, M.; Eldridge, D.J. Cross-biome drivers of soil bacterial alpha diversity on a worldwide scale. Ecosystems 2019, 22, 1220–1231. [Google Scholar] [CrossRef]
  77. Winding, A.; Hund-Rinke, K.; Rutgers, M. The use of microorganisms in ecological soil classification and assessment concepts. Ecotoxicol. Environ. Saf. 2005, 62, 230–248. [Google Scholar] [CrossRef] [PubMed]
  78. Khan, K.S.; Joergensen, R.G. Stoichiometry of the soil microbial biomass in response to amendments with varying C/N/P/S ratios. Biol. Fertil. Soils 2019, 55, 265–274. [Google Scholar] [CrossRef]
  79. Yang, Y.; Zhang, X.; Zhang, C.; Wang, H.; Fu, X.; Chen, F.; Wan, S.; Sun, X.; Wen, X.; Wang, J. Understory vegetation plays the key role in sustaining soil microbial biomass and extracellular enzyme activities. Biogeosciences 2018, 15, 4481–4494. [Google Scholar] [CrossRef]
  80. Hicks, L.C.; Lajtha, K.; Rousk, J. Nutrient limitation may induce microbial mining for resources from persistent soil organic matter. Ecology 2021, 102, e03328. [Google Scholar] [CrossRef]
  81. Ko, D.; Yoo, G.; Yun, S.T.; Jun, S.C.; Chung, H. Bacterial and fungal community composition across the soil depth profiles in a fallow field. J. Ecol. Environ. 2017, 41, 34. [Google Scholar] [CrossRef]
  82. Tyukavina, O.N.; Evdokimov, V.N. Pinus sylvestris Root System in the North Taiga Zone (Кoрневая система сoсны oбыкнoвеннoй в услoвиях северoтаежнoй зoны). For. J. 2016, 1, 55–65. (In Russian) [Google Scholar] [CrossRef]
  83. Finér, L.; Helmisaari, H.-S.; Lõhmus, K.; Majdi, H.; Brunner, I.; Børja, I.; Eldhuset, T.; Godbold, D.; Grebenc, T.; Konôpka, B.; et al. Variation in fine root biomass of three European tree species: Beech (Fagus sylvatica L.), Norway spruce (Picea abies L. Karst.), and Scots pine (Pinus sylvestris L.). Plant Biosyst. Int. J. Deal. All Asp. Plant Biol. 2007, 141, 394–405. [Google Scholar] [CrossRef]
  84. Buraczyk, W.; Kapuścińska, M. Effects of pruning of vertical roots on growth of one-year Scots pine (Pinus sylvestris L.) seedlings in the first year after transplanting. Folia For. Pol. Ser. A 2010, 52, 26–32. [Google Scholar]
  85. Zhiyanski, M. Seasonal dynamics of fine root biomass in selected forest stands. Silva Balc. 2014, 15, 5–15. [Google Scholar]
  86. Clemmensen, K.E.; Durling, M.K.; Michelsen, A.; Hallin, S.; Finlay, R.D.; Lindahl, B.D. A tipping point in carbon storage when forest expands into tundra is related to mycorrhizal recycling of nitrogen. Ecol. Lett. 2021, 24, 1193–1204. [Google Scholar] [CrossRef] [PubMed]
  87. Fernandez, C.W.; Heckman, K.; Kolka, R.; Kennedy, P.G. Melanin mitigates the accelerated decay of mycorrhizal necromass with peatland warming. Ecol. Lett. 2019, 22, 498–505. [Google Scholar] [CrossRef]
  88. Lindahl, B.D.; Tunlid, A. Tansley insight. Ectomycorrhizal fungi—Potential organic matter decomposers, yet not saprotrophs. New Phytol. 2015, 205, 1443–1447. [Google Scholar] [CrossRef] [PubMed]
  89. Prada-Salcedo, L.D.; Goldmann, K.; Heintz-Buschart, A.; Reitz, T.; Wambsganss, J.; Bauhus, J.; Buscot, F. Fungal guilds and soil functionality respond to tree community traits rather than to tree diversity in European forests. Mol. Ecol. 2020, 30, 572–591. [Google Scholar] [CrossRef] [PubMed]
  90. Persoh, D.; Stolle, N.; Brachmann, A.; Begerow, D.; Rambold, G. Fungal guilds are evenly distributed along a vertical spruce forest soil profile while individual fungi show pronounced niche partitioning. Mycol. Prog. 2018, 17, 925–939. [Google Scholar] [CrossRef]
Figure 1. Soil (a) microbial biomass carbon (MBC) and (b) microbial biomass nitrogen (MBN) between 0 and 200 cm in the Arenosol in the Scots pine stand. Values = mean ± SE (n = 3). Notes: Values followed by different letters represent significant differences along the soil depth (p < 0.05). Underlined values below the detection limit and p values are presented in Supplementary Materials Table S2.
Diversity 16 00066 g001
Figure 2. Relative abundances of the most common fungal operational taxonomic units (OTUs) below class level between 0 and 200 cm in the Arenosol in the Scots pine stand.
Diversity 16 00066 g002
Figure 3. Differences in the observed richness values of the fungal classes. Values = mean ± SE (n = 3).
Diversity 16 00066 g003
Figure 4. Differences in the Shannon index values of the fungal classes. Values = mean ± SE (n = 3).
Diversity 16 00066 g004
Figure 5. Relative abundance of fungal functional guilds between 0 and 200 cm in the Arenosol in the Scots pine stand.
Diversity 16 00066 g005
Figure 6. Differences in the observed richness values of fungal groups. Values = mean ± SE (n = 3).
Diversity 16 00066 g006
Figure 7. Differences in the Shannon index values of fungal groups. Values = mean ± SE (n = 3).
Diversity 16 00066 g007
Table 1. Horizons and mineral soil particle distribution for 0–200 cm depth in the studied Hapli-Albic Arenosol in a Scots pine stand.
HorizonDepth (cm)Particle Size (%)
˂2 µm2–63 µm63–2000 µm
OL−4–−3---
OFH−3–0---
E0–81.73.195.2
B18–280.72.496.9
B228–480.50.898.7
B3g48–1200.80.498.8
B4g120–1701.20.498.4
B5gCg170–2001.20.598.3
Notes: OL—forest litter (mainly needle litter) layer; OFH—fragmented (OF) + humified (OH) litter layers of the soil organic horizon (forest floor); E—eluvial mineral horizon; B1 and B2—illuvial mineral horizons; B3g and B4g—stagnic illuvial horizons; B5gCg—transitional stagnic illuvial (B5g) + parent material (Cg) mineral horizon [38,39].
Table 2. Mean pH values and mean concentrations of soil total nitrogen, soil total carbon, soil organic carbon, soil inorganic carbon, and carbon/nitrogen (C:N) ratio from 0 to 200 cm in the Arenosol profile in the Scots pine stand.
Soil Depth (cm)pHCaCl2Concentration (g kg−1)SOC/STN
(C:N)
STNSTCSOCSIC
0–53.62 ± 0.87 a12.5 ± 6.86393.7 ± 68.18358.5 ± 60.6835.2 ± 17.3228.67
10–154.30 ± 0.25 ab0.41 ± 0.176 d10.28 ± 2.58 c9.68 ± 2.42 c0.70 ± 0.48 ab23.42
20–254.90 ± 0.10 bcd0.29 ± 0.116 bcd5.88 ± 1.80 b5.22 ± 1.87 b0.66 ± 0.36 ab18.33
50–554.95 ± 0.13 bcd0.19 ± 0.292 ab3.02 ± 0.29 a2.50 ± 0.31 a0.46 ± 0.35 ab13.21
100–1055.08 ± 0.12 d0.08 ± 0.009 ab2.40 ± 0.14 a2.10 ± 0.27 a0.36 ± 0.28 ab25.61
150–1554.89 ± 0.21 bcd0.06 ± 0.035 a3.08 ± 0.49 a2.38 ± 0.51 a0.72 ± 0.19 b43.59
195–2004.79 ± 0.44 bcd0.03 ± 0.014 a3.22 ± 0.36 a2.72 ± 0.23 a0.58 ± 0.51 ab98.55
F value5.0085.21626.3426.760.722-
p value0.006160.002220.000000005180.000000004430.614-
Notes: Values = mean ± SD (standard deviation). p value—the probability. Different lower-case letters indicate significant differences among the soil depths based on Duncan’s multiple range test (p < 0.05). The 0–5 cm soil depth was not statistically evaluated due to its different origin (the forest floor). STN—soil total nitrogen; STC—soil total carbon; SOC—soil organic carbon; SIC—soil mineral (inorganic) carbon; C:N—carbon and nitrogen ratio.
Table 3. Fungal community richness and diversity in the Arenosol profiles.
Soil Depth (cm)Total Number of Sequence Reads Per SampleNumber of Fungal OTUsObserved Richness of All FungiShannon Index of All Fungi
0–515,7371118373 ± 304.042 ± 0.135
10–1515,1151030343 ± 1504.268 ± 0.230
20–2513,9941112371 ± 1404.600 ± 0.206
50–5517,2311299433 ± 914.791 ± 0.181
100–10519,7741338446 ± 1334.721 ± 0.058
150–15515,6991151384 ± 1024.384 ± 0.069
195–20017,4281109370 ± 864.155 ± 0.141
Notes: Values = mean ± SE (n = 3). OTUs—Operational taxonomic units.
Disclaimer/Publisher’s Note: The statements, opinions and data contained in all publications are solely those of the individual author(s) and contributor(s) and not of MDPI and/or the editor(s). MDPI and/or the editor(s) disclaim responsibility for any injury to people or property resulting from any ideas, methods, instructions or products referred to in the content.

