Abstract
The ongoing decline of insect populations highlight the need for long-term ecological monitoring. As part of the “SLAM—Long Term Ecological Study of the Impacts of Climate Change on the Natural Forests of Azores” project, we investigated changes in arthropod diversity and community structure over a ten-year period (2012–2022) in the native forest of the island of Terceira (Azores). Focused on two arthropod assemblages (indigenous and non-indigenous species) monitored with SLAM traps, we asked if there was a distinguishable pattern in the diversity and structure of the studied arthropod subsets in a pristine island native forest. Species richness remained relatively constant. Endemic arthropods dominated and remained stable over time, indicating the forest’s ecological stability. In contrast, the assemblage of native non-endemic arthropods underwent changes, including increased hyperdominance and decreased biomass. The introduced arthropod assemblage showed more erratic dynamics driven by species turnover. Results suggested that temporal variation in each subset may be due to different ecological processes and that niche filtering may limit the establishment and spread of introduced arthropods. This research contributes to our understanding of the temporal dynamics of arthropods in native island forests and highlights the need for ongoing conservation efforts to protect these fragile ecosystems.
1. Introduction
Insect decline is currently well-recognized as a key challenge for both scientists and managers [1,2,3]. There is mounting scientific evidence that suggests that this decline in insect populations is caused by a combination of anthropogenic factors such as habitat loss, pesticide use, invasive species, climate change, and other human activities. Particularly relevant is the impact of exotic, potentially invasive species on islands where there is often a high degree of species endemism [4,5,6,7]. Indeed, the spread of species outside their native environment as a result of human activity is one of the major issues facing ecologists around the world [5,8,9]. The introduction of such species can have a negative impact on the existing indigenous species communities [10,11,12]. Among these alien species, some can become established, eventually causing severe and permanent changes to the newly occupied habitat [13,14].
Arthropods are the most diverse group of animals on Earth. They are also one of the most impacted groups. Given their diversity, arthropods are also responsible for providing the majority of ecosystem services to humankind [15,16,17]. Burns [18] developed a theoretical framework that adapts MacArthur and Wilson’s theory of island biogeography [19] to account for the distinctions between native and introduced species on islands. This framework was successfully tested on the Azorean islands [20]. Hence, monitoring arthropods on islands is crucial not only for detecting potential new invasive species but also for assessing habitat quality, evaluating the effectiveness of conservation efforts, gauging the impact of factors such as climate change and habitat loss, and assessing changes in ecosystem services [5,21].
Arthropods are known to have complex natural dynamics [22], with most species exhibiting irregular fluctuations. These temporal changes, resulting from the complex relationship between the effects of biotic and abiotic conditions on communities, are called “noise” [23]. While seasonal variation in community structure and composition is a complex area of research, several studies worldwide have examined seasonal patterns in arthropod taxa, with a predominant focus on arthropod conservation (see, e.g., [24,25,26]).
Long-term monitoring projects (LTER) are preferable for studying seasonal trends since biodiversity monitoring requires more than one-off surveys [3,27,28,29]. They also usually serve as useful tools for inferring the rate at which change occurs and for modeling predictions [30,31]. However, such projects can be difficult to implement in terms of cost, local political engagement, and human resources [32,33,34]. Moreover, standardizing the methodology is a crucial factor to consider while establishing LTERs, as it enables us to compare results across various habitats or regions, both locally and on a larger scale [21].
In the Azores, one of the most remote archipelagos [35], a long-term monitoring project focusing on arthropods has been ongoing since 2012 “SLAM—Long Term Ecological Study of the Impacts of Climate Change on the Natural Forests of Azores” [5,36,37,38,39]. Given the worldwide reports of a decline in insect populations [1,2,3], the primary objective of this project is to evaluate this phenomenon, investigate potential causes, and determine its consequences.
The archipelago is indeed experiencing the effects of global change, such as climate change [40], but also the spread of alien species [41], especially in the arthropod taxa.
In several studies, different aspects of indigenous and non-indigenous assemblages have been explored, resulting in a better understanding of the differences in their dynamics as well as some insights into the underlying process. A recent study by Borges and colleagues in 2020 [5] revealed that the arthropod communities on the island of Terceira had undergone a temporal change in composition. Although overall arthropod diversity did not decrease during the six-year monitoring period in the core native forest, significant changes were observed in the communities, largely driven by an increase in the beta diversity of exotic species (see also [20]). Prior research also focused on seasonal arthropod dynamics in the same forest [42]. Although it provided the first comprehensive analysis of the sampled results, this first publication on the SLAM project only offered a broad overview of the communities rather than conducting an extensive analysis of the differences between communities and their potential causes. Finally, before the start of the LTER program with which we are concerned, the team found that the richness of endemic species was mainly determined by abiotic factors (temperature, precipitation, and location) and that introduced species were more dependent on disturbance-related factors [43]. The study, however, did not account for spatial and temporal changes, including seasonal variations over multiple years, as it only focused on a single time period.
Therefore, the aim of the present study is to investigate differences in yearly trends and seasonality in diversity and community structure between indigenous (endemic and native non-endemic) and non-indigenous arthropods assemblages over a long time period (2012–2022). In addition, we are investigating for the first time the variability of biomass over time.
Based on a unique LTER dataset available for the island of Terceira for a ten-year period (“SLAM—Long Term Ecological Study of the Impacts of Climate Change on the Natural Forests of Azores”), consisting of arthropods collected seasonally in the core native forests [36,38,39], we assess two questions: (i) are there any discernible patterns in the diversity and structure of arthropod assemblages in native forests and (ii) are there differences between non-indigenous and indigenous subsets?
We predict that no trends will be observed in the native arthropod subsets due to the remarkable conservation status of Terceira Island’s native core forest. We also predict that the subsets of introduced arthropod species will show a more chaotic pattern as a result of the harsh conditions within the forest (environmental filtering). Finally, we expect that even if the overall species richness remained constant, the temporal variation differences between each assemblage would be based on different processes, and in particular, we expect a higher turnover in the introduced arthropod subset (see [5,20]).
2. Materials and Methods
2.1. Study Sites and Data Collection
The Azores are located in the North Atlantic, between 37°–40° latitude and 25°–32° longitude. The archipelago consists of 9 islands distributed along a 600 km stretch between Santa Maria (the easternmost island) and Flores (the westernmost).
The island of Terceira is the third largest of the Azores, with an area of 402 km2, and contains the largest area of pristine forest in the archipelago. These remnants of forest cover only 5.8% of the island [44].
The study was carried out in the framework of the EU-NETBIOME-ISLANDBIODIV project [45]. Since July 2012, ten plots (50 m × 50 m) have been established in the native forest. Each plot contains a SLAM (Sea, Land, and Air Malaise) trap, which is used for long-term monitoring. These traps are passive flight-intercept traps that can capture arthropods from all directions, measuring 110 × 110 × 110 cm [36]. The use of this type of trap is a suitable technique for long-term monitoring. However, previous studies have concluded that they capture only the most mobile part of the invertebrate fauna (see, for example, [5,20]). In addition, although SLAM traps are interception traps, they have also captured several taxa of flightless arthropods. This extension of their usual sampling range is a consequence of their installation. The positioning on the ground, the high structural complexity of the native forest, and the mounting system (with ropes) allow the usual ground-dwelling arthropods to be caught while using the trap to extend their dispersal capabilities (Figure 1). Within the monitoring framework of this study, this issue is considered a constant bias in the sampling. In fact, the SLAM traps were set in the same consistent conditions over the entire sampling period considered, so we assumed that the catch probability of the different taxa was also consistent over time. Each sample covers one season of the year as collection bottles were collected and changed every three months (March, June, September, and December).
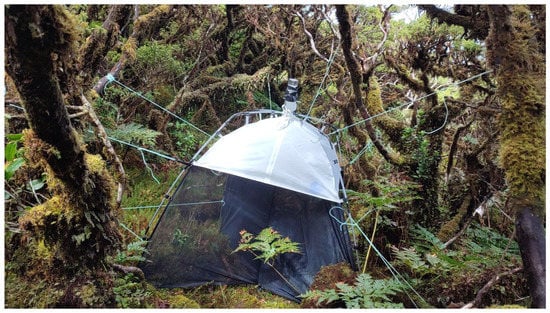
Figure 1.
A SLAM (Sea Land and Air Malaise) trap set at ground level in a patch of native forest. The ropes used to maintain the structure can be easily used by flightless arthropods as extensions of tree branches to navigate within the complex structure of the forest. Ground-dwelling arthropods can also reach the sample bottle by climbing along the SLAM structure. Credit: Sébastien Lhoumeau.
The arthropods were first sorted into morphospecies by students working as para taxonomists, followed by identification to species level by one of the authors (P.A.V.B.). To reduce the time spent on this part, we focused our identification on target groups: Diplopoda (Chordeumatida, Julida), Chilopoda (Geophilomorpha, Lithobiomorpha, Scolopendromorpha), Arachnida (Araneae, Opiliones, Pseudoscorpiones), and Insecta (Blattaria, Coleoptera, Hemiptera, Microcoryphia, Neuroptera, Psocodea, Thysanoptera, Trichoptera, Hymenoptera Formicidae). We then classified them according to their biogeographical origin: endemic (restricted to the Azores), native non-endemic (species that arrived naturally and have a distribution wider than the archipelago), and introduced (species with an original distribution that did not include the Azores before human settlement in the 15th century) based on the last checklist of Azorean arthropods [46]. The first two categories will be grouped together in the following as indigenous, while the latter will also be referred to as non-indigenous. We considered total abundance by species (sum of adult and juvenile abundance), except for the biomass trend where only adults were considered, as allometric equations only exist for adults.
Finally, for each species, we used previously collected adult body size data (see, e.g., [47,48]).
All materials are kept at EDTP—Entomoteca Dalberto Teixeira Pombo, University of the Azores, Angra do Heroismo, Portugal. See [36,38,39] for all data collected with this sampling protocol and a more detailed sampling methodology (including maps).
2.2. Data Analysis
Statistical analyses were performed in the R programming environment [49] using the packages openair [50], Kendall [51], sads [52], gambin [53], and BAT [54]. The calculation of alpha diversity indices was performed in the JULIA programming environment [55], based on the formulas in [56].
2.2.1. Data Selection
This study uses long-term arthropod data sampled between July 2012 (summer season) and June 2022 (spring season) on the island of Terceira (Azores archipelago, Portugal). All data are available in the following publications [36,38,39]. Prior to the analysis, we needed to perform a data curation because not all of the available data corresponded to our research questions. For technical reasons, some sampling events represented a larger time frame than the originally designed 90 days. Therefore, all sampling events less than 70 days or greater than 110 days were discarded from the study. Arthropod species abundances were normalized to 90 days using the following Equation (1). This data set is referred to hereafter as the raw data set.
Finally, not all seasons had the same number of sampling events, i.e., not all of the ten sites were available for each season, with a minimum of three sites being sampled in autumn 2020. For a more balanced sampling design, we randomly selected three sites for each of the 35 seasons. For each season, we averaged the normalized abundances by repeating this process 1000 times. We then split the data set according to species’ colonization status origin. This data set is referred to hereafter as randomized data set.
2.2.2. Alpha and Beta Diversity
We used this dataset to calculate time series of α-diversity according to the Hill series (H0, H1, and H2) [56] and pairwise partition β-diversity according to the partitioning of β cc (dissimilarity in terms of the Sørensen index) into two additive fractions, β-3 (dissimilarity due to species replacement) plus β rich (dissimilarity due to richness differences) [54,57] between successive years and between successive seasons within years. In the case of the between-year analysis, we removed the two extreme years of the time interval (i.e., 2012 and 2022) because not all seasons were sampled. Therefore, we only considered years for which at least three seasons were available.
Analysis of the trend in α diversity was performed with Theil–Sen slope estimates and uncertainties corrected for seasonal data and autocorrelation. We used the TheilSen function in the openair R package. The p-value and all uncertainties are calculated automatically from bootstrap simulations.
We calculated the absolute deviation from the mean of a given Hill number within a given arthropod subset in order to examine the temporal change in the seasonality of the Hill series. Therefore, for a given value, we calculated the absolute deviation from the mean using Formula (2). The statistical significance of the trends was computed using Mann–Kendall tests. This is a test for a monotonic trend in a time series z(t) that is based on the Kendall rank correlation of z(t) and t. We use the function cor.test from the stats package in R [49].
Differences in β diversity between all eight years were tested using the Kruskall–Wallis test and between consecutive seasons using the Wilcoxon rank sum test. We also tested the seasonal differences within assemblages using Wilcoxon ran sum test. These tests were performed for the total β-diversity and within the two parts of its decomposition. p-values were adjusted using the Bonferonni method.
2.2.3. GamBin Time Series
We considered the normalized data set between 2013 and 2021, grouped by year. Using fit_abundances from the gambin R package, we then fitted a GamBin model for each of the subsets (endemic, native non-endemic, and introduced) and for the whole community. [53,58].
The GamBin model is a statistical approach aimed at characterizing the geometry of the species abundance distribution curve. The justification for its use lies in its simplicity of parameterization, requiring only a single alpha parameter to describe the curvature of the distribution.
The significance of the trend in the time series was tested using Mann–Kendall tests. We used the Mann–Kendall function from the Kendall R package. The differences within all subsets were tested using a Kruskall–Wallis rank sum test, and comparisons between subsets were performed using a Wilcoxon rank sum exact test.
2.2.4. Rare Species Accumulation and Hyper-Dominance
We used the raw data set to focus on species that are rarely found and those that are among the most dominant in the samples between 2012 and 2022.
We classified species as ‘rare’ if their total abundance was equal to or less than 40 individuals over the 10 years (i.e., the species was sampled at most once per season). We computed the accumulation curves of such rare species over the ten years regarding their colonization status.
Following similar studies focused on hyper-dominance analysis [59,60], we then ranked the total abundance of species per year and classified them as ‘hyper-dominant’, those species that accounted for at least 50% of the total abundance. For each of the hyper-dominant species, we used the randomized data set and compiled their annual abundance, and tested the trend of the time series using Mann–Kendall tests.
2.2.5. Biomass
Adult biomass data were processed according to the allometric regression of weight on body length for each species (see Equation (3) taken from [61]). The raw data set for adult species was used for this analysis.
Estimates of parameters a and b were taken from [61] and varied according to the lowest taxonomic information for which data were available. If no data were available for a given taxon, the general estimation developed in [62] was used.
We then cumulated the total weight of a given subset (i.e., endemic, native non-endemic, and introduced) according to the number of individuals to obtain a seasonal time series of biomass between 2012 and 2022. In a similar way to the analysis of the α-diversity, the slopes, and uncertainties were derived according to Theil–Sen with a correction for the seasonality in the data.
3. Results
We sampled arthropods in the core native forest of Terceira Island from July 2012 to June 2022 for a total of 38 sampled seasons. Even though we set ten SLAM traps, we did not manage to collect them every season. On average, we collected 7.89 sites every season, with a maximum of ten and a minimum of three in autumn 2020. The median number of days per sampling period per site is 91 days.
Overall, 52,655 specimens from 187 morphospecies were sampled, representing 19 orders and 77 families. A total of 30 889 specimens (59%) of 35 (19%) morphospecies were endemic. A total of 19 843 (38%) of 57 (30%) morphospecies were native non-endemic, and a total of 1598 (3%) of 66 (35%) morphospecies were introduced. Moreover, 325 specimens (0.6%) of 29 (15%) morphospecies could not be assigned to any group and were excluded from the analysis.
3.1. Temporal Trend in Alpha and Beta Diversity
3.1.1. Alpha Diversity
All alpha diversity indices had seasonal variations between July 2012 and June 2022.
Species richness (H0) was higher within the indigenous arthropod assemblage than for non-indigenous. In particular, endemic arthropod species richness is followed by native non-endemic and introduced arthropods. Considering the global community, we observed a peak of richness in the summer season, while the lowest species richness was sampled in winter (Figure 2A). This temporal pattern was similar for all subsets, and no statistically significant temporal trends were found (Figure 2B–D).
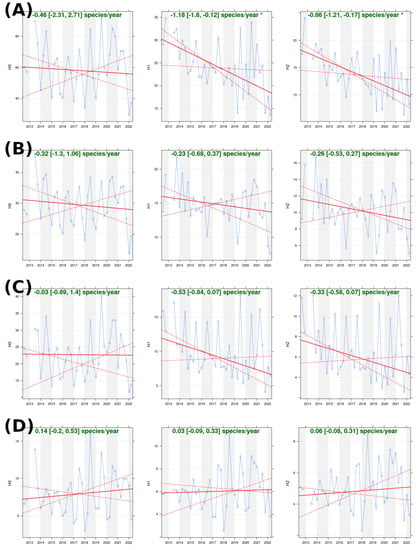
Figure 2.
Time series of alpha diversity (Hill numbers H0, H1, and H2) for the total community (A), the endemic arthropod subset (B), the native non-endemic arthropod subset (C), and the non-indigenous arthropod subset (D). Slope estimation (plain line) is displayed with a 95% confidence interval and statistical significance (p < 0.05 = *). The confidence interval boundaries are shown as dashed lines.
The exponential Shannon index (H1) showed a slightly significant decrease (Figure 2A) with an estimated negative slope of −1.18 [−1.8; −0.12] species per year (p-value < 0.05). As this index is given as the effective number of rare species within an assemblage, we then found a decrease in rare species when all arthropod species were pooled. However, when the global community was divided according to the biogeographical origin, no statistically significant trend was found (Figure 2B–D). Interestingly, a different temporal pattern was observed in the indigenous arthropod subsets between endemic and non-endemic subsets. In particular, peaks of this index occur in two different seasons, with an earlier summer peak in the native non-endemic assemblage (Figure 2C), followed by a later peak in the endemic assemblage (Figure 2B). Therefore, the number of rare non-endemic species was higher in summer, while autumn had more rare endemic species. Finally, the non-indigenous assemblage had a peak of H1 in the autumn, which means that it was mainly during this season that rare introduced species were sampled.
The inverse Simpson index (H2) displayed the same global trend as H1, with an overall decrease of −0.86 [−1.21; −0.17] species per year (p-value > 0.05). The construction of this index reflects the effective number of abundant species. Therefore, an overall decrease in this index could indicate either a decrease in the abundance of all species over time or an increase in the abundance of some species while others decrease in abundance (i.e., an increase in hyperdominance over time). However, this temporal trend was only observed when considering the entire arthropod community. When separated by colonization status origin, no statistically significant temporal trend was found.
Therefore, the alpha diversity of arthropod assemblages in native forests varied seasonally. No change in species richness was observed over the ten years of sampling, and a slow, statistically significant decrease in total abundance was observed. Seasonal variation appeared to occur at two different times for endemic and native non-endemic species. Non-indigenous arthropod assemblage might show an increase in the seasonal variance of the richness and abundance (Figure 2D), but we did not test this hypothesis.
Regarding the time series of the absolute deviation from the mean of Hill numbers (Figure 3), we found that only the non-indigenous subset showed a consistent and statistically significant increasing trend for H1 (Kendall’s rank correlation, n = 38, Ƭ = 0.35, p-value = 0.0015) and H2 (Kendall’s rank correlation, n = 38, Ƭ = 0.36, p-value = 0.0013). No other temporal trends were found to be statistically significant.
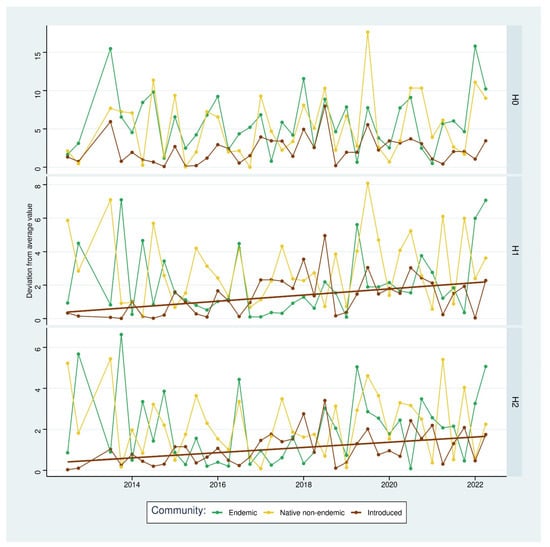
Figure 3.
Time series of the absolute deviation from mean values of alpha diversity (Hill numbers H0, H1, and H2) for the endemic arthropod subset, the native non-endemic arthropod subset, and the non-indigenous arthropod subset. The solid lines represent a significant temporal trend for a subset.
3.1.2. Beta Diversity
The temporal beta diversity shows a similar pattern between 2012 and 2021 (Figure 4). The global community had a low beta diversity, with a maximum value of 0.33 recorded when comparing 2017 and 2018. The global mean beta diversity was found to be equal to 0.28, which is an indication of a relatively stable global community species composition.
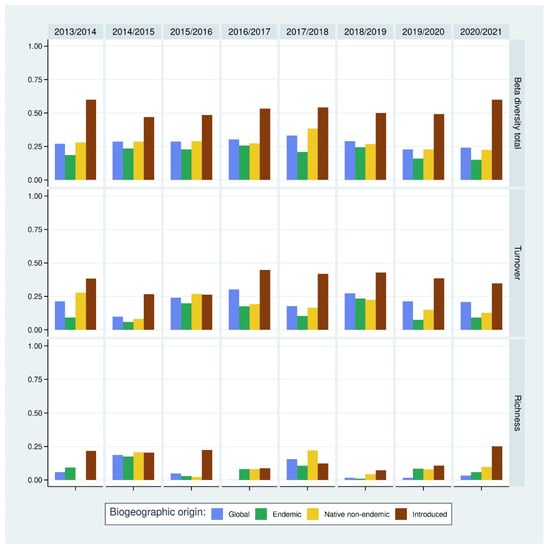
Figure 4.
Temporal beta diversity between successive years (total value and its decomposition between turnover contribution and richness contribution) according to the Sorensen index. Statistical tests for significance (Wilcoxon pairwise tests) are available in Supplementary Material Table S1.
When the global community was split by colonization status origin, we found a statistically highly significant greater beta diversity for the non-indigenous assemblage compared to the indigenous subsets (statistics in Supplementary Material Table S1). Within the indigenous assemblages, the endemic subset showed lower beta diversity compared to the native non-endemic subset (Wilcoxon rank sum test, U = 7, d.f. = 7, adj. p-value = 0.042). In both of these assemblages, beta diversity values were low, which means that these assemblages are stable in terms of species composition between years.
Considering the decomposition of beta diversity, we found that most of the beta diversity was related to species turnover, except for the comparison between 2014/2015 and 2017/2018, where the richness difference component was higher. Comparisons between subsets and beta decomposition showed no statistically significant difference in richness decomposition and a statistically significantly higher proportion of species turnover for non-indigenous arthropod assemblage. Within indigenous assemblages, we found no difference in species turnover (Wilcoxon rank sum test, U = 18, d.f. = 7, adj. p-value = 0.966).
Considering the temporal beta diversity between the following seasons (Figure 5), we found an overall value greater than 0.58 with a mean of 0.65. Within the global community, the differences in species richness were found to be higher comparing the following seasons, except for the comparison between summer and autumn. For all the subsets, these values are higher than the values of the comparisons between years, which showed that they had more intra-annual (seasonal) diversity variations than inter-annual diversity variations.
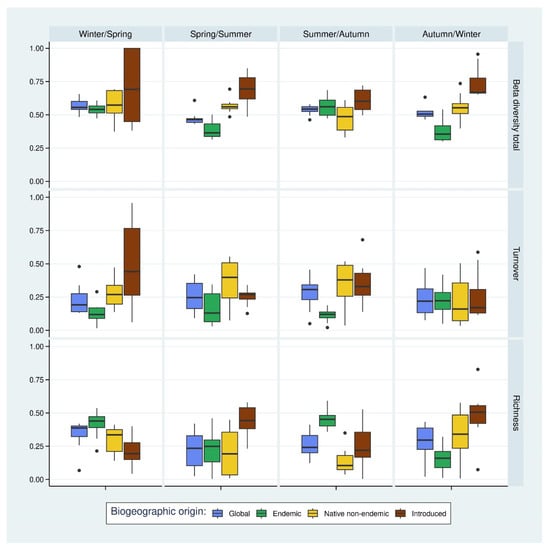
Figure 5.
Temporal beta diversity between successive seasons (total value and its decomposition between turnover contribution and richness contribution) according to the Sorensen index. Statistical tests for significance (Wilcoxon pairwise tests) are available in Supplementary Material Table S1.
Within the endemic arthropod subset, temporal beta diversity between seasons was low (average value of 0.54) and, in particular, significantly lower between spring and summer (0.45) compared to other subsets and between autumn and winter (0.44) compared to the non-indigenous subset. This assemblage had two peaks in beta diversity (between winter and spring and between summer and autumn), and these peaks were associated with a similar increase in the richness component of the decomposition. The turnover component did not show this seasonal variation. We also noticed that the variances of the values (which can be approximated by the size of the box plots) are rather low, which is an argument for the stability of the variations of the beta diversity within this assemblage during the study.
In the decomposition of the value, the turnover part was found to have an average of 0.42, and the richness part had an average of 0.12. Species turnover was only significantly lower than the non-indigenous subset between summer and autumn. All the other comparisons were non-statistically significant. Similarly, between summer and autumn, the richness component was significantly different from the non-endemic subset.
On the other hand, the native non-endemic subset showed no such pattern in beta diversity between seasons. Considering the overall value, the average was 0.63 and was fairly constant throughout the pair of seasons compared. Only a barely significant difference was observed in the richness decomposition comparing winter/spring and summer/autumn seasons, with lower values between summer and autumn.
With the exception of the autumn/winter comparison, the turnover component of the decomposition was higher, with an average of 0.39 compared to an average of 0.24 for the richness component. Compared to the non-indigenous arthropod assemblage, no differences were found statistically significant, meaning that these two subsets had rather similar temporal variations of beta diversity (and its decomposition).
Finally, similar to the comparisons between years, the non-indigenous arthropod subset showed a higher beta diversity with a mean value of 0.79, split between a mean of 0.38 for the turnover component and a mean of 0.41 for the richness component. Only the richness component seemed to have a temporal pattern of variation between seasons, with two peaks between spring and summer and between autumn and winter. This pattern was also less pronounced in the total value.
3.2. GamBin Alpha Time Series
We calculated the GamBin alpha value by combining all seasons of a given year (Figure 6). No assemblages showed a temporal trend between 2013 and 2021, as Mann–Kendall trend tests were not found to be statistically significant (summary of statistics in Supplementary Materials Table S2). We found an overall mean alpha value of 1.25.
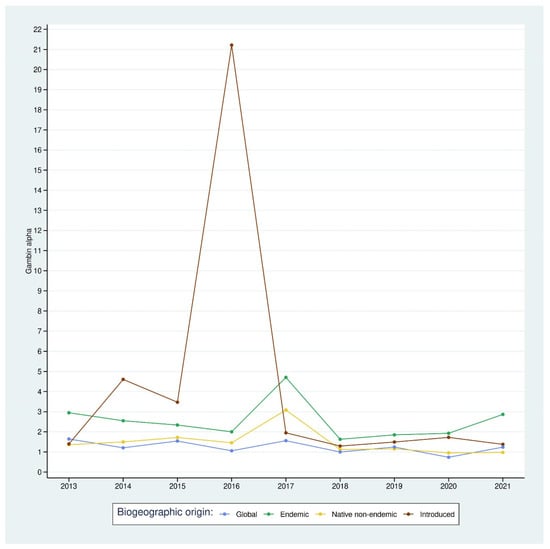
Figure 6.
Time series of Alpha GamBin value for each subset and the overall arthropod community.
However, alpha GamBin values were statistically different between subsets (Kruskall–Wallis, n = 27, K = 8.62, d.f. = 2, p-value = 0.01). When all arthropods were pooled together, the community had a more log-series shape than when we separated them according to their colonization status origin.
The introduced arthropod subset showed the highest value, with an average of 4.28. This was statistically significantly different from the native non-endemic subset (mean alpha GamBin of 1.48, Wilcoxon rank sum exact test, U = 63, p-value = 0.05) but not from the endemic subset (mean of 2.53, Wilcoxon rank sum exact test, U = 52, p-value = 0.34). The difference between the native non-endemic subset and the endemic assemblage was also statistically significant (Wilcoxon rank sum exact test, U = 72, p-value = 0.004), showing that within the indigenous assemblages, the endemic subset had a more log-normal shape.
We observed that the introduced subset had a higher alpha value between 2013 and 2017 than between 2017 and 2021, which means that this assemblage had a more log-normal shape during the first years of the monitoring program. However, this observation needs to be related to the species richness of the assemblage. Figure 2D shows that during the first period (2012–2017), the species richness was low, and these subsets tended to have a higher alpha GamBin value as a result of the fitting process. After this period, we observed a gradual (but not statistically significant) increase in species richness and abundance. This fact could have caused the fitting process of the GamBin model to show a lower alpha value, describing a log-series distribution of species richness.
3.3. Rare and Hyper-Dominant Species
The accumulation of rare species showed an overall increase over time (Figure 7). This increase is mainly due to the increase in both introduced and native non-endemic rare species, as the accumulation of endemic, rare species showed a plateau after the first two years of sampling. We reached a total of 137 rare species in 2022 (73% of the sampled species), of which 15 were endemic, 38 native non-endemic, and 59 were introduced. The lines show that the graph can be divided into two parts: the increase in the first two years was due to the start of the monitoring and, therefore, the accumulation of species that are naturally rare in the native forest. After this period, the increase could be attributed to the arrival of new species, especially in the non-indigenous assemblage.
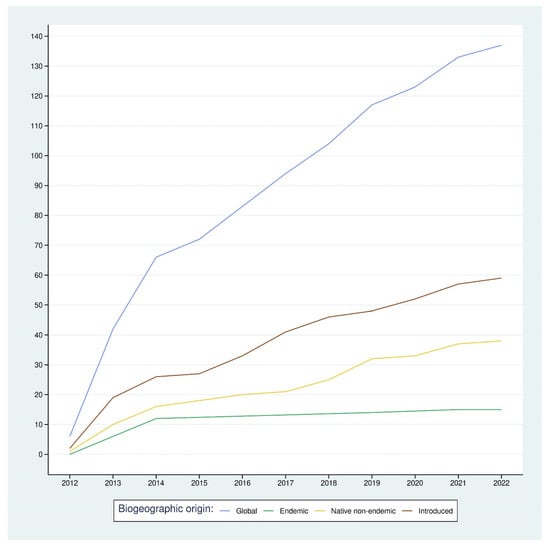
Figure 7.
Accumulation of rare species with time within the different subsets and the overall arthropod community.
In terms of hyper-dominant species, we found ten species that met our selection criterion (Figure 8). The majority of these were endemic (six species). We also recorded three native non-endemic species and one introduced species. The true endemic bug Cixius azoterceirae Remane and Asche, 1979 and the native non-endemic harvestman Leiobunum blackwalli Maede, 1861 were particularly abundant and can be considered the dominant indigenous species in the native forest based on SLAM traps sampling effectiveness. The non-indigenous centipede Ommatoilus moreleti (Lucas, 1860) only met our hyper-dominance selection criterion in the last year of sampling due to a large and sudden increase in abundance. Prior to this, however, its abundance within the non-indigenous assemblage was rather low.
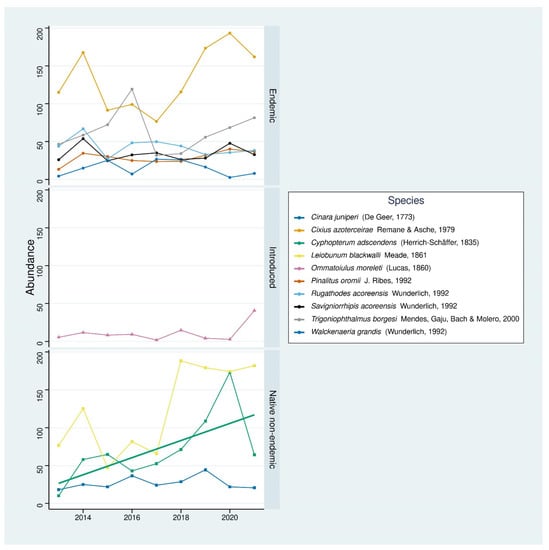
Figure 8.
Time series of the hyper-dominant species. The solid line represents a significant temporal trend for a species.
The temporal trend was only slightly statistically significant for the native non-endemic true bug Cypthopterum adscendens (Herrich–Schäffer, 1835) (Mann–Kendall trend test, Ƭ = 0.56, p-value = 0.047) (Figure 8).
3.4. Temporal Extent of Introduced Species Sampled
To better understand the temporal dynamics of the non-indigenous arthropod assemblage, we compiled the detection period for all introduced species recorded during the monitoring program (Figure 9). We observed that three orders (Coleoptera n = 28, Araneae n = 12, and Hemiptera n = 9) dominate the non-indigenous arthropod subset within our dataset.
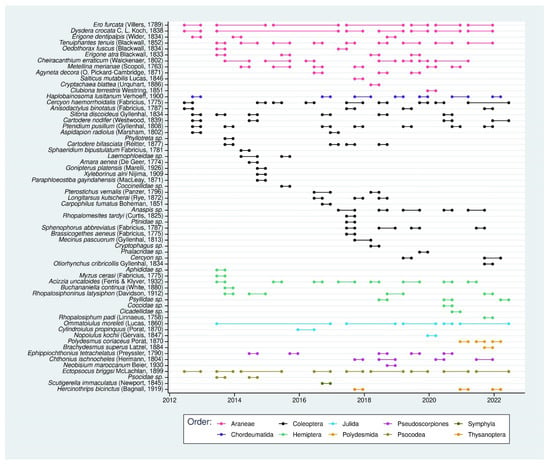
Figure 9.
Temporal detection range of non-indigenous species sampled between July 2012 and June 2022.
The graph is relevant for the visualization of the turnover of the non-indigenous species. We observed that this phenomenon is more important within Coleoptera, where numerous species (n = 15) are detected only once in ten years of sampling. On the other hand, Araneae had a lower turnover. Only three of the 12 species were recorded only once. The four continuously recorded species could be considered as truly established in the native forest. We found two Araneae (Ero furcata (Villers, 1789) and Dysdera crocata C. L. Koch, 1838), one Julida (Ommatoiulus moreleti (Lucas, 1860)) and one Psocodea (Ectopscocus briggsi McLachlan, 1899). Finally, it could also provide information on species that need special attention, as some of them showed an increase in frequency when they were detected. (See, for example, Cercyon haemorrhoidalis (Fabricius, 1775) or Acizzia uncatoides (Ferris and Klyver, 1932)). These species might be in the process of becoming established.
3.5. Biomass Time Series
When all the subsets were considered together, we did not find any statistically significant temporal trend within the cumulative biomass (Figure 10). However, they did show significant seasonal variations that were related to the seasonal differences in species richness and abundance (Figure 2). The peaks of high cumulative biomass were recorded in summer. The lowest cumulative biomass occurred in winter.
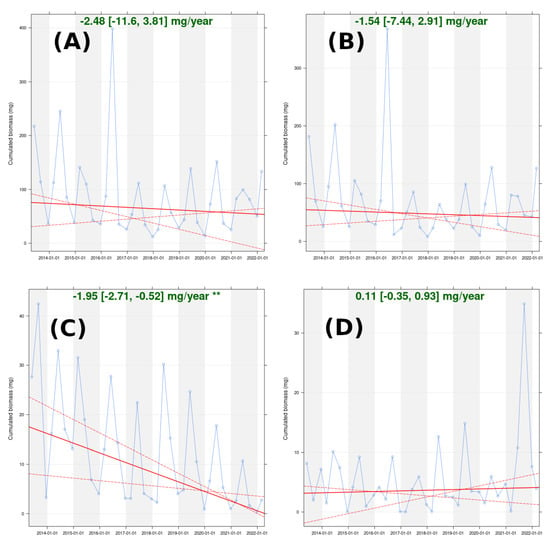
Figure 10.
Time series of cumulated biomass within the global arthropod community (A), endemic arthropod subset (B), native non-endemic subset (C), and introduced arthropod subset (D). Slope estimation (plain line) is displayed with 95% confidence interval and statistical significance (p < 0.05 = **). The confidence interval boundaries are shown as dashed lines.
It is interesting to note that despite the turnover of species observed in the non-indigenous subset (Figure 4, Figure 5 and Figure 9), the temporal trend of the cumulative biomass was still not statistically significant. In addition, the abundance of introduced species (Figure 2D, H1, and H2) did not show any trend over time. Thus, in terms of body size, the species involved in this turnover phenomenon were rather similar. Similar to what we observed for species richness and abundance in Figure 2D, we observed an increase in the temporal variance of cumulative biomass. However, we did not verify this hypothesis.
Within the indigenous assemblage, we detected different trajectories between the endemic arthropods and the native, non-endemic arthropods. The endemic subset did not show a statistically significant temporal trend in cumulative biomass. Conversely, the native non-endemic subset showed a significant decrease from 2013 to 2022, despite regular seasonal peaks. Furthermore, at the end of the study period, this decreasing trend did not seem to reach a plateau, which means that it might still be occurring. With regard to our other results, this trend may have been due to substitution between large species and smaller species (see the annual species turnover in the subset in Figure 4, the increase in rare species in Figure 7, and the increase in dominance by C. adscencens in Figure 8).
4. Discussion
Using standardised methodological protocols, we investigated patterns of temporal variation in arthropod diversity and community structure in a pristine forest on the island of Terceira. Our results showed different temporal trajectories over the 10 years of sampling for the three assemblages considered (endemic, native non-endemic, and introduced arthropods).
Therefore, the first hypothesis was partially confirmed as we found that endemic arthropods dominated the overall assemblage and were stable over time, but native non-endemic arthropods showed a change in community structure. There was an increase in hyperdominant species and a decrease in the biomass of this assemblage.
In addition, as we expected, the introduced arthropod assemblage remained marginal and showed more chaotic temporal dynamics, mainly driven by species turnover.
Finally, our assumption about species richness was also validated by the results. Overall, species richness remained relatively constant over time, as indicated by the lack of significant trends in cumulative species richness and no changes in the deviation from the mean value for each subset. Findings suggest that the temporal variation differences between each assemblage may be based on different ecological processes, such as seasonal variations, turnover of species, and changes in dominance by certain species.
4.1. Dynamics of Endemic Arthropods Reflect the Stability of Terceira’s Pristine Forest over Times
Based on the results, there is evidence to suggest that the dynamics of endemic arthropods in Terceira’s native forest may reflect the stability of the forest over time. The finding that the arthropod assemblage was dominated by endemic species, and no net decline in this assemblage over time, indicated that the forest ecosystem was relatively stable and able to support these species. This result is consistent with several other studies carried out in recent years [5,63,64,65,66,67].
This is a very positive signal for the conservation status of this habitat. Similar to other long-term works, our study found no net decline within this assemblage [68,69]. The stability of endemic arthropods over time, as indicated by their consistent cumulative biomass and abundance, emphasizes their ecological importance in native forests.
Endemic arthropods play a crucial role in native ecosystems as they have co-evolved with their environment and are adapted to specific ecological niches [70,71,72]. In particular, variations in species richness and abundance of individuals are known to be closely linked to climatic variations, especially seasonal temperature changes [24,25,42,43,73].
It is likely that environmental stability is one of the factors contributing to the stability of endemic arthropod populations over time in Terceira’s native forest. Endemic species have evolved over time to adapt to specific environmental conditions and may be better able to cope with natural fluctuations in the environment. If the environment remains relatively stable over time, it is possible that these species may be able to maintain their populations and ecological functions.
However, it is important to note that stability can also be influenced by a number of other factors, such as interspecific interactions [74,75], disturbances [76,77], and human activities [78]. In addition, ecological stability remains a complex concept due to its multidimensional aspect [79,80].
Finally, even if the trend within the endemic subset has not shown a direction, we can still argue that intensive conservation efforts need to continue. Terceira’s pristine forests are small and critical patches, as even minor disturbances are likely to have irreversible effects on the services provided by this ecosystem. Moreover, climatic changes are predicted to have a future impact on Azorean native forests, with higher impacts in low dispersive species [73,81]. Those climatic changes may imply a change in the design of protected areas that include the current pristine forest [82].
4.2. Native Non-Endemic Arthropod Assemblage Change Due to Habitat Specialisation
The observed decrease in the cumulative biomass of native non-endemic arthropods, as well as a potential increase in the hyperdominance of some species, combined with an increase in rare species over time, highlighted changes in the community structure during the sampling period. This decrease suggests that some species may be facing population declines (see also our previous work [5]). This is unlikely to be related to changes in the environment, as the endemic subset did not show this trend. Despite this, some may argue that habitat disturbances could impact native non-endemic species more severely than endemic species. This is because the degree of habitat specialization for non-endemic species is likely to be lower than that of endemic species due to their evolution on the island, making them less adaptable to changes in their habitat [83,84].
This potential higher specialization in particular conditions (particularly temperature and humidity) can explain the observed asynchrony between the two indigenous arthropod subsets. Native non-endemic arthropods showed later peaks than endemic arthropods, suggesting they needed precise ecological context for their development. This time-lagged response to biotic and abiotic natural variability may make them more vulnerable to community changes in the context of accelerating variability as a consequence of global change [44,85,86]. One of the effects of climate change at the community level is indeed a change in the biomass quantity [10]. On the other hand, if continuous over time, asynchrony in species richness has also been shown to promote overall ecosystem stability ([87] but see [88]). However, it is also likely that the observed asynchrony within the indigenous assemblages is the result of other factors, such as inter-specific interactions. In an undisturbed ecosystem, the persistence and resilience of a community are often linked to species richness and community structure [89,90,91]. This global pattern is a consequence of the network of direct and indirect interactions between species and the functional redundancy that may exist in a species-rich community [92,93].
It is plausible to argue that the native habitats may have undergone changes during the 10-year sampling period. Despite being under significant protection, Azorean native forest areas are not immune to the effects of external factors such as the introduction and spread of particular species, climate change, or other disturbances that could affect the diversity and structure of the assemblage. These changes can influence how species interact with each other and with their environment [11,94,95]. One of the consequences may be the increase in hyper-dominance we observed. Through cascading changes within the network of interactions, this increase in richness reduces the resources available to other species that influence the local and global community in terms of richness, leading to an increase in rare species.
Finally, the assessment of the colonization status of each species based on expert knowledge is not free of errors. Indeed, a recent study conducted in the Canary Islands, based on DNA analysis, has shown that some species previously classified as indigenous to the region belong to the non-indigenous subset [96].
Disentangling species’ biogeographic and colonization status origins are complex, and phylogeography is a relatively new discipline [97,98]. However, with the rapid development of genetic analysis and shared and public databases, we are now able to address this challenge using a standardized protocol [99,100]. We used expert knowledge and assessment to categorize species in our study rather than genomic information. Recognizing this potential vulnerability, we are now aware of the need to confirm these classifications using molecular analysis.
4.3. Niche Filtering Prevent Non-Indigenous Arthropods to Establish
The lack of significant temporal trends in the cumulative biomass richness and abundance of introduced species, as well as the high species turnover, suggest a potential resistance to colonization and establishment by non-indigenous arthropods within the Terceira’s native forest. However, the observation of an increase in the absolute deviation around the mean abundance argues for an increase in the pressure of this assemblage.
This finding could be discussed in the framework of niche filtering [101], which may act as a barrier to the establishment of non-indigenous species in native forests. The potential mechanisms underlying this resistance and limiting their ability to establish and spread are numerous [102]. They include the lack of suitable habitat due to differences in climatic conditions, the negative interactions with the indigenous such as competition for resources such as food, water, and shelter or predation and parasitism, as well as the lack of mutualistic relationships. Finally, it can also be a consequence of the human management of the area. Management activities, such as the removal of introduced species or active restoration of native habitats in the surroundings, may limit the establishment and spread of introduced species.
It is often assumed that species-rich communities are less likely to be invaded than less rich communities, as proposed by the so-called biotic resistance hypothesis [43,103,104]. It is also known that species distributions are influenced by gradients in climatic conditions [105,106]. Therefore, it can be argued that due to the unique and harsh abiotic conditions of these pristine forests [42,107], it is likely that introduced arthropods may have difficulty establishing due to a lack of adaptation. Introduced species may not possess the traits necessary to perform well in this environment [108]. Such differential sensitivity to invasion as a consequence of biotic and abiotic conditions has already been found in some habitats, such as subterranean ecosystems [109]. In addition, when studying ant communities on islands, Latombe and colleagues found that Atlantic islands have harsher conditions to which native ants are likely well adapted, limiting the establishment of exotic ants [110].
Poorly explored considering multi-taxa arthropod meta-community, this niche filtering is the most likely explanation of the observed turnover. We observed that there were differences between warm seasons (summer and autumn) and cold seasons (winter and spring), with warm seasons having a more diverse and abundant introduced arthropod assemblage. This result is also supported by the greater value of the richness differences component of beta diversity between spring and summer and autumn and winter. These findings are consistent with our hypothesis that niche filtering may limit the establishment and spread of exotic species. Indeed, warm seasons are both the richest and the most suitable seasons (in terms of abiotic conditions) for arthropods, whereas cold seasons are the opposite for both parts of the ecosystem [42].
However, the question remains whether it is the biotic interactions or the abiotic conditions (or a combination of both) that are the most important factor allowing the native Azorean forests to resist the invasion of introduced arthropod species.
The results of our study also suggest that there is a source-sink dynamic of exotic arthropod species on Terceira. Native forests may act as a sink, while the surrounding environment (mainly pastures or exotic forests) may act as a source of such species. Indeed, the richness of introduced arthropod species has been shown to depend on disturbance [43]. This constant pressure from the surrounding matrix was clearly evident during the sampling period, as we observed an increase in rare introduced species and an increase in the absolute deviation from a constant mean for the abundance of introduced species. Looking at the species level of the introduced assemblage, we observed different patterns of detection across the time series. These patterns ranged from regular detection throughout the period to single detection events. Gaps in the time series should be treated with caution and as periods of non-detection. Four hypotheses can explain this lack of detection: (i) the SLAM traps are not fully adapted to catch the species, (ii) the species was not sufficiently abundant in the native forest to be successfully caught by the trap, (iii) the species is absent from the plot area, but not from the native forest, or (iv) the species was actually absent during this period, with the records being the consequence of (multiple) introductions and disappearance events in the native forest. Interestingly, spiders tended to show a more regular pattern of detection, maybe as a consequence of a greater dispersal ability with behaviors such as ballooning [111,112].
5. Conclusions
We investigated a ten-year temporal variation of arthropod diversity and community structure in a native forest on the island of Terceira. The results showed different temporal trajectories. Endemic arthropods dominated the total assemblage and were stable over time, which may be related to environmental stability and their co-evolution with the environment. Native non-endemic arthropods showed a change in community structure, probably in response to greater sensitivity to small changes in habitat. Introduced arthropods remained marginal and showed more chaotic temporal dynamics, but need to be considered carefully as the pressure of this assemblage on Terceira’s native forest increases over time, even though this particular habitat is likely to be resistant for now to arthropod introductions. Nevertheless, the presence of bias in accurately identifying the native non-endemic status of species could suggest that certain exotic species, currently classified as native non-endemic, have already become firmly established.
Further research development would be to investigate the use of advanced computational methods in combination with mechanistic approaches to population dynamics modeling. This could potentially lead to more accurate and robust models that can better predict and manage population change, particularly in the context of complex and dynamic ecological systems. In addition, the incorporation of new data into these models can improve their reliability and validity and help inform policy decisions related to wildlife conservation and management.
Supplementary Materials
The following supporting information can be downloaded at: https://www.mdpi.com/article/10.3390/d15060753/s1, Table S1: Summary Wilcoxon tests of Beta diversity; Table S2: Summary Mann–Kendall trend tests of GamBin alpha value.
Author Contributions
S.L.: investigation, data curation, formal analysis, visualization, and writing—original draft. P.A.V.B.: conceptualization, methodology, investigation, supervision, funding acquisition, data curation, and writing—review and editing. All authors have read and agreed to the published version of the manuscript.
Funding
Funding for traps and fieldwork: EU-FCT-NETBIOME –ISLANDBIODIV grant 0003/2011 (between 2012 and 2015); Portuguese National Funds, through FCT—Fundação para a Ciência e Tecnologia, within the project UID/BIA/00329/2013-2020; Direcção Regional do Ambiente—PRIBES (LIFE17 IPE/PT/000010) (2019); Direcção Regional do Ambiente—LIFE-BETTLES (LIFE18 NAT_PT_000864) (2020); AZORESBIOPORTAL—PORBIOTA (ACORES-01-0145-FEDER-000072) (2019); (FCT)—MACRISK-Trait-based prediction of extinction risk and invasiveness for Northern Macaronesian arthropods (FCT-PTDC/BIA-CBI/0625/2021) (2021–2022). Data curation of this manuscript was supported by the project MACRISK-Trait-based prediction of extinction risk and invasiveness for Northern Macaronesian arthropods (FCT-PTDC/BIA-CBI/0625/2021). S.L. is funded by the Azorean Government Ph.D. grant numbers M3.1.a/F/012/2022. P.A.V.B. is currently funded by the projects Azores DRCT Pluriannual Funding (M1.1.A/INFRAEST CIENT/001/2022) and FCT—Fundação para a Ciência e Tecnologia FCT-UIDB/00329/2020-2024 (Thematic Line 1—integrated ecological assessment of environmental change on biodiversity).
Institutional Review Board Statement
Not applicable.
Data Availability Statement
Data used in this study were obtained from the literature, which was cited in the text and provided in the reference section.
Acknowledgments
A large number of students (many of them financed by the EU Program ERASMUS) sorted the samples prior to species assignment by one of us (PAVB), and we are grateful to all of them.
Conflicts of Interest
The authors declare no conflict of interest.
References
- Cardoso, P.; Barton, P.S.; Birkhofer, K.; Chichorro, F.; Deacon, C.; Fartmann, T.; Fukushima, C.S.; Gaigher, R.; Habel, J.C.; Hallmann, C.A.; et al. Scientists’ Warning to Humanity on Insect Extinctions. Biol. Conserv. 2020, 242, 108426. [Google Scholar] [CrossRef]
- Harvey, J.A.; Tougeron, K.; Gols, R.; Heinen, R.; Abarca, M.; Abram, P.K.; Basset, Y.; Berg, M.; Boggs, C.; Brodeur, J.; et al. Scientists’ Warning on Climate Change and Insects. Ecol. Monogr. 2022, 93, e1553. [Google Scholar] [CrossRef]
- Opito, E.A.; Alanko, T.; Kalbitzer, U.; Nummelin, M.; Omeja, P.; Valtonen, A.; Chapman, C.A. 30 Years Brings Changes to the Arthropod Community of Kibale National Park, Uganda. Biotropica 2023, 55, 529–539. [Google Scholar] [CrossRef]
- O’Dowd, D.J.; Green, P.T.; Lake, P.S. Invasional ‘Meltdown’ on an Oceanic Island. Ecol. Lett. 2003, 6, 812–817. [Google Scholar] [CrossRef]
- Borges, P.A.V.; Rigal, F.; Ros-Prieto, A.; Cardoso, P. Increase of Insular Exotic Arthropod Diversity Is a Fundamental Dimension of the Current Biodiversity Crisis. Insect Conserv. Divers. 2020, 13, 508–518. [Google Scholar] [CrossRef]
- Fernández-Palacios, J.M.; Kreft, H.; Irl, S.D.H.; Norder, S.; Ah-Peng, C.; Borges, P.A.V.; Burns, K.C.; de Nascimento, L.; Meyer, J.-Y.; Montes, E.; et al. Scientists’ Warning—The Outstanding Biodiversity of Islands Is in Peril. Glob. Ecol. Conserv. 2021, 31, e01847. [Google Scholar] [CrossRef]
- Sax, D.F.; Gaines, S.D. Species Invasions and Extinction: The Future of Native Biodiversity on Islands. Proc. Natl. Acad. Sci. USA 2008, 105, 11490–11497. [Google Scholar] [CrossRef]
- Pyšek, P.; Hulme, P.E.; Simberloff, D.; Bacher, S.; Blackburn, T.M.; Carlton, J.T.; Dawson, W.; Essl, F.; Foxcroft, L.C.; Genovesi, P.; et al. Scientists’ Warning on Invasive Alien Species. Biol. Rev. 2020, 95, 1511–1534. [Google Scholar] [CrossRef]
- Mormul, R.P.; Vieira, D.S.; Bailly, D.; Fidanza, K.; da Silva, V.F.B.; da Graça, W.J.; Pontara, V.; Bueno, M.L.; Thomaz, S.M.; Mendes, R.S. Invasive Alien Species Records Are Exponentially Rising across the Earth. Biol. Invasions 2022, 24, 3249–3261. [Google Scholar] [CrossRef]
- Bellard, C.; Bertelsmeier, C.; Leadley, P.; Thuiller, W.; Courchamp, F. Impacts of Climate Change on the Future of Biodiversity. Ecol. Lett. 2012, 15, 365–377. [Google Scholar] [CrossRef]
- Borges, P.A.V.; Gabriel, R.; Fattorini, S. Biodiversity Erosion: Causes and Consequences. In Life on Land; Leal Filho, W., Azul, A.M., Brandli, L., Özuyar, P.G., Wall, T., Eds.; Encyclopedia of the UN Sustainable Development Goals; Springer International Publishing: Cham, Switzerland, 2019; pp. 1–10. ISBN 978-3-319-71065-5. [Google Scholar]
- Sage, R.F. Global Change Biology: A Primer. Glob. Chang. Biol. 2020, 26, 3–30. [Google Scholar] [CrossRef] [PubMed]
- Powell, K.I.; Chase, J.M.; Knight, T.M. Invasive Plants Have Scale-Dependent Effects on Diversity by Altering Species-Area Relationships. Science 2013, 339, 316–318. [Google Scholar] [CrossRef] [PubMed]
- Linders, T.E.W.; Schaffner, U.; Eschen, R.; Abebe, A.; Choge, S.K.; Nigatu, L.; Mbaabu, P.R.; Shiferaw, H.; Allan, E. Direct and Indirect Effects of Invasive Species: Biodiversity Loss Is a Major Mechanism by Which an Invasive Tree Affects Ecosystem Functioning. J. Ecol. 2019, 107, 2660–2672. [Google Scholar] [CrossRef]
- Gullan, P.; Cranston, P. The Insects: An Outline of Entomology; Wiley-Blackwell: Hoboken, NJ, USA, 2020; ISBN 978-1-118.84615.5. [Google Scholar]
- Aberlenc, H.-P. Les Insectes du Monde; MUSEO: Plaissan, France, 2020; ISBN 978-2-37375-101-7. [Google Scholar]
- Mishra, G.; Omkar, O. Insects: The Unrecognized Heroes. In Insects as Service Providers; Omkar, O., Ed.; Springer: Singapore, 2023; pp. 1–8. ISBN 978-981-19340-5-6. [Google Scholar]
- Burns, K.C. A Theory of Island Biogeography for Exotic Species. Am. Nat. 2015, 186, 441–451. [Google Scholar] [CrossRef]
- MacArthur, R.H.; Wilson, E.O. The Theory of Island Biogeography; Princeton University Press: Princeton, NJ, USA, 2001; ISBN 978-0-691-08836-5. [Google Scholar]
- Matthews, T.J.; Sadler, J.; Carvalho, R.; Nunes, R.; Borges, P.A.V. Differential Temporal Beta-diversity Patterns of Native and Non-native Arthropod Species in a Fragmented Native Forest Landscape. Ecography 2019, 42, 45–54. [Google Scholar] [CrossRef]
- Borges, P.A.V.; Cardoso, P.; Kreft, H.; Whittaker, R.J.; Fattorini, S.; Emerson, B.C.; Gil, A.; Gillespie, R.G.; Matthews, T.J.; Santos, A.M.C.; et al. Global Island Monitoring Scheme (GIMS): A Proposal for the Long-Term Coordinated Survey and Monitoring of Native Island Forest Biota. Biodivers. Conserv. 2018, 27, 2567–2586. [Google Scholar] [CrossRef]
- Ives, A.R.; Einarsson, Á.; Jansen, V.A.A.; Gardarsson, A. High-Amplitude Fluctuations and Alternative Dynamical States of Midges in Lake Myvatn. Nature 2008, 452, 84–87. [Google Scholar] [CrossRef]
- Bjørnstad, O.N.; Grenfell, B.T. Noisy Clockwork: Time Series Analysis of Population Fluctuations in Animals. Science 2001, 293, 638–643. [Google Scholar] [CrossRef]
- Grimbacher, P.S.; Stork, N.E. Seasonality of a Diverse Beetle Assemblage Inhabiting Lowland Tropical Rain Forest in Australia. Biotropica 2009, 41, 328–337. [Google Scholar] [CrossRef]
- Beng, K.C.; Corlett, R.T.; Tomlinson, K.W. Seasonal Changes in the Diversity and Composition of the Litter Fauna in Native Forests and Rubber Plantations. Sci. Rep. 2018, 8, 10232. [Google Scholar] [CrossRef]
- Baker, N.J.; Welti, E.A.R.; Pilotto, F.; Jourdan, J.; Beudert, B.; Huttunen, K.; Muotka, T.; Paavola, R.; Göthe, E.; Haase, P. Seasonal and Spatial Variation of Stream Macroinvertebrate Taxonomic and Functional Diversity across Three Boreal Regions. Insect. Conserv. Divers. 2023, 16, 266–284. [Google Scholar] [CrossRef]
- Loh, J.; Green, R.E.; Ricketts, T.; Lamoreux, J.; Jenkins, M.; Kapos, V.; Randers, J. The Living Planet Index: Using Species Population Time Series to Track Trends in Biodiversity. Philos. Trans. R. Soc. Lond. Ser. B Biol. Sci. 2005, 360, 289–295. [Google Scholar] [CrossRef] [PubMed]
- Huebner, C.D. Patterns of Invasive Plant Abundance in Disturbed versus Undisturbed Forests within Three Land Types over 16 Years. Divers. Distrib. 2021, 27, 130–143. [Google Scholar] [CrossRef]
- Lamarre, G.P.A.; Pardikes, N.A.; Segar, S.; Hackforth, C.N.; Laguerre, M.; Vincent, B.; Lopez, Y.; Perez, F.; Bobadilla, R.; Silva, J.A.R.; et al. More Winners than Losers over 12 Years of Monitoring Tiger Moths (Erebidae: Arctiinae) on Barro Colorado Island, Panama. Biol. Lett. 2022, 18, 20210519. [Google Scholar] [CrossRef] [PubMed]
- Dornelas, M.; Magurran, A.E.; Buckland, S.T.; Chao, A.; Chazdon, R.L.; Colwell, R.K.; Curtis, T.; Gaston, K.J.; Gotelli, N.J.; Kosnik, M.A.; et al. Quantifying Temporal Change in Biodiversity: Challenges and Opportunities. Proc. R. Soc. B Biol. Sci. 2013, 280, 20121931. [Google Scholar] [CrossRef]
- Halsch, C.A.; Shapiro, A.M.; Fordyce, J.A.; Nice, C.C.; Thorne, J.H.; Waetjen, D.P.; Forister, M.L. Insects and Recent Climate Change. Proc. Natl. Acad. Sci. USA 2021, 118, e2002543117. [Google Scholar] [CrossRef]
- Vaughan, H.; Brydges, T.; Fenech, A.; Lumb, A. Monitoring Long-Term Ecological Changes Through the Ecological Monitoring and Assessment Network: Science-Based and Policy Relevant. Environ. Monit. Assess. 2001, 67, 3–28. [Google Scholar] [CrossRef]
- Caughlan, L.; Oakley, K.L. Cost Considerations for Long-Term Ecological Monitoring. Ecol. Indic. 2001, 1, 123–134. [Google Scholar] [CrossRef]
- Stephenson, P.J.; Londoño-Murcia, M.C.; Borges, P.A.V.; Claassens, L.; Frisch-Nwakanma, H.; Ling, N.; McMullan-Fisher, S.; Meeuwig, J.J.; Unter, K.M.M.; Walls, J.L.; et al. Measuring the Impact of Conservation: The Growing Importance of Monitoring Fauna, Flora and Funga. Diversity 2022, 14, 824. [Google Scholar] [CrossRef]
- Neff, C. The Azores—A Forgotten Biodiversity Hotspot. Geoöko 2001, XXII, 189–201. [Google Scholar]
- Costa, R.; Borges, P. SLAM Project—Long Term Ecological Study of the Impacts of Climate Change in the Natural Forest of Azores: I—The Spiders from Native Forests of Terceira and Pico Islands (2012–2019). Biodivers. Data J. 2021, 9, e69924. [Google Scholar] [CrossRef] [PubMed]
- Borges, P.; Lamelas-López, L.; Tsafack, N.; Boieiro, M.; Ros-Prieto, A.; Gabriel, R.; Nunes, R.; Ferreira, M.T. SLAM Project—Long Term Ecological Study of the Impacts of Climate Change in the Natural Forest of Azores: III—Testing the Impact of Edge Effects in a Native Forest of Terceira Island. Biodivers. Data J. 2022, 10, e85971. [Google Scholar] [CrossRef]
- Lhoumeau, S.; Cardoso, P.; Boieiro, M.; Ros-Prieto, A.; Costa, R.; Lamelas-Lopez, L.; Leite, A.; Amorim do Rosário, I.; Gabriel, R.; Malumbres-Olarte, J.; et al. SLAM Project—Long Term Ecological Study of the Impacts of Climate Change in the Natural Forests of Azores: V—New Records of Terrestrial Arthropods after Ten Years of SLAM Sampling. Biodivers. Data J. 2022, 10, e97952. [Google Scholar] [CrossRef] [PubMed]
- Lhoumeau, S.; Cardoso, P.; Costa, R.; Boieiro, M.; Malumbres-Olarte, J.; Amorim, I.; Rigal, F.; Santos, A.; Gabriel, R.; Borges, P. SLAM Project—Long Term Ecological Study of the Impacts of Climate Change in the Natural Forest of Azores: IV—The Spiders of Terceira and Pico Islands (2019-2021) and General Diversity Patterns after Ten Years of Sampling. Biodivers. Data J. 2022, 10, e96442. [Google Scholar] [CrossRef] [PubMed]
- Gonçalves, M.; Bernardo, C.; Bernardino, M.; Soares, C.G. Climate Change Impacts on the Wave Energy in the Azores Islands. In Trends in Renewable Energies Offshore; CRC Press: London, UK, 2022; pp. 43–51. ISBN 978-1-00-336077-3. [Google Scholar]
- Borges, P.A.V.; Reut, M.; Ponte, N.B.; Quartau, J.A.; Fletcher, M.; Sousa, A.B.; Pollet, M.; Soares, A.O.; Marcelino, J.; Rego, C.; et al. New Records of Exotic Spiders and Insects to the Azores, and New Data on Recently Introduced Species. Arquipélago. Life Mar. Sci. 2013, 30, 57–70. [Google Scholar]
- Borges, P.A.V.; Pimentel, R.; Carvalho, R.; Nunes, R.; Wallon, S.; Prieto, A.R. Seasonal Dynamics of Arthropods in the Humid Native Forests of Terceira Island (Azores). Arquipélago. Life Mar. Sci. 2017, 34, 105–122. [Google Scholar]
- Borges, P.A.V.; Lobo, J.M.; de Azevedo, E.B.; Gaspar, C.S.; Melo, C.; Nunes, L.V. Invasibility and Species Richness of Island Endemic Arthropods: A General Model of Endemic vs. Exotic Species. J. Biogeogr. 2006, 33, 169–187. [Google Scholar] [CrossRef]
- Triantis, K.A.; Borges, P.A.V.; Ladle, R.J.; Hortal, J.; Cardoso, P.; Gaspar, C.; Dinis, F.; Mendonça, E.; Silveira, L.M.A.; Gabriel, R.; et al. Extinction Debt on Oceanic Islands. Ecography 2010, 33, 285–294. [Google Scholar] [CrossRef]
- Borges, P.A.V.; Cardoso, P.; Fattorini, S.; Rigal, F.; Matthews, T.J.; Di Biase, L.; Amorim, I.R.; Florencio, M.; Borda-de-Água, L.; Rego, C.; et al. Community Structure of Woody Plants on Islands along a Bioclimatic Gradient. Front. Biogeogr. 2018, 10, e40295. [Google Scholar] [CrossRef]
- Borges, P.; Lamelas-Lopez, L.; Andrade, R.; Lhoumeau, S.; Vieira, V.; Soares, A.; Borges, I.; Boieiro, M.; Cardoso, P.; Crespo, L.C.; et al. An Updated Checklist of Azorean Arthropods (Arthropoda). Biodivers. Data J. 2022, 10, e97682. [Google Scholar] [CrossRef]
- Rigal, F.; Cardoso, P.; Lobo, J.M.; Triantis, K.A.; Whittaker, R.J.; Amorim, I.R.; Borges, P.A.V. Functional Traits of Indigenous and Exotic Ground-Dwelling Arthropods Show Contrasting Responses to Land-Use Change in an Oceanic Island, Terceira, Azores. Divers. Distrib. 2017, 24, 36–47. [Google Scholar] [CrossRef]
- Brush, M.; Matthews, T.J.; Borges, P.A.V.; Harte, J. Land Use Change through the Lens of Macroecology: Insights from Azorean Arthropods and the Maximum Entropy Theory of Ecology. Ecography 2022, 2022, e06141. [Google Scholar] [CrossRef]
- R Core Team. R: A Language and Environment for Statistical Computing; R Foundation for Statistical Computing: Vienna, Austria, 2023. [Google Scholar]
- Carslaw, D.C.; Ropkins, K. Openair—An R Package for Air Quality Data Analysis. Environ. Model. Softw. 2012, 27–28, 52–61. [Google Scholar] [CrossRef]
- McLeod, A.I. Kendall: Kendall Rank Correlation and Mann-Kendall Trend Test; R Foundation: Vienna, Austria, 2022. [Google Scholar]
- Prado, P.I.; Miranda, M.D.; Chalom, A. Sads: Maximum Likelihood Models for Species Abundance Distributions; R Foundation: Vienna, Austria, 2018. [Google Scholar]
- Matthews, T.J.; Borregaard, M.K.; Ugland, K.I.; Borges, P.A.V.; Rigal, F.; Cardoso, P.; Whittaker, R.J. The Gambin Model Provides a Superior Fit to Species Abundance Distributions with a Single Free Parameter: Evidence, Implementation and Interpretation. Ecography 2014, 37, 1002–1011. [Google Scholar] [CrossRef]
- Cardoso, P.; Mammola, S.; Rigal, F.; Carvalho, J. BAT: Biodiversity Assessment Tools; R Foundation: Vienna, Austria, 2022. [Google Scholar]
- Bezanson, J.; Edelman, A.; Karpinski, S.; Shah, V.B. Julia: A Fresh Approach to Numerical Computing. SIAM Rev. 2017, 59, 65–98. [Google Scholar] [CrossRef]
- Hill, M.O. Diversity and Evenness: A Unifying Notation and Its Consequences. Ecology 1973, 54, 427–432. [Google Scholar] [CrossRef]
- Carvalho, J.C.; Cardoso, P.; Borges, P.A.V.; Schmera, D.; Podani, J. Measuring Fractions of Beta Diversity and Their Relationships to Nestedness: A Theoretical and Empirical Comparison of Novel Approaches. Oikos 2013, 122, 825–834. [Google Scholar] [CrossRef]
- Ugland, K.I.; John, P.; Lambshead, P.J.; Mcgill, B.; Gray, J.; O’Dea, N.; Ladle, R.; Whittaker, R. Modelling Dimensionality in Species Abundance Distributions: Description and Evaluation of the Gambin Model. Evol. Ecol. Res. 2007, 9, 313–324. [Google Scholar]
- Hubbell, S.P. Tropical Rain Forest Conservation and the Twin Challenges of Diversity and Rarity. Ecol. Evol. 2013, 3, 3263–3274. [Google Scholar] [CrossRef]
- ter Steege, H.; Pitman, N.C.A.; Sabatier, D.; Baraloto, C.; Salomão, R.P.; Guevara, J.E.; Phillips, O.L.; Castilho, C.V.; Magnusson, W.E.; Molino, J.-F.; et al. Hyperdominance in the Amazonian Tree Flora. Science 2013, 342, 1243092. [Google Scholar] [CrossRef]
- Hódar, J.A. The Use of Regression Equations for Estimation of Arthropod Biomass in Ecological Studies. Acta Oecologica 1996, 17, 421–433. [Google Scholar]
- Sample, B.E.; Cooper, R.J.; Greer, R.D.; Whitmore, R.C. Estimation of Insect Biomass by Length and Width. Am. Midl. Nat. 1993, 129, 234–240. [Google Scholar] [CrossRef]
- Cardoso, P.; Borges, P.A.V.; Gaspar, C. Biotic Integrity of the Arthropod Communities in the Natural Forests of Azores. Biodivers. Conserv. 2007, 16, 2883–2901. [Google Scholar] [CrossRef]
- Gaspar, C.; Borges, P.A.V.; Gaston, K.J. Diversity and Distribution of Arthropods in Native Forests of the Azores Archipelago. Arquipélago. Life Mar. Sci. 2008, 25, 1–30. [Google Scholar]
- Borges, P.A.V.; Wunderlich, J. Spider Biodiversity Patterns and Their Conservation in the Azorean Archipelago, with Descriptions of New Species. Syst. Biodivers. 2008, 6, 249–282. [Google Scholar] [CrossRef]
- Tsafack, N.; Gabriel, R.; Elias, R.; Boieiro, M.; Ferreira, M.T.; Borges, P. Arthropods and Other Biota Associated with the Azorean Trees and Shrubs: Laurus Azorica (Seub) Franco (Magnoliophyta, Magnoliopsida, Laurales, Lauraceae). Biodivers. Data J. 2022, 10, e80088. [Google Scholar] [CrossRef]
- Tsafack, N.; Pozsgai, G.; Boieiro, M.; Ros-Prieto, A.; Nunes, R.; Ferreira, M.T.; Borges, P.A.V. Edge Effects Constraint Endemic but Not Introduced Arthropod Species in a Pristine Forest on Terceira (Azores, Portugal). For. Ecol. Manag. 2023, 528, 120646. [Google Scholar] [CrossRef]
- Crossley, M.S.; Meier, A.R.; Baldwin, E.M.; Berry, L.L.; Crenshaw, L.C.; Hartman, G.L.; Lagos-Kutz, D.; Nichols, D.H.; Patel, K.; Varriano, S.; et al. No Net Insect Abundance and Diversity Declines across US Long Term Ecological Research Sites. Nat. Ecol. Evol. 2020, 4, 1368–1376. [Google Scholar] [CrossRef] [PubMed]
- Basset, Y.; Butterill, P.T.; Donoso, D.A.; Lamarre, G.P.A.; Souto-Vilarós, D.; Perez, F.; Bobadilla, R.; Lopez, Y.; Alejandro Ramírez Silva, J.; Barrios, H. Abundance, Occurrence and Time Series: Long-Term Monitoring of Social Insects in a Tropical Rainforest. Ecol. Indic. 2023, 150, 110243. [Google Scholar] [CrossRef]
- Clapham, M.E.; Karr, J.A. Environmental and Biotic Controls on the Evolutionary History of Insect Body Size. Proc. Natl. Acad. Sci. USA 2012, 109, 10927–10930. [Google Scholar] [CrossRef]
- Brown, J.H. Why Are There so Many Species in the Tropics? J. Biogeogr. 2014, 41, 8–22. [Google Scholar] [CrossRef] [PubMed]
- Baulechner, D. Convergent Evolution of Functional Traits and Implications for the Structure and Assembly of Communities. Ph.D. Thesis, Universitätsbibliothek Gießen, Giessen, Germany, 2022. [Google Scholar] [CrossRef]
- Ferreira, M.T.; Cardoso, P.; Borges, P.A.V.; Gabriel, R.; de Azevedo, E.B.; Reis, F.; Araújo, M.B.; Elias, R.B. Effects of Climate Change on the Distribution of Indigenous Species in Oceanic Islands (Azores). Clim. Chang. 2016, 138, 603–615. [Google Scholar] [CrossRef]
- Thébault, E.; Fontaine, C. Stability of Ecological Communities and the Architecture of Mutualistic and Trophic Networks. Science 2010, 329, 853–856. [Google Scholar] [CrossRef]
- de Bello, F.; Lavorel, S.; Hallett, L.M.; Valencia, E.; Garnier, E.; Roscher, C.; Conti, L.; Galland, T.; Goberna, M.; Májeková, M.; et al. Functional Trait Effects on Ecosystem Stability: Assembling the Jigsaw Puzzle. Trends Ecol. Evol. 2021, 36, 822–836. [Google Scholar] [CrossRef] [PubMed]
- Tylianakis, J.M.; Tscharntke, T.; Lewis, O.T. Habitat Modification Alters the Structure of Tropical Host–Parasitoid Food Webs. Nature 2007, 445, 202–205. [Google Scholar] [CrossRef]
- Zelnik, Y.R.; Arnoldi, J.-F.; Loreau, M. The Impact of Spatial and Temporal Dimensions of Disturbances on Ecosystem Stability. Front. Ecol. Evol. 2018, 6, 224. [Google Scholar] [CrossRef] [PubMed]
- Storch, D.; Šímová, I.; Smyčka, J.; Bohdalková, E.; Toszogyova, A.; Okie, J.G. Biodiversity Dynamics in the Anthropocene: How Human Activities Change Equilibria of Species Richness. Ecography 2022, 2022, 1–19. [Google Scholar] [CrossRef]
- Storch, D.; Okie, J.G. The Carrying Capacity for Species Richness. Glob. Ecol. Biogeogr. 2019, 28, 1519–1532. [Google Scholar] [CrossRef]
- Kéfi, S.; Domínguez-García, V.; Donohue, I.; Fontaine, C.; Thébault, E.; Dakos, V. Advancing Our Understanding of Ecological Stability. Ecol. Lett. 2019, 22, 1349–1356. [Google Scholar] [CrossRef]
- Aparício, B.A.; Cascalho, J.; Cruz, M.J.; Borges, P.A.V.; Azevedo, E.B.; Elias, R.B.; Ascensão, F. Assessing the Landscape Functional Connectivity Using Movement Maps: A Case Study with Endemic Azorean Insects. J. Insect Conserv. 2018, 22, 257–265. [Google Scholar] [CrossRef]
- Ferreira, M.T.; Cardoso, P.; Borges, P.A.V.; Gabriel, R.; de Azevedo, E.B.; Elias, R.B. Implications of Climate Change to the Design of Protected Areas: The Case Study of Small Islands (Azores). PLoS ONE 2019, 14, e0218168. [Google Scholar] [CrossRef]
- Piechnik, D.A.; Lawler, S.P.; Martinez, N.D. Food-Web Assembly during a Classic Biogeographic Study: Species’ “Trophic Breadth” Corresponds to Colonization Order. Oikos 2008, 117, 665–674. [Google Scholar] [CrossRef]
- Santos, A.M.C.; Fontaine, C.; Quicke, D.L.J.; Borges, P.A.V.; Hortal, J. Are Island and Mainland Biotas Different? Richness and Level of Generalism in Parasitoids of a Microlepidopteran in Macaronesia. Oikos 2011, 120, 1256–1262. [Google Scholar] [CrossRef]
- Urban, M.C. Accelerating Extinction Risk from Climate Change. Science 2015, 348, 571–573. [Google Scholar] [CrossRef] [PubMed]
- Otto, R.; Garzón-Machado, V.; del Arco, M.; Fernández-Lugo, S.; de Nascimento, L.; Oromí, P.; Báez, M.; Ibáñez, M.; Alonso, M.R.; Fernández-Palacios, J.M. Unpaid Extinction Debts for Endemic Plants and Invertebrates as a Legacy of Habitat Loss on Oceanic Islands. Divers. Distrib. 2017, 23, 1031–1041. [Google Scholar] [CrossRef]
- Walter, J.A.; Shoemaker, L.G.; Lany, N.K.; Castorani, M.C.N.; Fey, S.B.; Dudney, J.C.; Gherardi, L.; Portales-Reyes, C.; Rypel, A.L.; Cottingham, K.L.; et al. The Spatial Synchrony of Species Richness and Its Relationship to Ecosystem Stability. Ecology 2021, 102, e03486. [Google Scholar] [CrossRef]
- Valencia, E.; de Bello, F.; Galland, T.; Adler, P.B.; Lepš, J.; E-Vojtkó, A.; van Klink, R.; Carmona, C.P.; Danihelka, J.; Dengler, J.; et al. Synchrony Matters More than Species Richness in Plant Community Stability at a Global Scale. Proc. Natl. Acad. Sci. USA 2020, 117, 24345–24351. [Google Scholar] [CrossRef]
- Downing, A.L.; Leibold, M.A. Species Richness Facilitates Ecosystem Resilience in Aquatic Food Webs. Freshw. Biol. 2010, 55, 2123–2137. [Google Scholar] [CrossRef]
- Donohue, I.; Hillebrand, H.; Montoya, J.M.; Petchey, O.L.; Pimm, S.L.; Fowler, M.S.; Healy, K.; Jackson, A.L.; Lurgi, M.; McClean, D.; et al. Navigating the Complexity of Ecological Stability. Ecol. Lett. 2016, 19, 1172–1185. [Google Scholar] [CrossRef]
- Arnoldi, J.-F.; Loreau, M.; Haegeman, B. The Inherent Multidimensionality of Temporal Variability: How Common and Rare Species Shape Stability Patterns. Ecol. Lett. 2019, 22, 1557–1567. [Google Scholar] [CrossRef]
- Chapman, A.S.A.; Tunnicliffe, V.; Bates, A.E. Both Rare and Common Species Make Unique Contributions to Functional Diversity in an Ecosystem Unaffected by Human Activities. Divers. Distrib. 2018, 24, 568–578. [Google Scholar] [CrossRef]
- Biggs, C.R.; Yeager, L.A.; Bolser, D.G.; Bonsell, C.; Dichiera, A.M.; Hou, Z.; Keyser, S.R.; Khursigara, A.J.; Lu, K.; Muth, A.F.; et al. Does Functional Redundancy Affect Ecological Stability and Resilience? A Review and Meta-Analysis. Ecosphere 2020, 11, e03184. [Google Scholar] [CrossRef]
- Levine, J.M.; Vilà, M.; D’Antonio, C.M.; Dukes, J.S.; Grigulis, K.; Lavorel, S. Mechanisms Underlying the Impacts of Exotic Plant Invasions. Proc. Biol. Sci. 2003, 270, 775–781. [Google Scholar] [CrossRef] [PubMed]
- Heleno, R.H.; Ripple, W.J.; Traveset, A. Scientists’ Warning on Endangered Food Webs. Web Ecol. 2020, 20, 1–10. [Google Scholar] [CrossRef]
- Jiménez-García, E.; Andújar, C.; López, H.; Emerson, B.C. Towards Understanding Insect Species Introduction and Establishment: A Community-level Barcoding Approach Using Island Beetles. Mol. Ecol. 2023, mec.16962. [Google Scholar] [CrossRef] [PubMed]
- Avise, J.C. Phylogeography: The History and Formation of Species; Harvard University Press: Cambridge, MA, USA, 2000; ISBN 978-0-674-66638-2. [Google Scholar]
- Edwards, S.V.; Robin, V.V.; Ferrand, N.; Moritz, C. The Evolution of Comparative Phylogeography: Putting the Geography (and More) into Comparative Population Genomics. Genome Biol. Evol. 2022, 14, evab176. [Google Scholar] [CrossRef]
- Bobo-Pinilla, J.; Salmerón-Sánchez, E.; Mendoza-Fernández, A.J.; Mota, J.F.; Peñas, J. Conservation and Phylogeography of Plants: From the Mediterranean to the Rest of the World. Diversity 2022, 14, 78. [Google Scholar] [CrossRef]
- Emerson, B.C.; Borges, P.A.V.; Cardoso, P.; Convey, P.; deWaard, J.R.; Economo, E.P.; Gillespie, R.G.; Kennedy, S.; Krehenwinkel, H.; Meier, R.; et al. Collective and Harmonized High Throughput Barcoding of Insular Arthropod Biodiversity: Toward a Genomic Observatories Network for Islands. Mol. Ecol. 2022, mec.16683. [Google Scholar] [CrossRef]
- Carnicer, J.; Brotons, L.; Sol, D.; De Cáceres, M. Random Sampling, Abundance–Extinction Dynamics and Niche-Filtering Immigration Constraints Explain the Generation of Species Richness Gradients. Glob. Ecol. Biogeogr. 2008, 17, 352–362. [Google Scholar] [CrossRef]
- Gaston, K.J.; Blackburn, T.M. Pattern and Process in Macroecology; Blackwell Science: Oxford, UK; Malden, MA, USA, 2000; Volume 392. [Google Scholar]
- Elton, C.S. The Ecology of Invasions by Animals and Plants; Springer: New York, NY, USA, 1958; ISBN 978-1-4899-7214-9. [Google Scholar]
- Levine, J.M.; D’Antonio, C.M. Elton Revisited: A Review of Evidence Linking Diversity and Invasibility. Oikos 1999, 87, 15–26. [Google Scholar] [CrossRef]
- Dubart, M.; Pointier, J.-P.; Jarne, P.; David, P. Niche Filtering, Competition and Species Turnover in a Metacommunity of Freshwater Molluscs. Oikos 2022, 2022, e09157. [Google Scholar] [CrossRef]
- Lim, J.Y.; Patiño, J.; Noriyuki, S.; Cayetano, L.; Gillespie, R.G.; Krehenwinkel, H. Semi-Quantitative Metabarcoding Reveals How Climate Shapes Arthropod Community Assembly along Elevation Gradients on Hawaii Island. Mol. Ecol. 2022, 31, 1416–1429. [Google Scholar] [CrossRef] [PubMed]
- Elias, R.B.; Gil, A.; Silva, L.; Fernández-Palacios, J.M.; Azevedo, E.B.; Reis, F. Natural Zonal Vegetation of the Azores Islands: Characterization and Potential Distribution. Phytocoenologia 2016, 46, 107–123. [Google Scholar] [CrossRef]
- Cadotte, M.W.; Campbell, S.E.; Li, S.-P.; Sodhi, D.S.; Mandrak, N.E. Preadaptation and Naturalization of Nonnative Species: Darwin’s Two Fundamental Insights into Species Invasion. Annu. Rev. Plant Biol. 2018, 69, 661–684. [Google Scholar] [CrossRef]
- Nicolosi, G.; Mammola, S.; Verbrugge, L.; Isaia, M. Aliens in Caves: The Global Dimension of Biological Invasions in Subterranean Ecosystems. Biol. Rev. 2023, 98, 849–867. [Google Scholar] [CrossRef] [PubMed]
- Latombe, G.; Roura-Pascual, N.; Hui, C. Similar Compositional Turnover but Distinct Insular Environmental and Geographical Drivers of Native and Exotic Ants in Two Oceans. J. Biogeogr. 2019, 46, 2299–2310. [Google Scholar] [CrossRef]
- Blandenier, G. Ballooning of Spiders (Araneae) in Switzerland: General Results from an Eleven-Year Survey. Arachnology 2009, 14, 308–316. [Google Scholar] [CrossRef]
- Malumbres-Olarte, J.; Barratt, B.I.P.; Vink, C.J.; Paterson, A.M.; Cruickshank, R.H.; Ferguson, C.M.; Barton, D.M. Big and Aerial Invaders: Dominance of Exotic Spiders in Burned New Zealand Tussock Grasslands. Biol. Invasions 2014, 16, 2311–2322. [Google Scholar] [CrossRef]
Disclaimer/Publisher’s Note: The statements, opinions and data contained in all publications are solely those of the individual author(s) and contributor(s) and not of MDPI and/or the editor(s). MDPI and/or the editor(s) disclaim responsibility for any injury to people or property resulting from any ideas, methods, instructions or products referred to in the content. |
© 2023 by the authors. Licensee MDPI, Basel, Switzerland. This article is an open access article distributed under the terms and conditions of the Creative Commons Attribution (CC BY) license (https://creativecommons.org/licenses/by/4.0/).