


Salinity as a Key Factor in Structuring Macrophyte Assemblages in Transitional Water Bodies: The Case of the Apulian Coastal Lagoons (Southern Italy)


 ,
,  ,
,
Abstract
1. Introduction
2. Materials and Methods
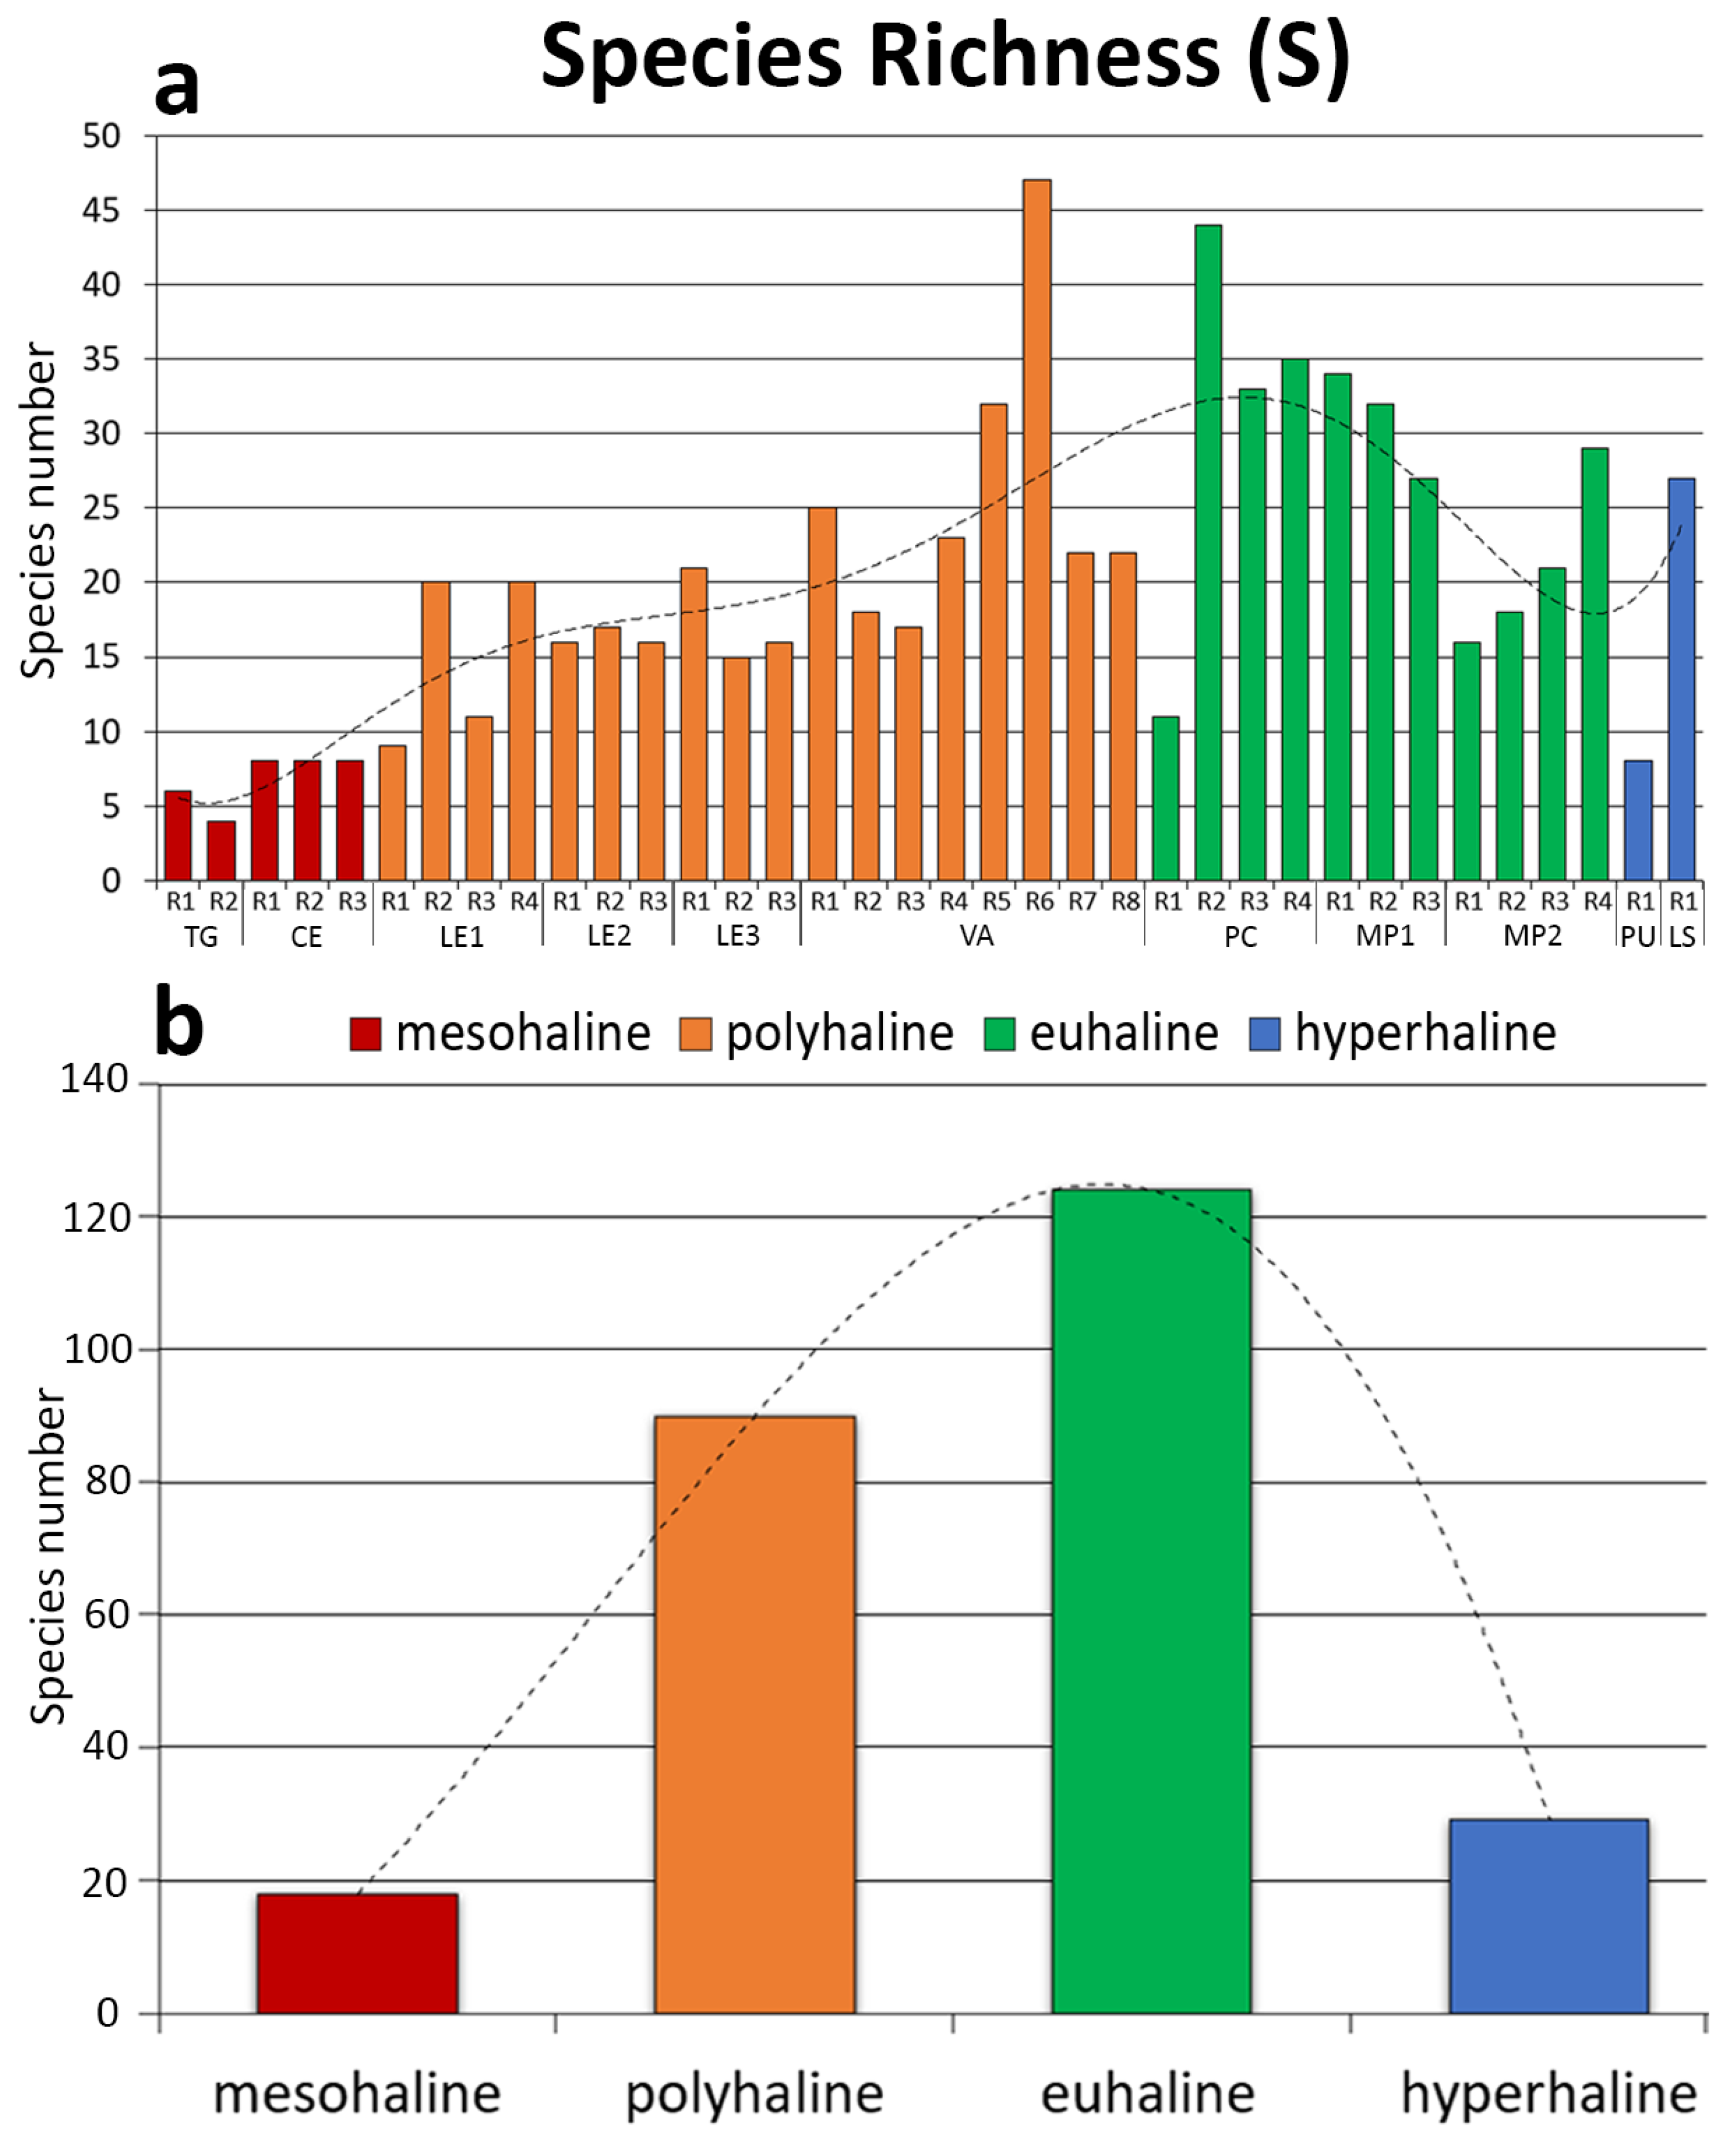
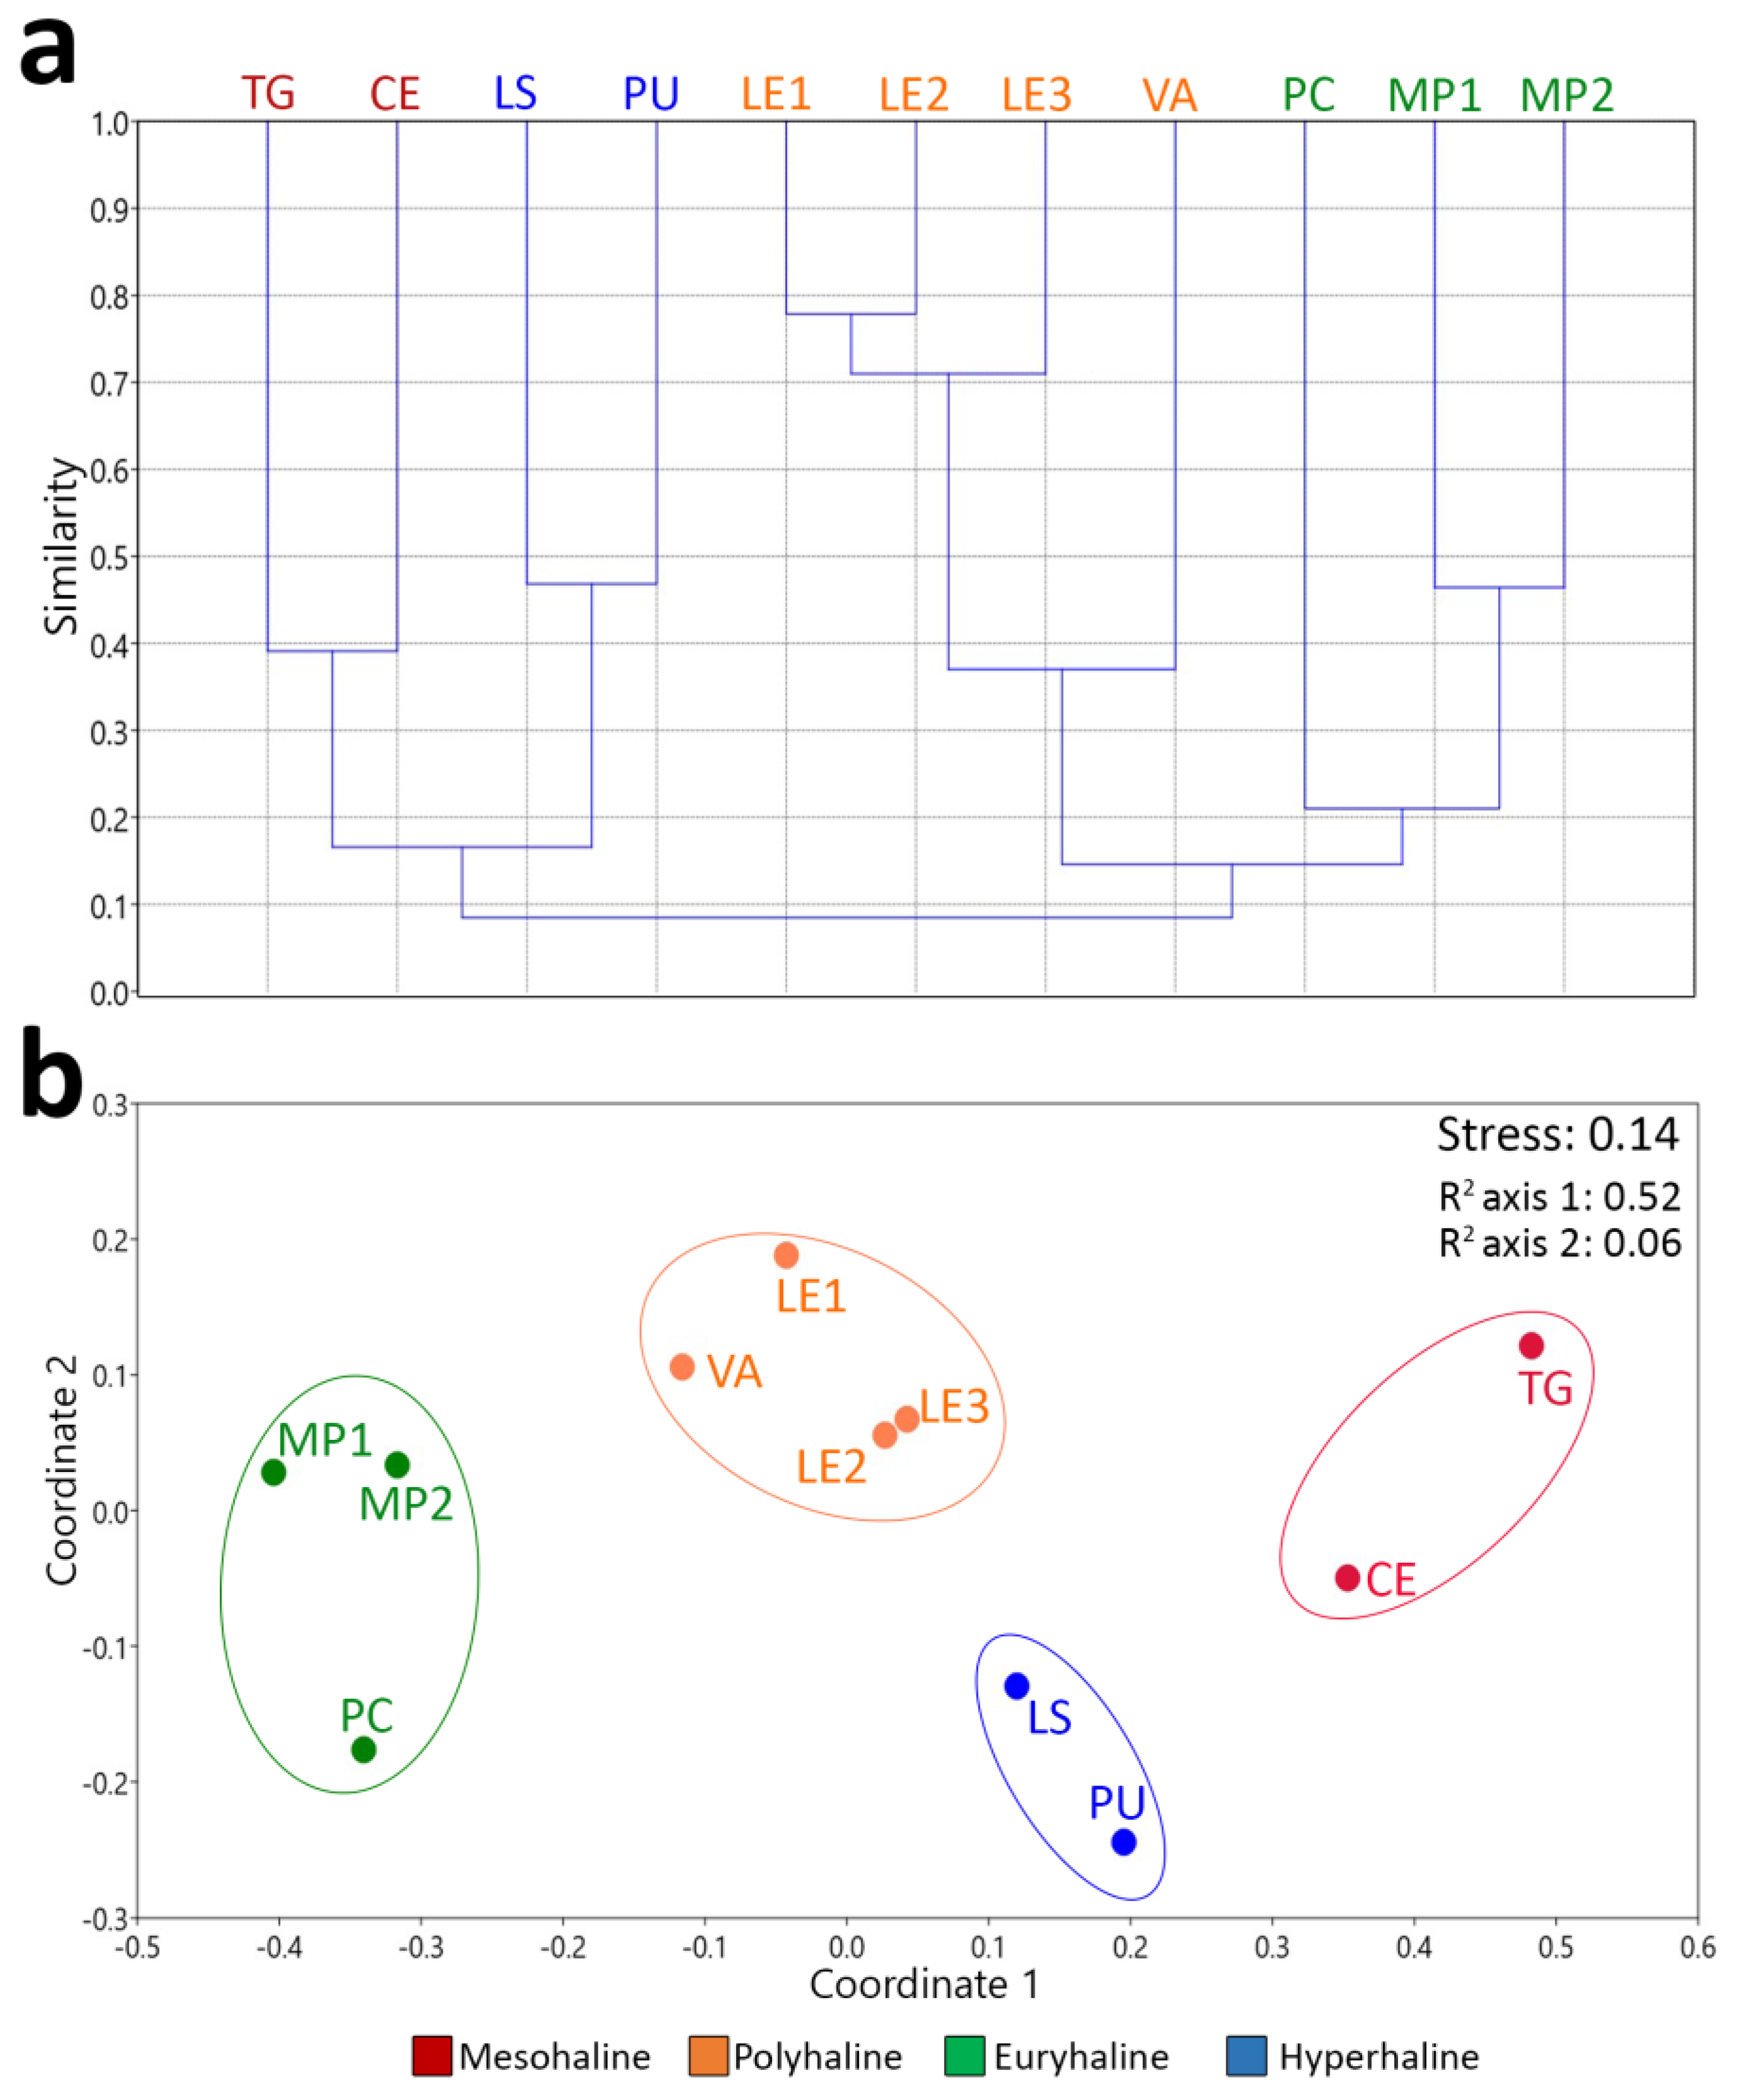
3. Results
4. Discussion
5. Conclusions
Author Contributions
Funding
Institutional Review Board Statement
Data Availability Statement
Conflicts of Interest
References
- Pérez-Ruzafa, A.; Marcos, C.; Pérez-Ruzafa, I.M.; Pérez-Marcos, M. Coastal lagoons: “transitional ecosystems” between transitional and coastal waters. J. Coast. Conserv. 2011, 15, 369–392. [Google Scholar] [CrossRef]
- Pérez-Ruzafa, A.; Pérez-Ruzafa, I.M.; Newton, A.; Marcos, C. Coastal lagoons: Environmental variability, ecosystem complexity and goods and services uniformity. In Coasts and Estuaries, the Future; Wolanski, E., Day, J., Elliott, M., Ramesh, R., Eds.; Elsevier: New York, NY, USA, 2019; pp. 253–276. [Google Scholar] [CrossRef]
- Tagliapietra, D.; Sigovini, M.; Ghirardini, A.V. A review of terms and definitions to categorize estuaries, lagoons and associated environments. Mar. Freshwater Res. 2009, 60, 497–509. [Google Scholar] [CrossRef]
- Petihakis, G.; Triantafyllou, G.; Koutsoubas, D.; Allen, I.; Dounas, C. Modelling the annual cycles of nutrients and phytoplankton in a Mediterranean lagoon (Gialova, Greece). Mar. Environ. Res. 1999, 48, 37–58. [Google Scholar] [CrossRef]
- Plus, M.; Chapelle, A.; Lazure, P.; Auby, I.; Levavasseur, G.; Verlaque, M.; Belsher, T.; Deslous-Paoli, J.-M.; Zaldívar, J.-M.; Murray, C.N. Modelling of oxygen and nitrogen cycling as a function of macrophyte community in the Thau lagoon. Cont. Shelf Res. 2003, 23, 1877–1898. [Google Scholar] [CrossRef]
- Pastres, R.; Solidoro, C.; Ciavatta, S.; Petrizzo, A.; Cossarini, G. Long-term changes of inorganic nutrients in the Lagoon of Venice (Italy). J. Marine Syst. 2004, 51, 179–189. [Google Scholar] [CrossRef]
- Le Fur, I.; Wit, R.D.; Plus, M.; Oheix, J.; Simier, M.; Ouisse, V. Submerged benthic macrophytes in Mediterranean lagoons: Distribution patterns in relation to water chemistry and depth. Hydrobiologia 2018, 808, 175–200. [Google Scholar] [CrossRef]
- Viaroli, P.; Bartoli, M.; Giordani, G.; Naldi, M.; Orfanidis, S.; Zaldivar, J.M. Community shifts, alternative stable states, biogeochemical controls and feedbacks in eutrophic coastal lagoons: A brief overview. Aquat. Conserv. 2008, 18, S105–S117. [Google Scholar] [CrossRef]
- Sfriso, A.; Facca, C.; Ghetti, P.F. Rapid Quality Index (R-MaQI), based mainly on macrophyte associations, to assess the ecological status of Mediterranean transitional environments. Chem. Ecol. 2007, 23, 493–503. [Google Scholar] [CrossRef]
- Christia, C.; Tziortzis, I.; Fyttis, G.; Kashta, L.; Papastergiadou, E. A survey of the benthic aquatic flora in transitional water systems of Greece and Cyprus (Mediterranean Sea). Bot. Mar. 2011, 54, 169–178. [Google Scholar] [CrossRef]
- Sfriso, A.; Facca, C.; Marcomini, A. Sedimentation rates and erosion processes in the lagoon of Venice. Environ. Int. 2005, 31, 983–992. [Google Scholar] [CrossRef]
- Mcleod, E.; Chmura, G.L.; Bouillon, S.; Salm, R.; Björk, M.; Duarte, C.M.; Lovelock, C.E.; Schlesinger, W.H.; Silliman, B.R. A blueprint for blue carbon: Toward an improved understanding of the role of vegetated coastal habitats in sequestering CO2. Front. Ecol. Environ. 2011, 9, 552–560. [Google Scholar] [CrossRef]
- Jones, C.G.; Lawton, J.H.; Shachak, M. Organisms as ecosystem engineers. Oikos 1994, 69, 373–386. [Google Scholar] [CrossRef]
- Agostini, S.; Marchand, B.; Pergent, G. Temporal and spatial changes of seagrass meadows in a Mediterranean coastal lagoon. Oceanol. Acta 2003, 25, 297–302. [Google Scholar] [CrossRef]
- EEC. Council Directive 92/43/EEC on the Conservation of Natural Habitats and of Wild Fauna and Flora. J. Eur. Commun. 1992, L 206, 7–50. [Google Scholar]
- Garrido, J.; Pérez-Bilbao, A.; Benetti, C.J. Biodiversity and Conservation of Coastal Lagoons. In Ecosystems Biodiversity; Grillo, O., Venora, G., Eds.; InTech: Vienna, Austria, 2011; pp. 1–28. [Google Scholar]
- Orfanidis, S.; Panayotidis, P.; Stamatis, N. An insight to the ecological evaluation index (EEI). Ecol. Indic. 2003, 3, 27–33. [Google Scholar] [CrossRef]
- García-Sánchez, M.; Pérez-Ruzafa, I.M.; Marcos, C.; Pérez-Ruzafa, A. Suitability of benthic macrophyte indices (EEI, E-MaQI and BENTHOS) for detecting anthropogenic pressures in a Mediterranean coastal lagoon (Mar Menor, Spain). Ecol. Indic. 2012, 19, 48–60. [Google Scholar] [CrossRef]
- Orfanidis, S.; Dencheva, K.; Nakou, K.; Tsioli, S.; Papathanasiou, V.; Rosati, I. Benthic macrophyte metrics as bioindicators of water quality: Towards overcoming typological boundaries and methodological tradition in Mediterranean and Black Seas. Hydrobiologia 2014, 740, 61–78. [Google Scholar] [CrossRef]
- Tziortzis, I.; Kadis, K.; Papastegiadou, E. Use of Macrophyte assemblages for the ecological evaluation of two coastal lagoons of Greece according to WFD 2000/60/EC. J. Wetl. Biodivers. 2014, 4, 97–111. [Google Scholar]
- EEC. Directive 2000/60/EC of the European Parliament and of the Council of 23 October 2000 on establishing a framework for community action in the field of water policy. J. Eur. Commun. 2000, L327, 1–72. [Google Scholar]
- Sfriso, A.; Facca, C.; Ghetti, P.F. Validation of the Macrophyte Quality Index (MaQI) set up to assess the ecological status of Italian marine transitional environments. Hydrobiologia 2009, 617, 117–141. [Google Scholar] [CrossRef]
- Sfriso, A.; Facca, C.; Bonometto, A.; Boscolo, R. Compliance of the macrophyte quality index (MaQI) with the WFD (2000/60/EC) and ecological status assessment in transitional areas: The Venice lagoon as study case. Ecol. Indic. 2014, 46, 536–547. [Google Scholar] [CrossRef]
- ISPRA. Implementazione della Direttiva 2000/60/CE—Linea Guida per L’applicazione Dell’indice MaQI (ISPRA, 2010. Implementation of the Directive 2000/60/CE—Guidelines for the Application of MaQI Index); ISPRA: Ispra, Italy, 2010. [Google Scholar]
- Wilkinson, M. Benthic estuarine algae and their environment: A review. In The Shore Environment: Methods and Ecosytems; Price, J.H., Irvine, D.E.G., Farnham, W.F., Eds.; Academic Press: London, UK, 1980; Volume 2, pp. 425–486. [Google Scholar]
- Russell, G. Salinity and seaweed vegetation. In The Physiological Vegetation of Amphibious and Intertidal Plants; Crawford, R.M., Ed.; Blackwell: Oxford, UK, 1987; pp. 32–35. [Google Scholar]
- Christia, C.; Giordani, G.; Papastergiadou, E. Environmental Variability and Macrophyte Assemblages in Coastal Lagoon Types of Western Greece (Mediterranean Sea). Water 2018, 10, 151. [Google Scholar] [CrossRef]
- Ferrarin, F.; Rapaglia, J.; Zaggia, L.; Umgiesser, G.; Zuppi, G.M. Coincident application of a mass balance of radium and a hydrodynamic model for the seasonal quantification of groundwater flux into the Venice Lagoon, Italy. Mar. Chem. 2008, 10, 179–188. [Google Scholar] [CrossRef]
- Krumgalz, B.S.; Hornung, H.; Oren, O.H. The study of a natural hypersaline lagoon in a desert area (the Bardawil Lagoon in Northern Sinai). Estuar. Coast. Mar. Sci. 1980, 10, 403–415. [Google Scholar] [CrossRef]
- Boutron, O.; Paugam, C.; Luna-Laurent, E.; Chauvelon, P.; Sous, D.; Rey, V.; Meulé, S.; Chérain, Y.; Cheiron, A.; Migne, E. Hydro-Saline Dynamics of a Shallow Mediterranean Coastal Lagoon: Complementary Information from Short and Long Term Monitoring. J. Mar. Sci. Eng. 2021, 9, 701. [Google Scholar] [CrossRef]
- Silva, E.I.L.; Katupotha, J.; Amarasinghe, O.; Manthrithilake, H.; Ariyaratna, R. Lagoons of Sri Lanka: From the Origins to the Present; International Water Management Institute: Colombo, Sri Lanka, 2013. [Google Scholar]
- Bamber, R.N.; Batten, S.D.; Sheader, M.; Bridgwater, M.D. On the ecology of brackish water lagoons in Great Britain. Aquat. Conserv. Mar. Freshw. Ecosyst. 1992, 2, 65–94. [Google Scholar] [CrossRef]
- Kristiansen, A.; Pedersen, P.M.; Moseholm, L. Salinity-temperature effects on growth and reproduction of Scytosiphon lomentaria (Fucophyceae) along the salinity gradient in Danish waters. Phycologia 1994, 33, 444–454. [Google Scholar] [CrossRef]
- Düwel, L. Experimental Studies on Macroalgae along the Salinity Gradient in the Baltic Sea Area. Ph.D. Thesis, Botanical Institute, Faculty of Science, University of Copenhagen, Copenhagen, Denmark, 2001. [Google Scholar]
- Remane, A. Die Brackwasserfauna; Verhandlungen der Deutsche Zoologischen Gesellschaft: Greifswald, Germany, 1934; pp. 34–74. [Google Scholar]
- Adams, J.B.; Knoop, W.T.; Bate, G.C. The distribution of estuarine macrophytes in relation to freshwater. Bot. Mar. 1992, 35, 215–226. [Google Scholar] [CrossRef]
- Schubert, H.; Feuerpfeil, P.; Marquardt, R.; Telesh, I.; Skarlato, S. Macroalgal diversity along the Baltic Sea salinity gradient challenges Remane’s species-minimum concept. Mar. Pollut. 2011, 62, 1948–1956. [Google Scholar] [CrossRef] [PubMed]
- ISPRA. Guida alla Tipizzazione dei Corpi Idrici di Transizione ed alla Definizione delle Condizioni di Riferimento ai Sensi della Direttiva 2000/60/CE (ISPRA, 2007. Guide to the Typology of Transitional Water Bodies and to the Definition of Reference Conditions Following the Directive 2000/60/CE); ISPRA: Ispra, Italy, 2007. [Google Scholar]
- Battaglia, B. Final resolution of the symposium on the classification of brackish waters. Arch. Oceanogr. Limnol. 1959, 11, 243–248. [Google Scholar]
- Basset, A.; Sabetta, L.; Fonnesu, A.; Mouillot, D.; Do Chi, T.; Viaroli, P.; Giordani, G.; Reizopoulou, S.; Abbiati, M.; Carrada, G.C. Typology in Mediterranean transitional waters: New challenges and perspectives. Aquat. Conserv. 2006, 16, 441–455. [Google Scholar] [CrossRef]
- Cecere, E.; Petrocelli, A.; Izzo, G.; Sfriso, A. Flora and Vegetation of the Italian Transitional Water Systems; CoRiLa, Multigraf: Spinea, Italy, 2009; 278p. [Google Scholar]
- Varvaglione, B.; Sabetta, L.; Basset, A. Tra Terra e Mare. Ecoguida alla Scoperta Delle Lagune e dei Laghi Costieri in Puglia (Between Earth and Sea. Eco-Guide to the Discovering of Lagoons and Coastal Lakes in the Apulian Region). Ph.D. Thesis, University of Lecce, Lecce, Italy, 2006. [Google Scholar]
- Apulian Region. Regional Water Protection Plan, Water Protection Service, General Report Area, 2009. Available online: https://www.sit.puglia.it (accessed on 6 March 2023). (In Italian).
- ISPRA. Protocols for Sampling and Determination of the Biological and the Physicochemical Quality in the Framework of the Transitional Water Monitoring Programs ex 2000/60/EC; ISPRA: Ispra, Italy, 2011. [Google Scholar]
- Guiry, M.D.; Guiry, G.M. AlgaeBase; World-Wide Electronic Publication, National University of Ireland: Galway, Ireland, 2022; Available online: https://www.algaebase.org (accessed on 6 March 2023).
- Lucena-Moya, P.; Pardo, I.; Álvarez, M. Development of a typology for transitional waters in the Mediterranean ecoregion: The case of the islands. Estuar. Coast. Shelf Sci. 2009, 82, 61–72. [Google Scholar] [CrossRef]
- Carstens, M.; Claussen, U.; Bergemann, M.; Gaumert, T. Transitional waters in Germany: The Elbe estuary as an example. Aquat. Conserv. 2004, 14, 81–92. [Google Scholar] [CrossRef]
- Boix, D.; Gascón, S.; Sala, J.; Martinoy, M.; Gifre, J.; Quintana, X.D. A new index of water quality assessment in Mediterranean wetlands based on crustacean and insect assemblages: The case of Catalunya (NE Iberian peninsula). Aquat. Conserv. 2005, 15, 635–651. [Google Scholar] [CrossRef]
- Ferreira, J.G.; Nobre, A.M.; Simas, T.C.; Silva, M.C.; Newton, A.; Bricker, S.B.; Wolff, W.J.; Stacey, P.E.; Sequeira, A. A methodology for defining homogeneous water bodies in estuaries e application to the transitional systems of the EU water Framework Directive. Estuar. Coast. Shelf Sci. 2006, 66, 468–482. [Google Scholar] [CrossRef]
- Kagalou, I.; Leonardos, I. Typology, classification and management issues of Greek lakes: Implication of the Water Framework Directive (2000/60/EC). Environ. Monit. Assess. 2009, 150, 469–484. [Google Scholar] [CrossRef]
- Por, F.D. A classification of hypersaline waters, based on trophic criteria. Mar. Ecol. 1980, 1, 121–131. [Google Scholar] [CrossRef]
- Wortmann, J.; Hearne, J.W.; Adams, J.B. Evaluating the effects of freshwater inflow on the distribution of estuarine macrophytes. Ecol. Modell. 1998, 106, 213–232. [Google Scholar] [CrossRef]
- Menéndez, M.; Hernandez, O.; Comin, F.A. Spatial distribution and ecophysiological characteristics of macrophytes in a Mediterranean coastal lagoon. Estuar. Coast. Shelf Sci. 2002, 55, 403–413. [Google Scholar] [CrossRef]
- Greve, T.M.; Binzer, T. Which Factors Regulate Seagrass Growth and Distribution? In European Seagrasses: An Introduction to Monitoring and Management; Borum, J., Duarte, C.M., Krause-Jensen, D., Greve, T.M., Eds.; The M&Ms Project: Hillerød, Denmark, 2004; pp. 19–23. [Google Scholar]
- Casagranda, C.; Boudouresque, C.F. Biomass of Ruppia cirrhosa and Potamogeton pectinatus in a Mediterranean brackish lagoon, Lake Ichkeul, Tunisia. Fundam. Appl. Limnol. 2007, 168, 243. [Google Scholar] [CrossRef]
- Christia, C.; Papastergiadou, E.S. Spatial and temporal variations of aquatic macrophytes and water quality in six coastal lagoons of western Greece. Belg. J. Bot. 2007, 140, 39–50. [Google Scholar]
- Obrador, B.; Moreno-Ostos, E.; Pretus, J.L. A Dynamic Model to Simulate Water Level and Salinity in a Mediterranean Coastal Lagoon. Estuaries Coasts 2008, 31, 1117–1129. [Google Scholar] [CrossRef]
- Antunes, C.; Correia, O.; da Silva, J.M.; Cruces, A.; da Conceição Freitas, M.; Branquinho, C. Factors involved in spatiotemporal dynamics of submerged macrophytes in a Portuguese coastal lagoon under Mediterranean climate. Estuar. Coast. Shelf Sci. 2012, 110, 93–100. [Google Scholar] [CrossRef]
- Pérez-Ruzafa, A.; Fernández, A.I.; Marcos, C.; Gilabert, J.; Quispe, J.I.; García-Charton, J.A. Spatial and temporal variations of hydrological conditions, nutrients and chlorophyll in a Mediterranean coastal lagoon (Mar Menor, Spain). Hydrobiologia 2005, 550, 11–27. [Google Scholar] [CrossRef]
- Franco, A.; Franzoi, P.; Torricelli, P. Structure and functioning of Mediterranean lagoon fish assemblages: A key for the identification of water body types. Estuar. Coast. Shelf Sci. 2008, 79, 549–558. [Google Scholar] [CrossRef]
- Graham, L.; Graham, J.; Wilcox, L. Algae; Pearson Education, Inc.: San Francisco, CA, USA, 2009. [Google Scholar]
- Boegle, M.G.; Schneider, S.; Mannschreck, B.; Melzer, A. Differentiation of Chara intermedia and C. baltica compared to C. hispida based on morphology and amplified fragment length polymorphism. Hydrobiologia 2007, 586, 155–166. [Google Scholar] [CrossRef]
- den Hartog, C. The Seagrasses of the World; North Holland: Amsterdam, The Netherlands, 1970. [Google Scholar]
- Aiello, G.; Barra, D.; Coppa, M.G.; Valente, A.; Zeni, F. Recent infralittoral foraminiferida and ostracoda from the porto Cesareo Lagoon (Ionian Sea, Mediterranean). Boll. Soc. Paleontol. 2006, 45, 1. [Google Scholar]
- Cardellicchio, N.; Annicchiarico, C.; Di Leo, A.; Giandomenico, S.; Spada, L. The Mar Piccolo of Taranto: An interesting marine ecosystem for the environmental problems studies. Environ. Sci. Pollut. Res. 2016, 23, 12495–12501. [Google Scholar] [CrossRef]
- Cecere, E.; Petrocelli, A.; Saracino, O.D. Biodiversity of phytobenthic communities in the marine reserve of Porto Cesareo. Biol. Mar. Medit. 2005, 12, 78–87. [Google Scholar]
- den Hartog, C.; Triest, L. A profound view and discourse on the typification and status of three confused taxa: Ruppia maritima, R. spiralis and R. cirrhosa. Bot. Mar. 2020, 63, 229–239. [Google Scholar] [CrossRef]
- Sfriso, A.; Curiel, D.; Rismondo, A. The Venice Lagoon. In Flora and Vegetation of the Italian Transitional Water Systems; Cecere, E., Petrocelli, A., Izzo, G., Sfriso, A., Eds.; CoRiLa, Multigraf: Spinea, Italy, 2009; pp. 17–80. [Google Scholar]
- Laugier, T.; Rigollet, V.; de Casabianca, M.L. Seasonal dynamics in mixed eelgrass beds, Zostera marina L. and Z. noltii Hornem., in a Mediterranean coastal lagoon (Thau lagoon, France). Aquat. Bot. 1999, 63, 51–69. [Google Scholar] [CrossRef]
- Bonometto, A.; Ponis, E.; Cacciatore, F.; Riccardi, E.; Pigozzi, S.; Parati, P.; Novello, M.; Ungaro, N.; Acquavita, A.; Manconi, P.; et al. A New Multi-Index Method for the Eutrophication Assessment in Transitional Waters: Large-Scale Implementation in Italian Lagoons. Environments 2022, 9, 41. [Google Scholar] [CrossRef]
- Sfriso, A.; Facca, C.; Bon, D.; Buosi, A. Macrophytes and ecological status assessment in the Po delta transitional systems, Adriatic Sea (Italy). Application of Macrophyte Quality Index (MaQI). Acta Adriat. 2016, 57, 209–225. [Google Scholar]
- Wallentinus, I. The Baltic Sea. Ecosys. World 1991, 24, 83–108. [Google Scholar]
- Sfriso, A.; Buosi, A.; Facca, C.; Sfriso, A. Role of environmental factors in affecting macrophyte dominance in transitional environments: The Italian Lagoons as a study case. Mar. Ecol. 2017, 38. [Google Scholar] [CrossRef]
- Akasaka, M.; Takamura, N. Hydrologic connection between ponds positively affects macrophyte α and γ diversity but negatively affects β diversity. Ecology 2012, 93, 967–973. [Google Scholar] [CrossRef]
- Konstantinidis, I.; Gkafas, G.A.; Papathanasiou, V.; Orfanidis, S.; Küpper, F.C.; Arnaud-Haond, S.; Exadactylos, A. Biogeography pattern of the marine angiosperm Cymodocea nodosa in the eastern Mediterranean Sea related to the quaternary climatic changes. Ecol. Evol. 2022, 12. [Google Scholar] [CrossRef]
- Robinson, B.J.O.; Morley, S.A.; Rizouli, A.; Sarantopoulou, J.; Gkafas, G.A.; Exadactylos, A.; Küpper, F.C. New confirmed depth-limit of Antarctic macroalgae: Palmaria decipiens found at 100 m depth in the Southern Ocean. Polar. Biol. 2022, 45, 1459–1463. [Google Scholar] [CrossRef]
- Adams, J.B.; Bate, G.C.; O’Callaghan, M. Primary producers. In Estuaries of South Africa; Allanson, B.R., Baird, D., Eds.; Cambridge University Press: Cambridge, UK, 1999; pp. 91–117. [Google Scholar]
- Hayakawa, Y.I.; Ogawa, T.; Yoshikawa, S.; Ohki, K.; Kamiya, M. Genetic and ecophysiological diversity of Cladophora (Cladophorales, Ulvophyceae) in various salinity regimes. Phycol. Res. 2012, 60, 86–97. [Google Scholar] [CrossRef]
- Rybak, A.S. Species of Ulva (Ulvophyceae, Chlorophyta) as indicators of salinity. Ecol. Indic. 2018, 85, 253–261. [Google Scholar] [CrossRef]


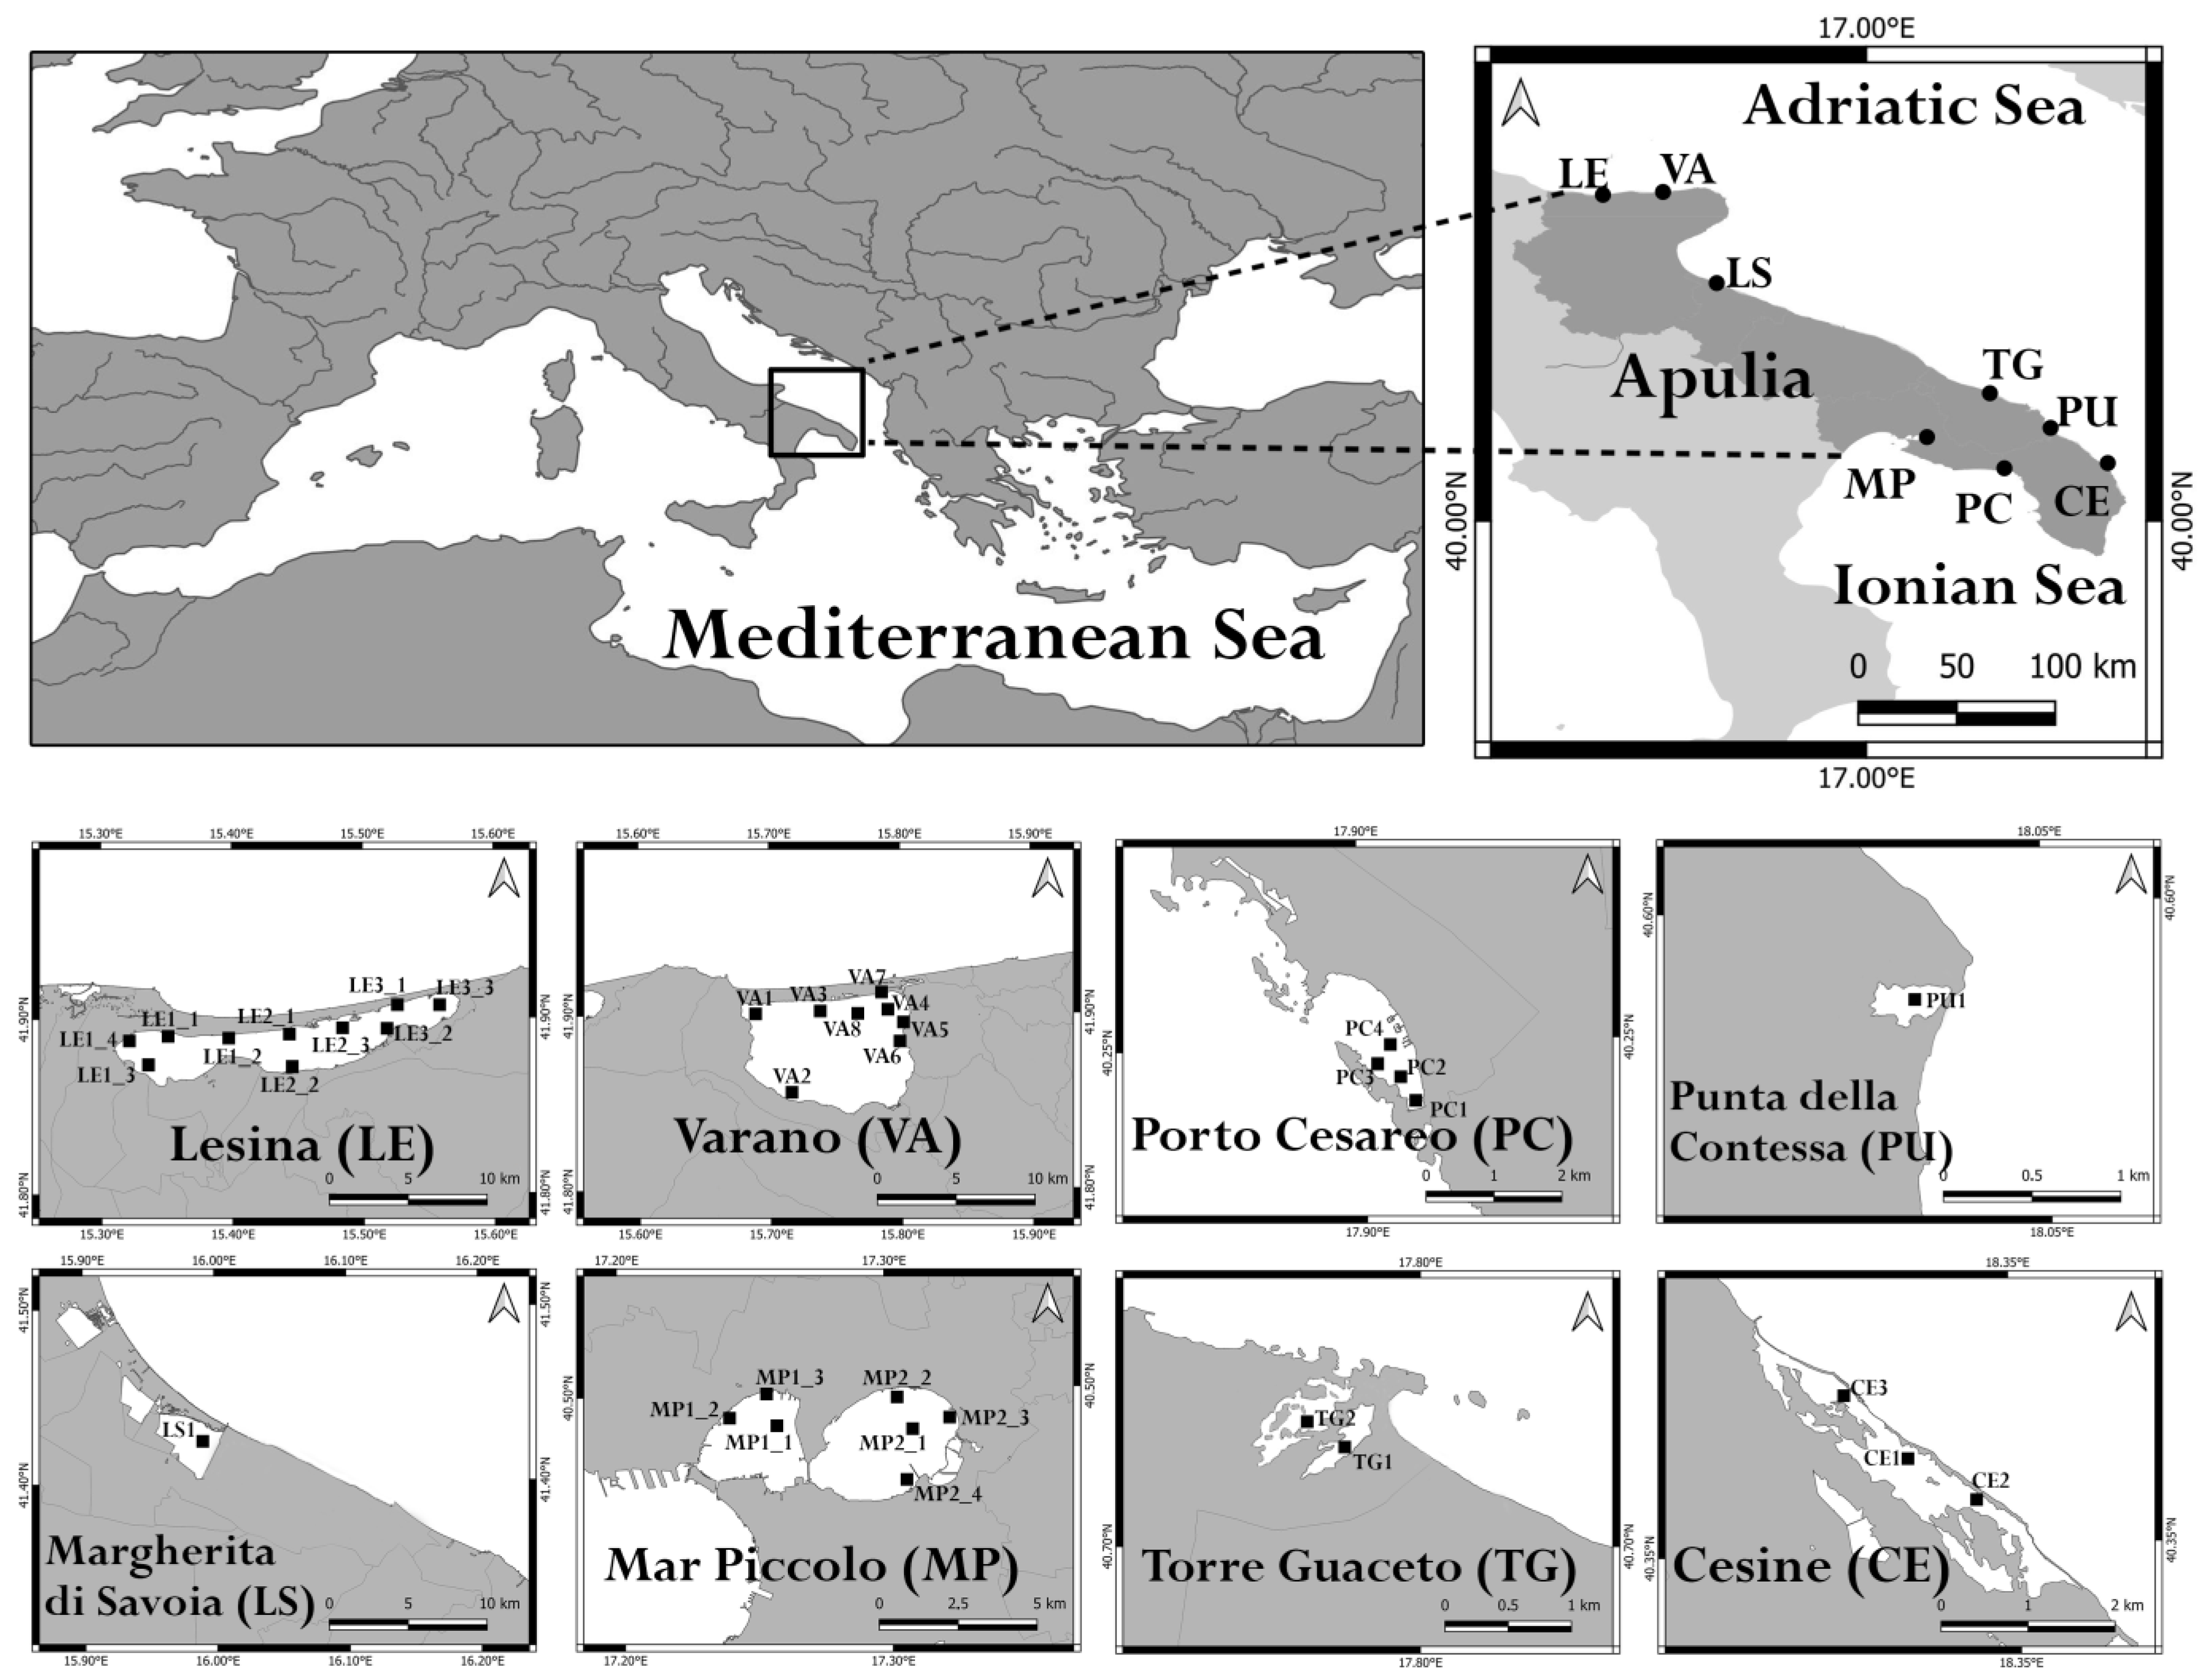
| WB | Coordinates | Surface Area (km2) | Depth (m) | Salinity Class (PSU) * |
|---|---|---|---|---|
| Torre Guaceto (TG) | 40°42′51.34″ N–17°47′42.91″ E | 1.2 | 0.4–0.6 | Mesohaline (5–20) |
| Cesine (CE) | 40°21′33.46″ N–18°20′09.30″ E | 0.7 | 0.2–0.8 | Mesohaline (5–20) |
| Lesina (LE1) | 41°53′12.64″ N–15°21′15.65″ E | 18 | 0.7–2 | Polyhaline (20–30) |
| Lesina (LE2) | 41°53′01.23″ N–15°27′20.15″ E | 17 | 0.7–2 | Polyhaline (20–30) |
| Lesina (LE3) | 41°53′57.20″ N–15°31′00.45″ E | 16 | 0.7–2 | Polyhaline (20–30) |
| Varano (VA) | 41°52′43.65″ N–15°44′35.42″ E | 60.5 | 0.5–5 | Polyhaline (20–30) |
| Porto Cesareo (PC) | 40°14′31.80″ N–17°54′32.82″ E | 2 | 0.3–5 | Euhaline (30–40) |
| Mar Piccolo (MP1) | 40°29′19.68″ N–17°15′29.51″ E | 9.7 | 0.5–12 | Euhaline (30–40) |
| Mar Piccolo (MP2) | 40°29′22.92″ N–17°18′29.18″ E | 11 | 0.5–12 | Euhaline (30–40) |
| Margherita di Savoia (LS) | 41°25′27.34″ N–15°59′53.29″ E | 8.5 | 0.4–0.6 | Hyperhaline (>40) |
| Punta della Contessa (PU) | 40°35′42.31″ N–18°02′30.05″ E | 2 | 0.4–1 | Hyperhaline (>40) |
| HH | EH | PH | MH | |
|---|---|---|---|---|
| MAGNOLIOPHYTA | ||||
| Alismatales | ||||
| Cymodocea nodosa | +++ | + | ||
| Ruppia spiralis | ++++ | ++ | ++ | |
| Zannichellia palustris | + | |||
| Zostera marina | + | |||
| Zostera noltei | ++++ | |||
| Saxifragales | ||||
| Myriophyllum spicatum | + | |||
| CHAROPHYTA | ||||
| Charales | ||||
| Chara baltica | +++ | |||
| Chara contraria | + | |||
| Lamprothamnium papulosum | + | |||
| Lamprothamnium succinctum | + | |||
| Zygnematales | ||||
| Spirogyra sp. | ++++ | |||
| Zygnema sp. | + | |||
| CHLOROPHYTA | ||||
| Bryopsidales | ||||
| Bryopsis cupressina | + | |||
| Bryopsis hypnoides | + | |||
| Bryopsis secunda | + | |||
| Caulerpa cylindracea | + | |||
| Caulerpa prolifera | + | |||
| Codium bursa | + | |||
| Derbesia tenuissima | + | + | + | |
| Halimeda tuna | + | |||
| Pedobesia simplex | + | |||
| Cladophorales | ||||
| Aegagropila linnaei | + | + | + | |
| Anadyomene stellata | ++ | |||
| Chaetomorpha aerea | ++ | + | ||
| Chaetomorpha ligustica | + | |||
| Chaetomorpha linum | + | ++ | + | |
| Chaetomorpha tortuosa | + | + | + | + |
| Cladophora albida | + | + | ||
| Cladophora coelothrix | + | |||
| Cladophora dalmatica | + | + | + | |
| Cladophora fracta | + | + | + | |
| Cladophora glomerata | + | + | + | |
| Cladophora hutchinsiae | + | |||
| Cladophora laetevirens | + | |||
| Cladophora lehmanniana | + | + | ||
| Cladophora liniformis | + | + | ||
| Cladophora prolifera | + | + | ||
| Cladophora rupestris | + | + | ||
| Cladophora sericea | ++ | + | ||
| Cladophora vadorum | + | + | + | ++ |
| Cladophora vagabunda | ++ | + | + | |
| Cladophoropsis membranacea | + | |||
| Lychaete echinus | + | + | ||
| Rhizoclonium riparium | + | |||
| Valonia macrophysa | + | |||
| Valonia utricularis | ++ | |||
| Dasycladales | ||||
| Acetabularia acetabulum | + | |||
| Dasycladus vermicularis | + | |||
| Ulotrichales | ||||
| Ulothrix flacca | + | |||
| Ulothrix implexa | + | + | + | |
| Urospora penicilliformis | ++ | + | + | |
| Ulvales | ||||
| Blidingia marginata | + | |||
| Blidingia minima | + | |||
| Ulva australis | + | + | + | |
| Ulva clathrata | + | + | ||
| Ulva compressa | + | + | + | |
| Ulva curvata | + | + | ||
| Ulva flexuosa | + | + | + | |
| Ulva intestinalis | +++ | + | + | + |
| Ulva kylinii | + | |||
| Ulva linza | + | |||
| Ulva prolifera | ++ | + | ||
| Ulva prolifera subsp. blidingiana | + | |||
| Ulva pseudorotundata | + | + | ||
| Ulva rigida | + | + | ||
| Ulvaria obscura | + | |||
| Ulvella lens | + | |||
| Ulvella viridis | + | + | ||
| Umbraulva dangeardii | + | |||
| OCHROPHYTA-Phaeophyceae | ||||
| Dictyotales | ||||
| Dictyota dichotoma | ++ | |||
| Dictyota dichotoma var. intricata | + | |||
| Dictyota implexa | + | |||
| Dictyota mediterranea | + | |||
| Padina ditristromatica | + | |||
| Padina pavonica | + | |||
| Ectocarpales | ||||
| Ectocarpus fasciculatus | + | |||
| Ectocarpus siliculosus | + | |||
| Pylaiella littoralis | + | |||
| Scytosiphon lomentaria | + | + | ||
| Fucales | ||||
| Cystoseira aurantia | + | |||
| Cystoseira compressa | + | |||
| Gongolaria barbata | +++ | + | ||
| RHODOPHYTA | ||||
| Acrochaetiales | ||||
| Acrochaetium secundatum | + | |||
| Bangiales | ||||
| Neoyropia leucosticta | + | + | ||
| Bonnemaisoniales | ||||
| Asparagopsis taxiformis | ++ | |||
| Ceramiales | ||||
| Acrosorium ciliolatum | + | |||
| Aglaothamnion feldmanniae | + | |||
| Aglaothamnion tenuissimum | + | |||
| Aglaothamnion tripinnatum | + | |||
| Alsidium corallinum | + | + | ||
| Alsidium helminthochorton | + | |||
| Anotrichium furcellatum | + | |||
| Antithamnion cruciatum | + | |||
| Carradoriella denudata | + | + | ||
| Carradoriella elongata | + | |||
| Ceramium ciliatum | + | |||
| Ceramium cimbricum | + | ++ | ||
| Ceramium cimbricum f. flaccidum | + | |||
| Ceramium codii | + | |||
| Ceramium deslongchampsii | + | + | ||
| Ceramium diaphanum | + | ++ | ||
| Ceramium echionotum | + | + | ||
| Ceramium siliquosum | + | + | ||
| Ceramium tenerrimum | + | + | ||
| Chondria capillaris | + | + | +++ | |
| Chondria coerulescens | + | |||
| Chondria dasyphylla | + | + | ||
| Chondria polyrhiza | + | |||
| Dasya pedicellata | + | +++ | ||
| Dasya ocellata | + | |||
| Gayliella mazoyerae | + | + | ||
| Griffithsia opuntioides | + | |||
| Griffithsia schousboei | + | |||
| Herposiphonia secunda | + | + | ||
| Heterosiphonia crispella | + | |||
| Hypoglossum hypoglossoides | + | |||
| Laurencia obtusa | + | |||
| Leptosiphonia fibrillosa | + | + | + | |
| Lophosiphonia cristata | + | |||
| Lophosiphonia obscura | + | + | + | + |
| Melanothamnus harveyi | + | + | ||
| Osmundea oederi | + | |||
| Palisada perforata | + | |||
| Palisada thuyoides | + | |||
| Polysiphonia atlantica | + | + | ||
| Polysiphonia opaca | + | |||
| Polysiphonia stricta | ++ | + | ||
| Pterothamnion crispum | + | |||
| Rytiphlaea tinctoria | + | |||
| Spyridia filamentosa | ++ | + | ||
| Vertebrata fruticulosa | + | |||
| Vertebrata fucoides | + | |||
| Vertebrata furcellata | + | + | + | |
| Vertebrata reptabunda | + | |||
| Wrangelia penicillata | + | |||
| Colaconematales | ||||
| Colaconema caespitosum | + | |||
| Colaconema corymbiferum | + | |||
| Colaconema daviesii | + | + | ||
| Corallinales | ||||
| Amphiroa rigida | + | |||
| Corallina officinalis | + | |||
| Ellisolandia elongata | + | |||
| Hydrolithon cruciatum | + | + | ||
| Hydrolithon farinosum | + | + | ||
| Jania rubens | + | |||
| Jania virgata | + | |||
| Melobesia membranacea | + | + | ||
| Pneophyllum fragile | + | |||
| Titanoderma pustulatum | + | |||
| Erythropeltales | ||||
| Erythrotrichia carnea | + | + | ||
| Gelidiales | ||||
| Gelidium crinale | + | + | ||
| Pterocladiella capillacea | + | |||
| Gigartinales | ||||
| Caulacanthus ustulatus | + | |||
| Chondracanthus acicularis | + | |||
| Chondracanthus teedei | + | |||
| Feldmannophycus rayssiae | + | |||
| Gymnogongrus griffithsiae | + | + | ||
| Hypnea corona | + | |||
| Hypnea musciformis | + | |||
| Hypnea spinella | + | |||
| Schmitziella endophloea | + | |||
| Wurdemannia miniata | + | + | ||
| Gracilariales | ||||
| Gracilaria bursa-pastoris | + | |||
| Gracilaria gracilis | ++ | ++ | ||
| Gracilaria longa | + | |||
| Halymeniales | ||||
| Grateloupia filicina | + | + | ||
| Rhodymeniales | ||||
| Champia parvula | + | + | ||
| Chylocladia verticillata | + | |||
| Lomentaria articulata | + | |||
| Rhodymenia ardissonei | + | |||
| Rhodymenia sp. | + | |||
| Stylonematales | ||||
| Stylonema alsidii | + | |||
| Pairwise ANOSIM | R-Values | p-Values |
|---|---|---|
| hyperhaline vs. euhaline | 1 | 0.1019 |
| hyperhaline vs. polyhaline | 1 | 0.0649 |
| hyperhaline vs. mesohaline | 1 | 0.3290 |
| euhaline vs. polyhaline | 0.9630 | 0.0278 * |
| euhaline vs. mesohaline | 1 | 0.0986 |
| polyhaline vs. mesohaline | 1 | 0.0659 |
| Global ANOSIM | R-values | p-values |
| 0.9545 | 0.0002 *** |
| TAXON | Av. Abund. | Av. Sim. | Contrib. % | Cum. % | Group Av. Sim. % | |
|---|---|---|---|---|---|---|
| MESO HALINE | Spirogyra sp. | 80.92 | 22.76 | 58.20 | 58.20 | 39.11 |
| Cladophora vadorum | 40.83 | 12.41 | 31.75 | 89.95 | ||
| Chara baltica | 56.33 | 3.93 | 10.05 | 100.00 | ||
| POLYHALINE | Zostera noltei | 76.66 | 12.49 | 22.65 | 22.65 | 55.15 |
| Chondria capillaris | 63.03 | 10.92 | 19.79 | 42.45 | ||
| Dasya pedicellata | 56.25 | 8.60 | 15.60 | 58.05 | ||
| Ceramium cimbricum | 32.04 | 4.31 | 7.82 | 65.86 | ||
| Ceramium diaphanum | 30.61 | 3.82 | 6.93 | 72.79 | ||
| Ceramium deslongchampsii | 23.91 | 3.73 | 6.77 | 79.57 | ||
| Ruppia spiralis | 37.50 | 2.50 | 4.53 | 84.10 | ||
| Gracilaria gracilis | 26.35 | 1.63 | 2.96 | 87.06 | ||
| Cladophora vadorum | 7.81 | 1.40 | 2.53 | 89.59 | ||
| EUHALINE | Gongolaria barbata | 50.06 | 3.23 | 10.97 | 10.97 | 29.49 |
| Cymodocea nodosa | 51.19 | 3.18 | 10.79 | 21.76 | ||
| Valonia utricularis | 37.50 | 3.00 | 10.16 | 31.93 | ||
| Chaetomorpha aerea | 44.58 | 2.74 | 9.29 | 41.22 | ||
| Ceramium deslongchampsii | 23.75 | 2.67 | 9.06 | 50.28 | ||
| Dictyota dichotoma | 31.81 | 2.34 | 7.93 | 58.21 | ||
| Spyridia filamentosa | 32.08 | 2.16 | 7.31 | 65.52 | ||
| Gracilaria gracilis | 26.94 | 1.55 | 5.27 | 70.80 | ||
| Cladophora prolifera | 19.03 | 1.11 | 3.76 | 74.55 | ||
| Chaetomorpha linum | 17.94 | 0.92 | 3.13 | 77.69 | ||
| Hypnea corona | 13.47 | 0.78 | 2.64 | 80.32 | ||
| Rhodymenia ardissonei | 16.03 | 0.64 | 2.17 | 82.50 | ||
| Cladophora vagabunda | 4.58 | 0.52 | 1.77 | 84.26 | ||
| Cladophora laetevirens | 6.11 | 0.49 | 1.65 | 85.92 | ||
| Ceramium diaphanum | 4.72 | 0.41 | 1.40 | 87.32 | ||
| Gayliella mazoyerae | 3.89 | 0.34 | 1.17 | 88.48 | ||
| Carradoriella denudata | 2.78 | 0.32 | 1.07 | 89.55 | ||
| HYPERHALINE | Ruppia spiralis | 100.00 | 20.02 | 42.74 | 42.74 | 46.85 |
| Ulva intestinalis | 57.50 | 10.01 | 21.37 | 64.10 | ||
| Ulva prolifera | 42.00 | 5.81 | 12.39 | 76.50 | ||
| Urospora penicilliformis | 28.00 | 5.61 | 11.97 | 88.46 | ||
| Polysiphonia stricta | 27.00 | 5.41 | 11.54 | 100.00 |
Disclaimer/Publisher’s Note: The statements, opinions and data contained in all publications are solely those of the individual author(s) and contributor(s) and not of MDPI and/or the editor(s). MDPI and/or the editor(s) disclaim responsibility for any injury to people or property resulting from any ideas, methods, instructions or products referred to in the content. |
© 2023 by the authors. Licensee MDPI, Basel, Switzerland. This article is an open access article distributed under the terms and conditions of the Creative Commons Attribution (CC BY) license (https://creativecommons.org/licenses/by/4.0/).
Share and Cite
Tursi, A.; Lisco, A.; Chimienti, G.; Mastrototaro, F.; Ungaro, N.; Bottalico, A. Salinity as a Key Factor in Structuring Macrophyte Assemblages in Transitional Water Bodies: The Case of the Apulian Coastal Lagoons (Southern Italy). Diversity 2023, 15, 615. https://doi.org/10.3390/d15050615
Tursi A, Lisco A, Chimienti G, Mastrototaro F, Ungaro N, Bottalico A. Salinity as a Key Factor in Structuring Macrophyte Assemblages in Transitional Water Bodies: The Case of the Apulian Coastal Lagoons (Southern Italy). Diversity. 2023; 15(5):615. https://doi.org/10.3390/d15050615
Chicago/Turabian StyleTursi, Andrea, Anna Lisco, Giovanni Chimienti, Francesco Mastrototaro, Nicola Ungaro, and Antonella Bottalico. 2023. "Salinity as a Key Factor in Structuring Macrophyte Assemblages in Transitional Water Bodies: The Case of the Apulian Coastal Lagoons (Southern Italy)" Diversity 15, no. 5: 615. https://doi.org/10.3390/d15050615
APA StyleTursi, A., Lisco, A., Chimienti, G., Mastrototaro, F., Ungaro, N., & Bottalico, A. (2023). Salinity as a Key Factor in Structuring Macrophyte Assemblages in Transitional Water Bodies: The Case of the Apulian Coastal Lagoons (Southern Italy). Diversity, 15(5), 615. https://doi.org/10.3390/d15050615