Communication

Temporal Trends in Skull Morphology of the European Bison from the 1950s to the Present Day

1
Department of Morphological Sciences, Institute of Veterinary Medicine, Warsaw University of Life Sciences-SGGW, 02-776 Warsaw, Poland
2
Department of Animal Genetics and Conservation, Warsaw University of Life Sciences—SGGW, 02-786 Warsaw, Poland
3
Mammal Research Institute, Polish Academy of Sciences, 17-230 Białowieża, Poland
*
Author to whom correspondence should be addressed.
Diversity 2023, 15(3), 377; https://doi.org/10.3390/d15030377
Submission received: 29 December 2022 / Revised: 22 February 2023 / Accepted: 4 March 2023 / Published: 6 March 2023
(This article belongs to the Special Issue Conservation of Bison Populations – Achievements and Problems)

Abstract

:
The shape and size of the skull are determined by various factors. These factors act not only on single individuals in their ontogenesis, but can affect entire populations in the long term, thus determining developmental trends. The aim of this study was to determine whether the craniometric features of the European bison skull and their proportions are constant or change over time. In total, 1097 European bison skulls from the Mammal Research Institute of the Polish Academy of Sciences and Warsaw University of Life Sciences were examined. It has been shown that almost all examined skull dimensions tend to decrease. The opposite phenomenon was observed for the height of the skull in males. The results of the work prove that European bison adapt to changing environmental conditions related to climate warming, food availability, and population density.

1. Introduction

The skull is anatomically complex and phylogenetically diverse, and therefore offers unique opportunities to examine the role of developmental processes in evolutionary change [1,2]. The shape and size of the skull are determined, inter alia, by the development of the encephalon. Logan and Clutton-Brock [3] compared linear measurements and computed tomography scans for estimating the endocranial volume in red deer. They suggested validating measurements for estimating brain size and its intraspecific and interspecific variation. Finarelli [4] proposed a model predicting the cranial cavity volume based on external skull measurements in carnivores. The structure of the skull depends also on environmental factors and lifestyle [5]. One of the most important factors affecting the shape of the skull is diet [6]. In ruminants, the strong skull and horns or antlers located on the head are the main weapon in the defense against predators, and against other males in fights during the heat season [7]. The latter function greatly influences the morphology of the head skeleton [8]. Therefore, in these animals, a fairly pronounced sexual dimorphism is observed [9].
The morphology of European bison skulls has been analyzed selectively so far. All the osteometric studies to date have been based on bone material from European bison living in a similar period. The small size of the population did not allow for a reliable analysis of developmental trends in these animals in the past. Kobryńczuk et al. [10] analyzed the polarization of the European bison skull shape. They invesigated the variability of the face shape and found two dominant variants in males. Krasińska et al. [11] explored the morphometric variation of the skull during postnatal development in the Lowland European bison. Krasinska [12] analyzed the variability of the skull shape in hybrids between European bison and domestic cattle. Considering, however, that data on the European bison are collected by generations of scientists due to the status of the species, there is an opportunity to perform a cross-sectional analysis of the morphology of the European bison skulls over time. The European bison’s sculls have been collected since the 1950s in research institutions. At that time, the studies of the population in Bialowieska Forest were considerably developed as a result of international cooperation [13,14]. Currently, many skulls are also kept in the collections of various institutions, including museums, which is a significant comparative material. Therefore, we aimed in this study to verify whether the craniometric features and their proportions are constant or change over time with the development of the population. This was possible thanks to the rich collection of European bison skulls gathered from almost the beginning of the restitution of this species.

2. Materials and Methods

The skulls of 1097 adult European bison (549 females and 548 males) from the collection of the Mammal Research Institute of the Polish Academy of Sciences in Białowieża and the Osteological Museum of the Department of Morphological Sciences of the Institute of Veterinary Medicine, Warsaw University of Life Sciences, were taken for research. The skulls came from the European bison that died in the years 1950–2014.
The date of birth of each animal was calculated by subtracting the age of the individual from the year of acquisition.
The skulls were subjected to osteometric measurements with a digital caliper with an accuracy of 1mm. The measurement points proposed by von den Driesch [15] were used (Figure 1).
The following measurements have been taken:
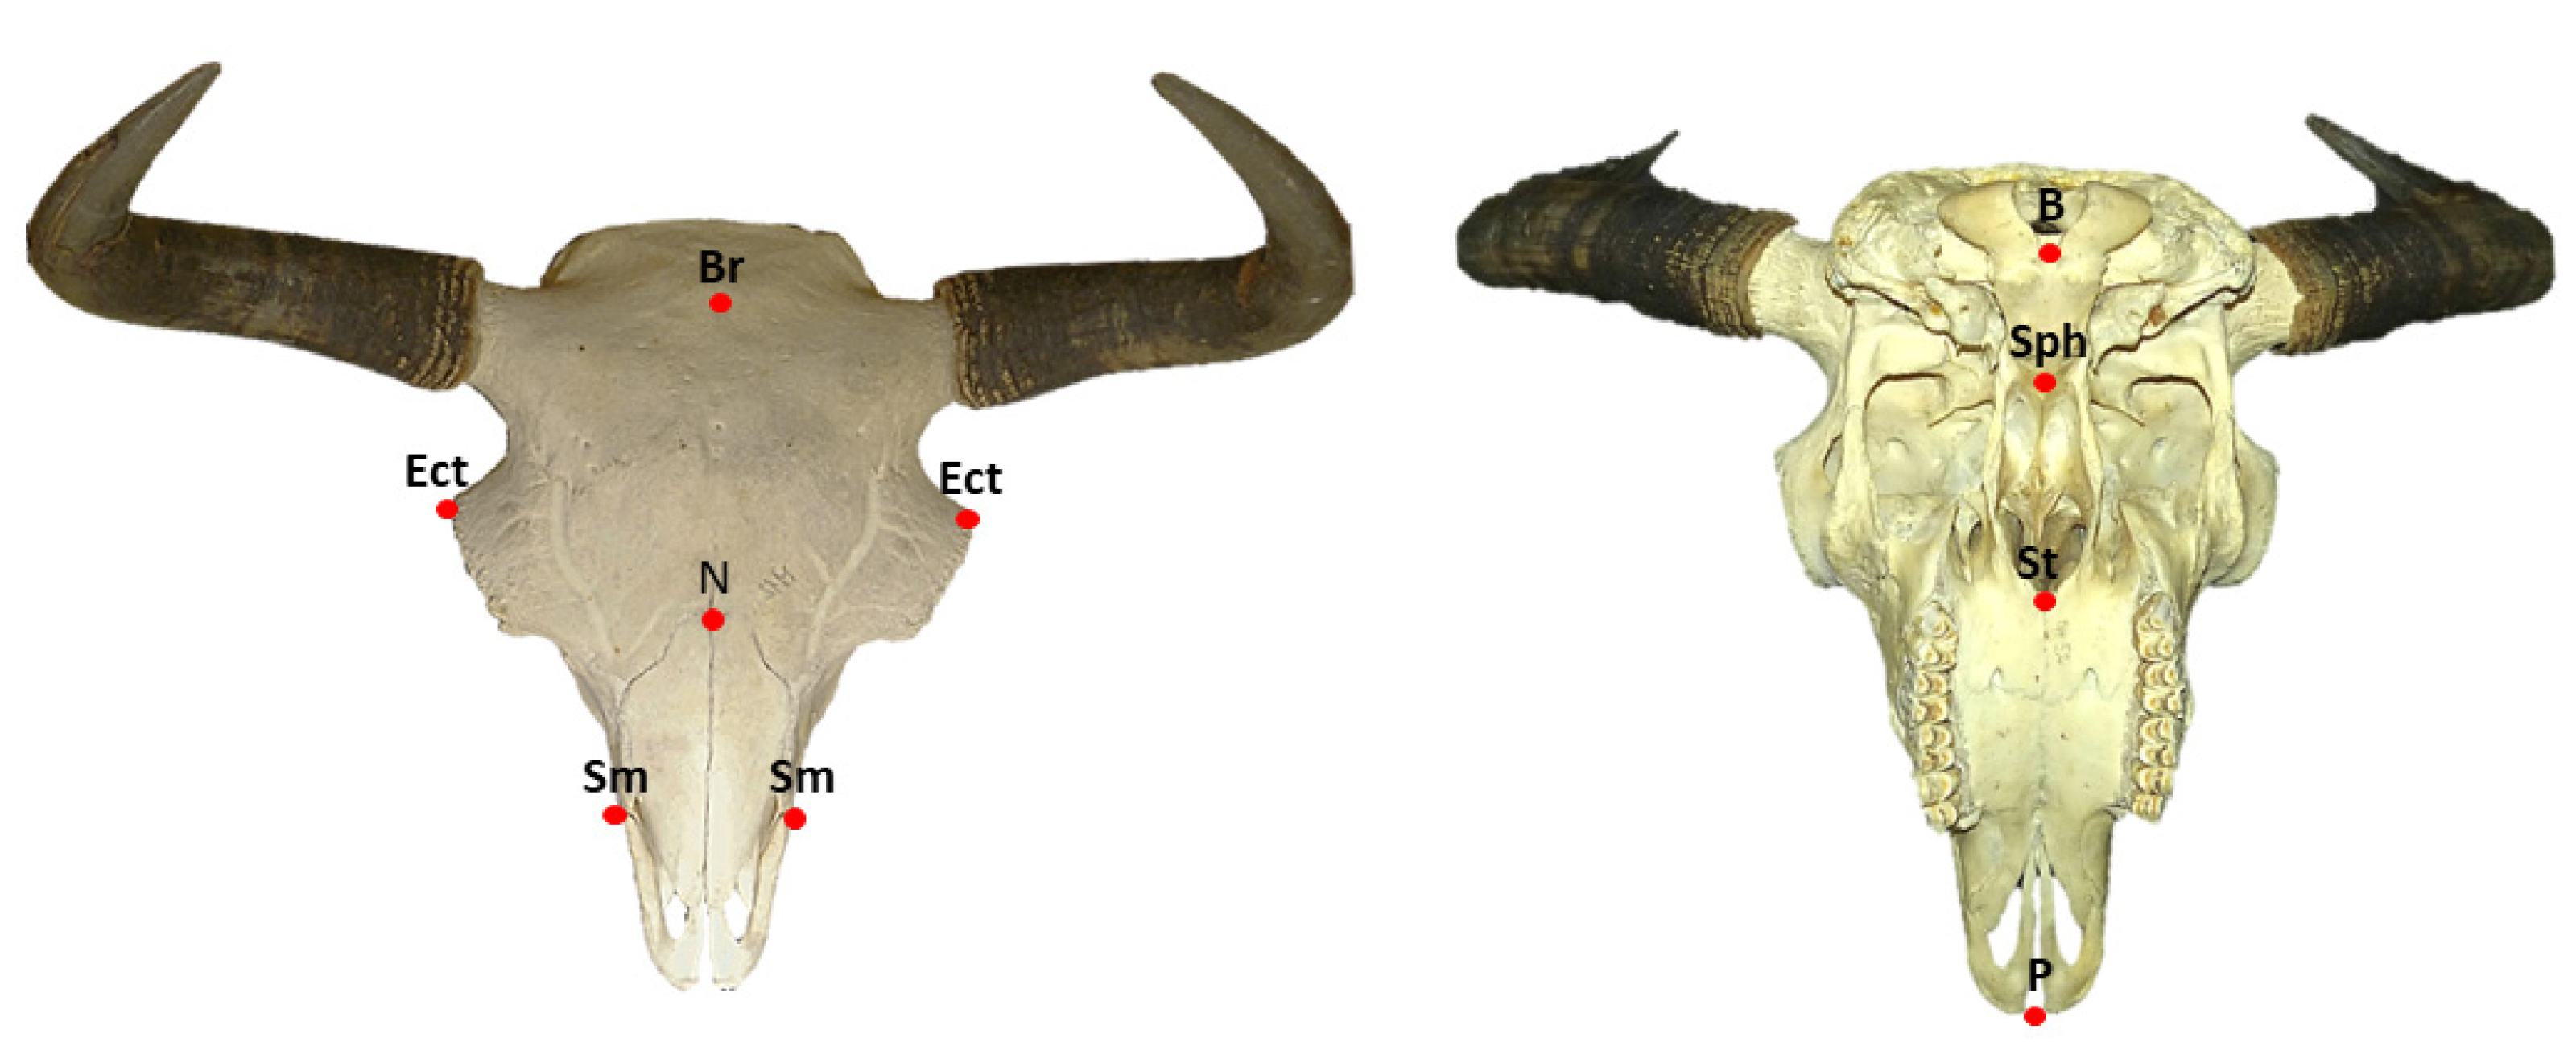
  • Basal length: Basion–Prosthion (BP)
  • Length of the splanchnocranium: Staphylon–Prosthion (StP)
  • Length of the neurocranium: Basion–Staphylon (BSt)
  • Orbital breadth: Ectorbitale–Ectorbitale (EctEct)
  • Breadth of the splanchnocranium: Supramolare–Supramolare (SmSm)
  • Height of the splanchnocranium: Staphylion–Nasion (StN)
  • Height of the neurocranium: Sphenobasion–Brema (SphBr)
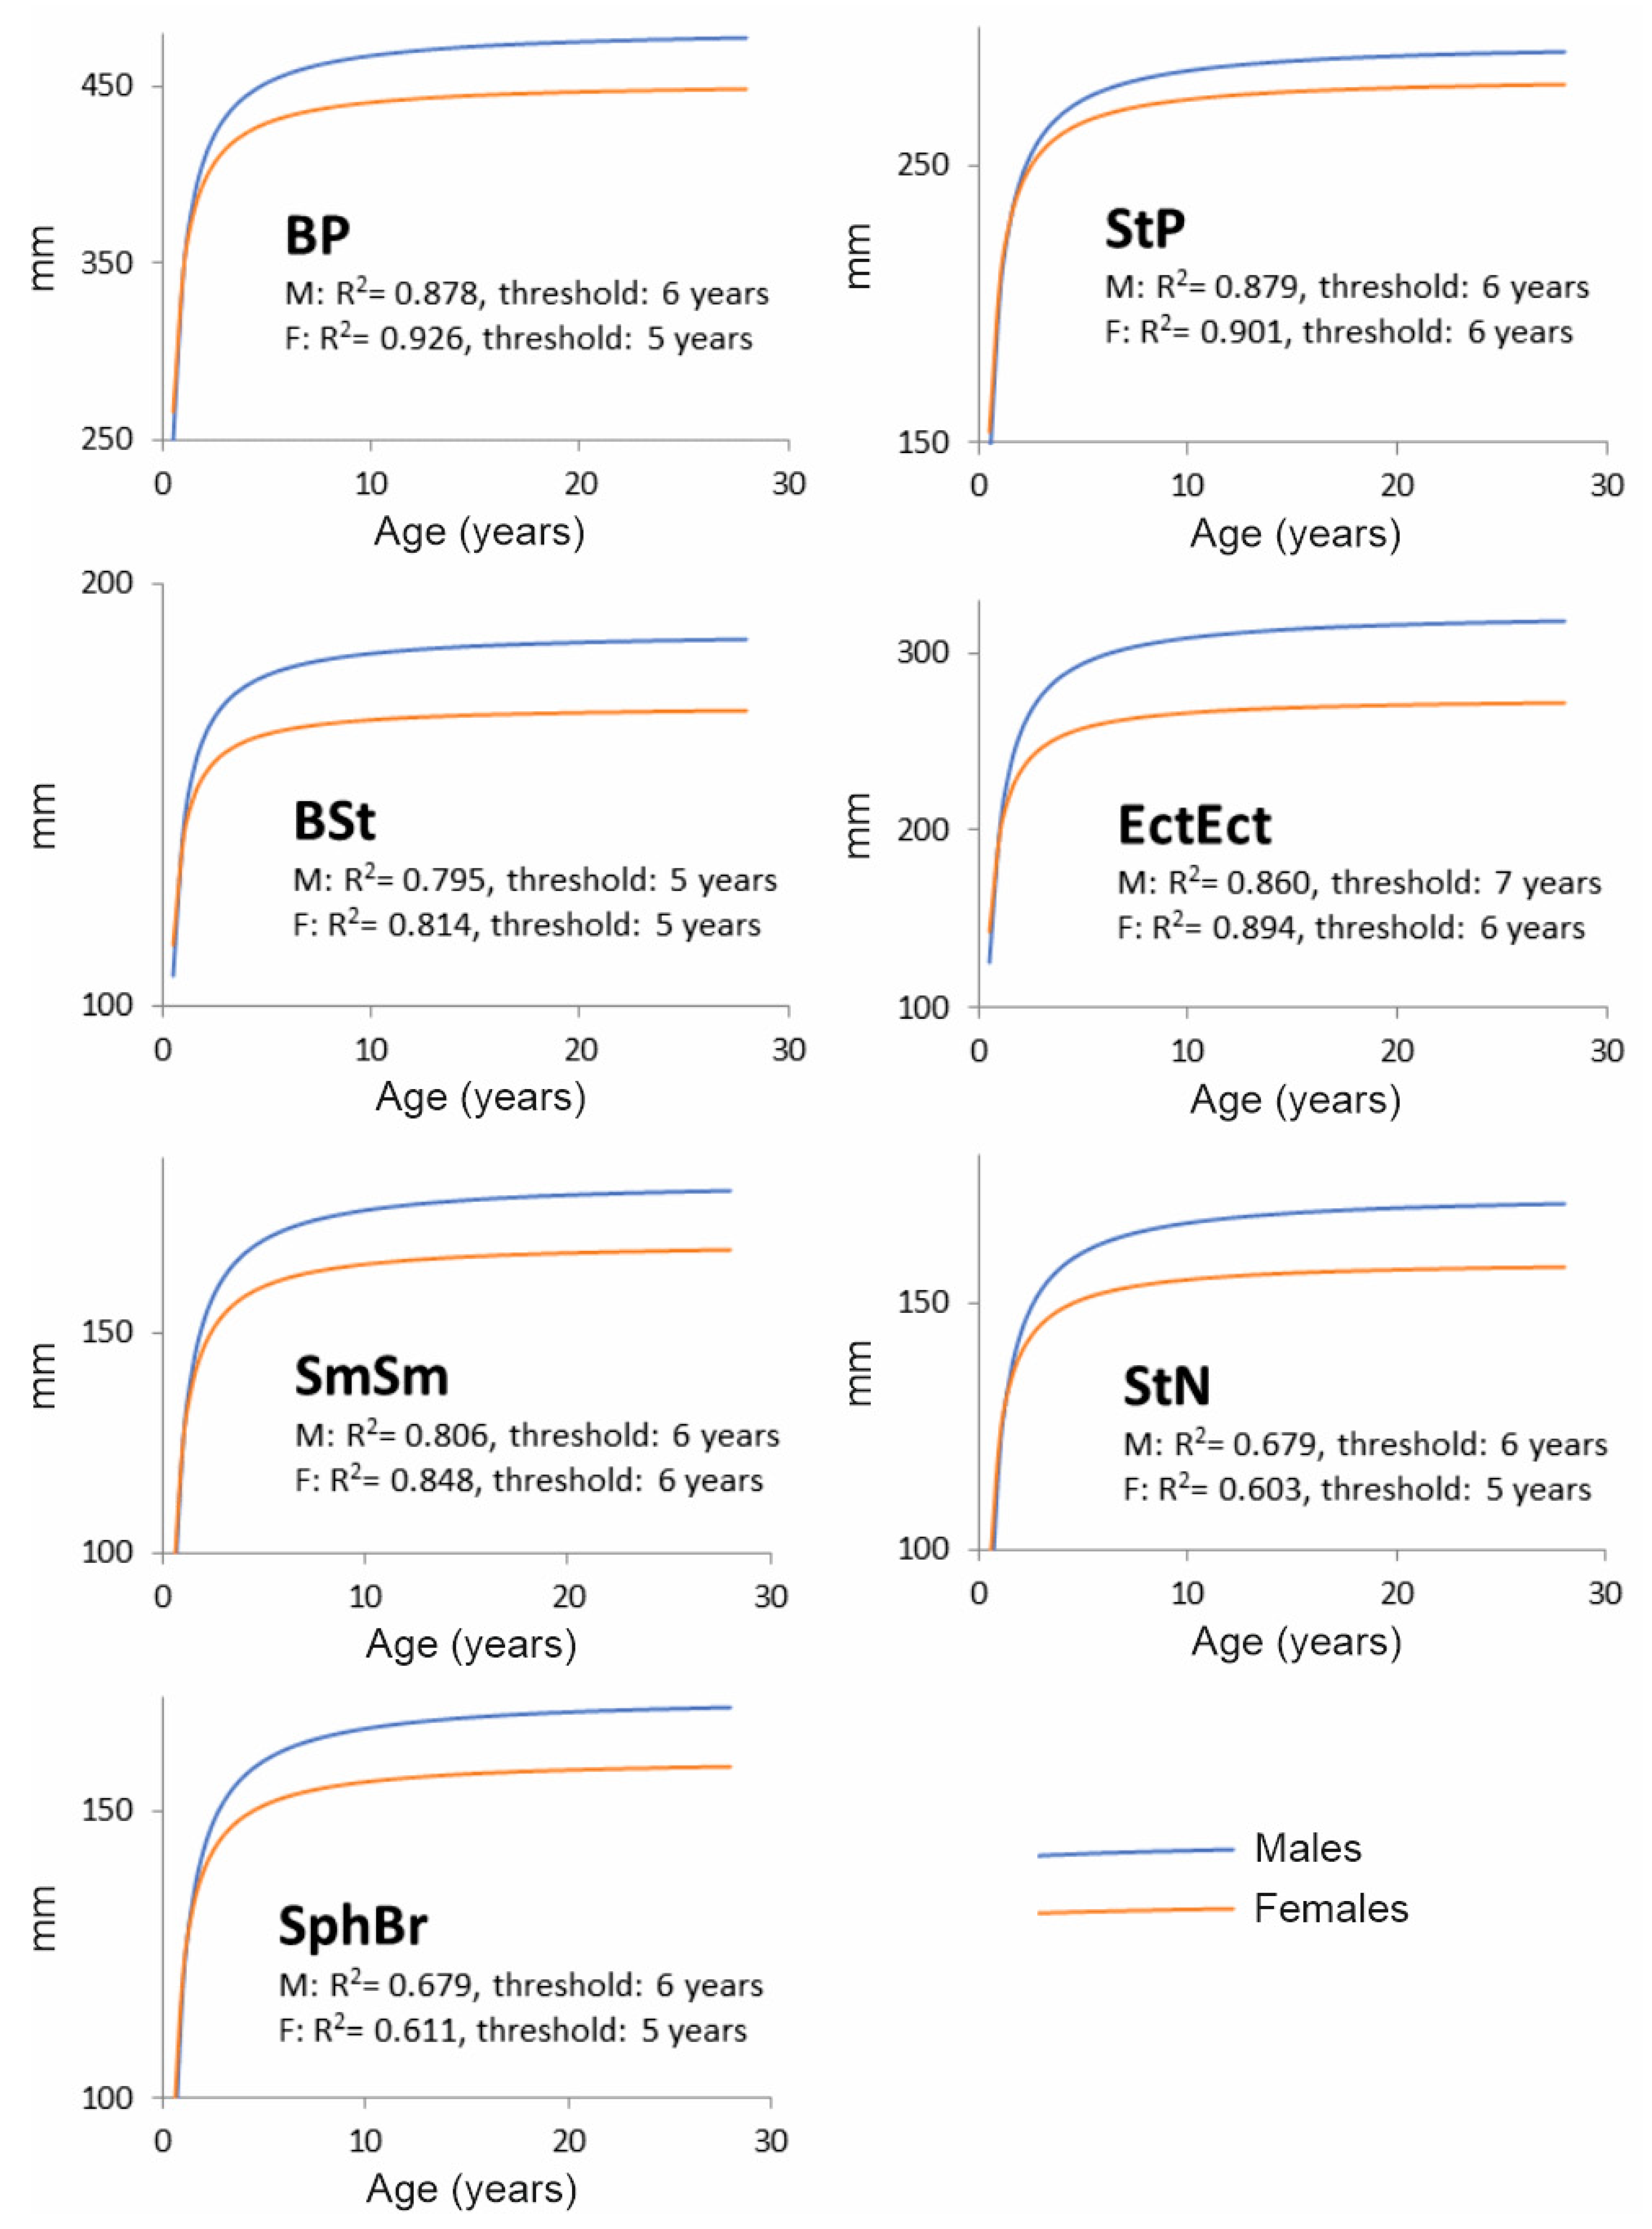
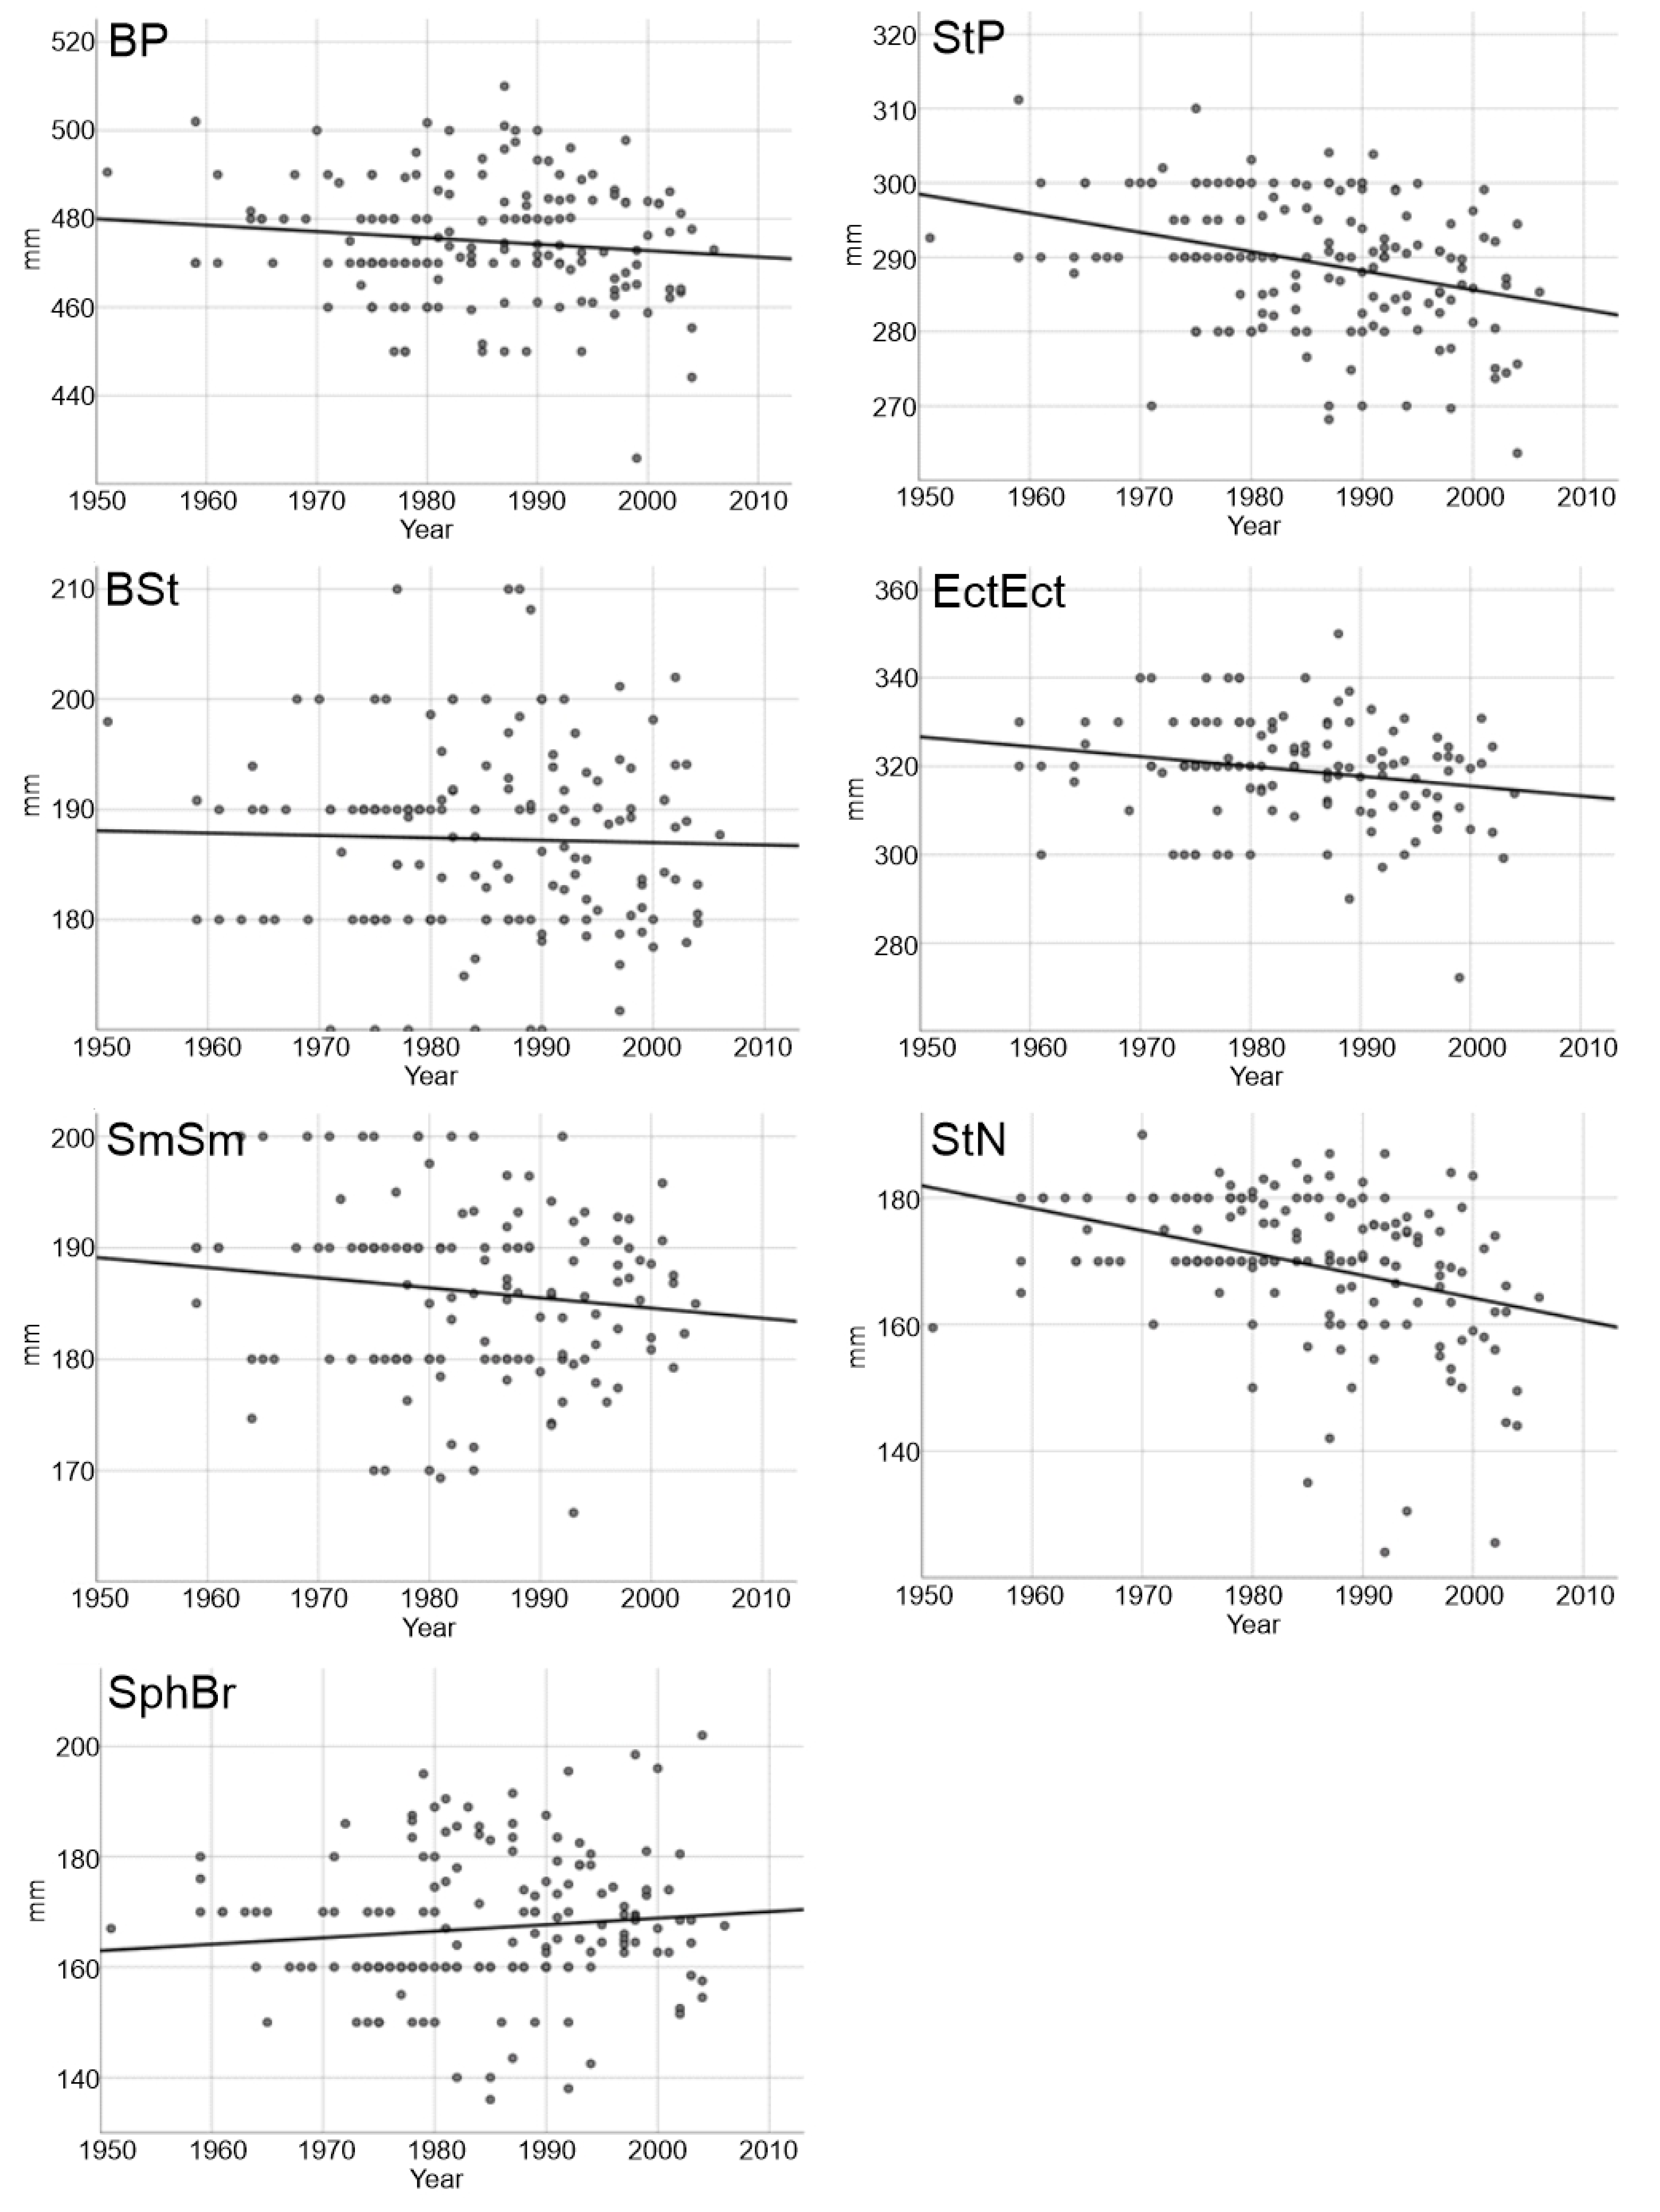
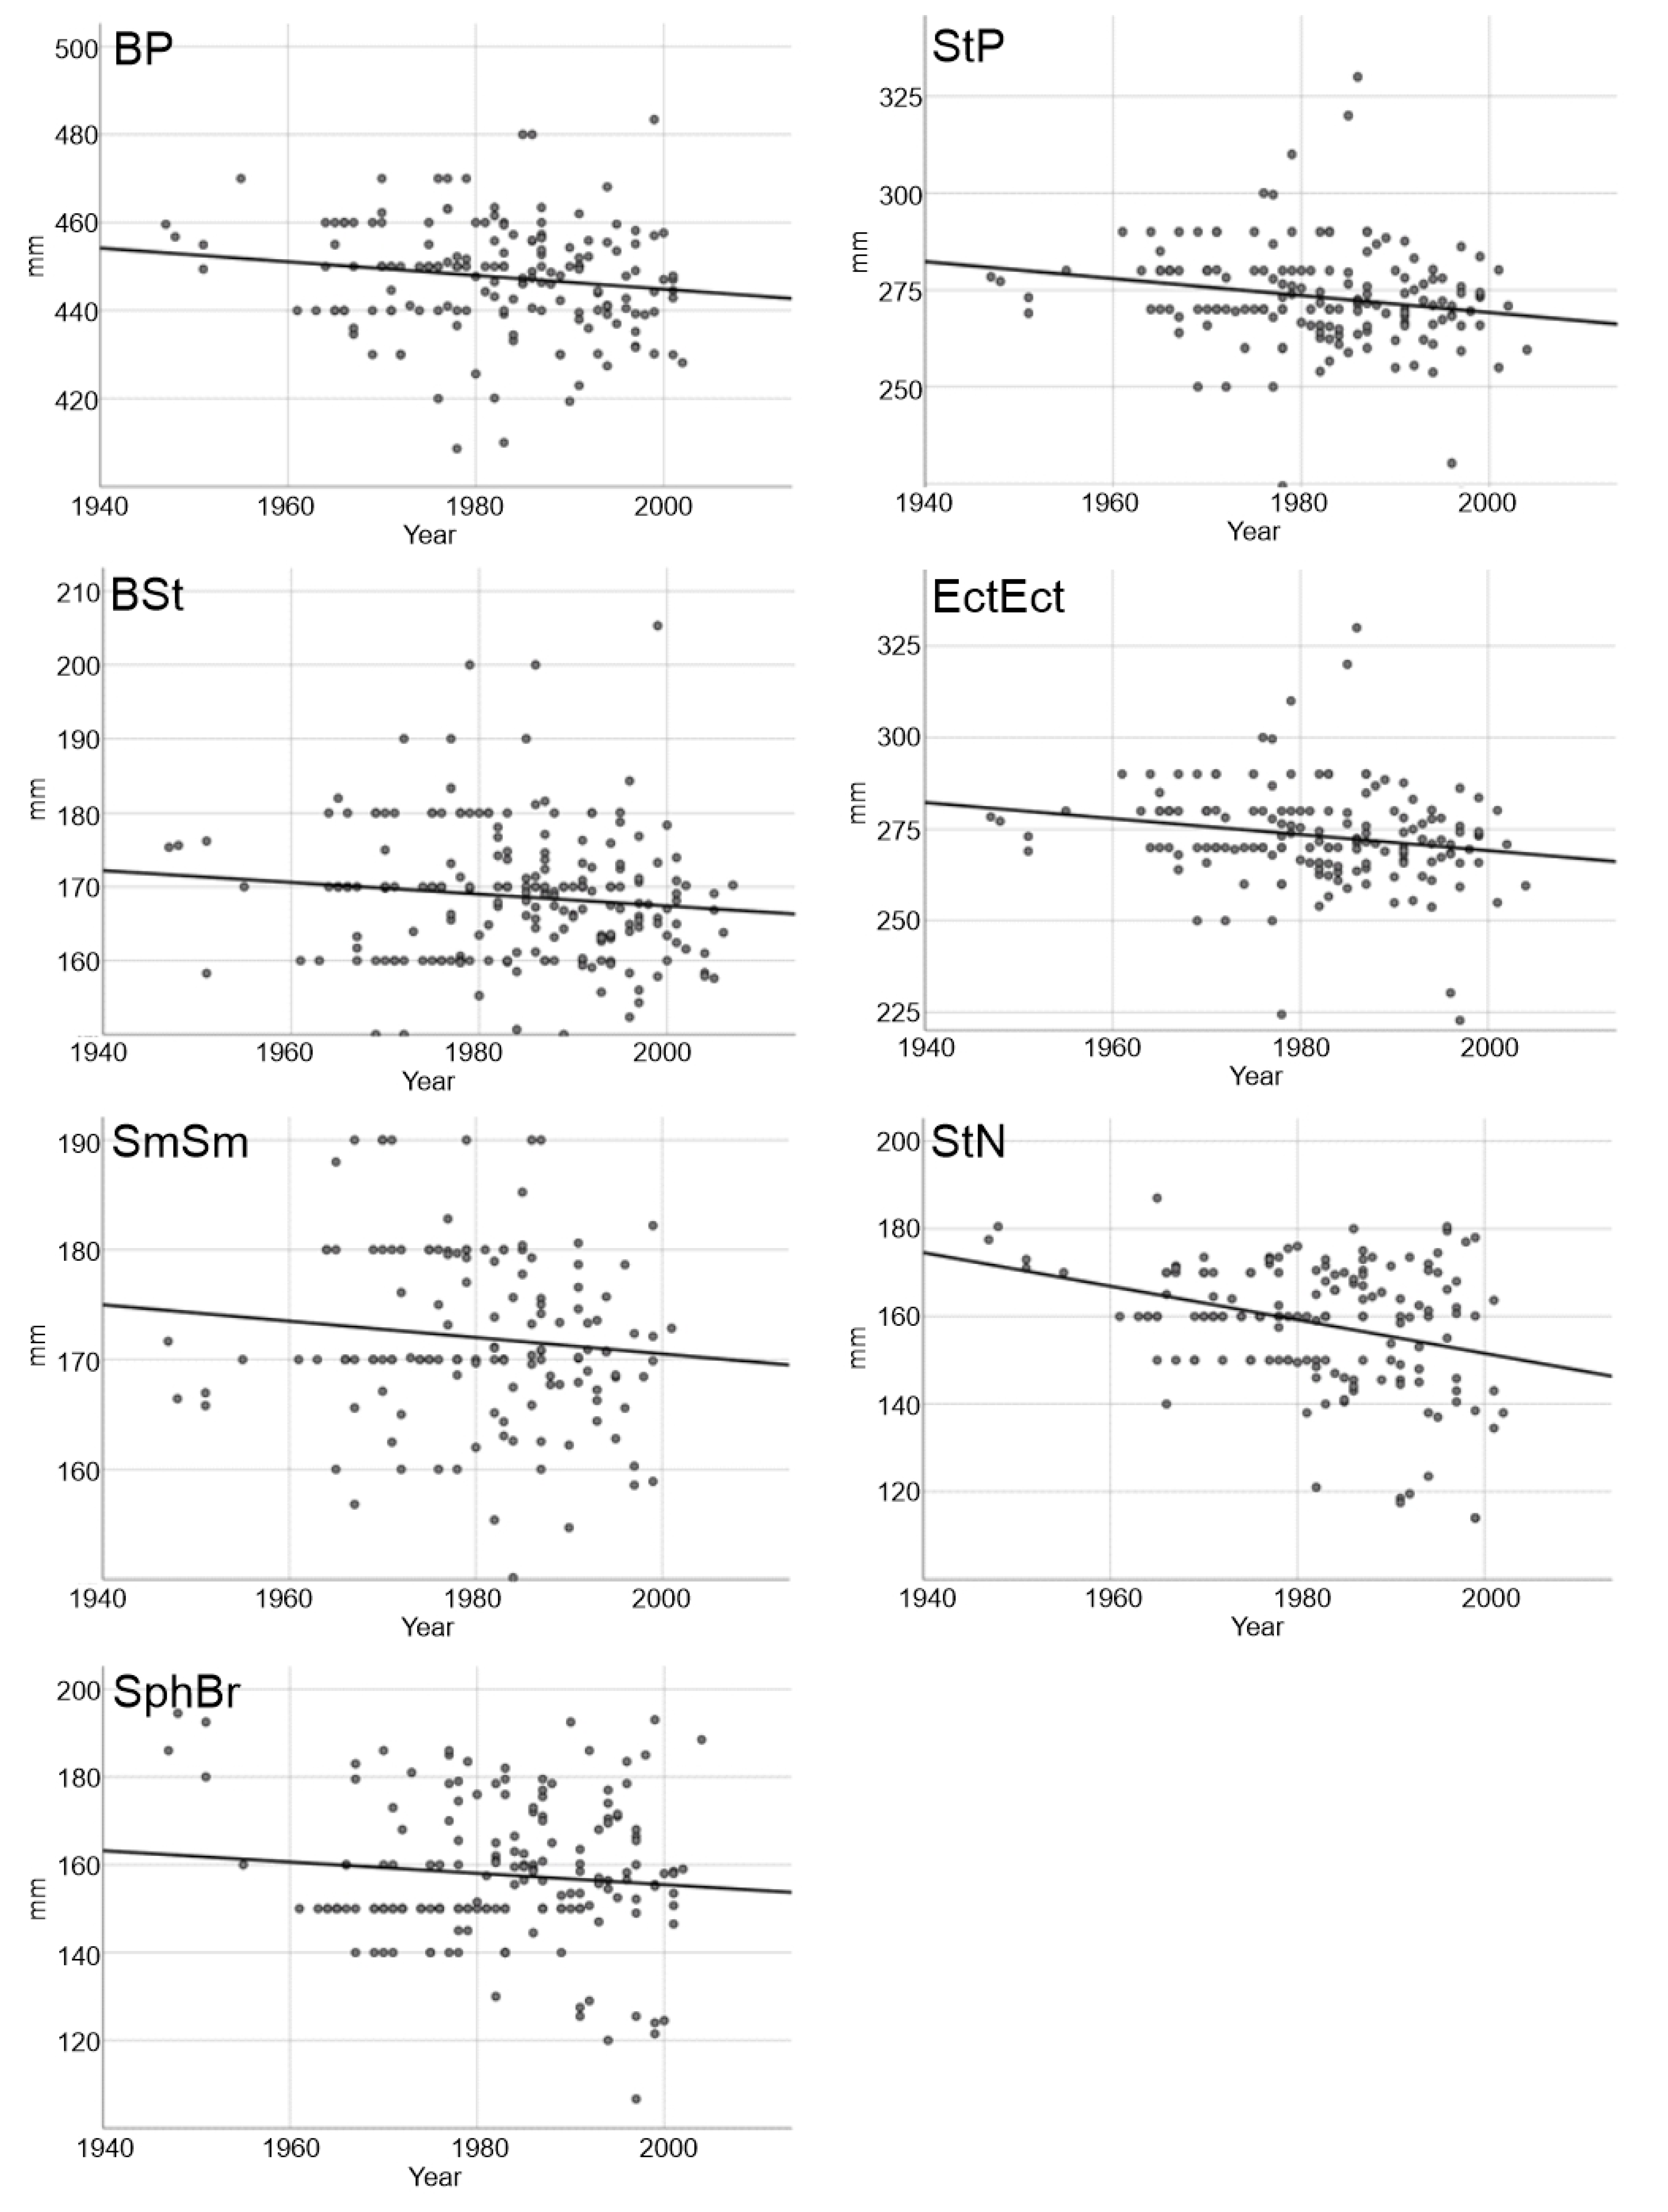
The choice of the above dimensions for analysis was not accidental. They provide an assessment of the spatial shape of the skull in three basic planes. They have also been used earlier by other authors, which makes it possible to compare the results.
Statistical analysis was performed using SPSS v23.0. (Armonk, NY: IBM Corp.) Before analysis of the skulls, osteometric measurement change over time, first, we checked the linear relation of each measurement with age, separately for both sexes. We use an estimation curve to find the best-fitted non-linear relation based on R square values. As the best fit presented the S function, we used this relation for all measurements. Using the regression formula, we searched for the age threshold for each measurement, separately for the sex, from which a given dimension does not change by more than 1% per year of the animal’s life. In the further part of the analysis, the change of each measurement over time was performed for individuals older than or equal to the age threshold. The change of each measurement over time was performed by simple regression for each sex separately.

3. Results

The changes in the dimensions with the age of the European bison were best illustrated by the S function. Males achieved higher values in all analyzed dimensions (Figure 2). In females, the growth rate slowed down earlier, which is manifested by a lower age threshold, for which the dimension value change did not exceed 1% per year of life. In general, the fit of the models was high; for the most part, R2 exceeded the value of 0.8, with usually a better model fit for females, where for BP and StP, R2 exceeded 0.9.
In males, out of the seven dimensions examined, four did not show significant changes over time (p > 0.05). A significant change, with time decreasing values, occurred for the StP, EctEct and StN; however, the R2 was low in all cases (Table 1). The best fitted model was in the case of StN, where 12.4% of the dimension variability was explained by time. All significant trends show decreasing values of dimensions over time, except for the SphBr (Figure 3).
In females, four out of the seven dimensions examined show significant changes over time (p < 0.05). BSt, SmSm, and SphBr did not show a statistically significant trend (Table 2). The best fitted model was again in the case of StN, where over 10% of the dimension variability was explained by time. All significant trends show decreasing values of dimensions over time (Figure 4). All three significant trends in males (StP, EctEct, and StN) were also significant in females. Although BP was significant only in females, the p-value was close to 0.05.

4. Discussion

The increase in the size of the skull of the European bison is noticeably slowed down at the age of 5–6 years [16]. This applies to all dimensions analyzed by us, but in females it occurs a little earlier than in males. It is worth noting that during the period of intensive growth in the first years of life, there are no pronounced dimorphic features. They appear with the attainment of maturity. This was also noticed by Kobryńczyk [17], who stated that, together with an increase in age, the number of skull indices of statistically significant sexual discriminatory power also increases. The biggest difference between adult males and females is in the width of the skull at the height of the orbits (Ect-Ect). These observations are consistent with the reports of other authors. According to Krasińska et al., [11] European bison reach their maximum body dimensions at 5–6 years old. The most pronounced sexual dimorphism was observed in 6-year-old European bison. It can therefore be concluded that the age factor no longer plays a major role in older individuals and the variability of skull dimensions results only from individual characteristics. This also confirms the observations of Empel [18], who studied the closure of the sutures of the skull in the ontogenetic development of the European bison. Based on the above evidence, we used only mature individuals over 6 years of age for further analysis of temporal trends in the skull morphology of the European bison.
The results presented above prove that, in females, all the examined dimensions of the skull tend to decrease. The slope of the trend is the smallest in the case of the BSt, while the StP and Stn are the most distinct in both sexes. This shows that the base of the cranium is less prone to evolutionary trends than its other parts or the facial skeleton.
The reverse, i.e., the increasing trend in males, is observed in the case of the cranium height (SphBr). This can be explained by the strengthening of the frontal part of the skeleton of the head, which is crucial for fighting during the heat season, therefore determining the reproductive success of the individual. Preston et al. [19] proved that Soay sheep males with larger horns have the ability to monopolize susceptible females, and this behavioral success translates into greater siring success. Tidière et al. [20] pointed out the non-linearity of allometry between body weight and horn size in male large ruminants. It can also be concluded that the height of the skull is becoming a feature showing increasing dimorphic differences in the adult bison population. The trends we observed are weak, although statistically significant. Sixty years means the replacement of 10–20 generations of bison; this is too short for the changes to be clearly visible. The greatest decline in body size of bison apparently occurred between 12,500 and 9250 years ago, when the mass declined by 26% (906 kg to 670 kg) in approximately 3000 years. The change in body size occurred in 325–1080 generations, producing an average rate of change of 0.2–0.7 kg per generation [21]. The rapid dynamics of the population in the first period of restitution was certainly an additional factor influencing the high variability of the studied parameters.
Evolutional trends and phenotypic variation result from two antagonist trends: genetic and environmental sources of variation, and regulatory processes including canalization, phenotypic plasticity, and developmental stability [22,23]. According to Debat et al., [24] developmental stability and canalization depend on the same genetic condition, i.e., the level of heterozygosity; however, these are two independent processes, as confirmed by Breno et al. [25]. Inbreeding in the lowland bison population appeared with the start of the restitution of this species after its almost complete liquidation at the beginning of the present century. Its high level in the renewed herd was due both to the small number of bison used for reproduction, and also to the presence among them of only one male [17]. Baranov et al. [26] compared the level of developmental stability in different isolated populations of European bison and proved its relationship with inbreeding. This was confirmed by research on hybrids of European bison and domestic cattle [27]. Cardini et al. [28] compared the cranial allometric trends in kangaroos to evolutionary rules in Placentas. He noticed that the facial part of the skull is more elongated in larger animals. In the case of European bison, the proportion of the cranium in the length of the entire skull decreases, and the facies becomes narrower.
The explanation for the decline of examined dimensions may be the European bison’s adaptation to changing environmental conditions. The constantly shrinking resources and the limited acreage of the forest, which is the natural habitat of the European bison, are not conducive to increasing the body weight of animals. On the other hand, the European bison remains the king of the forest, the largest mammal that is not threatened by any predator. Jędrzejewski et al. [29], citing oral reports by Z. Krasiński and M. Krasińska, state that since the reintroduction of the European bison into the wild in 1952, there have been no cases of bison being killed by wolves or lynxes. Our observations are also consistent with the so-called “island rule” [30], by which large mammals in isolated populations undergo gradual dwarfing due to low resource availability. However, the decrease in dimensions can also be an effect of increasing the density of animals, which does not exclude the “island rule”. Silva and Downing [31] found mammalian population density and body mass and measurements to be negatively correlated. In fact, the population of European bison in Białowieska Forest has increased significantly since the 1950s and has now reached 779 individuals. The European bison was saved from extinction and the first individuals were released to the wild in 1952 [32].
The factor causing the reduction of body dimensions in European bison, as in other species of animals, may also be the warming of the climate. This may also be evidenced by the shortening of the facial part of the skull (StP) with the simultaneous reduction of its height (STN), observable in both sexes. Kobryńczuk [17] noticed that the northern forms of bison, as opposed to the southern forms, have a relatively longer and narrow nasal cavity. This is connected with the development of conchae nasales, warming and moistening inhaled air. Owczarek and Filipiak [33] analyzed the spatial and temporal variability of thermal conditions in Poland during the period from 1951 to 2015. Their analysis revealed the occurrence of symptoms indicating systematic and sustained warming. Significant growth was observed in mean and extreme temperatures and their extreme percentiles, as well as in the annual number of hot days, warm waves, and their duration. In turn, downward trends are noted in series of the annual number of frost days, as well as in the number of cold waves and their duration. This has a negative impact on food availability and leads to a loss of biodiversity [34]. Martin et al., in their study [21], observed a strong inverse correlation between increasing global temperatures and the body size of American bison over the last 40,000 years. They hypothesized that increasing temperature alters both metabolic demands and available resources. They also noted that American bison now exhibit a 30% north–south body mass gradient. The climate in Poland is much more homogeneous, so it is difficult to expect a similar phenomenon. Owen-Stith et al. [35] suggest, conversely, that smaller rather than larger species can be most at risk of local extinction when confined within protected areas. In addition, most other researchers believe that larger animals are at a higher risk of extinction [36,37,38,39]. According to Cardillo et al. [32], extinction risk shows a positive association with body mass. Perhaps, therefore, the reduction of the size of the skull follows the decreasing risk of the European bison becoming extinct.

Author Contributions

Conceptualization, T.S., D.K. and W.O.; methodology, W.O.; software, D.K.; validation, T.S.; investigation, T.S. and A.M.W.; resources, T.S. and A.M.W.; data curation, D.K. and W.O.; writing—original draft preparation, T.S., D.K. and W.O.; writing—review and editing, T.S., D.K. and W.O.; visualization, T.S. and D.K.; project administration, W.O.; funding acquisition, T.S. and W.O. All authors have read and agreed to the published version of the manuscript.

Funding

This research received no external funding.

Institutional Review Board Statement

Not applicable.

Informed Consent Statement

Not applicable.

Data Availability Statement

The data from the study can be obtained upon request from the corresponding author.

Acknowledgments

The authors would like to thank Barbara Bidzińska and Katarzyna Konefał for their great help in measuring the skulls.

Conflicts of Interest

The authors declare no conflict of interest.

References

  1. Hanken, J.; Thorogood, P. Evolution and development of the vertebrate skull: The role of pattern formation. Trends Ecol. Evol. 1993, 8, 9–15. [Google Scholar] [CrossRef] [PubMed]
  2. Zelditch, M.L.; Lundrigan, B.L.; Garland, T., Jr. Developmental regulation of skull morphology. I. Ontogenetic dynamics of variance. Evol. Dev. 2004, 6, 194–206. [Google Scholar] [CrossRef] [PubMed] [Green Version]
  3. Logan, C.J.; Clutton-Brock, T.H. Validating methods for estimating endocranial volume in individual red deer (Cervus elaphus). Behav. Process. 2013, 92, 143–146. [Google Scholar] [CrossRef] [Green Version]
  4. Finarelli, J.A. Estimation of endocranial volume through the use of external skull measures in the Carnivora (Mammalia). J. Mammal. 2006, 87, 1027–1036. [Google Scholar] [CrossRef] [Green Version]
  5. Brudnicki, W. Comparison of craniometric features and cranial cavity volume in domestic pig (Sus scrofa forma domestica) and wild boar (Sus scrofa) in view of development. Folia Biol. 2005, 53, 25–30. [Google Scholar] [CrossRef]
  6. Van Cakenberghe, V.; Herrel, A.; Aguirre, L.F. Evolutionary relationships between cranial shape and diet in bats (Mammalia: Chiroptera). In Topics in Functional and Ecological Vertebrate Morphology; Shaker Publishing BV: Maastricht, The Netherlands, 2002; pp. 205–236. ISBN 90-423-0204-6. [Google Scholar]
  7. Lundrigan, B. Morphology of horns and fighting behavior in the family Bovidae. J. Mammal. 1996, 77, 462–475. [Google Scholar] [CrossRef]
  8. Kitchener, A. An analysis of the forces of fighting of the blackbuck (Antilope cervicapra) and the bighorn sheep (Ovis canadensis) and the mechanical design of the horn of bovids. J. Zool. 1988, 214, 1–20. [Google Scholar] [CrossRef]
  9. Kobryńczuk, F.; Krasińska, M.; Szara, T. Sexual dimorphism in skulls of the lowland European bison, Bison bonasus bonasus. Ann. Zool. Fenn. 2008, 45, 335–340. [Google Scholar] [CrossRef]
  10. Kobryńczuk, F.; Krasińska, M.; Szara, T. Polarization of skull shapes in adult Lowland European bison, Bison bonasus bonasus. Ann. Zool. Fenn. 2008, 45, 341–346. [Google Scholar] [CrossRef]
  11. Krasińska, M.; Szuma, E.; Kobryńczuk, F.; Szara, T. Morphometric variation of the skull during postnatal development in the Lowland European bison Bison bonasus bonasus. Acta Theriol. 2008, 53, 193–216. [Google Scholar] [CrossRef]
  12. Krasinska, M. Variability of the skull shape in hybrids between European bison and domestic cattle. Acta Theriol 1988, 33, 147–186. [Google Scholar] [CrossRef] [Green Version]
  13. Ścibor, J. Hodowla żubrów w Polsce. In Proceedings of the Conferences “European Bison Breeding in Białowieska Forest”; Ministry of Forestry and Wood Industry: Warsaw, Poland, 1965; pp. 19–30. [Google Scholar]
  14. Pucek, Z. Stan i potrzeby badań nad żubrem. In Proceedings of the Conference “European bison breeding in Białowieska Forest”; PWN: Warsaw, Poland, 1969; pp. 123–135. [Google Scholar]
  15. Von den Driesch, A. A Guide to the Measurement of Animal Bones from Archaeological Sites: As Developed by the Institut für Palaeoanatomie; Domestikationsforschung und Geschichte der Tiermedizin of the University of Munich, Peabody Museum Press: Münich, Germany, 1976; Volume 1. [Google Scholar]
  16. Krasińska, M.; Krasiński, Z.A. Body mass and measurements of the European bison during postnatal development. Acta Theriol. 2002, 47, 85–106. [Google Scholar] [CrossRef]
  17. Kobryńczuk, F. The influence of inbreeding on the shape and size of the skeleton of the European bison. Acta Theriol. 1985, 30, 379–422. [Google Scholar] [CrossRef] [Green Version]
  18. Empel, W. Morphologie des Schädels von Bison bonasus (Linnaeus 1758). Acta Theriol. 1962, 6, 53–112. [Google Scholar] [CrossRef] [Green Version]
  19. Preston, B.T.; Stevenson, I.R.; Pemberton, J.M.; Coltman, D.W.; Wilson, K. Overt and covert competition in a promiscuous mammal: The importance of weaponry and testes size to male reproductive success. Proceedings of the Royal Society of London. Ser. B Biol. Sci. 2003, 270, 633–640. [Google Scholar] [CrossRef] [Green Version]
  20. Tidière, M.; Lemaître, J.F.; Pélabon, C.; Gimenez, O.; Gaillard, J.M. Evolutionary allometry reveals a shift in selection pressure on male horn size. J. Evol. Biol. 2017, 30, 1826–1835. [Google Scholar] [CrossRef] [PubMed] [Green Version]
  21. Martin, J.M.; Mead, J.I.; Barboza, P.S. Bison body size and climate change. Ecol. Evol. 2018, 8, 4564–4574. [Google Scholar] [CrossRef] [Green Version]
  22. Palmer, A.R. Waltzing with asymmetry. BioScience 1996, 46, 518–532. [Google Scholar] [CrossRef] [Green Version]
  23. Siegal, M.L.; Bergman, A. Waddington’s canalization revisited: Developmental stability and evolution. Proc. Natl. Acad. Sci. USA 2002, 99, 10528–10532. [Google Scholar] [CrossRef] [Green Version]
  24. Debat, V.; David, P. Mapping phenotypes: Canalization, plasticity and developmental stability. Trends Ecol. Evol. 2001, 16, 555–561. [Google Scholar] [CrossRef]
  25. Breno, M.; Leirs, H.; Van Dongen, S. No relationship between canalization and developmental stability of the skull in a natural population of Mastomys natalensis (Rodentia: Muridae). Biol. J. Linn. Soc. 2011, 104, 207–216. [Google Scholar] [CrossRef] [Green Version]
  26. Baranov, A.S.; Pucek, Z.; Kiseleva, E.G.; Zakharov, V.M. Developmental stability of skull morphology in European bison Bison bonasus. Acta Theriol. 1997, 42, 79–85. [Google Scholar] [CrossRef] [Green Version]
  27. Baranov, A.S.; Zakharov, V.M. Developmental stability in hybrids of European bison Bison bonasus and domestic cattle. Acta Theriol. 1997, 42, 87–90. [Google Scholar] [CrossRef] [Green Version]
  28. Cardini, A.; Polly, D.; Dawson, R.; Milne, N. Why the long face? Kangaroos and wallabies follow the same ‘rule’ of cranial evolutionary allometry (CREA) as placentals. Evol. Biol. 2015, 42, 169–176. [Google Scholar] [CrossRef]
  29. Jędrzejewski, W.; Jędrzejewska, B.; Okarma, H.; Ruprecht, A.L. Wolf predation and snow cover as mortality factors in the ungulate community of the Bialowieża National Park, Poland. Oecologia 1992, 90, 27–36. [Google Scholar] [CrossRef]
  30. Benítez-López, A.; Santini, L.; Gallego-Zamorano, J.; Milá, B.; Walkden, P.; Huijbregts, M.A.; Tobias, J.A. The island rule explains consistent patterns of body size evolution in terrestrial vertebrates. Nat. Ecol. Evol. 2021, 5, 768–786. [Google Scholar] [CrossRef] [PubMed]
  31. Silva, M.; Downing, J.A. The allometric scaling of density and body mass: A nonlinear relationship for terrestrial mammals. Am. Nat. 1995, 145, 704–727. [Google Scholar] [CrossRef] [Green Version]
  32. Krasiński, Z. Free living European bisons. Acta Theriol. 1967, 12, 391–405. [Google Scholar] [CrossRef] [Green Version]
  33. Owczarek, M.; Filipiak, J. Contemporary changes of thermal conditions in Poland, 1951–2015. Bull. Geogr. Phys. Geogr. Ser. 2016, 10, 31–50. [Google Scholar] [CrossRef] [Green Version]
  34. Sheridan, J.A.; Bickford, D. Shrinking body size as an ecological response to climate change. Nat. Clim. Chang. 2011, 1, 401–406. [Google Scholar] [CrossRef]
  35. Owen-Smith, N.; Cromsigt, J.P.; Le Roux, E. Smaller ungulates are first to incur imminent extirpation from an African protected area. Biol. Conserv. 2017, 216, 108–114. [Google Scholar] [CrossRef]
  36. Damuth, J. Interspecific allometry of population density in mammals and other animals: The independence of body mass and population energy-use. Biol. J. Linn. Soc. 1987, 31, 193–246. [Google Scholar] [CrossRef]
  37. Dirzo, R.; Young, H.S.; Galetti, M.; Ceballos, G.; Isaac, N.J.; Collen, B. Defaunation in the Anthropocene. Science 2014, 345, 401–406. [Google Scholar] [CrossRef] [PubMed]
  38. Hilbers, J.P.; Schipper, A.M.; Hendriks, A.J.; Verones, F.; Pereira, H.M.; Huijbregts, M.A.J. An allometric approach to quantify the extinction vulnerability of birds and mammals. Ecology 2016, 97, 615–626. [Google Scholar] [CrossRef] [Green Version]
  39. Cardillo, M.; Mace, G.M.; Jones, K.E.; Bielby, J.; Bininda-Emonds, O.R.P.; Sechrest, W.; Orme, C.D.L.; Purvis, A. Multiple causes of high extinction risk in large mammal species. Science 2005, 309, 1239–1241. [Google Scholar] [CrossRef] [PubMed] [Green Version]
Figure 1. Measurement points on the European bison skull.
Diversity 15 00377 g001
Figure 2. The trend of dimensions changes with the age of male (M) and female (F) European bison and the age threshold for which the dimension value does not increase more than 1% per year of life (for index description see: Methods).
Diversity 15 00377 g002
Figure 3. Trends in cranial dimensions change over time in males of European bison.
Diversity 15 00377 g003
Figure 4. Trends in cranial dimensions change over time in females of European bison.
Diversity 15 00377 g004
Table 1. Linear regression models of cranial dimensions change over time in males of European bison.
Model OutputsBPStPBStEctEctSmSmStNSphBr
F2.4319.380.145.312.4023.241.87
P0.1210.0000.7100.0230.1230.0000.173
Intercept
[B0 (±SE)]
760.18
(183.02)
801.71
(116.37)
230.24
(115.11)
761.61
(192.05)
366.46
(116.41)
874.08
(146.12)
−67.39
(171.32)
Year
[B1 (±SE)]
−0.14 (0.09)−0.26 (0.06)−0.02
(0.06)
−0.22
(0.10)
−0.09
(0.06)
−0.35
(0.07)
0.12
(0.09)
R20.0150.1070.0010.0400.0170.1240.011
N165163160128143166167
Table 2. Linear regression models of cranial dimensions change over time in females.
Model OutputsBPStPBStEctEctSmSmStNSphBr
F3.907.572.535.891.6317.781.62
P0.0500.0070.1100.0160.2030.0000.204
Intercept
[B0 (±SE)]
755.97
(156.12)
584.66
(110.77)
327.08
(99.53)
707.08
(178.77)
319.53
(115.44)
918.03
(180.13)
413.36
(200.71)
Year
[B1 (±SE)]
−0.16 (0.08)−0.15 (0.06)−0.08
(0.05)
−0.22
(0.09)
−0.07
(0.06)
−0.38
(0.09)
−0.13
(0.10)
R20.0220.0460.0120.0360.0110.1010.009
N175162213163146164178
Disclaimer/Publisher’s Note: The statements, opinions and data contained in all publications are solely those of the individual author(s) and contributor(s) and not of MDPI and/or the editor(s). MDPI and/or the editor(s) disclaim responsibility for any injury to people or property resulting from any ideas, methods, instructions or products referred to in the content.

