1. Introduction
Atlantic sturgeon (
Acipenser oxyrinchus oxyrinchus Mitchill, 1815) is an anadromous, long-lived, and highly migratory sturgeon subspecies along the Atlantic coast of North America. Atlantic sturgeon once supported lucrative commercial fisheries in many spawning rivers in the U.S. ranging from Maine to Florida. However, by the turn of the 20th century, these fisheries had collapsed to a fraction of their historic harvests [
1,
2]. For example, it was estimated that the Delaware River, which had by far the largest population of Atlantic sturgeon along the U.S. coast, contributing 75% of the coastwide harvest, supported 180,000 spawning females prior to 1890 and a harvest in Delaware River-Bay of 2700 mt [
2]. By 1901, the Delaware River-Bay fishery dropped to 6% of peak levels. In recent years, the Delaware River adult population has been estimated at less than 300 individuals. In the mid-to-late-20th century, fisheries for Atlantic sturgeon had also developed on migratory aggregations of subadult and adult individuals in nearshore coastal waters within this range [
3]. Heightened concern about these declining fisheries and their constituent populations resulted in the issuance of a 40-year coastwide moratorium in the U.S. on the harvest of Atlantic sturgeon in 1998, with the subspecies being listed under the U.S. Endangered Species Act (ESA) in 2012 as five Distinct Population Segments (DPS). Four of these were designated as endangered (including that in the South Atlantic DPS (
Figure 1)), and the fifth, in the Gulf of Maine, was designated as threatened [
4]. Despite the imposition of these measures, there is continuing concern regarding the status of Atlantic sturgeon as a whole and its individual populations because of bycatch in coastal fisheries and multiple threats in spawning and non-natal rivers, including altered habitats, vessel strikes, impaired water quality, and chemical pollution [
5].
Historically, Atlantic sturgeon were believed to spawn in up to 38 rivers, extending from the St. Lawrence River, Quebec to the St. Marys River, Florida [
6]. Approximately 25 rivers still support their reproduction [
7,
8]. The abundances of adult sturgeon in these spawning populations vary greatly, with census estimates ranging from the low hundreds for the Delaware River [
9] to less than a thousand for the Hudson River, New York [
10] and Altamaha River, Georgia [
11,
12] and about 20,000 for the Saint John River, New Brunswick [
13]. Because population sizes vary so greatly [
1], the vulnerabilities of individual populations to more severe declines and extirpation also differ. Thus, there is a need to enact management practices that best protect the smallest and most vulnerable populations. This necessitates the ability to uniquely identify individuals and contingents from the individual DPS and their component spawning river populations outside of their natal estuaries. That ability is particularly necessary because of the highly migratory behavior of subadult and adult Atlantic sturgeon [
14].
Juvenile Atlantic sturgeon (≤50 cm TL) are restricted to their natal rivers for the first 2–6 years of their life, whereupon subadults (>50 cm–130 cm TL), and adults (≥130 cm TL) undergo migrations to distant coastal waters and non-natal estuaries. They return to natal rivers to spawn at ages ranging from 5 to 19 years in South Carolina rivers, 11 to 21 years in the Hudson River, and 22 to 34 years in Canadian rivers [
15]. During their prolonged migrations to distant coastal locales and non-natal estuaries, Atlantic sturgeon are vulnerable to stressors from the litany of anthropogenic threats listed above [
5]. Thus, the ability to uniquely identify the natal rivers of specimens in coastal waters and non-natal estuaries permits the quantification of the impacts of stressors in distant waters on individual spawning populations and DPS.
Genetic analysis was used extensively in the development of management strategies for Atlantic sturgeon in both the U.S. and Canada. Analyses of mitochondrial DNA [
16,
17,
18] and microsatellite DNA [
19,
20,
21,
22] were used to define the population relationships and the extent of the genetic distinctiveness of individual spawning populations, as well as to quantify their levels of genetic diversity. These genetic descriptors, in combination with population life history characteristics, were used in the designation of the five DPS of Atlantic sturgeon. Microsatellite DNA analysis was also used to estimate the effective population sizes (
Ne) of Atlantic sturgeon, which can serve as a surrogate for population census sizes (
Nc) in an organism that is difficult to sample, such as Atlantic sturgeon [
22,
23]. Genetic analysis also provides a direct, economical, and non-fatal means to identify the population and DPS origin of individual Atlantic sturgeon specimens and to enumerate their quantitative contributions to mixed-stock aggregations in waters outside of their natal estuaries. This has allowed for the use of these genetic markers to uniquely identify the population origin of individual Atlantic sturgeon subadults and adults in mixed coastal [
24,
25,
26,
27] and non-natal estuarine aggregations [
25]. The use of this tool has permitted the quantification of the effects of anthropogenic stressors on individual populations and DPS [
24,
27,
28,
29] in waters distant from where they were spawned.
Life history characteristics variation can be defined as the particular pathway that an individual or group takes through time or space. This can be reflected in a variation in movements between habitats and the amount of time spent in habitats [
30]. For anadromous species, the reproductive isolation of populations, as demonstrated by their robust genetic differentiation, allows for natural selection to propagate phenotypes in populations that are best adapted to local environmental conditions and life history variations. In anadromous species, genetic partitioning most commonly occurs spatially among major spawning rivers. However, reproductive isolation by temporal mechanisms is also sometimes observed. Importantly, reproductive isolation by either mechanism can be accompanied by a variation in life history characteristics such as the specimen size, trophic level, gene expression, reproductive success, or migratory behavior.
The order Acipenseriformes contains two extant families: the Polyodontidae (paddlefishes) and the Acipenseridae (sturgeons). Within Acipenseridae, reproductive isolation by temporal mechanisms has often been observed. In his extensive reviews of this phenomenon in anadromous fishes, Berg [
31] described dual spawning (spring and fall) in several anadromous sturgeons in the Black and Caspian seas, including stellate sturgeon (
Acipenser stellatus Pallas, 1771), Russian sturgeon (
Acipenser guldenstadti von Brandt & Ratzenburg, 1833), beluga sturgeon (
Huso huso Linnaeus, 1758), ship sturgeon (
Acipenser nudiventris Lovetsky, 1828), and the freshwater sterlet (
Acipenser ruthenus Linneaus, 1758). In all instances, dual spawning was marked by the temporal separation of the two contingents, which, in some cases, was accompanied by the spatial separation of spawning locales. In some instances, life history characteristics such as the reproductive patterns, total size, and river residency differed between spatially or temporally isolated populations within individual river systems. Dual spawning populations of Atlantic sturgeon (spring and fall) have also been described in the James River, Virginia [
32] and in the Edisto River, South Carolina [
33], although no evidence was presented for life history trait differences between the populations. Dual spawning in these two rivers was accompanied by size differences between the two within-river juvenile populations as well as two distinct peaks in the timing of their historical fisheries.
In this study, we used microsatellite DNA to describe the genetic population structure of Atlantic sturgeon based on collections of juvenile and adult specimens obtained from 13 spawning rivers extending from the St. Lawrence River to the Satilla River, Georgia. We then focused on a set of unexpected results from the Ogeechee River population that indicated important life history variation within its population.
1.1. Specimen Collections
We define juvenile Atlantic sturgeon as ≤50 cm TL, subadults as >50 to 130 cm TL, and adults as >130 cm TL [
24]. Our reference collections were comprised of juveniles, adults, or a combination of both. Adults were collected from spawning locales at the spawning time. Reference samples were collected from 13 rivers in Canada and the U.S. known to support their spawning. The collection years range from 1980 (Kennebec River) to 2021 (Hudson River). Multiple years of collections were made from each spawning river. For example, specimens from the Savannah, Ogeechee, and Altamaha in the South Atlantic DPS were collected over 5, 5, and 7 years, respectively. For Canadian rivers, reference collections were comprised solely of adult specimens. For most rivers in the South Atlantic DPS, reference collections were composed of exclusively juvenile specimens. The Hudson River and Edisto River collections comprised both adults and juveniles. In total, 3104 specimens were included in our reference population collections. Details on most of these collections can be found in Waldman et al. [
23], and final characterizations will be reported elsewhere.
The present study focused on 199 juvenile specimens that were collected from the Ogeechee River, Georgia between 2007 and 2017 (n = 9 in 2007; n = 4 in 2008; n = 13 in 2009; n = 45 in 2014; n = 67 in 2015; n = 46 in 2016; and n = 15 in 2017). Based on the length–frequency histogram of Atlantic sturgeon collected from the proximal Altamaha River [
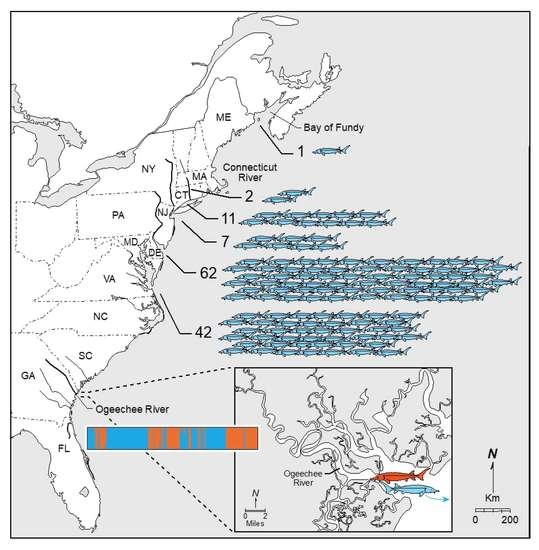
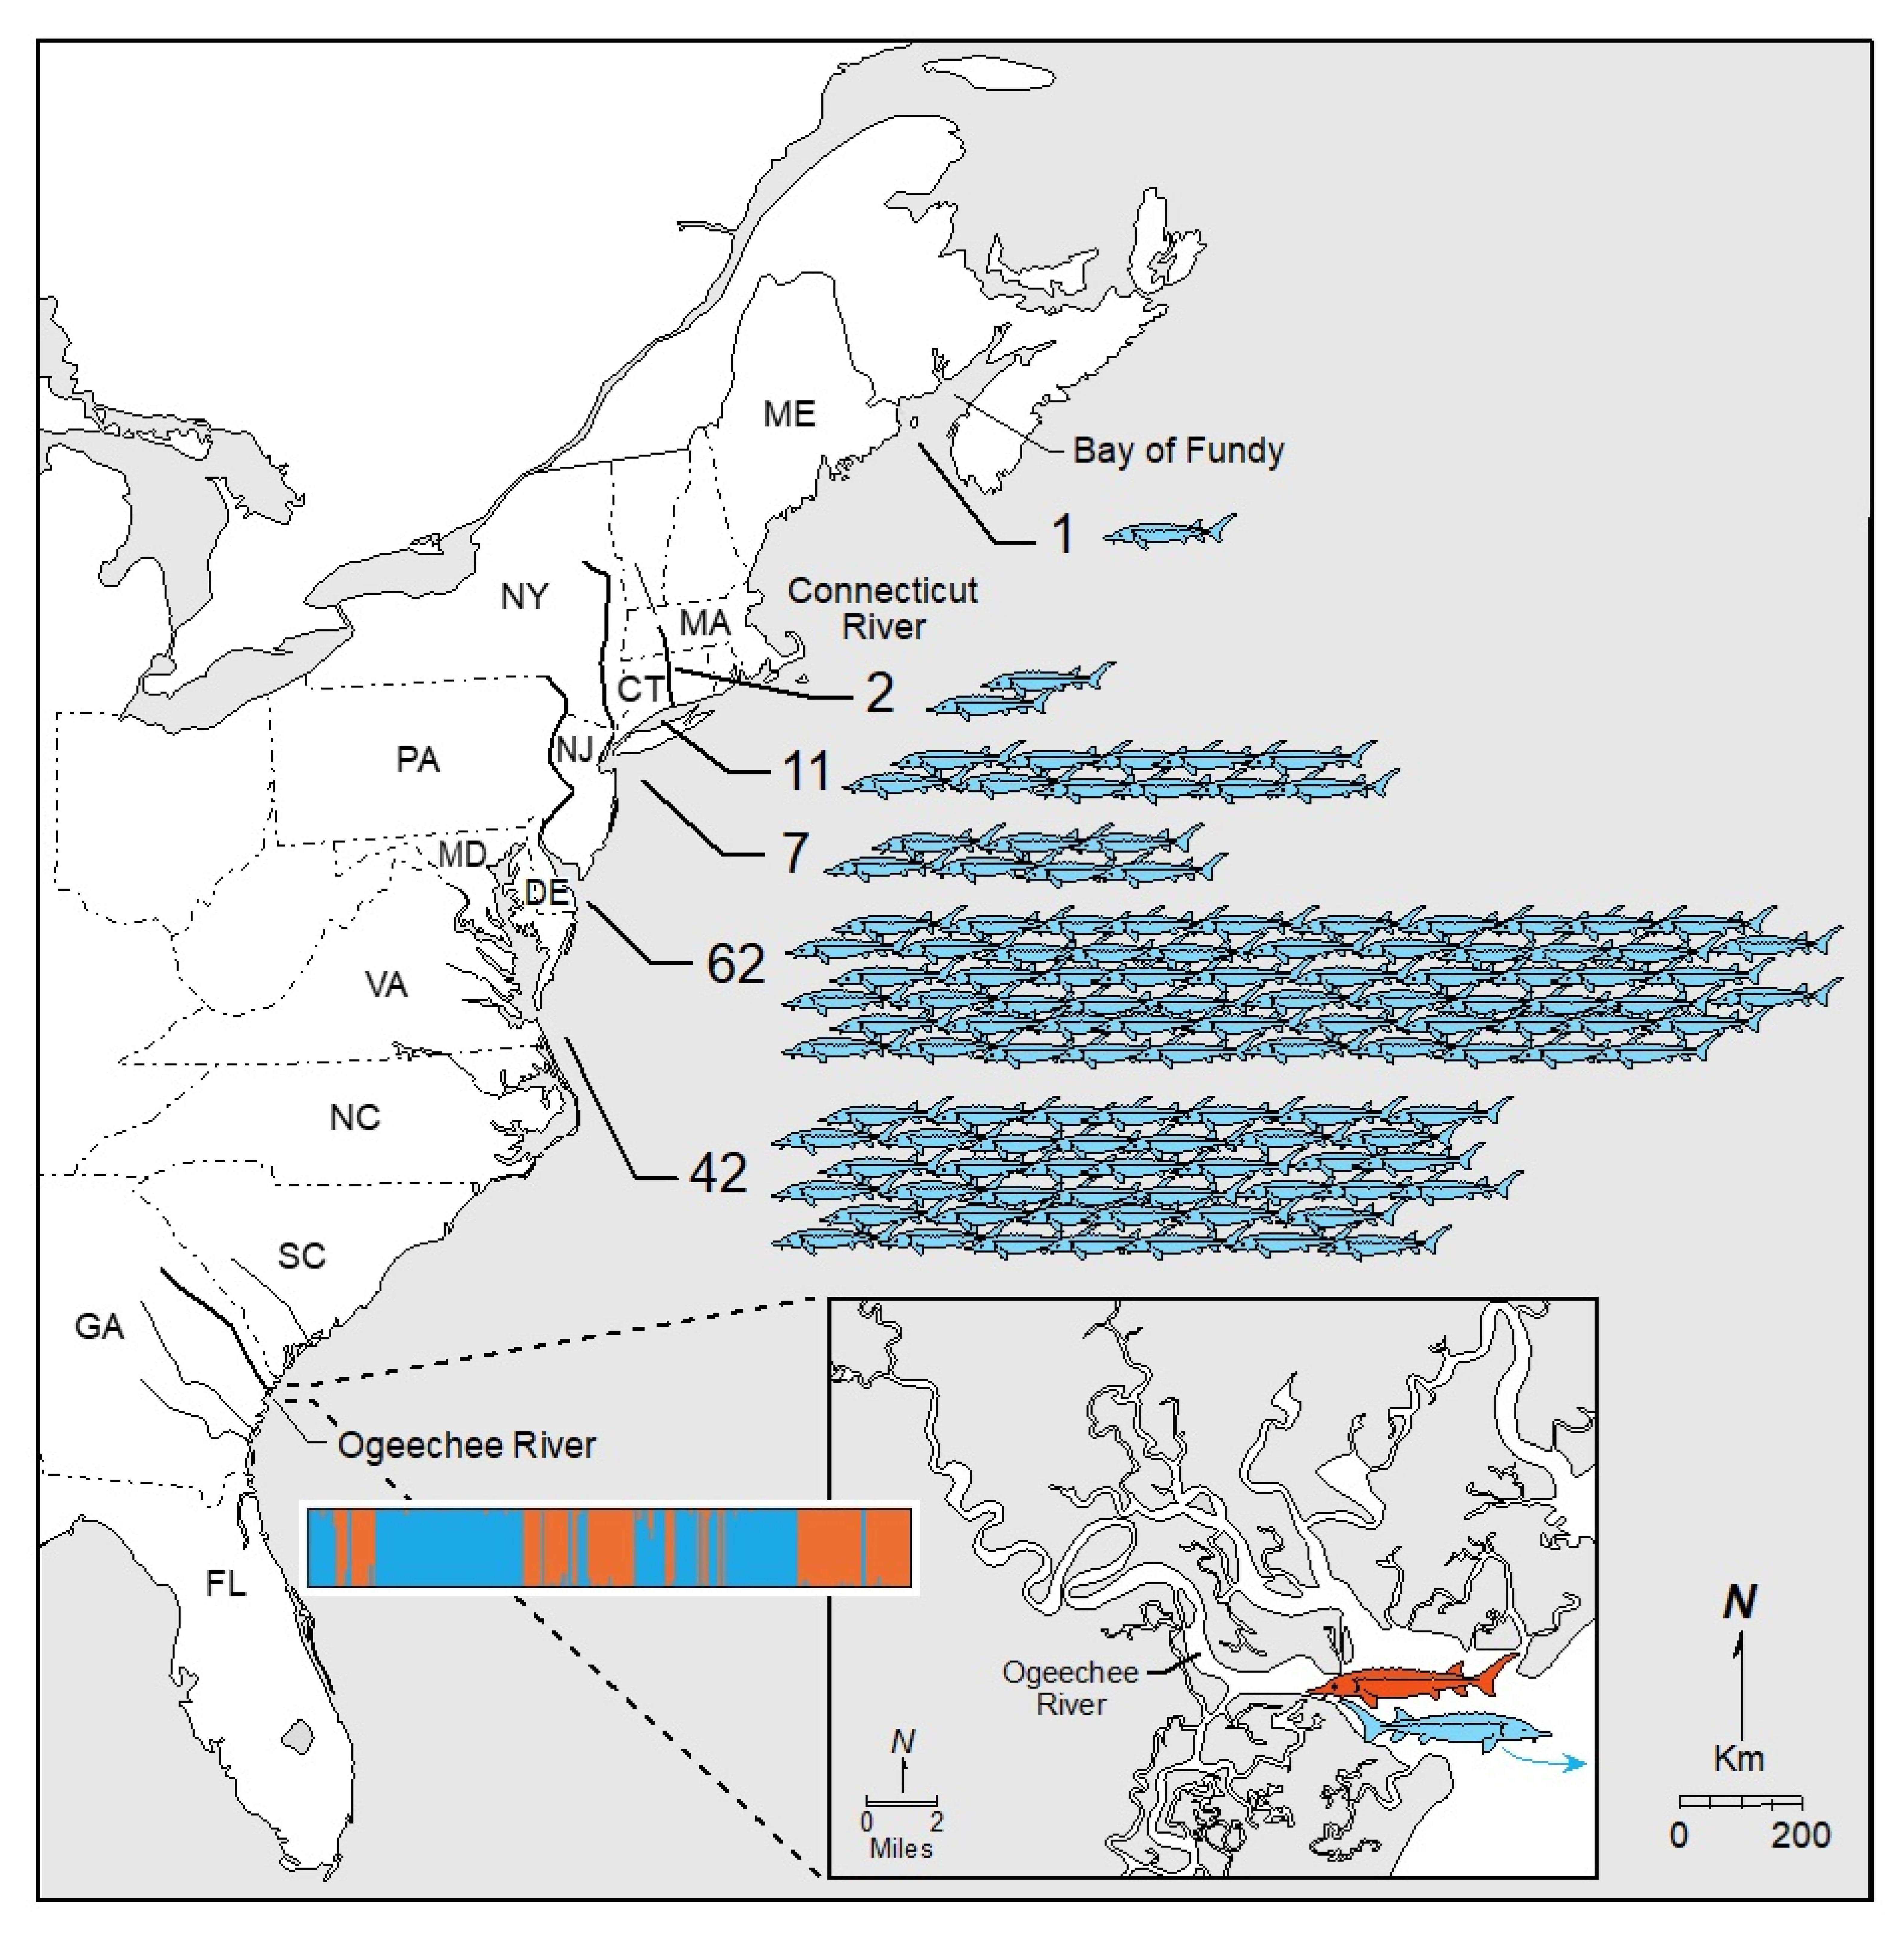
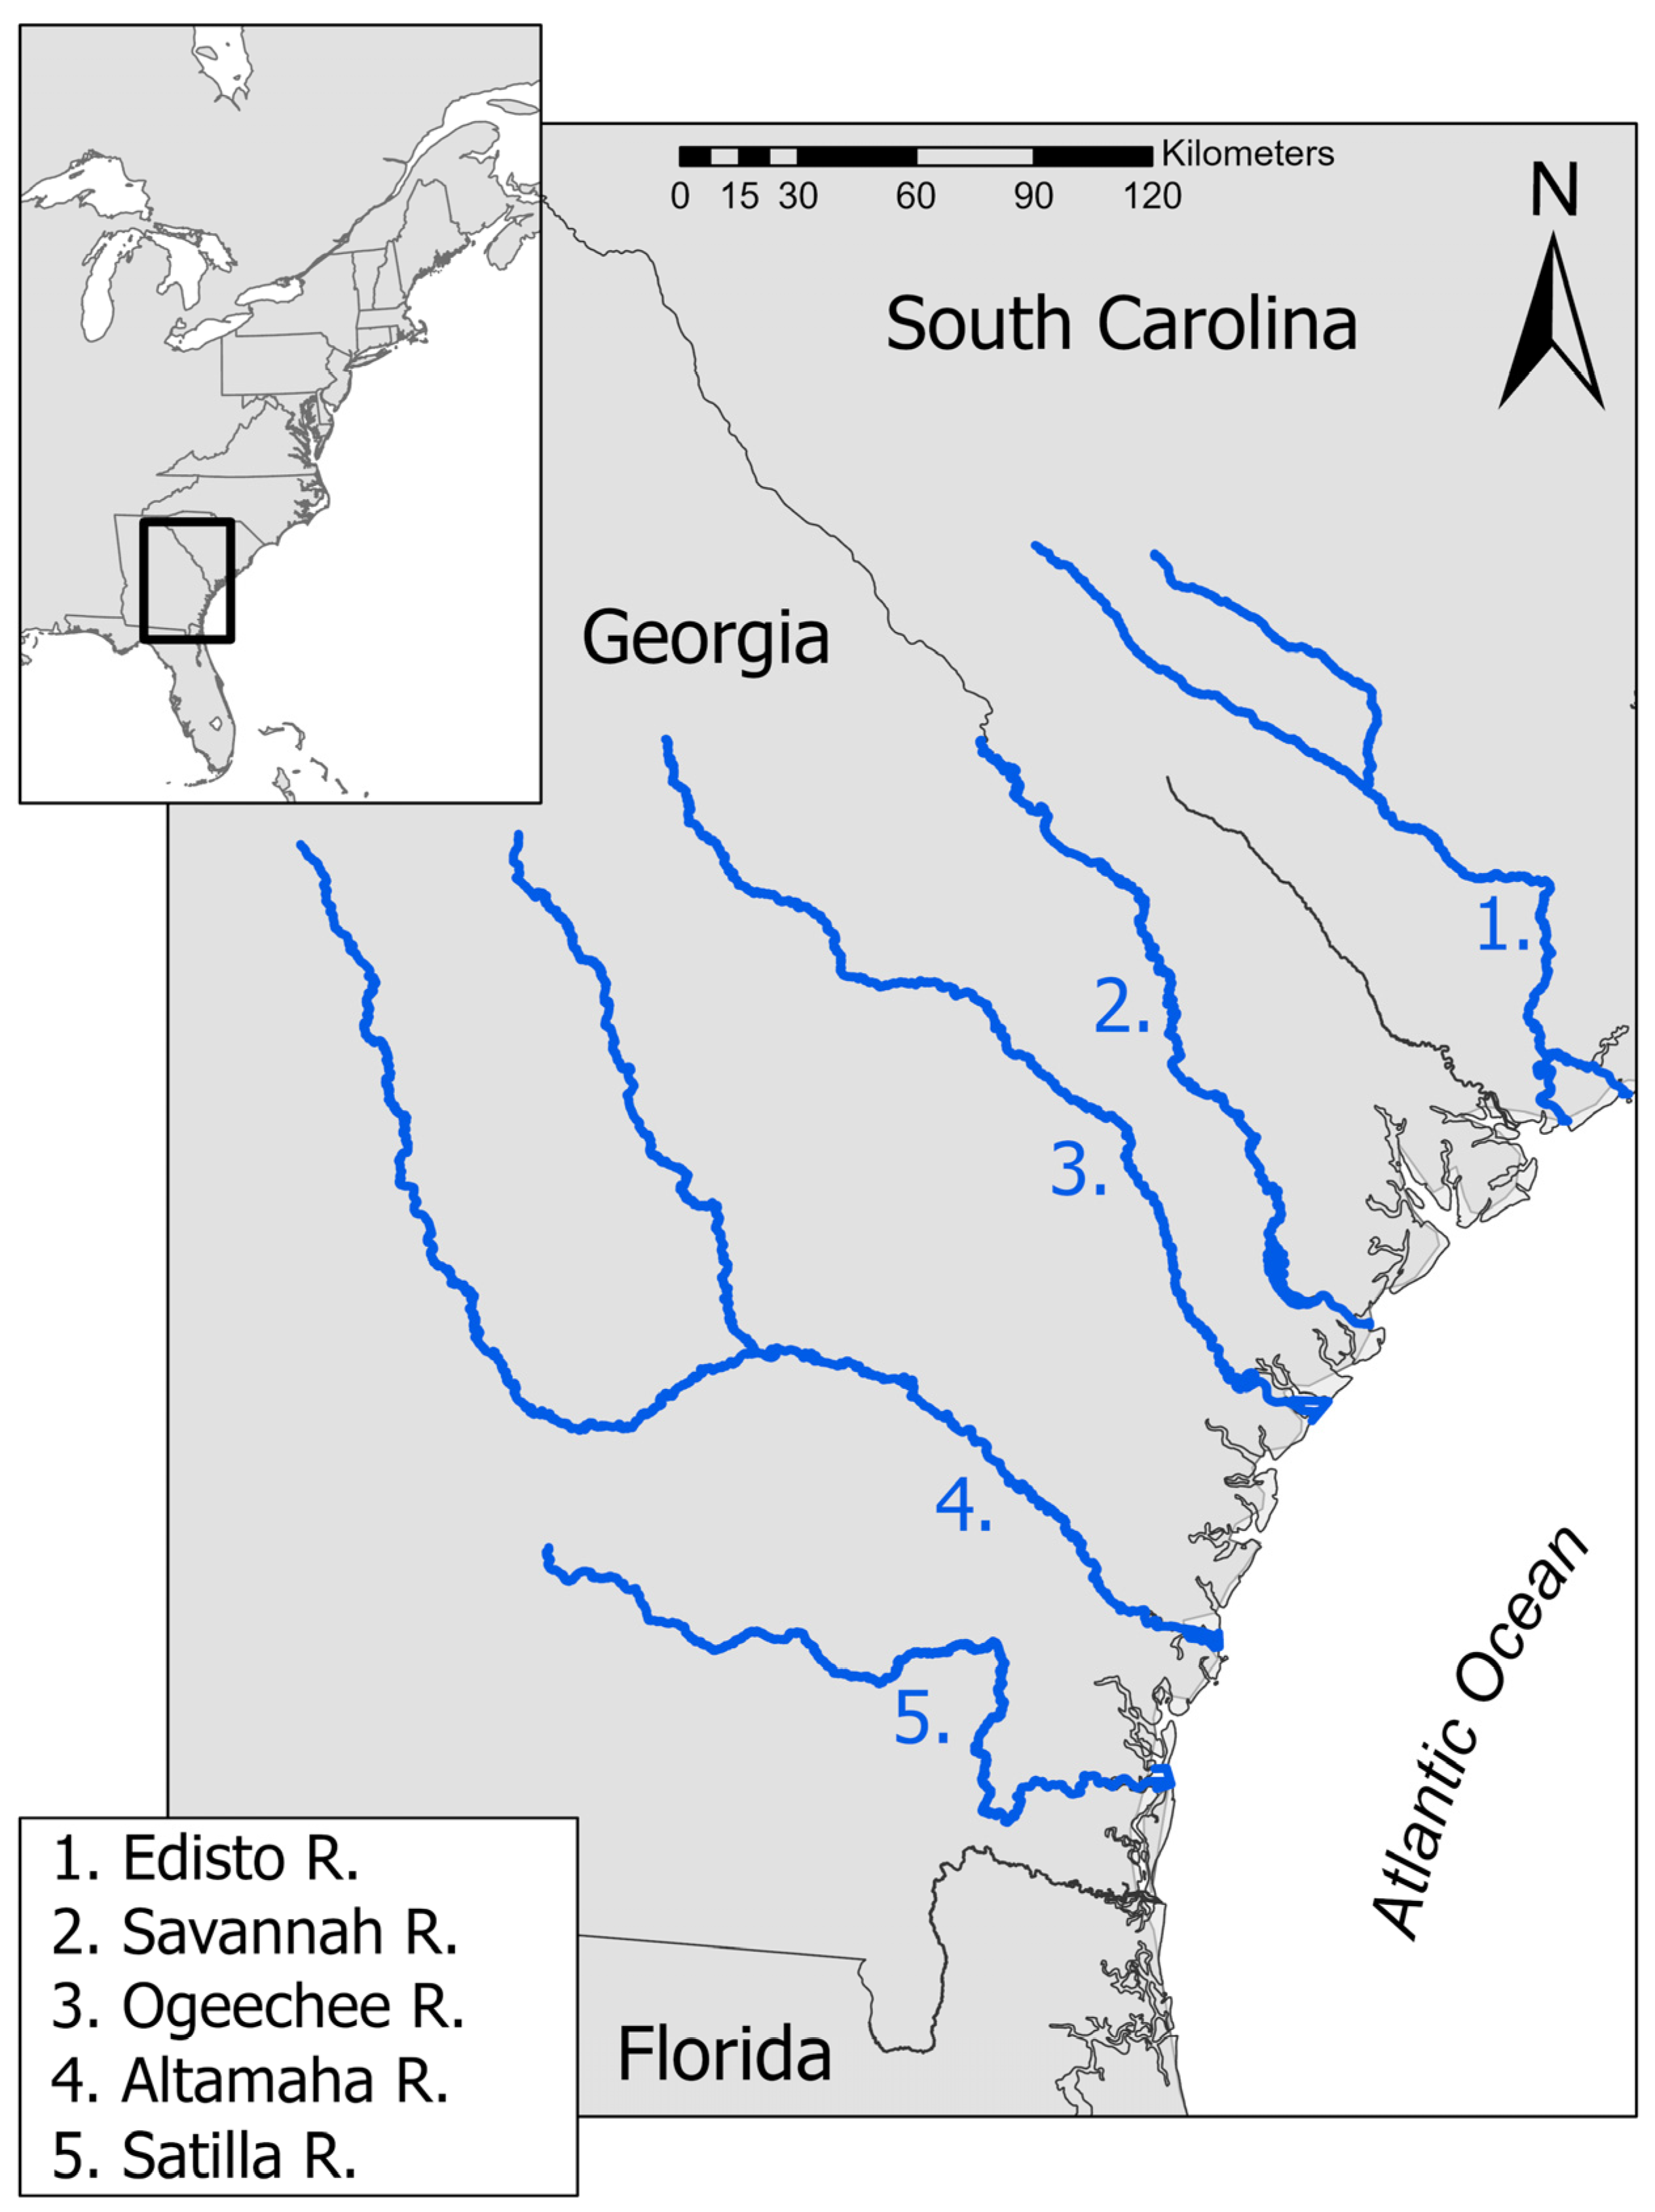
34], almost all of these juvenile specimens were age-1 fish. The Ogeechee River is a blackwater river that originates near the edge of the Georgia Piedmont plateau and flows approximately 390 km in a southeasterly direction before draining into Ossabaw Sound and the Atlantic Ocean south of Savannah, Georgia (
Figure 1). Its only major tributary, the Canoochee River, converges with the Ogeechee River approximately 55 km from the Atlantic Ocean. The Ogeechee River system is nearly undammed, allowing sturgeon and other anadromous fishes access to approximately 97% of the historic spawning habitat in this river [
6]. The head of tide is located about 61 km from the mouth.
The sturgeon analyzed in this study from the Ogeechee River were captured with anchored monofilament gill and trammel nets set in the lower Ogeechee River system from approximately river kilometer 40–70, including the lower 5 km of the Canoochee River. Sampling occurred 3–5 days per week at slack tides during daylight hours. Sample collections occurred during two time periods: June through August 2007–2009 (see [
35] for detailed collection methods) and May through July 2014–2017 [
36]. At a typical sampling occasion, one trammel net and two gill nets were set; some occasions featured a doubled effort. Each captured sturgeon was scanned for external and PIT (passive integrated transponder) tags and, if no tag was present, implanted with a PIT tag with a unique identification code. Each fish was measured, and a small, ~1-cm
2 clip was taken from the dorsal fin for genetic analysis. Fin clips were stored in 95% ethanol at room temperature. All specimens were released in good condition at the capture site. Specimens from the Ogeechee, Satilla, Altamaha, and Savannah rivers described in this study were collected under approval of the UGA institutional animal care and use committee. The animal use protocols we worked under included: A2009 12-211-Y3-A0, A2013 01-012-Y3-A1, A2016 02-004-Y3-A1.
Additionally, 1512 subadult and adult Atlantic sturgeon individuals from six mixed stocks were collected from the Bay of Fundy between 2007 and 2014 ([
24], Wirgin unpublished data), from Long Island Sound between 2006 and 2009 [
25], from the Connecticut River between 1989 and 2011 [
25], from the Delaware Coast between 2009 and 2014 [
26], from incidental catches off the Virginia and North Carolina coasts in winter tagging cruises for striped bass between 1998 and 2006 [
37], and from bycatch from Maine to North Carolina in NOAA’s Observer Program between 2009 and 2012 [
27]. Characterizations of most of these collections were previously reported in the above-referenced publications. Fin clips taken from mixed-stock specimens were preserved in 95% EtOH and shipped to the NYUMC lab for genetic analysis.
1.2. DNA Isolations
The fin clips were initially washed with PBS buffer, incubated in CTAB buffer [
38], digested with proteinase K at 65 °C, and purified by standard phenol-chloroform extractions and alcohol precipitations [
24]. The concentrations and purities of DNA isolates were evaluated using a NanoDrop ND-1000 Spectrophotometer (NanoDrop Technologies, Wilmington, DE, USA). The DNA concentrations of samples were adjusted to 50 ng/μL for the standardization of subsequent procedures.
1.3. Microsatellite Analysis
Eleven informative microsatellite loci were scored, including LS19, LS39, LS54, LS68 [
39], Aox23, AoxD45 [
19], Aox44, AoxD165, AoxD170, AoxD188, and AoxD24 [
20]. These loci were selected because they could be reliably scored by us, are not tightly linked, and, in previous studies, were effective in distinguishing Atlantic sturgeon collections from different spawning populations [
19,
40] and for use in our mixed-stock analysis of coastal aggregations from a variety of locales [
24,
25,
26,
27] and migrants to non-natal estuaries [
25,
29,
40].
Microsatellite PCRs were in 12.5 μL total volumes that contained 50 ng of template DNA, 1.25 μL of 10× Roche Applied Science (Indianapolis, IN, USA) or 10× KlenTaq1 reaction buffer (AB Bioscience, LLC, St. Louis, MO, USA), 0.1 μL of each dNTP (25 mM stocks) (GE Healthcare, Piscataway, NJ, USA), 0.5 μL of both labeled (Sigma Aldrich, St. Louis, MO, USA) and unlabeled primers (Integrated DNA Technologies, Coralville, IA, USA) (1.0 μM stock), 0.05 μL (1 unit) of Taq DNA Polymerase (Roche Applied Science) (LS19, LS39, AoxD170) or 0.025 μL of KlenTaq (25 units/μL) (all other loci), and ddH20 to volume. The initial denaturation was at 95 °C for 5 min, and 55 cycles were at 95 °C for 15 s, 60 °C (except Aox45 at 62 °C, Aox23 at 64 °C, and LS19, LS39, and AoxD170 at 50 °C) for 15 s, 72 °C for 30 s, and a final extension at 72 °C for 7 min.
The characterization of microsatellite genotypes was performed using a Beckman Coulter CEQTM8000 sequencer. PCR reactions were multiplexed and multi-pooled, diluted up to 1:3 with Sample Loading Solution, loaded onto 96-well plates along with 0.5 μL of CEQ DNA Size Standard-400 and 40 μL of Sample Loading Solution, and run with the FRAG 1 program (Beckman Coulter, Fullerton, CA, USA).
1.4. Statistical Analysis
Composite microsatellite genotypes at the 11 loci were compiled for the 13 reference populations, as well as the six mixed-stock collections. MICRO-CHECKER software [
41] was used to test for the presence of null alleles, errors due to microsatellite stuttering, and large-allele dropout in the microsatellite dataset. Exact tests in GENEPOP (version 4.2) [
42,
43] were used to test the genotypes at each locus and in each collection for their conformance to the Hardy–Weinberg equilibrium (HWE). Linkage disequilibrium (LD) was tested for all pairs of loci using contingency tables also implemented in GENEPOP. All tests of HWE and LD used the default Markov chain parameters in GENEPOP. The significance levels for HWE and LD tests were adjusted using the Benjamini and Yekutielli [
44] correction.
Allele frequency heterogeneity among all pairs of reference collections was analyzed using loglikelihood G-statistics, with 999 permutations implemented in GenoDive V.20b27 [
45,
46]. Genetic differences among river collections and genetic clusters within rivers were also quantified using Wier and Cockerham’s [
47]
FST analog θ, calculated in GenoDive.
FST is highly dependent on within-population diversity [
48,
49,
50]. When loci with large numbers of alleles are examined and the population diversity is high, such as in Atlantic sturgeon, the maximum value of
FST is severely deflated, complicating comparisons between populations or different loci. Thus,
F1ST tests that corrected the
FST estimates for heterozygosity within populations were conducted using GenoDive [
45]. In all instances, Benjamini and Yekutielli [
44] corrections were used to account for multiple tests. Measures of genetic diversity, including inbreeding coefficients, for each population were also calculated in Genodive.
The program STRUCTURE version 2.3.4 [
51] was used to evaluate the number of population clusters (
K) among the 13 reference population collections, with
K = 1–14. The admixture and correlation models were used, along with prior population information. Each
K was run 10 times, with burn-in and run lengths of 100,000. The genotypic data for populations in the South Atlantic DPS were input by the year of collection and, within each year, the date of collection. StructureSelector [
52] was used to determine the optimal
K value with the Δ
K [
53] and lnP(
K) methods [
51]. The MedMean
K, MaxMean
K, MedMed
K, and MaxMed
K methods described by Puechmaille [
54] were additional methods used to select the optimal
K value. These additional methods allow for more accurate determinations of
K when the samples sizes are uneven, such as for the Atlantic sturgeon reference collections in the current study. STRUCTURE analysis was also performed among the five collections from the South Atlantic DPS with
K = one to six. Finally, STRUCTURE analysis was also conducted on each individual river collection within the South Atlantic DPS with
K = one to three.
Individual-Based Assignment tests were used to quantify the contribution of the Ogeechee River as well as the 12 other spawning populations coastwide to the six coastal and non-natal estuarine aggregations of Atlantic sturgeon. These included the Bay of Fundy, Long Island Sound, Connecticut River, Delaware Coast, wintertime aggregations off the North Carolina Coast, and bycatch obtained from NOAA’s Observers Program bycatch extending from Maine to North Carolina. We also used these data to determine the overall contribution of these rivers to the combined coastal collections. Individual-Based Assignment tests, using multi-locus likelihood functions [
55], were used to determine the likelihood of each individual’s genotype being found among the 13 reference collections. Individual-Based Assignment tests were implemented in GeneClass2 [
56] using the Bayesian and frequency-based model of Cornuet et al. [
57]. The analysis determines the likelihood ratio, assuming that the gene pool is in Hardy–Weinberg equilibrium, with frequencies as specified in the reference collections.
2. Results
In total, 3104 juvenile and adult specimens from the 13 reference spawning populations were genotyped in this study. All loci were in Hardy–Weinberg equilibrium in all populations after Benjamini and Yekutielli correction [
44], with the exceptions of AoxD188, LS68, and AoxD170 in the Ogeechee River population. Similarly, all populations were in Hardy–Weinberg equilibrium across all loci after correction, with the exception of the Ogeechee River population (
p < 0.001).
All populations were significantly genetically distinct in pairwise
FST,
F1ST, and GST (data not shown) analyses after correction, including five populations in the South Atlantic DPS: the Edisto, Savannah, Ogeechee, Altamaha, and Satilla rivers (
Table 1). Details of these analyses of populations within the other four DPS will be provided elsewhere.
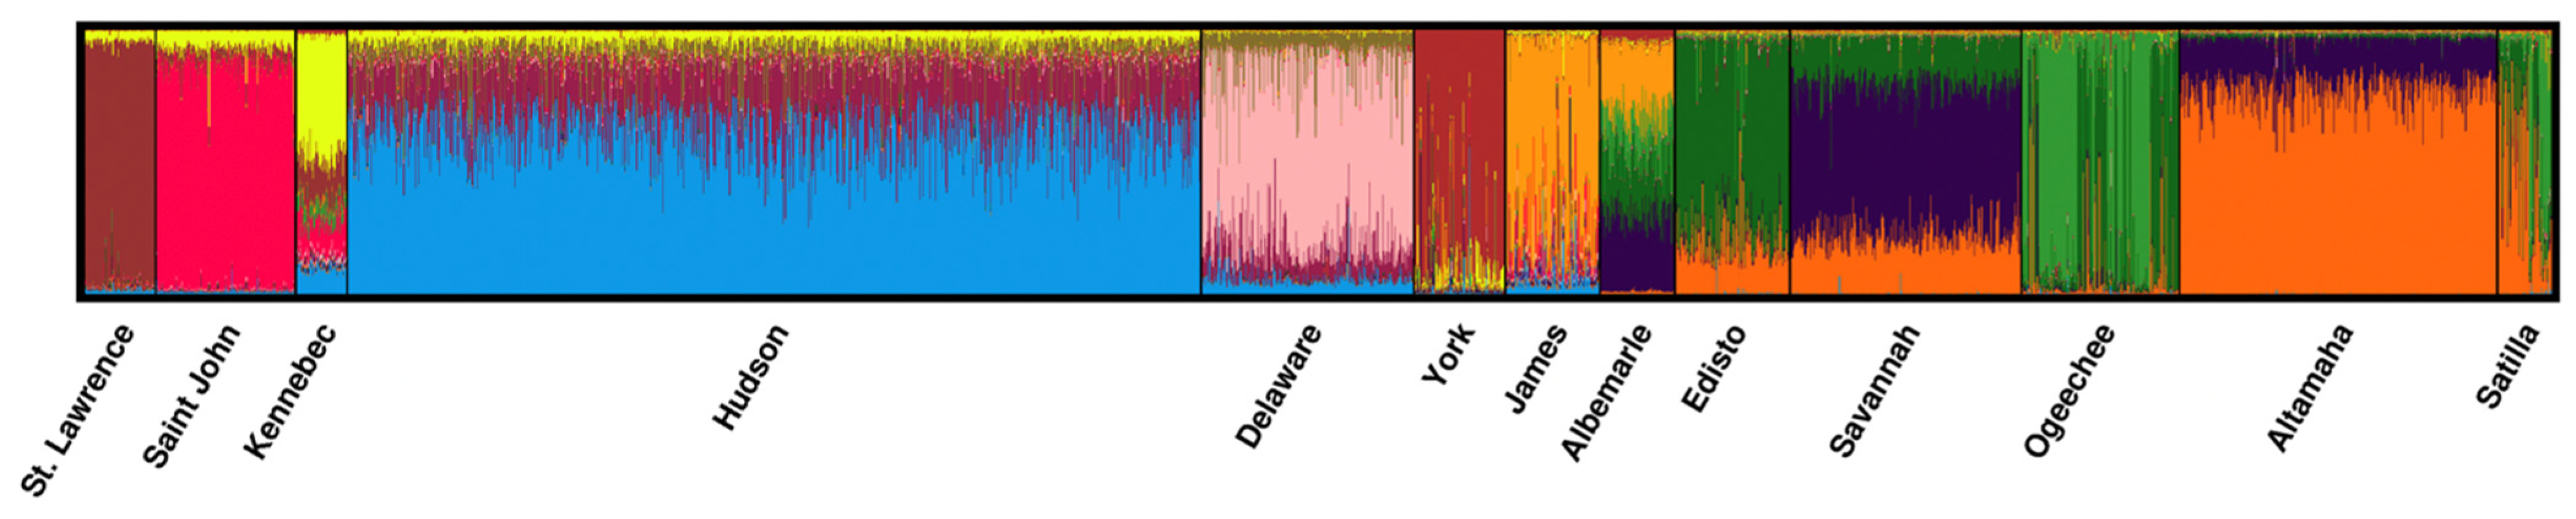
As expected, the use of STRUCTURE confirmed the presence of at least 13 genetic clusters across the 13 coastwide spawning river collections (
Figure 2). The use of the lnP(
K) approach indicated the presence of 13 genetic clusters (
K) among the coastwide collections. Similarly, all of the Puechmaille methods [
54] (MedMean
K, MaxMean
K, MedMed
K, and MaxMed
K) supported the presence of either 12 or 13 genetic clusters among the 13 reference population collections (
Supplementary Figure S1).
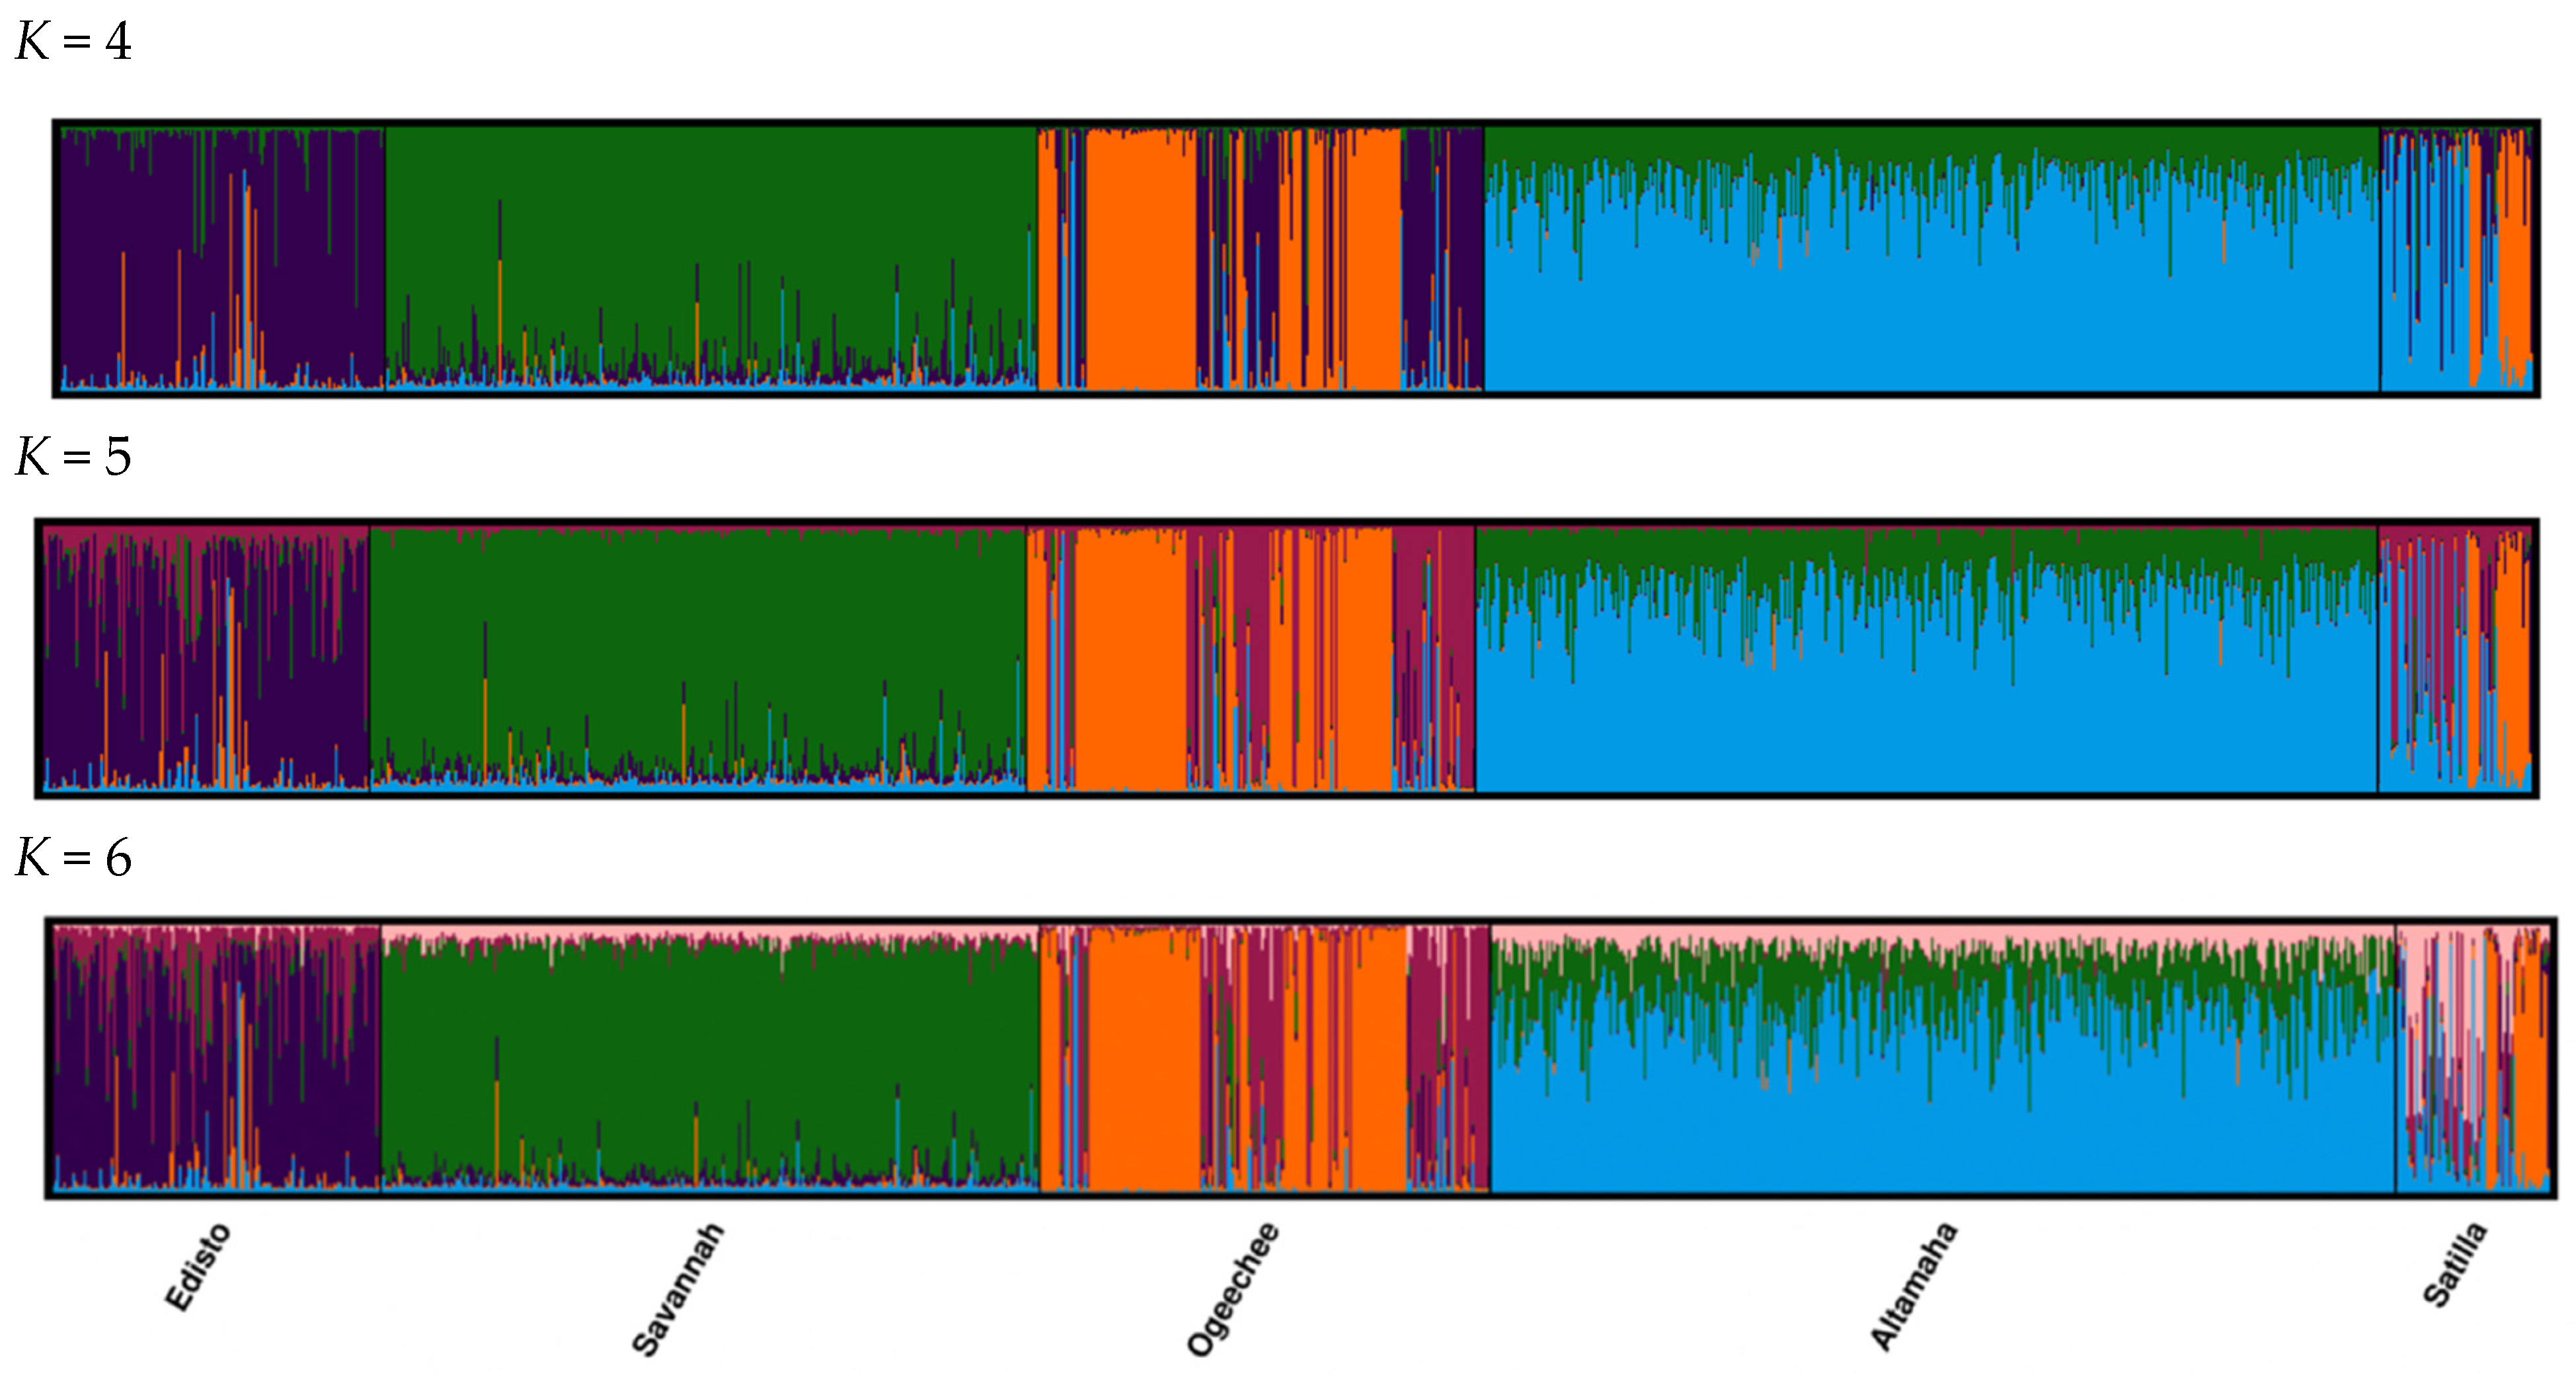
We used STRUCTURE to further explore for additional genetic differentiation among and within populations of the South Atlantic DPS. Initially, the use of the lnP(K) approach suggested the presence of six genetic clusters among the five collections from rivers in the South Atlantic DPS (Edisto, Savannah, Ogeechee, Altamaha, and Satilla) (
Figure 3), whereas all of the Puechmaille methods indicated the presence of four genetic clusters among these collections. The inspection of the STRUCTURE diagram with
K = four to six (
Figure 3) did not suggest the presence of further divisions within the Savannah or Altamaha river clusters; however, this was not the case for the Ogeechee, Edisto, and Satilla rivers collections, where more than one genetic cluster was evident for each (
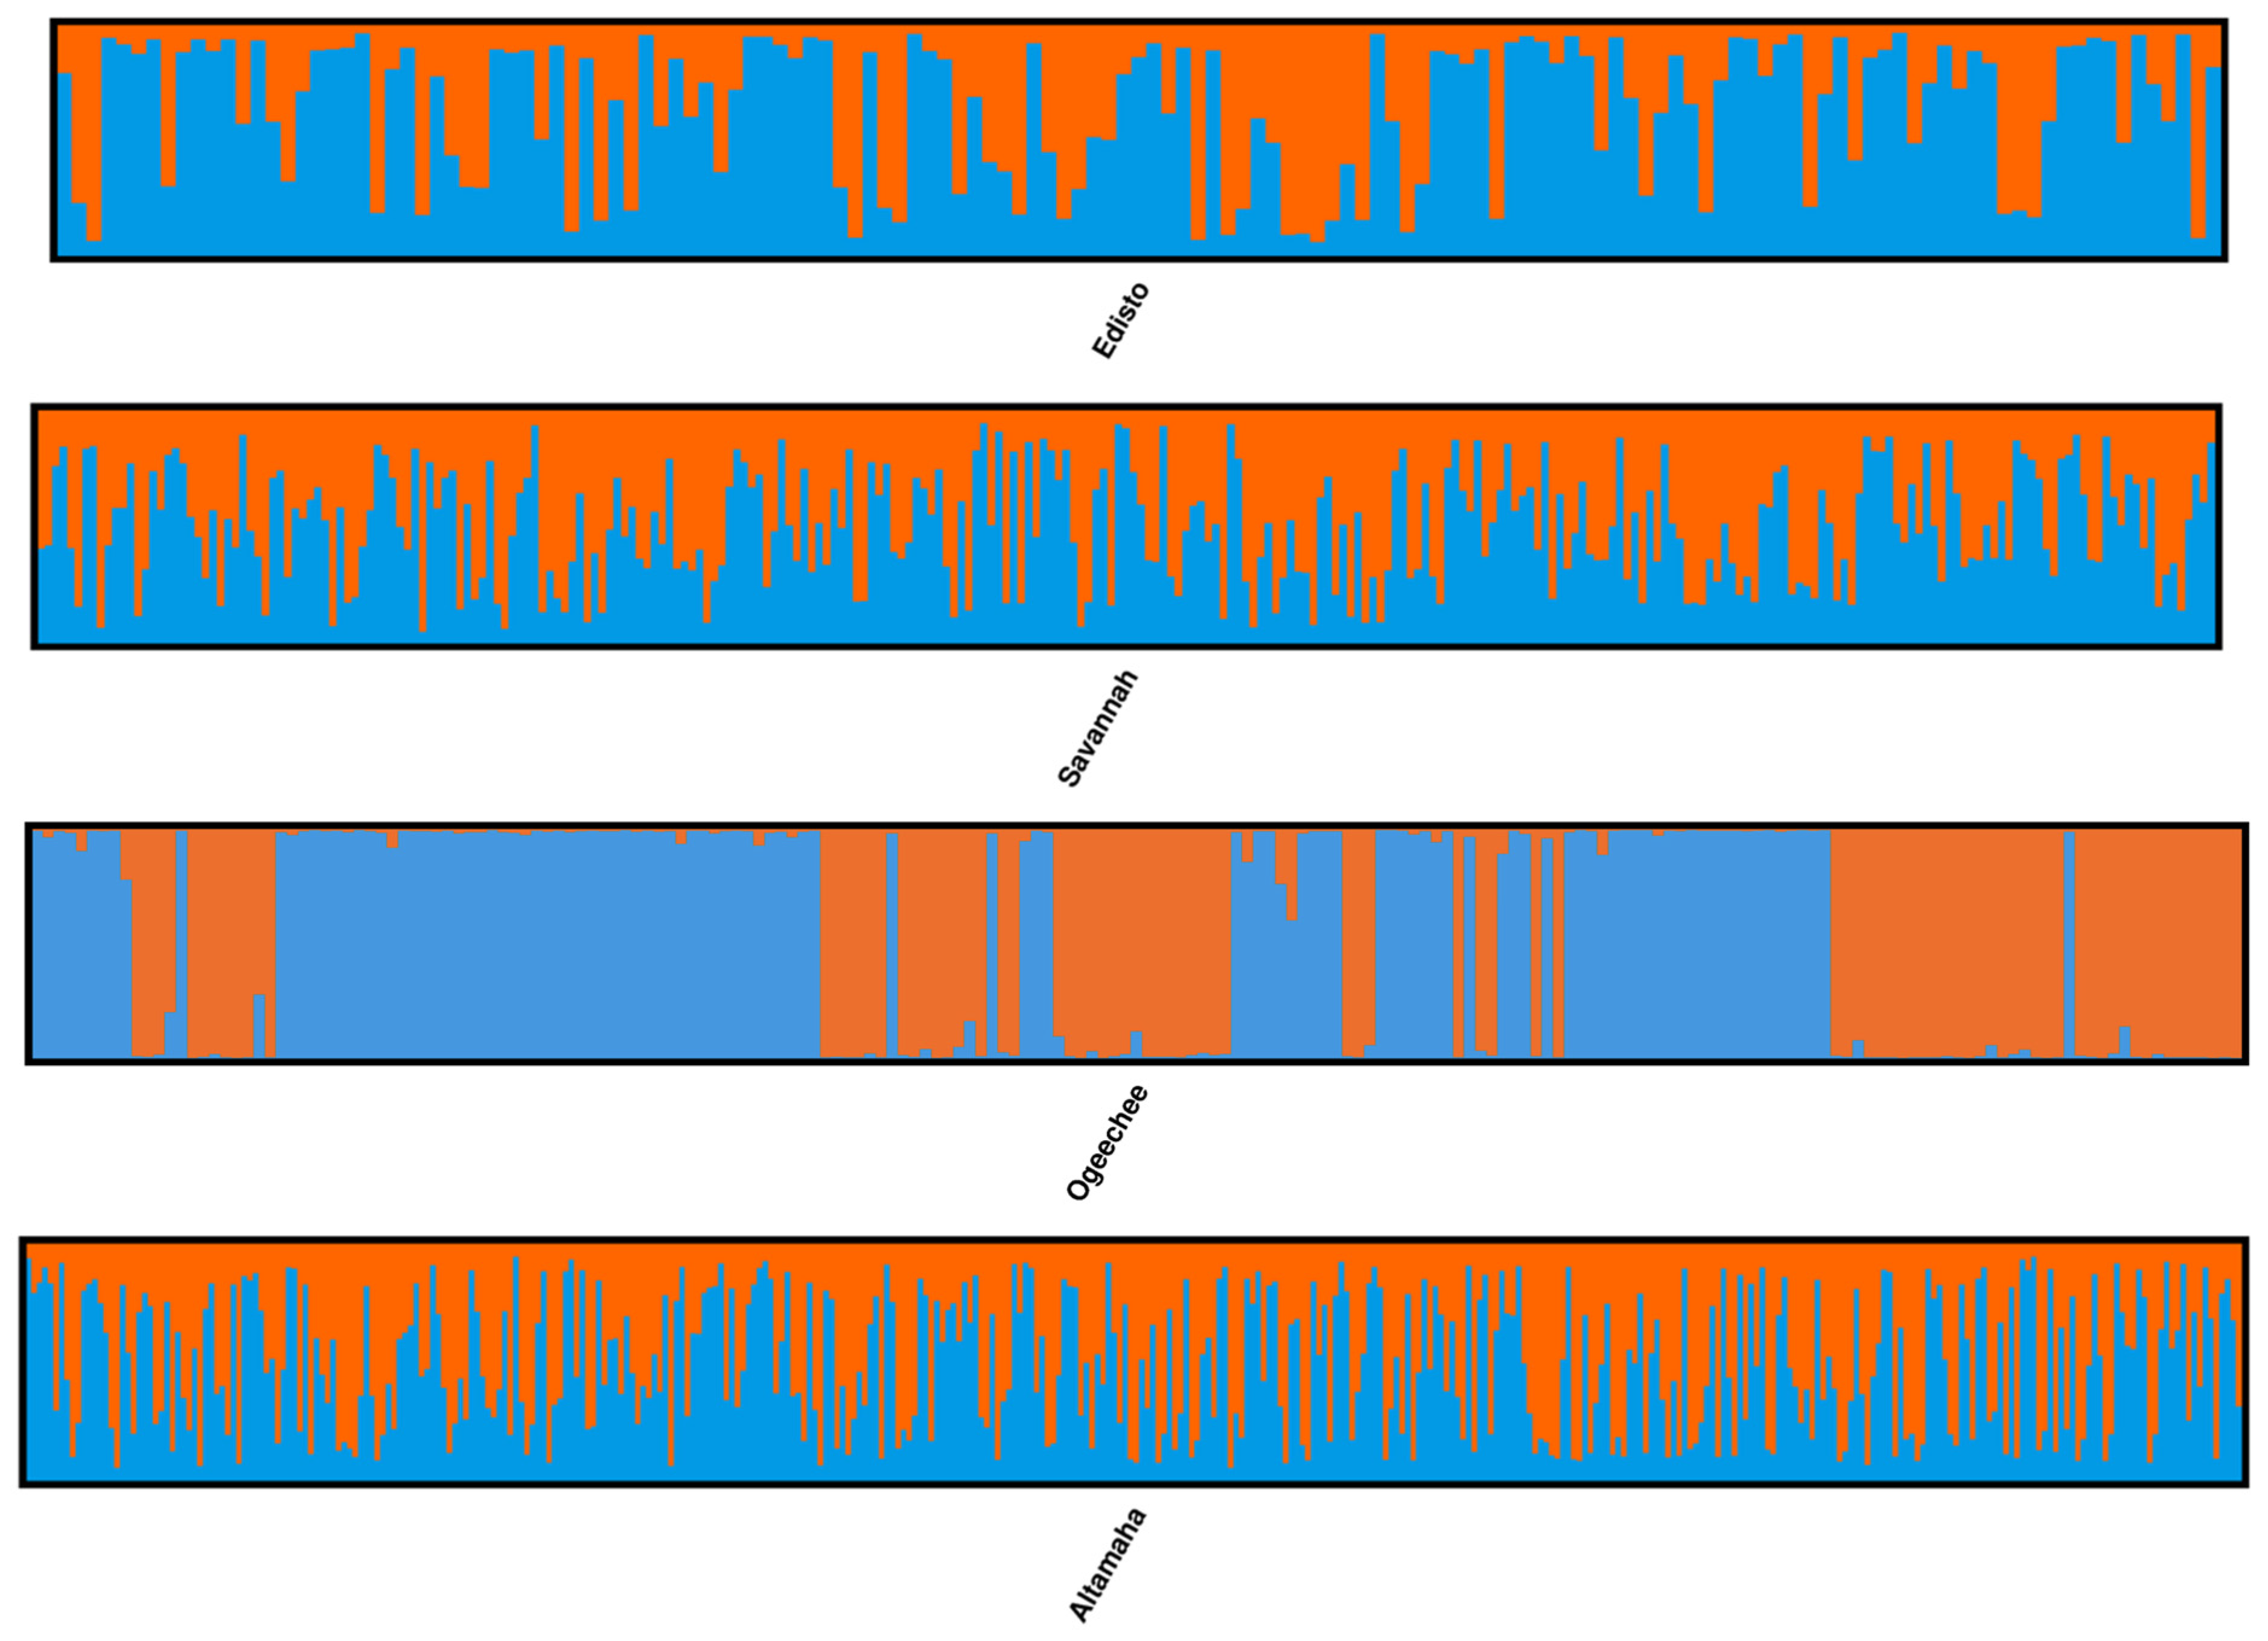
Figure 3). Further STRUCTURE analysis was conducted individually on each river collection from the South Atlantic DPS. This analysis did not demonstrate more than a single genetic cluster in either the Savannah or Altamaha river collections (
Figure 4); however, this was not the case for the Edisto, Ogeechee, or Satilla rivers. A separate STRUCTURE analysis (
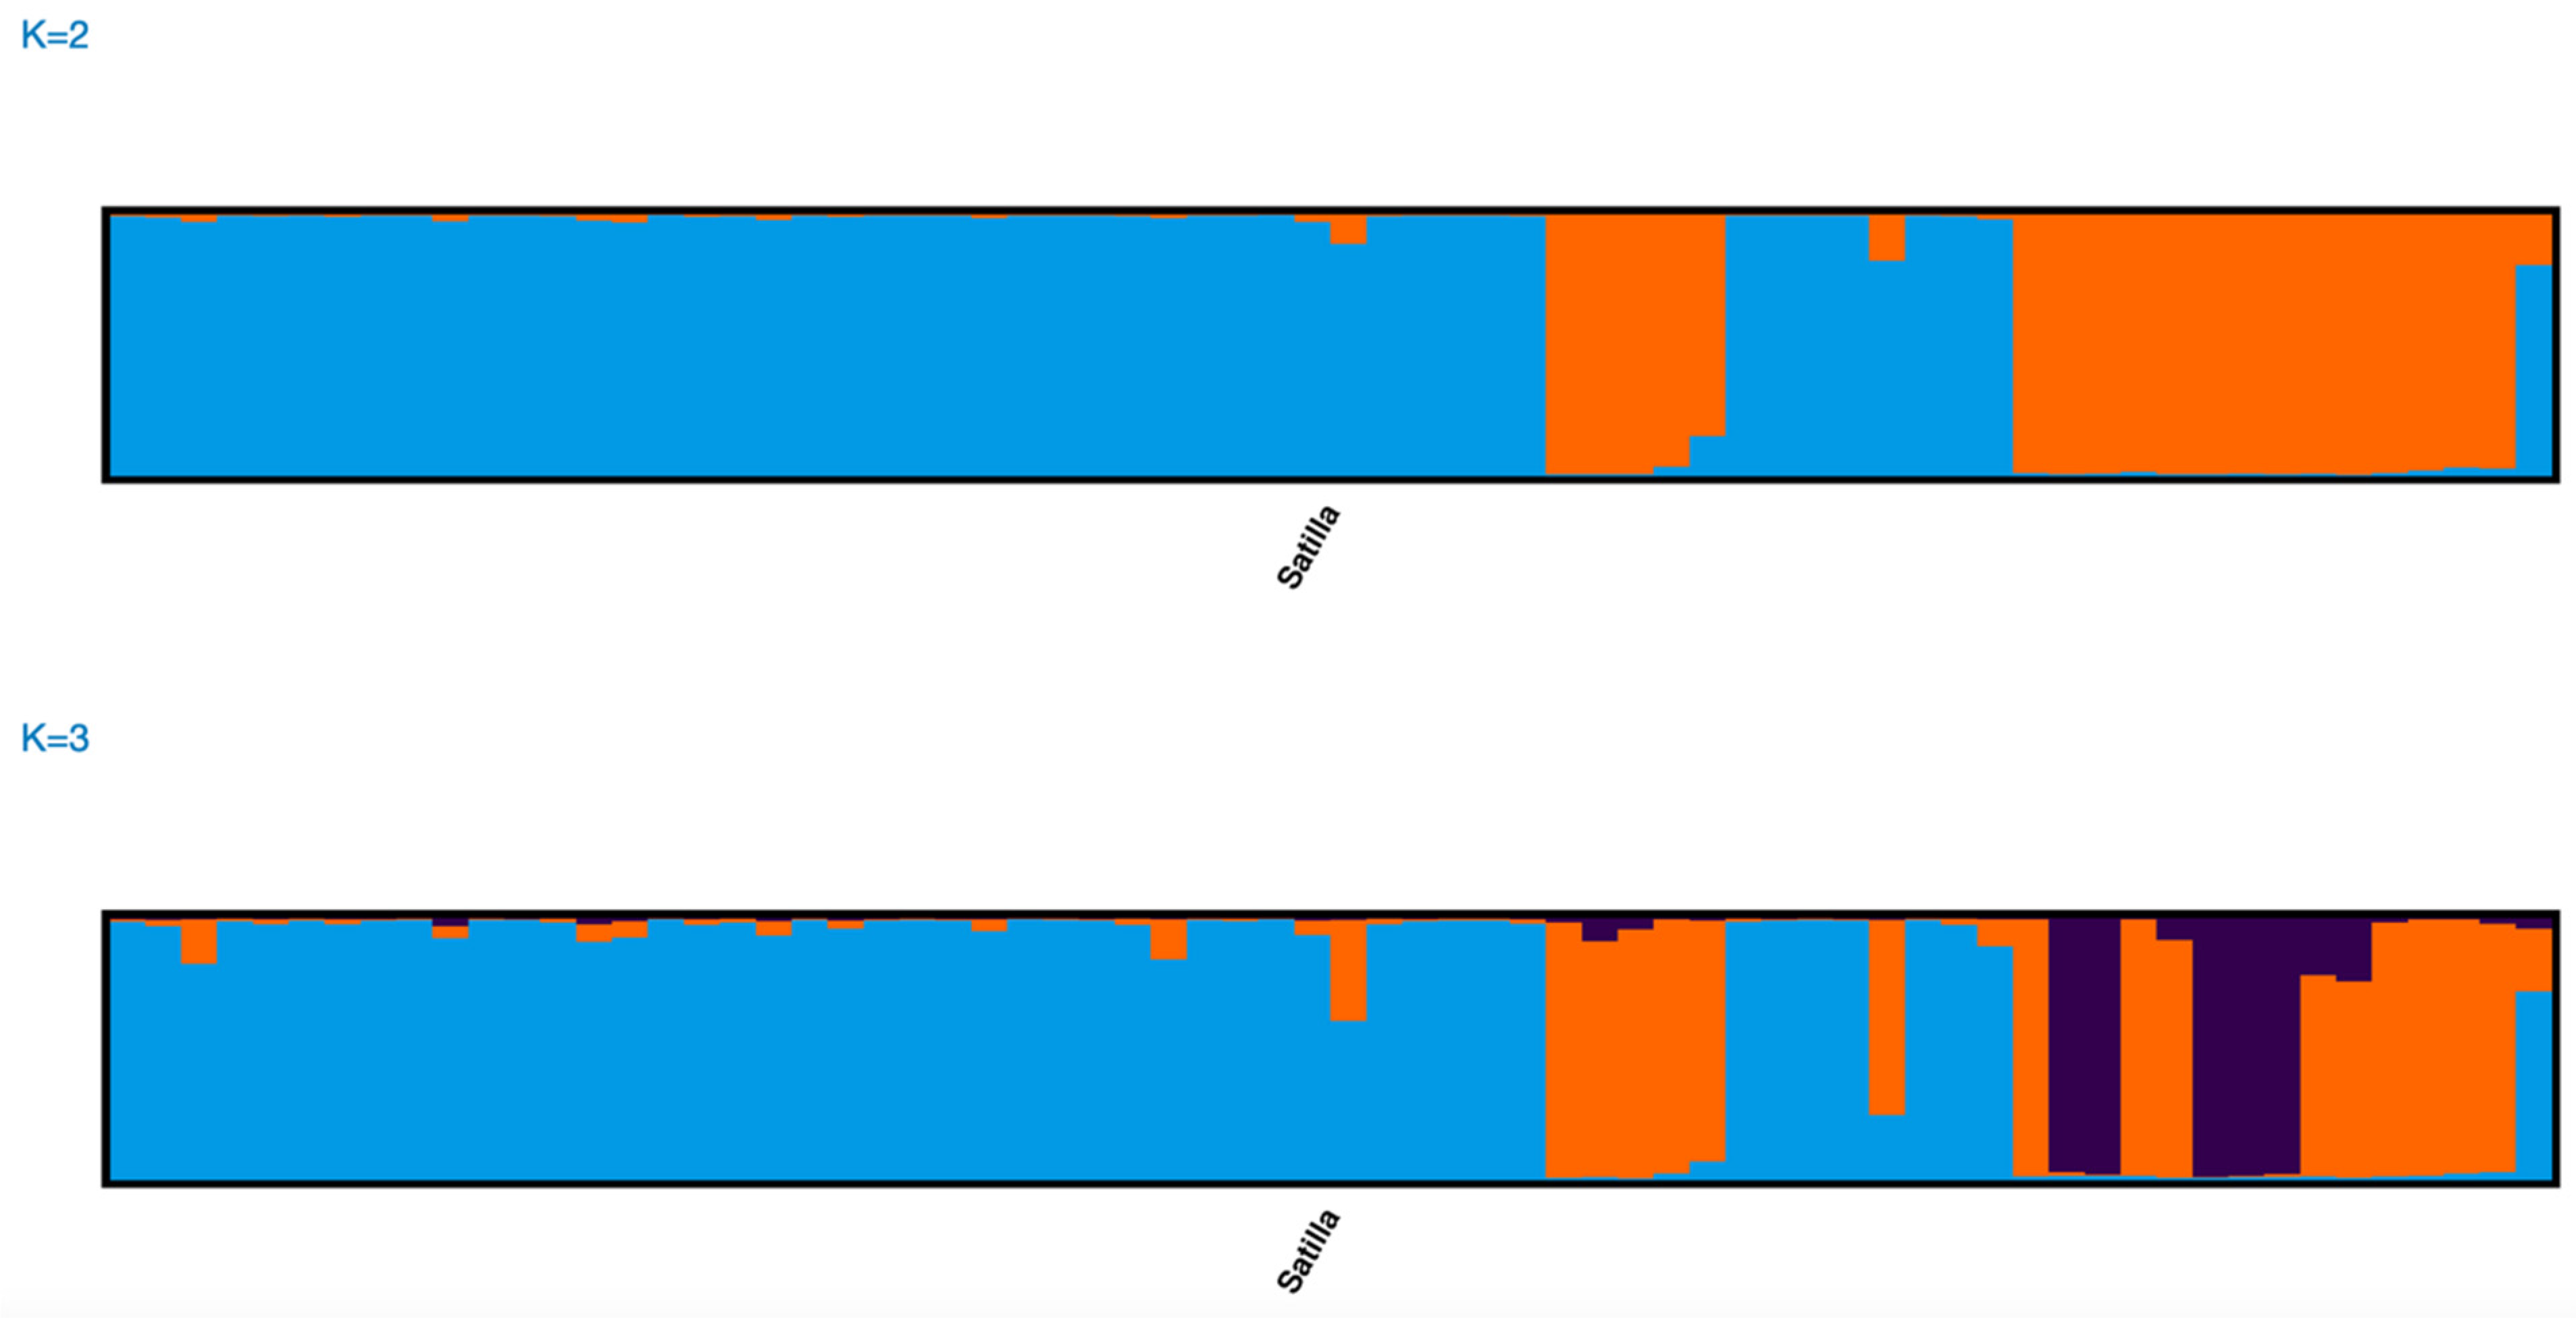
K = one to three) of each of these rivers’ collections revealed the presence of two genetic clusters within the Ogeechee and Edisto rivers (
Figure 4) and three genetic clusters within the Satilla River collection (
Figure 5). Based on the analysis of the Q matrix in the STRUCTURE of the Ogeechee River collection, 88 specimens were assigned to Group 1 and 111 specimens were assigned to Group 2. We further examined the probability of each individual assigning to each of the two genetic clusters in the Q matrix. The mean probability of correct assignments to the two clusters was high for both, at 0.989 for Group 1 and at 0.987 for Group 2. Similarly, based on the analysis of the Q matrix of the Satilla River collection, 20 specimens were assigned to Group 1, 34 specimens were assigned to Group 2, and 14 specimens were assigned to Group 3. The mean probability of correct assignments to the three clusters in the Satilla River was also high at 0.941 for Group 1, 0.908 for Group 2, and 0.952 for Group 3. In the Edisto River collection, 95 specimens were assigned to Group 1 and 50 specimens were assigned to Group 2, with mean probabilities of 0.852 and 0.769, respectively, which were lower than those for the clusters in the other two rivers.
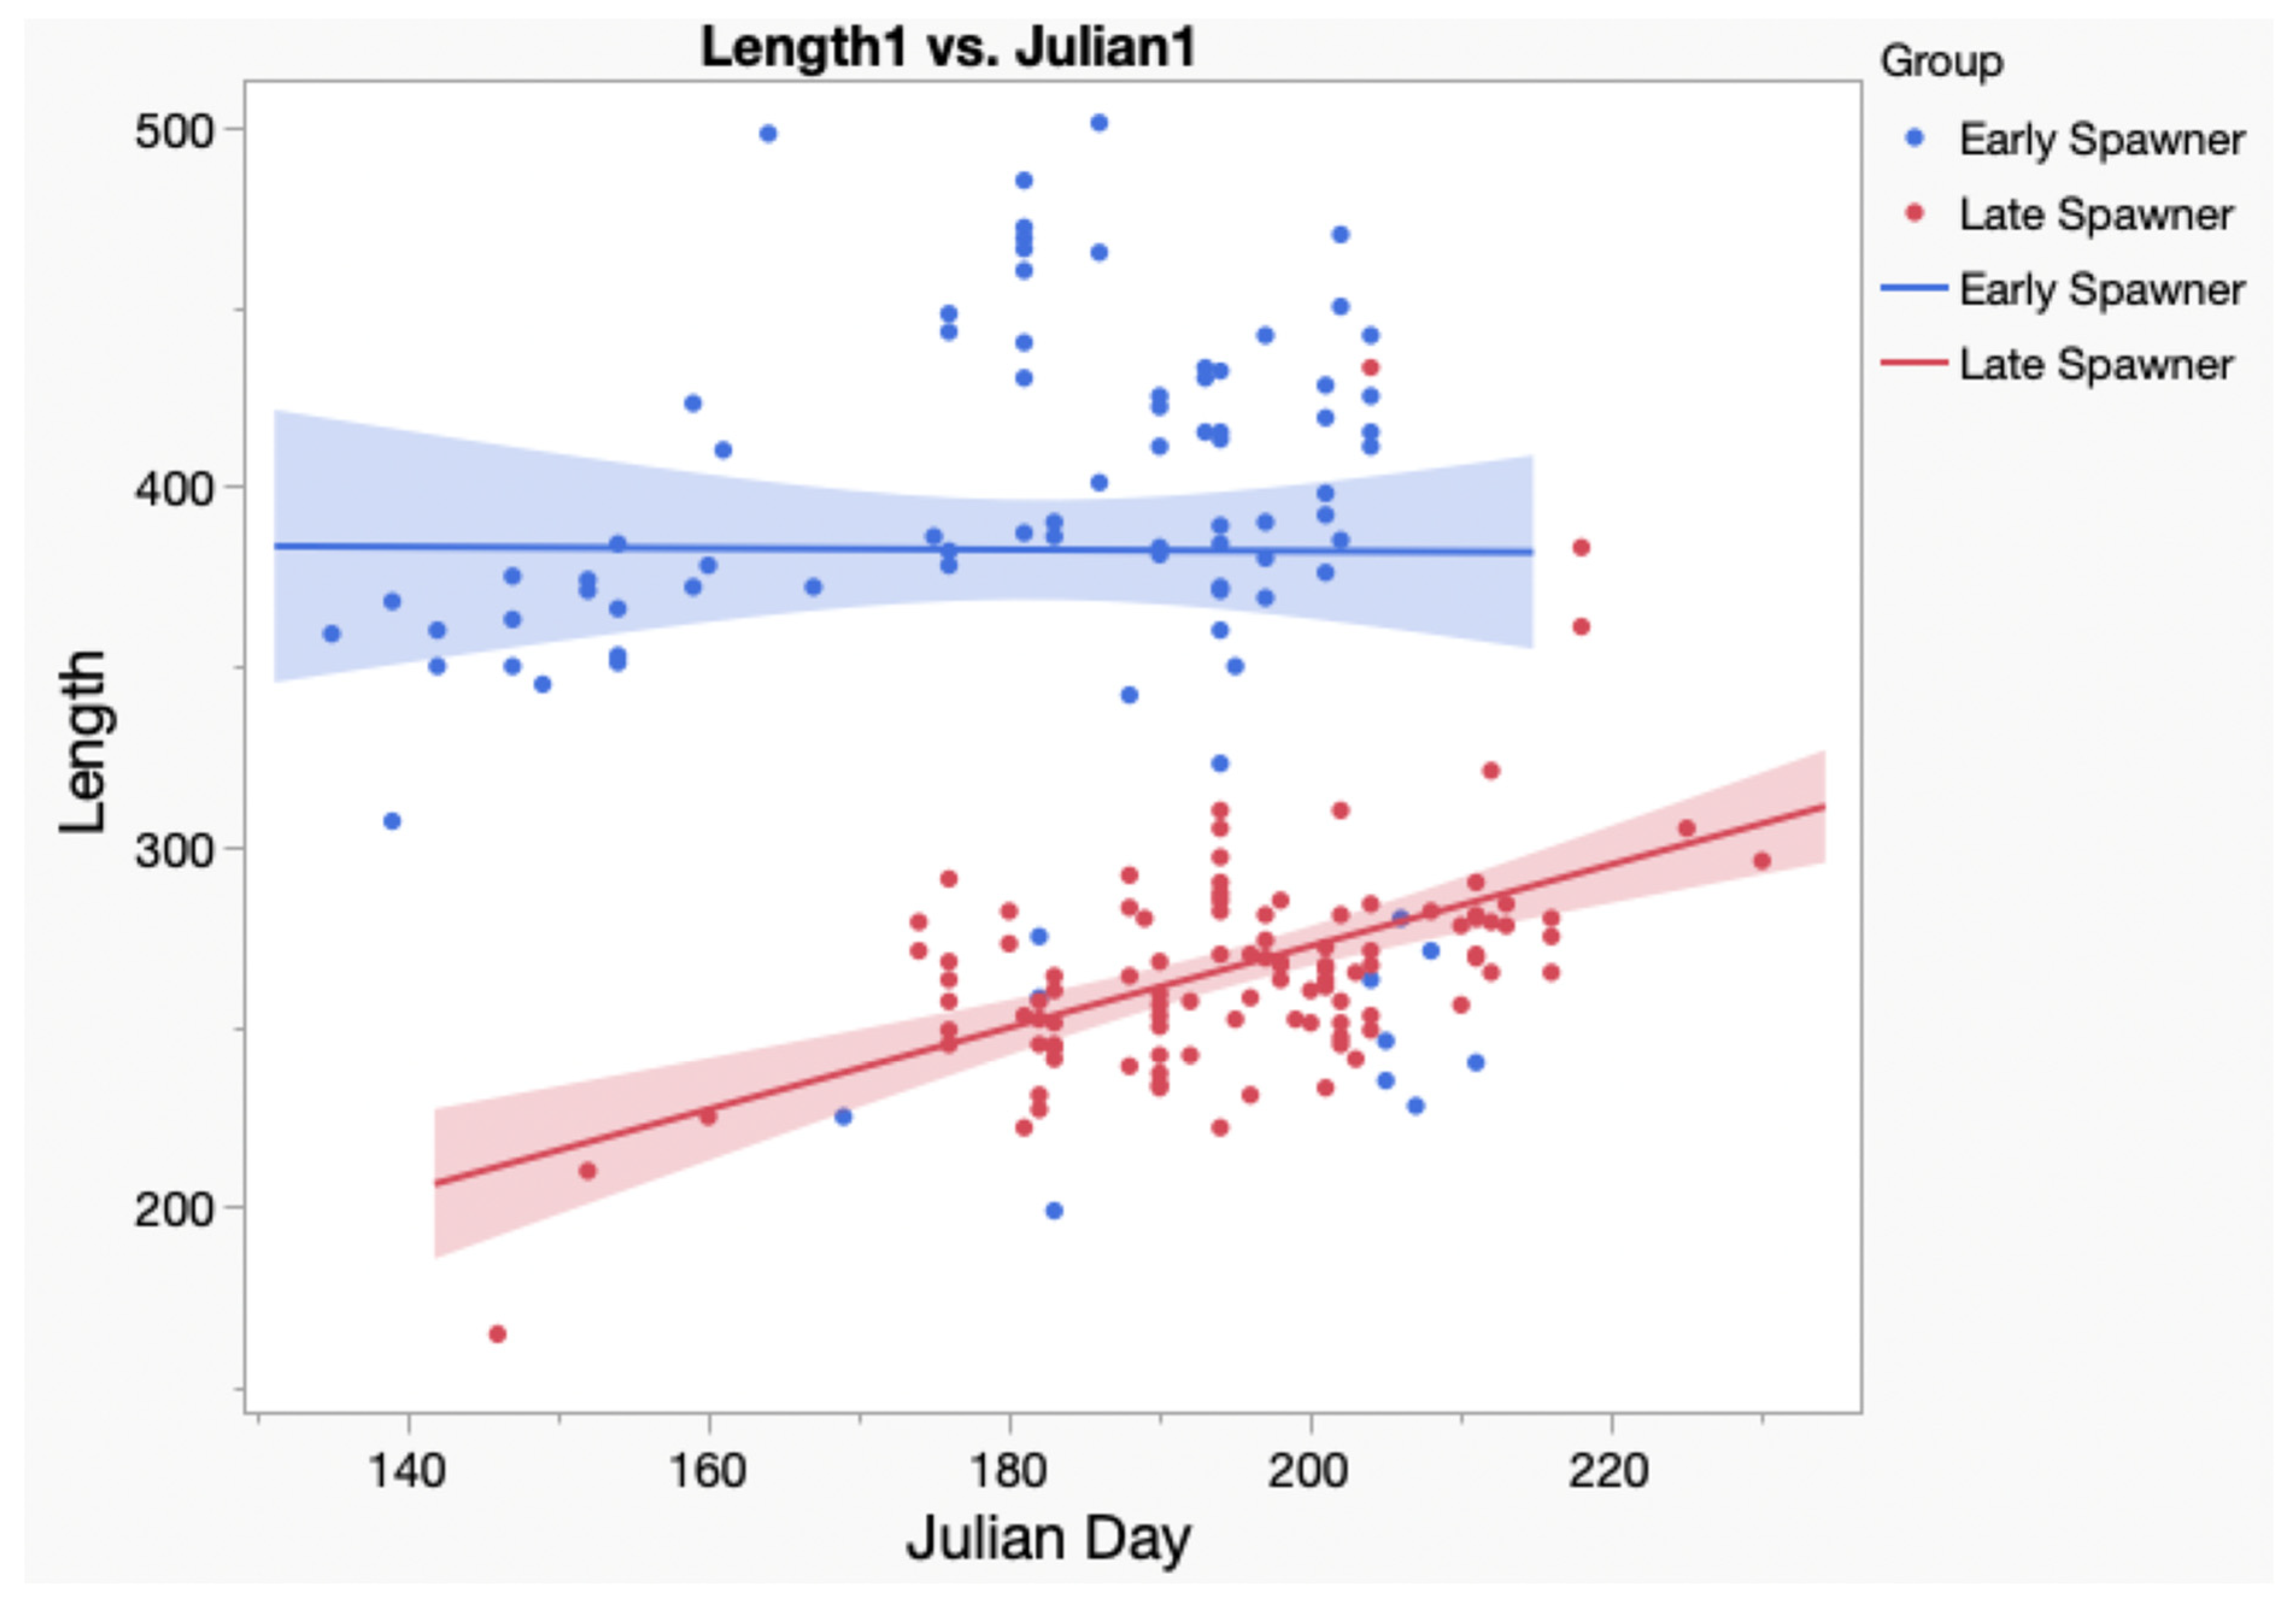
We proceeded to compare the size of the specimens in the two Ogeechee River genetic clusters. The mean total length of the specimens in Group 1 was 382.4 mm, and in Group 2, it was 271.2 mm. We then plotted the total length of individual specimens versus the Julian day on which they were collected in
Figure 6. The analysis of covariance of this plot indicates significant differences between their slopes (
p < 0.001). Two specimens assigned to Group 2 were omitted from this analysis, including the specimen (TL = 520 mm) collected on 10/27/07 (Julian day-300), because its collection date was much later than the mean Julian collection date (mean = 196) for other specimens in its group. A second specimen (TL = 520 mm) collected on 5/26/16 (Julian day-147) was also omitted because it was likely 2 years old. Based on these results, we believe Group 1, with the larger-sized specimens, spawned earlier in the Ogeechee than Group 2, with the smaller-sized specimens. The mean size of the specimens in the three Satilla River genetic clusters also differed, but not significantly. The mean size of the specimens in Group 1 was 432.5 mm, that in Group 2 was 390.6 mm, and that in Group 3 was 394.3 mm.
We then used
F1ST and
FST analyses to compare the extent of the genetic differentiation among the composite Edisto, Savannah, Ogeechee, Altamaha, and Satilla river collections (
Table 1) with that between the genetic clusters within the Ogeechee, Satilla, and Edisto rivers. All pairwise comparisons with both analyses were significant at the
p < 0.001 level. However, the extent of the genetic differentiation between the two genetic clusters within the Ogeechee River (
F1ST = 0.245;
FST = 0.84) and among the three genetic clusters in the Satilla River (mean
F1ST = 0.362, mean
FST = 0.127) was greater than all pairwise comparisons between composite river systems (mean
F1ST = 0.085 (range = 0.064 to 0.220); mean
FST = 0.025 (range = 0.013 to 0.070)). The genetic differentiation between the two Edisto River clusters (
F1ST = 0.096;
FST = 0.032) was approximately equal to that among the five-river pairwise comparisons. Additionally, both genetic clusters within the Ogeechee River and the three genetic clusters within the Satilla River proved significantly different from all other composite river collections. This suggested that none of the genetic clusters within the Ogeechee River or the Satilla River represented migrants from other populations within the South Atlantic DPS.
The extent of genetic diversity was compared between the genetic clusters in the Ogeechee, Edisto, and Satilla rivers (
Table 2) and that in the composite river populations in the South Atlantic DPS (
Table 3). The mean number of alleles and the effective number of alleles were considerably lower in the individual genetic clusters in these rivers than those in their composite populations. For example, the mean and effective number of alleles in the genetic clusters were 7.441 and 4.262, compared to 10.109 and 4.840, respectively, in the composite river collections. Particularly low levels of these measures of genetic diversity were observed in the Satilla River clusters. Additionally, the Inbreeding Coefficient (Gis) was substantially higher in both of these Ogeechee River groups (0.014 and 0.041) compared to that in the three genetic clusters in the Satilla Rive (−0.014 to 0.153) and the two in the Edisto River (−0.009 and −0015). However, none of these Gis values are suggestive of inbreeding depression in the genetic clusters in these three rivers.
It was important to quantify the accuracy of our reference population assignments for subsequent IBA analyses. To do this, we used leave-one-out tests implemented in ONCOR (
Table 4). The proportion of individual reference individuals correctly assigned to the river in which they were collected varied considerably, with the greatest accuracies for the St. Lawrence and Saint John rivers in Canada (95.3% and 95.4%, respectively) and the lowest for the Satilla River (37.3%). The assignment accuracies for the other three rivers in the South Atlantic DPS were 73.6% for the Savannah (largest misclassification to the Altamaha—12.7%), 61.9% for the Ogeechee (largest misclassification to the Edisto—14.4%), and 72.3% for the Altamaha (largest misclassification for the Savannah—14.0%).
We also quantified the accuracy of our assignments to the DPS in which the specimens were collected. A mean of 89.2% of the specimens were correctly assigned to the DPS in which they were collected (
Table 5). The highest accuracy was for the specimens assigned to the New York Bight DPS (94.9%), and the lowest accuracy was for individuals assigned to the Gulf of Maine DPS (83.6%). The assignment accuracy to the South Atlantic DPS was 92.0%, with the largest misclassification to the Carolinas DPS (5.1%).
Individual-Based Assignment testing was then used to quantify and compare the contributions of the South Atlantic DPS populations, including the two Ogeechee River and three Satilla River genetic clusters, to the six mixed-stock assemblages of Atlantic sturgeon in coastal waters and a non-natal estuary, the Connecticut River (
Table 6). In total, 125 individuals (8.3%) were assigned to the Ogeechee River out of a total of 1512 mixed stock specimens analyzed. Of the 125 specimens assigned to the Ogeechee River, 1 (0.8%) of the individuals was collected in the Bay of Fundy, 11 (8.8%) were collected in Long Island Sound, 2 (1.6%) were collected in the Connecticut River, 61 (50.4%) were collected off the Delaware Coast, 27 (21.6%) were collected off the Virginia–North Carolina Coast, and 23 (18.4%) were collected in the Observers Program. Of the Observers Program-collected specimens, 14 were collected off of North Carolina, 7 were collected in the New York Bight, 1 was collected off of the Delaware Coast, and 1 was collected off of Cape Charles, Virginia. Most surprisingly, all 125 specimens assigned to the Ogeechee River in these mixed stock aggregations were members of Group 2, the putative late-spawning Ogeechee River group. No mixed-stock specimens assigned to the Ogeechee River Group 1 were detected outside the Ogeechee River.
We also quantified and compared the contributions of the three genetic clusters in the Satilla River to the mixed stock aggregations. In total, 18 individuals (1.2%) were assigned to the Satilla River. Of the 18 specimens assigned to the Satilla, 5 (28%) were collected in Long Island Sound, 8 (44%) were collected off the Delaware Coast, 2 (11%) were collected off the North Carolina Coast, and 3 (17%) were bycaught from the Observer’s program. However, unlike for the Ogeechee River, all three Satilla River genetic clusters contributed to these mixed stocks. We did not quantify the contributions of the two genetic clusters in the Edisto River to these mixed-stock aggregations because the total Edisto River contribution was only five specimens.
3. Discussion
The major finding of our study was the presence of two distinct genetic clusters of juvenile (≤50 cm TL) Atlantic sturgeon in the Ogeechee River and three genetic clusters within the Satilla River. This finding was made using STRUCTURE in the absence of any a priori knowledge of their existence. Furthermore, the mean total length of juvenile specimens in the two Ogeechee River clusters differed significantly, suggesting that they are products of two distinct spawning periods: Group 1, with significantly larger specimens (mean = 382.4 mm TL) presumably that were spawned earlier in the season than those in Group 2, with smaller specimens (mean = 271.3 mm TL). Most interestingly, these two groups exhibited major differences in their migratory behaviors. Out of the 125 mixed-stock specimens that were assigned in IBA testing at coastal locations and a non-natal estuary to the Ogeechee River, every individual was assigned to Group 2, and none were assigned to Group 1. While the majority of the migratory Ogeechee River specimens were encountered relatively proximally to the Ogeechee in coastal waters from North Carolina to Delaware, their range extended all the way into the Bay of Fundy and included a non-natal estuary, the Connecticut River. This result indicates that the Group 2 genetic cluster is more migratory than the Group 1 cluster. Given the absence based on the IBA of the Ogeechee Group 1 specimens in our latitudinally extensive marine and estuarine sampling locations, we speculate that the Group 1 cluster is resident year-round within the Ogeechee River watershed. In contrast, juveniles in the three genetic clusters in the Satilla River did not differ significantly in total length nor in their representation in the mixed stock aggregations. Representatives of all three genetic clusters were detected in the mixed-stock collections.
The presence of two genetic clusters within the Ogeechee River with apparent non-migratory and migratory life histories was an unexpected finding of our study. While genetically distinct dual spawning cohorts have been reported in other rivers where Atlantic sturgeon spawn, i.e., the James River, Virgina [
32,
58] and the Edisto River, South Carolina [
33], their presence was initially detected by the targeted collection of spawning adults during hypothesized spring and fall spawning events or reports of two seasonally distinct historical fisheries in these rivers. In contrast, all of the Ogeechee River specimens in our study were juveniles, with no effort having been made to collect distinct spawning groups—this division was only revealed following genetic analysis. Furthermore, we found that the extent of the genetic differentiation between the two genetic clusters within the Ogeechee River using
F1ST and
FST analyses was greater than all other pairwise comparisons among the populations in rivers in the South Atlantic DPS. The genetic differentiation of the two Ogeechee River clusters was substantially greater than that previously reported between spring and fall spawners in the James River [
58] (
FST = 0.084 vs. 0.048;
F1ST = 0.245 vs. 0. 181) and slightly lesser than that reported for the dual spawning groups in the Edisto River [
33] (
FST = 0.084 vs. 0.092;
F1ST = 0.245 vs. 0.316). This suggests that the temporal isolation of these two clusters preceded the spatial isolation of the river-specific spatial isolation events among rivers in the South Atlantic DPS or that the rate of evolution for migratory and non-migratory phenotypes in the system was rapid.
It is possible that the genetic divisions that we report here in the Ogeechee River result from either temporal or spatial reproductive isolation alone. While no targeted effort has been expended over the years to collect spawning adults in the Ogeechee River, more than 35 specimens >130 cm TL have been opportunistically collected in various surveys (Fox et al., unpublished data). However, only three of these specimens were acoustically tagged and detected with receivers in the Ogeechee River, so exactly where spawning occurs within the system is unknown. Though Atlantic sturgeon spawning has not been documented in the Canoochee River, it also has not been surveyed. It is possible that reproductively isolated spawning groups exist in both the mainstem Ogeechee River and the Canoochee River. However, given the significant size difference between the two genetic clusters of one-year-olds and the temporal separation of dual spawners in other sturgeons [
31], including Atlantic sturgeon [
32,
58], we speculate that temporal rather than spatial separation is the more likely mechanism of the reproductive isolation of sturgeon in the Ogeechee River.
All of the mixed-stock specimens assigned to the Ogeechee River (n = 125) were representatives of the Group 2 genetic cluster; none were assigned to Group 1. The Ogeechee River contributed 8.3% of all assigned specimens across all of our mixed-stock collection locales. The range of their contributions extended to the Bay of Fundy, was most frequent off the Delaware to North Carolina coast, and included the Connecticut River. The stark differences between Group 1 and Group 2 could have alternative explanations. It may be that, by chance, none of the mixed-stock collections happened to intercept Group 1 individuals. Collections occurred over the apparent entire coastal range of mixed-stocks of Atlantic sturgeon. However, the estimate of the overall Ogeechee River contribution was surprisingly high at 8.3%, given the relatively small estimated census size of its juvenile population compared to that in other rivers in the South Atlantic DPS. For example, Farrae et al. [
35] estimated the number of juveniles in the Ogeechee River at 450 (203–1125) in 2007. This compares to the estimates of the age-1 juvenile population sizes in the Altamaha River of 1072 to 2033 from 2004 to 2007 [
34] and between 528 and 597 in the Savannah River between 2013 and 2015 [
59]. Despite the smaller estimated size of its juvenile population, the Ogeechee River’s contribution to the overall mixed stock collection (8.3%) greatly exceeded that of both the Altamaha River (0.28%) and the Savannah River (0.69%). These results may indicate that the Ogeechee River Group 2 genetic cluster may represent an unusually vagile population of Atlantic sturgeon, either by disposition or because of the carrying of capacity constraints.
Based on experimental evidence and the modeling of latitudinal differences in the growing season, Markin and Secor [
60] predicted that the dual spawning of Atlantic sturgeon would only occur in populations south of the New York Bight. However, this phenomenon has only been confirmed in four spawning systems within that area—the James River, Edisto River, Ogeechee River, and Satilla River—and in none from the Delaware River northward. It is possible that dual spawning occurred in additional mid-Atlantic and southeastern rivers but that overfishing and other stressors drove one of the modes to extirpation. In our study, we found no evidence of dual spawning in either the Savannah River or the Altamaha River, which bracket the Ogeechee River.
The presence of two genetically distinct size phenotypes at the substantial frequencies of 55% (Group 2) and 45% (Group 1) within the Ogeechee River suggests that both life history variants successfully exploit the diverse available resources within the river and along the coastal migratory route of Group 2. Migratory and non-migratory lineages are commonly found in ray-finned fish taxa, and in meta-analysis, it was observed that the evolution of non-migratory to migratory phenotypes has occurred more frequently and rapidly than the reverse [
61]. Obviously, the evolution of the migratory phenotype allows for the use of less constrained resources outside of natal estuaries, which often results in the greater body size of migratory compared to non-migratory cohorts [
61,
62]. The transition to a migratory phenotype may come with the costs of decreased fecundity [
63,
64] and increased mortality [
65,
66], which are offset with a higher swimming efficiency and reduced energetic requirements [
67]. Similarly, Balazik et al. [
32,
58] found that spring-spawning Atlantic sturgeon in the James River are considerably larger (about 30 cm FL) than the more numerous fall-spawners.
The age-adjusted body sizes of non-migratory and migratory Ogeechee River adults are unknown but should be an objective of future studies. More tracking of juveniles and adults in the Ogeechee should occur, together with genetic sampling. Additionally, there is a need to better understand the usage of the Canoochee River by Atlantic sturgeon of all age and size classes. A primary question remaining is which other rivers support dual populations and, where they exist, what is the basis for the division into two groups. Is it purely temporal differences in spawning, purely geographic differences, or a combination? Based on our results, a high priority for further research into the existence of dual spawners is the Atlantic sturgeon of the Satilla River, which show genetic evidence of three groups but of unknown life history differences. These results indicate that any environmental stressors that affect Atlantic sturgeon in rivers from the Chesapeake Bay southward and in marine waters from the Bay of Fundy southward may do so differentially where two populations exist.


