Article

Phylogeography of Ara militaris (Military Macaw): Implications for Conservation

by
Francisco A. Rivera-Ortíz
1,*,
Salomón Sanabria-Urbán
2,*,
David A. Prieto-Torres
3,
Adolfo G. Navarro-Sigüenza
4,
María del C. Arizmendi
2 and
Ken Oyama
5
1
Laboratorio de Ecología Molecular y Evolución, Unidad de Biotecnología y Prototipos, FES Iztacala, Universidad Nacional Autónoma de México, Avenida de los Barrios No. 1, Los Reyes Ixtacala, Tlalnepantla 54090, Mexico
2
Laboratorio de Ecología, Unidad de Biotecnología y Prototipos, FES Iztacala, Universidad Nacional Autónoma de México, Avenida de los Barrios No. 1, Los Reyes Ixtacala, Tlalnepantla 54090, Mexico
3
Laboratorio de Biodiversidad y Cambio Global (LABIOCG), FES Iztacala, Universidad Nacional Autónoma de México, Avenida de los Barrios No. 1, Colonia, Los Reyes Ixtacala, Tlalnepantla 54090, Mexico
4
Museo de Zoología “Alfonso L. Herrera”, Facultad de Ciencias, Universidad Nacional Autónoma de México, Coyacán 04510, Mexico
5
Laboratorio Nacional de Análisis y Síntesis Ecológica, ENES Morelia, Universidad Nacional Autónoma de México, Antigua Carretera a Pátzcuaro No. 8701, Colonia Ex Hacienda de San José de La Huerta, Morelia 58190, Mexico
*
Authors to whom correspondence should be addressed.
Diversity 2023, 15(10), 1035; https://doi.org/10.3390/d15101035
Submission received: 21 July 2023 / Revised: 12 September 2023 / Accepted: 24 September 2023 / Published: 26 September 2023
(This article belongs to the Special Issue Ecology and Conservation of Parrots)

Abstract

:
The Military Macaw (Ara militaris) is an endangered bird species with disjunct geographic distribution across the Neotropics, consisting of three recognized subspecies: One in Mexico (A. m. mexicanus) and two in South America (A. m. militaris and A. m. bolivianus). However, due to the limited phenotypic differentiation between these allopatric taxa, their taxonomic status has been the subject of debate. In this study, we explored mitochondrial DNA (mtDNA) variability to determine the phylogeographical pattern through phylogenetic and ecological modelling analyses. We also aimed to describe the evolutionary relationships of twelve A. militaris populations. We identified 41 haplotypes in the 300 bp region of the Cytochrome b (Cyt-b) gene of the mtDNA and low nucleotide diversity. The observed phylogeographic structure suggests the existence of two clades: One composed of A. m. militaris and A. m. bolivianus and another consisting solely of A. m. mexicanus. The A. m. mexicanus clade further divides into two recognized subclades: Sierra Madre Oriental and northeastern portion of the Sierra Madre Occidental. Ecological analyses revealed that the niche similarity between these lineages was lower than expected by chance. Additionally, results from low cross-prediction tests indicated that the two lineages have inhabited different environmental spaces since the Late Pleistocene. This divergence may be associated with a steep ecological gradient and contemporary geographical barrier. Based on our results, we suggest that at least the A. m. mexicanus has a divergent evolutionary history; therefore, it should be considered as a different evolutionarily significant and management unit. We recommend that future conservation strategies in Mexico incorporate effective protection measures, including habitat preservation and the reduction of illegal trade, to ensure the preservation of viable populations.

1. Introduction

Phylogeographical studies have held a central role in comprehending various aspects of Neotropical bird species, encompassing gene flow patterns, hybridization, historical range fragmentation and expansion, and speciation [1,2,3,4,5]. These studies have employed several approaches to demonstrate how genetic and morphological divergence is profoundly shaped by the spatial structure of ecosystems, the presence of barriers (geographic and ecological) that impede gene flow, and the impacts of Pleistocene climatic changes [6]. These factors, whether acting individually or in concert, can propel ecological adaptations to different environments, resulting in ecological niche specialization and lineage divergence [1]. Despite numerous studies having provided insights into the biogeographical history of diverse taxonomic groups across the Neotropics, the evolutionary history of several psittacids species (Aves: Psittaciformes) remains partially understood [7,8].
The Neotropics harbor the highest diversity of psittacids worldwide, encompassing at least 165 acknowledged species within the region [9,10]. Recent phylogenetic and phylogeographic analyses have established the tribe Arini as a well-supported monophyletic clade [3,8,11,12,13,14]. Moreover, they also suggest that Pleistocene climatic fluctuations played a significant role in the diversification of psittacids by driving genetic and phenotypic divergence within species and facilitating speciation [13,15,16]. Molecular studies on endangered parrot species have further unveiled substantial population structure, attributed to historical events as well as more recent environmental changes [17,18]. These findings are particularly important as they have led to the re-evaluation of the taxonomy and conservation status of isolated populations of many endangered species [18,19]. They also highlight the significance of conducting similar studies on other psittacids, considering that 31% of the species in the Neotropics are classified as endangered taxa [20,21].
Large-bodied macaws are indeed among the most endangered parrot species globally [21,22]. Unfortunately, they have experienced rates of extinction in recent times, as exemplified by the Cuban species (Ara tricolor) [23]. The principal factors contributing to their decline encompass illegal hunting, habitat loss, fragmentation, and the effects of climate change [24,25,26]. While substantial research has been directed towards the phylogeography and population genetics of species classified of least concern internationally and facing the risk of extinction according to local norms (Mexico and Central American countries), such as the Scarlet Macaw (Ara macao) [27], and critically endangered species like Spix’s Macaw (Cyanopsitta spixii) [28], other Mesoamerican species, such as the Military Macaw (Ara militaris), have received comparatively diminished attention [29,30].
The Military Macaw (Ara militaris) boasts an extensive geographic range that stretches from Mexico to South America (Figure 1). Within this range, it consists of three subspecies with allopatric distribution [29]: A. m. militaris is found from the northwest of Venezuela to southeast Peru; A. m. bolivianus is distributed from northern Bolivia to northwest Argentina; and A. m. mexicanus is restricted to Mexico, spanning across the biogeographic provinces of Sierra Madre Occidental, Sierra Madre del Sur, and Sierra Madre Oriental [31]. It is noteworthy that A. militaris is not present in Central America, as this region is occupied by its sister species, A. ambiguus [9].
Despite A. militaris and A. ambiguus being historically regarded as a single species complex [29], recent phylogenetic studies have found strong support for the monophyly of both species, thereby recognizing them as distinct evolutionary lineages [29,30]. Moreover, these studies have revealed the presence of a genetic structure within A. militaris [29,30]. However, these studies were based on samples obtained from museum specimens and did not cover the entire distribution range of the species, particularly in Mexico. In this study, we increased the number of populations of A. m. mexicanus, utilizing contemporary samples that encompass the complete distribution range in Mexico. Furthermore, we have explored whether niche divergence accompanies evolutionary differentiation within these taxa, as suggested by previous studies conducted in other regions of the Neotropics [32,33,34,35]. This type of information can enable us to identify priority conservation units and promote effective planning for the protection efforts for the Military Macaw in the future [21]. Considering that this species exhibits a clear population decline (with fewer than 10,000 individuals remaining in the wild), it is classified by the International Union for Conservation of Nature as threatened (vulnerable status), and the Convention on International Trade in Endangered Species of Wild Fauna and Flora classifies it as endangered [36,37].
In this study, we conducted an analysis of the phylogeographic structure of A. militaris to infer evolutionary relationships and examine patterns of genetic diversity and structure among its populations. Additionally, we estimated the divergence time between the identified clades to investigate the potential influence of past climatic events on the taxon’s diversification. Given that ecological differentiation may arise from geographic disruptions to the species’ optimal ecological niche, we hypothesized that distinct phylogenetic lineages would exhibit discernible patterns of niche segregation [35]. Based on these findings, we identified conservation units [36] and discussed their conservation implications and priorities for the Military Macaw in Mexico.

2. Materials and Methods

2.1. Sampling

In this study, we focused our taxonomic sampling on the A. militaris complex. We analyzed the entire distribution range of the species, including the areas for its three recognized subspecific taxa: A. m. mexicanus, A. m. militaris, and A. m. bolivianus (Figure 1). For A. m. mexicanus, we collected feathers from 35 localities across its geographic distribution in Mexico (permit number, SGPA/DGVS/05767/22, Secretaría de Medio Ambiente y Recursos Naturales). The feathers were collected at the base of the trees in nesting, feeding, and resting sites during the breeding season. In some localities, feathers were directly collected from the nests (see Table 1 and Table S1). We considered only one feather per tree or per nest as a single individual per locality. Once collected, we cleaned the feathers with 90% ethanol and placed them in paper bags for transportation to the laboratory [37]. Additionally, we obtained samples of the three subspecies of Military Macaw from 32 museum specimens housed in the American Museum of Natural History (Manhattan, NY, USA), by dissecting 20 to 30 mm2 of toe pad skin (Table 1 and Table S1). Each of these samples was stored in 70% ethanol for transportation to the laboratory. In total, 67 samples from 23 locations were obtained. All sampling localities separated by less than 100 Km and within the same geographical region were considered a population, resulting in the recognition of 12 populations along the species distribution range (Table 2).

2.2. DNA Extraction, PCR, and Sequencing

Total genomic DNA was extracted from feather samples using a standard proteinase K/SDS digestion method, following the chloroform:ethanol purification protocol described by Leeton and Christidis [38]. For skin samples, the Dneasy® extraction kit (Qiagen, Hilden, Germany) was used, following the manufacturer’s protocol. Given the challenges associated with working with old museum skin samples, which often yield small quantities of degraded DNA and are susceptible to contamination from foreign DNA, we followed the recommendations by Murphy et al. [39]. These recommendations were implemented to enhance DNA quality and yield while minimizing the risk of contamination.
We conducted amplification and sequencing of fragments from the mitochondrial Cytochrome-b gene (Cyt-b), a commonly employed marker in phylogenetic and phylogeographic studies of parrots, e.g., [39,40,41]. To amplify the fragments, we utilized the standard Cyt-b primers L14996 (5′-ATCTCHGCHTGATGAAAYTTYGG-3′) and H15646 (5′-GGGGTGAAGTTTTCTGGGTC-3′) designed by Sorenson et al. [42], resulting in fragments of 600 bp in length. However, for museum skin samples, we could only amplify shorter Cyt-b fragments (300 bp) using the internal primer L15413 (5′-GAATGAGCATGAGGCGGATTCTCA-3′) in conjunction with H15646. The degradation of DNA in these museum samples, which were up to 124 years old, likely contributed to the limitation in fragment length. Nevertheless, the successful utilization of short mitochondrial (mtDNA) fragments has been demonstrated in other avian phylogeographic investigations, e.g., [39,43,44,45], providing valuable and reliable information regarding population history [46].
For all PCR reactions, we employed the QIAGEN Multiplex PCR kit (Qiagen, Hilden, Germany). Each reaction comprised 2 μL of Master Mix, 0.5 μL of primers (5 pmol/μL), 1 μL of UV-sterilized distilled water, and 1 μL of total genomic DNA (20–50 ng/μL), resulting in a final reaction volume of 5 μL. The PCR reactions were carried out using the following cycling conditions: An initial denaturation step at 94 °C for 10 min, followed by 35 cycles of 30 s at 94 °C, 30 s at 53 °C, and 1 min at 72 °C, with a final extension step at 72 °C for 10 min. To purify the PCR products, we employed a purification protocol involving Sephadex columns (Invitrogen, Van Allen Way, North Greenbush, NY, USA). The resulting mtDNA sequences were lyophilized and subsequently resuspended in 10 µL of formamide (Hi-Di formamide AB; Applied Biosystems, Foster City, CA, USA). To obtain the sequence, both the forward- and reverse-purified PCR products were sequenced using a 3100-Avant Genetic Analyzer.

2.3. Sequences Alignment, Genetic Diversity, and Population Structure

The forward and reverse sequences of each PCR product were analyzed using SEQUENCHER 4.2 (Gene Codes Corporation, Ann Arbor, MI, USA). Subsequently, these sequences were aligned using MUSCLE 5.0 [47]. To verify the absence of stop codons, the aligned sequences were translated using MEGA 6.0.6 [48]. All the obtained sequences have been deposited in the GenBank database under the accession numbers ID KT957209 to KT957275 (Table S1).
To quantify the total number and frequency of haplotypes, as well as the count of substitutions between them, we compiled a dataset consisting of all the obtained sequences, adjusting their length to 300 bp. Next, utilizing DNASP 5.10.01 [49], we calculated standard population diversity parameters, which encompassed haplotype diversity (h) and nucleotide diversity (π), at the species, subspecies, and population levels.
Additionally, we conducted Tajima’s D test [50] and Fu’s Fs test [51], both of which serve as measures of neutrality, using ARLEQUIN 3.11 [52]. These tests allowed us to explore the possibility of past demographic expansion within the populations and subspecies. Furthermore, we employed ARLEQUIN 3.11 to analyze the geographic population structure by conducting a hierarchical analysis of molecular variance (AMOVA). The partitioning of total gene diversity was executed at three levels: Overall for the species, among the subspecies, and among the populations within each subspecies. The statistical significance of FST was assessed through 10,000 permutations. Additionally, we employed a spatial analysis of molecular variance (SAMOVA). This analysis employs simulations to identify groups of populations (k) that display geographic homogeneity while maximizing the differences between these groups. SAMOVA enables the estimation of variation between groups (FCT), between localities within each group (FSC), and between localities relative to the total sample (FST). The SAMOVA analyses were performed with 10,000 interactions for varying numbers of groups (k) ranging from 2 to 14, using the software SPADS 1.0 [53].
Furthermore, we evaluated the genetic differentiation between the subspecies and populations by estimating pairwise FST values using paired comparisons [54]. This analysis incorporated haplotype frequencies and was conducted with 10,000 Markov chain steps, employed ARLEQUIN 3.11. Significance was determined following a Bonferroni correction for multiple comparisons.

2.4. Phylogenetic Reconstructions

We augmented our genetic dataset with additional Cyt-b sequences from other species within the genus Ara (A. macao, A. chloropterus, A. glaucogularis, A. ararauna, and A. severus) along with Primolius auricollis, which were accessible on GenBank. These sequences served as outgroup taxa for the phylogenetic analyses and allowed us to include fossil calibration points for the divergence time analysis [55]. This augmented dataset comprised 80 terminals, including 13 outgroup taxa and 67 ingroup taxa, with a total alignment length of 582 positions.
Recent findings suggest that using multiple and distantly related outgroups can bias phylogenetic reconstructions, whereas the accuracy of phylogenetic inferences is better if the single most closely related outgroup is used [56]. To assess the potential bias that the inclusion of multiple outgroups could have on the inference of phylogenetic relationships among Cyt b haplotypes of A. militaris, we also constructed a reduced dataset (with 68 terminals and 582 positions) containing all ingroup samples and a single outgroup species, A. macao, which is the closest relative to the A. militaris/A. ambiguus sister group [13,29,30]. Although we recognized that the reliability of phylogenetic inferences for the A. militaris complex would increase by including its sister species, we were unable to obtain samples of A. ambiguus nor sequences of other loci that were used in previous phylogenetic studies that included both A. militaris and A. ambiguus.
To determine the optimal partitioning scheme and substitution models for both datasets (multiple-outgroups dataset and single-outgroup dataset), we initially treated each codon position as a separate partition, and we used the greedy algorithm implemented in PARTITIONFINDER 1.1.1 [57]. This analysis indicated that the multiple-outgroups dataset was optimally divided into two partitions: Partition 1 encompassed the first and second codon positions, while partition 2 comprised the third codon position within the alignment. The most appropriate substitution models identified for these partitions were HKY + G for partition 1 and GTR for partition 2. For the single-outgroup dataset, all codon positions were integrated into a single partition, evolving according to an HKY + G substitution model.
To reconstruct the phylogenetic relationships, we employed Bayesian inference (BI) and maximum likelihood (ML) approaches for both datasets. For the BI analysis, we utilized the program MrBayes 3.2 [58]. For each dataset, specific substitution rates were assigned to each partition according to the PARTITIONFINDER results. Moreover, P. auricollis and A. macao were designated as outgroups for the multiple-outgroup and single-outgroup datasets, respectively. For both cases, the BI analyses comprised four independent runs, with each run extending for 10,000,000 generations and utilizing four chains. We sampled every 1000 generations to ensure a comprehensive representation of the posterior distribution. The convergence of parameters and the appropriateness of mixing in the independent runs were evaluated using Tracer 1.5.0 [59]. All parameters in the analysis reached ESS values exceeding 200, signifying convergence of the chains. A definitive consensus tree was established by merging the outcomes of the four independent runs after discarding the initial 25% of the samples to ensure stability. For the ML analysis, we employed the software RAxML 7.2.8 [60]. The GTRGAMMA model was separately applied to each partition for both datasets, designating the outgroups as formerly specified for the BI analyses. The reliability of nodes in the most likely tree was assessed using 1000 bootstrap replicates. Moreover, to analyze the evolutionary relationships among the identified haplotypes, we utilized the parsimony criterion implemented in Network 4.5.1.6 [61] to construct a haplotype network.

2.5. Divergence Time Estimation

To estimate the divergence time between the identified lineages of the Military Macaw, we utilized the Bayesian framework within the program BEAST 2.0.1 [62]. For calibration purposes, we incorporated two sources of information. Firstly, we employed a recent fossil record dating back to the late Pleistocene (approximately 1.8 million years before the present day), represented by the extinct Cuban Macaw (A. tricolor) [23]. This fossil provided a minimum age limit for the genus Ara. Additionally, Tavares et al. [13,16] previously estimated the separation between the genus Ara and Primolius to have occurred 13.6 million years before the present day, with confidence intervals spanning from 9.9 to 18 million years. This calibration was established based on significant biogeographic events and contributed to the determining of divergence times among Neotropical parrots. We integrate these age constraints in the divergence time analysis. For the age of the genus Ara, we employed an offset of 1.8 Ma, which approximates the age of the A. tricolor fossil. We assigned a lognormal distribution with a mean of 3.5 and a standard deviation of 0.75. This yielded a median age estimate of 4.4 Ma, with the 97.5% Prior Credible Interval (PCI) falling below 13.3 Ma. Furthermore, we employed a normal distribution to constrain the divergence between Ara species and P. auricollis, utilizing a mean of 13.6 Ma and a standard deviation of 2.3. This distribution encompassed 97.5% of the PCI within the range of 9.09 and 18.1 Ma based on Tavares et al. [13,16].
In the divergence time analysis, we concentrated on a more compact dataset, comprising A. militaris haplotypes and a single representative from each outgroup taxa (A. macao, A. chloropterus, A. glaucogularis, A. ararauna, A. severus, and P. auricollis). This dataset was partitioned according to the previously outlined scheme. Specifically, partition 1 employed the HKY substitution model, while partition 2 used the HKY + G substitution model. We adopted a relaxed uncorrelated lognormal clock and employed a Birth Death Model as tree prior. The analysis consisted of two independent runs, each running for 100,000,000 generations, sampling parameters every 10,000 generations. We assessed the convergence and ensured satisfactory mixing of the independent runs using Tracer 1.5.0 [59]. All parameters in the analysis achieved ESS values greater than 200. To generate a maximum clade credibility consensus tree, we merged the outcomes of the four independent runs and discarded 25% of the samples obtained prior to stability using TreeAnnotator 1.8.1 [58].

2.6. Contemporary and Paleo-Distribution Models: Niche Divergence Analyses

In our ecological approach, we employed ecological niche modeling (ENM) to analyze the variation in geographical and environmental conditions across the distributions of the two identified lineages of A. militaris: A. m. mexicanus lineage and A. m. militaris/A. m. bolivianus lineage. ENM offers an approximation of the Grinnellian niches occupied by each lineage, considering both contemporary and past climate conditions [63]. For the execution of this analysis, we compiled occurrence data from our genetic sampling sites, along with occurrence records sourced from the Atlas of the Birds of Mexico and the Global Biodiversity Information Facility (GBIF) database [64]. To account for spatial autocorrelation, we applied a filter to the occurrence records using the “spThin” R package, selecting records that were at least 5 km2 apart [65]. Consequently, the final dataset comprised spatially rarefied records, encompassing 319 occurrences for A. m. mexicanus and 299 occurrences for the South American group (A. m. militaris and A. m. bolivianus).
To define the accessibility area (referred to as “M” according to the BAM diagram) [66], we employed the unequivocal occurrence records of each lineage, which were subsequently intersected with terrestrial ecoregions [67] and biogeographic provinces of the Neotropics [68]. To characterize the ecological niche of the lineages, we utilized nine independent and uncorrelated climatic variables derived from WorldClim 1.4 [69] with a spatial resolution of approximately 5 km2 (0.041665°). These climatic variables encompassed the following parameters: Mean diurnal range (Bio 02), isothermality (Bio 03), mean temperature of wettest quarter (BIO 08), annual precipitation (Bio 12), precipitation of wettest month (Bio 13), precipitation of driest month (Bio 14), precipitation seasonality (Bio 15), precipitation of warmest quarter (BIO 18), and precipitation of coldest quarter (Bio 19). The selection of these climatic variables was made based on considerations such as Pearson’s correlation coefficient (r < 0.75) and Variance Inflation Factor (VIF < 10), which were evaluated utilizing the “corrplot” [70] and “usdm” [71] R libraries.
In an initial approach, we analyzed the role of ecological conditions in the differentiation among A. militaris lineages by quantifying the degree of climatic niche overlap between them [72]. This enabled us to determine whether the niches of the two lineages are identical or if they are more or less similar than expected by chance. For this analysis, we employed a PCA-env approximation, a method that portrays the ecological niche in a two-dimensional space defined by the first and second principal components [73]. Following this, we calculated the niche overlap between lineages, utilizing Schoener’s D index. This index varies between 0 (indicating no niche overlap) and 1 (indicating complete niche overlap) as suggested by Broennimann et al. [74]. To test for niche equivalency and similarity between lineages, we conducted a comparison by contrasting the empirically observed Schoener’s D value with values obtained from 1000 pseudo-replicated datasets. These datasets were generated to allow for random shifts (rand type = 2, “greater” option), in accordance with Warren et al. [72] and Broennimann et al. [74]. The hypothesis of niche conservatism between lineages is acceptance based on whether the observed Schoener’s D value is statistically significantly higher (p < 0.05; indicating greater similarity) than the values expected from the simulated overlap. All these analyses were executed using the “ecospat v. 3.0” R library [75].
In a second approach, to understand the role of geographical drivers in the diversification of A. militaris, we generated suitability maps that represented the potential spatial-temporal geographic distribution during the Late Pleistocene climate fluctuations. To achieve this, we utilized MaxEnt 3.4.4k [76] and the “kuenm” R package [77] model for the potential environmental suitability areas for each identified lineage. First, we performed the ENM calibration protocol in the current distribution to select the best modelling parameters [78] and assessed the statistical performance of the final models [77,78]. Then, we projected the determined environmental suitable conditions onto past climatic variables during the Late Pleistocene climate fluctuations, including the Mid-Holocene, Last Glacial Maximum (LGM), and Last Inter Glacial (LIG) periods. We obtained binary (presence–absence) maps by establishing a decision threshold equivalent to the 10th percentile training presence logistic threshold. In this study, past climate data were based on three global climate circular models: CCSM4, MIROC-ESM, and MPI-ESM-P. Furthermore, we verified the reliability of our model projections by calculating the mobility-oriented parity (MOP) metric, see [79,80].
We evaluated the potential historical range extension, connectivity, and stability areas that contributed to the evolution and preservation of A. militaris lineages, e.g., [80]. This was accomplished by assessing the degree of geographical matching between the potential ranges predicted for different lineages across each climatic scenario, referred to as alloprediction values. The underlying anticipation was that models would predict similar potential distribution ranges if the climatic niche of the lineages were similarly distributed and historically aligned, even in the presence of geographical barriers, e.g., [35]. Our analysis led us to the identification of regions characterized by long-term climatic stability areas, often recognized as refugia. These areas were determined by overlapping the four binary maps that represent the occurrence of each lineage in all historical scenarios analyzed, e.g., [35,81]. To examine whether the geographical or ecological boundaries between lineages are associated with steep environmental gradients, we utilized the linear and blob range-break tests available in the “ENMTools 1.0” R library, see [82]. The scripts and input information used for all these analyses can be found at https://github.com/davidprietorres/ara_militaris_project (accesed on 25 May 2023).

3. Results

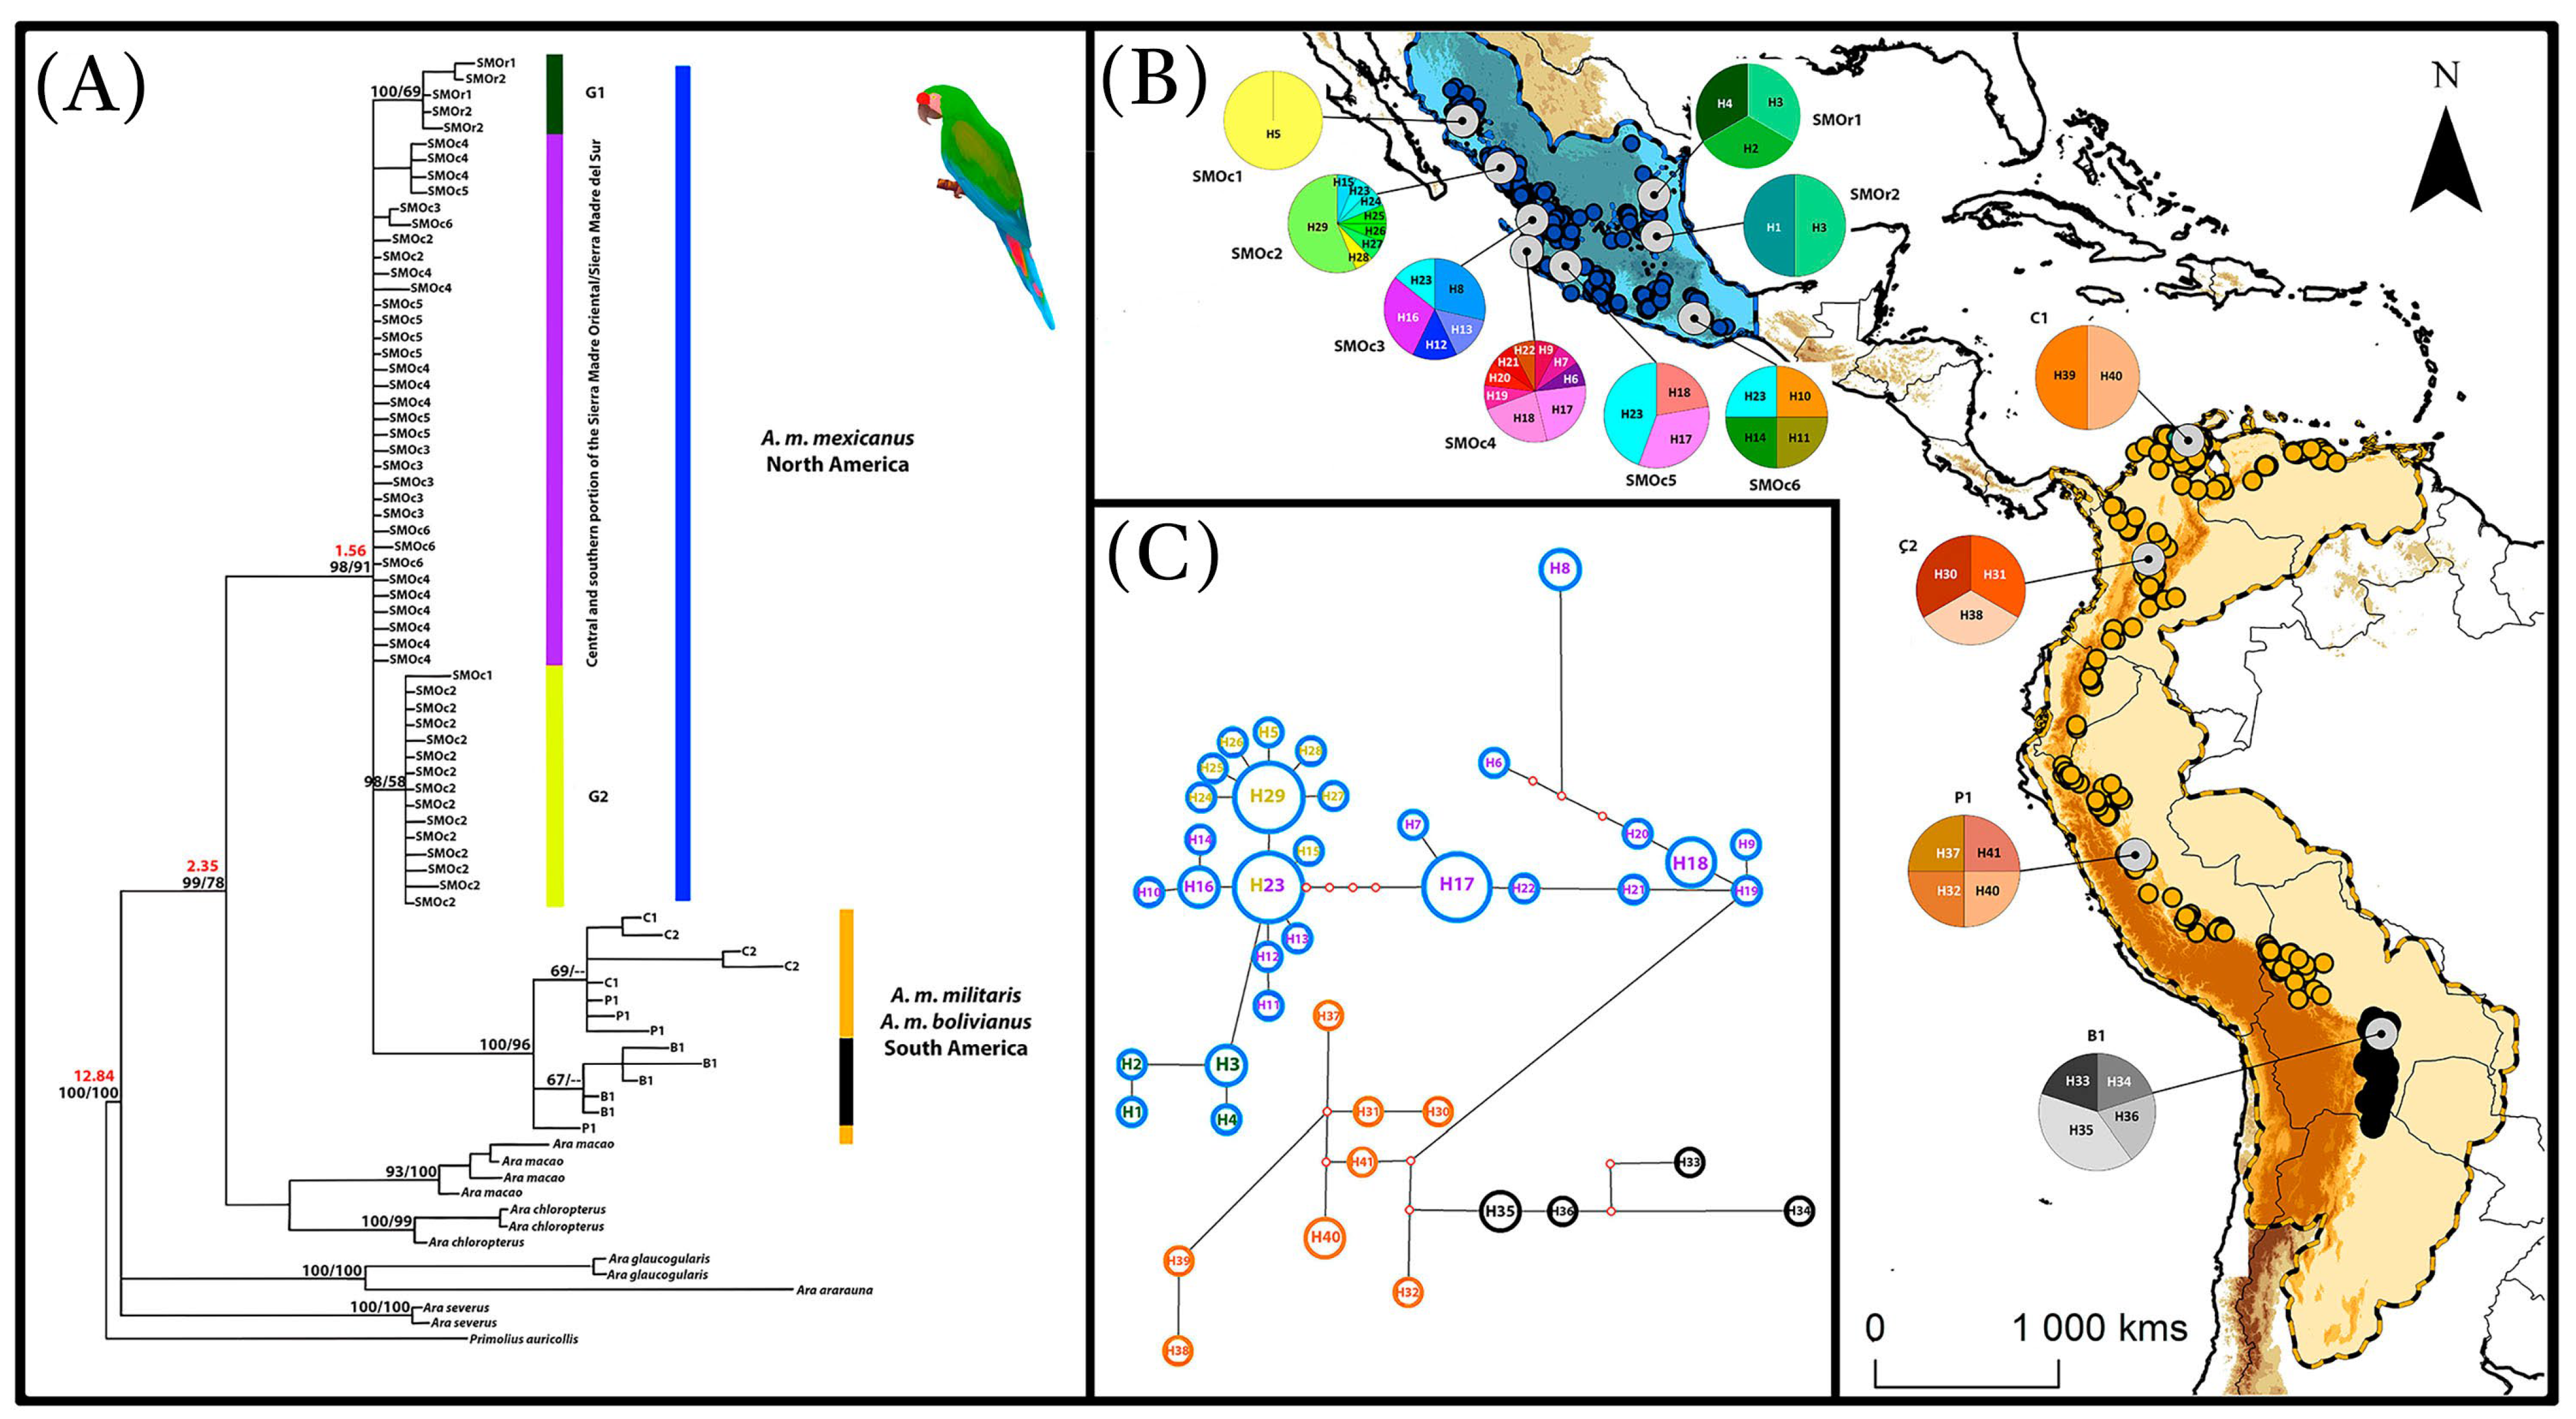
3.1. Haplotype Variation and Distribution

We obtained Cyt-b sequences from 67 specimens of A. militaris. The overall count of polymorphic sites accounted for 7.04% of the entire sequence length, with parsimoniously informative sites making up just 2.8%. Among the species, we identified 41 unique Cyt-b haplotypes: 29 within A. m. mexicanus, 8 within A. m. militaris, and 4 within A. m. bolivianus (Table 2).
No shared haplotypes were found between subspecies. In particular, we identified four unique haplotypes (Hap 3, Hap 17, Hap 23) with extensive distribution within A. m. mexicanus populations. Hap 17 and Hap 23 were geographically restricted to the Sierra Madre Occidental/Sierra Madre del Sur populations. Hap 23 was present in SMOc2, SMOc3, SMOc5, and SMOc6 populations, while Hap 17 was detected in SMOc4 and SMOc5 populations. Hap 3, however, was geographically restricted to Sierra Madre Oriental populations (SMOr1 and SMOr2). For A. m. militaris populations, we identified only a single unique haplotype (Hap 40) that was widely distributed and shared between the C1 and C2 populations (Figure 1, Table 2).
Regarding the estimations of genetic diversity, in A. militaris, the haplotype diversity (h) was 0.8382, and the total nucleotide diversity (π) was 0.0063. For A. m. militaris, these values were 0.9848 for h and 0.0115 for π. In the case of A. m. bolivianus, the corresponding values were h = 0.9000 and π = 0.0097 (Table 2). As for A. m. mexicanus, the values were h = 0.7760 and π = 0.0045, indicating relatively similar levels of genetic diversity across populations of this subspecies (Table 2). Moreover, for most populations of A. m. mexicanus, no significant deviations from neutrality were observed in Fu’s Fs and Tajima’s D neutrality tests. The only exception was the SMOr2 and SMOc6 populations, in which negative and significant values were identified in either both tests (SMOr2: FS = −4.5029, D = −1.6238) or just one (Fs = −1.6221), implying recent expansion of these populations (Table 2).
The global AMOVA analysis revealed that most of the genetic variation (87%) was observed among populations with significant FST values (FST = 0.1304, p < 0.001). This analysis also unveiled significant differences among subspecies (FST = 0.0549, p < 0.05), suggesting that the majority of the genetic variation (66%) was observed among populations. Genetic differentiation was found between A. m. mexicanus and A. m. militaris (FST = 0.0006, p < 0.05), between A. m. mexicanus and A. m. bolivianus (FST = 0.0134, p < 0.05), and between A. m. militaris and A. m. bolivianus (FST = 0.2170, p = 0.05). In contrast, significant genetic differentiation was detected between populations (FST = 0.4612, p < 0.05) of all subspecies. For the case of A. m. mexicanus populations, the analyses indicated significant genetic differentiation between populations of the Sierra Madre Occidental/Sierra Madre del Sur and populations of the Sierra Madre Oriental (FST = 0.0803, p < 0.05).
The SAMOVA analysis identified that the A. militaris populations in this study were most effectively divided into four distinct genetic and geographic assemblages, with an FCT = 0.80, signifying 45.33% variation between the groups. The calculated FST value stood at 0.75, suggesting genetic differentiation (Table 3). According to this analysis, the A. m. mexicanus subspecies was subdivided into three assemblages: (i) Populations from the Sierra Madre Oriental (SMOr1 and SMOr2), (ii) populations from the northern of the Sierra Madre Occidental (SMOc1 and SMOc2), and (iii) populations from the central and southern portion of the Sierra Madre Occidental/Sierra Madre del Sur (SMOc3, SMOc4, SMOc5, and SMOc 6). The populations of the A. m. militaris and A. m. bolivianus subspecies constituted the fourth assemblage (Table 3).
These results were reinforced by the pair-wise comparison FST analysis, which highlighted the differentiation of populations A. m. mexicanus of the Sierra Madre Oriental with those of the Sierra Madre Occidental/Sierra Madre del Sur. Additionally, differentiation was observed between the A. m. mexicanus populations and those of the South American subspecies (A. m. militaris and A. m. bolivianus) (Table 4).

3.2. Phylogenetic Reconstruction and Divergence Time Estimation

BI and ML analysis yielded comparable topologies among them and for both datasets (multiple-outgroup and single-outgroup), primarily differing in the support values (Posterior Probability [PP] and Bootstrap [BS]) assigned to the nodes (Figure 1 and Figure S1). Therefore, in the following lines, we only describe the results of the multiple-outgroup dataset. In BI and ML analysis, the monophyly of the Ara genus and the close phylogenetic relationship between A. militaris, A. macao, and A. chloropterus were consistently recovered with relatively high support values (PP = 99% and BS = 78%). Likewise, strong support was found for the monophyly of the A. militaris species (PP = 98% and BS = 91%), as well as for clades encompassing all haplotypes of the South American subspecies, A. m. militaris and A. m. bolivianus (PP = 100% and BS = 96%). However, within this clade, only A. m. bolivianus was identified as a monophyletic lineage but with very low support (PP = 67% and BS < 50%). Furthermore, despite the unresolved phylogenetic relationships between the haplotypes of A. m. mexicanus in both analyses, we discern at least two geographically structured monophyletic groups within this North American subspecies, each with moderately high support values (PP ≥ 98% and BS ≥ 58%). The first group (G1) comprised all individuals from the Sierra Madre Oriental, while the second group (G2) exclusively consisted of individuals from the northeastern portion of the Sierra Madre Occidental (Figure 1). The rest of the haplotypes of A. m. mexicanus with unresolved phylogenetic relationships pertain to individuals from the central and southern portion of the Sierra Madre Occidental/Sierra Madre del Sur (Figure 1).
The haplotype network closely paralleled the outcomes of the BI and ML analysis, revealing a prominent phylogeographic structure in A. militaris. Within this network, we recognized two major lineages of haplotypes, distinguished by multiple mutations stapes. The first lineage encompassed all samples from the South American subspecies, wherein the haplotypes of each subspecies (A. m. militaris and A. m. bolivianus) displayed a closer relationship to one another. The second one comprised all haplotypes of the North American subspecies (A. m. mexicanus), revealing the presence of three distinct haplogroups, each uniquely confined to different geographic regions of Mexico: Sierra Madre Oriental, northern Sierra Madre Occidental, and central and southern portion of the Sierra Madre Occidental/Sierra Madre del Sur (Figure 1). Notably, we also observed that most of the haplotypes of A. m. mexicanus slightly differed from the most common and widely distributed haplotypes (H23, H29, H17, and H13) in this subspecies, whereas a larger number of differences was observed among the haplotypes of the South American subspecies.
Our divergence time analysis suggests that the separation between A. militaris and A. macao, as well as A. chloropterus, likely occurred approximately 2.35 Ma BP (95% Confidence Interval, CI, ranging from 4.87 to 0.51 Ma BP). Furthermore, this analysis also indicates that the mitochondrial lineages divergence within A. militaris was likely initiated around 1.56 Ma, during the Pleistocene (Figure 1). However, it is important to note that the 95% confidence interval for this estimated mean divergence time was relatively large ranging from 3.89 to 0.26 Ma before the present day.

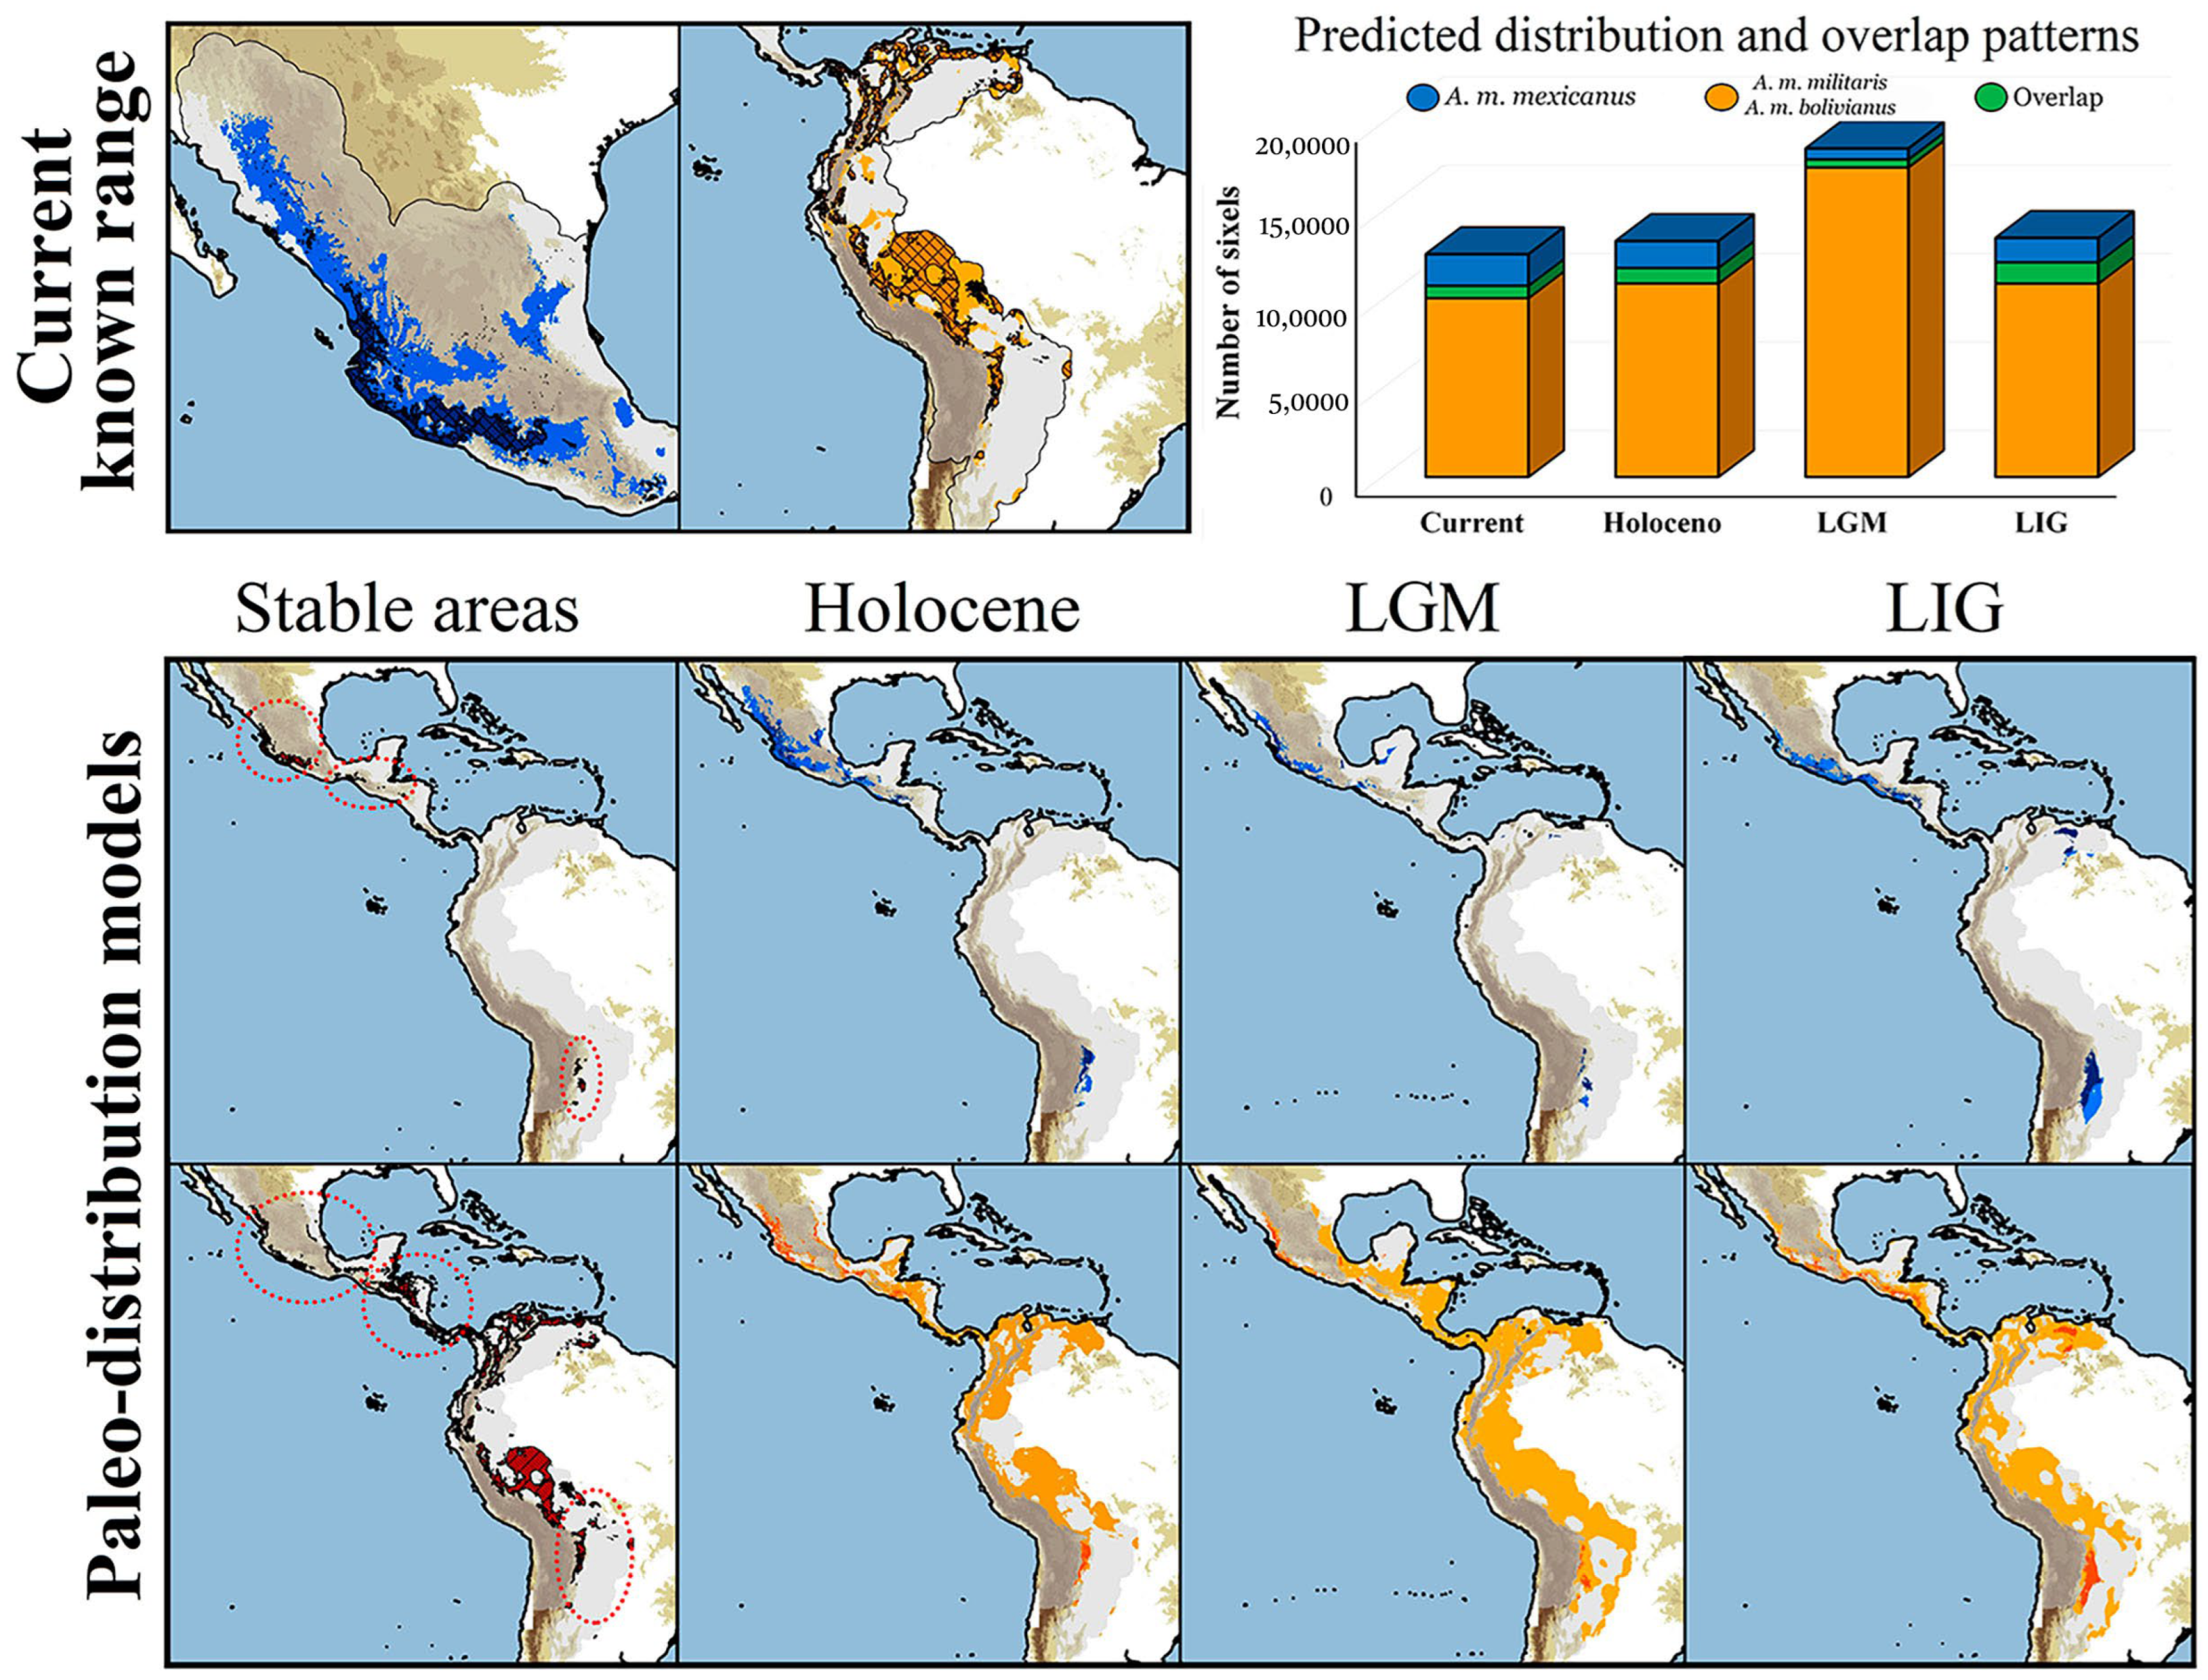
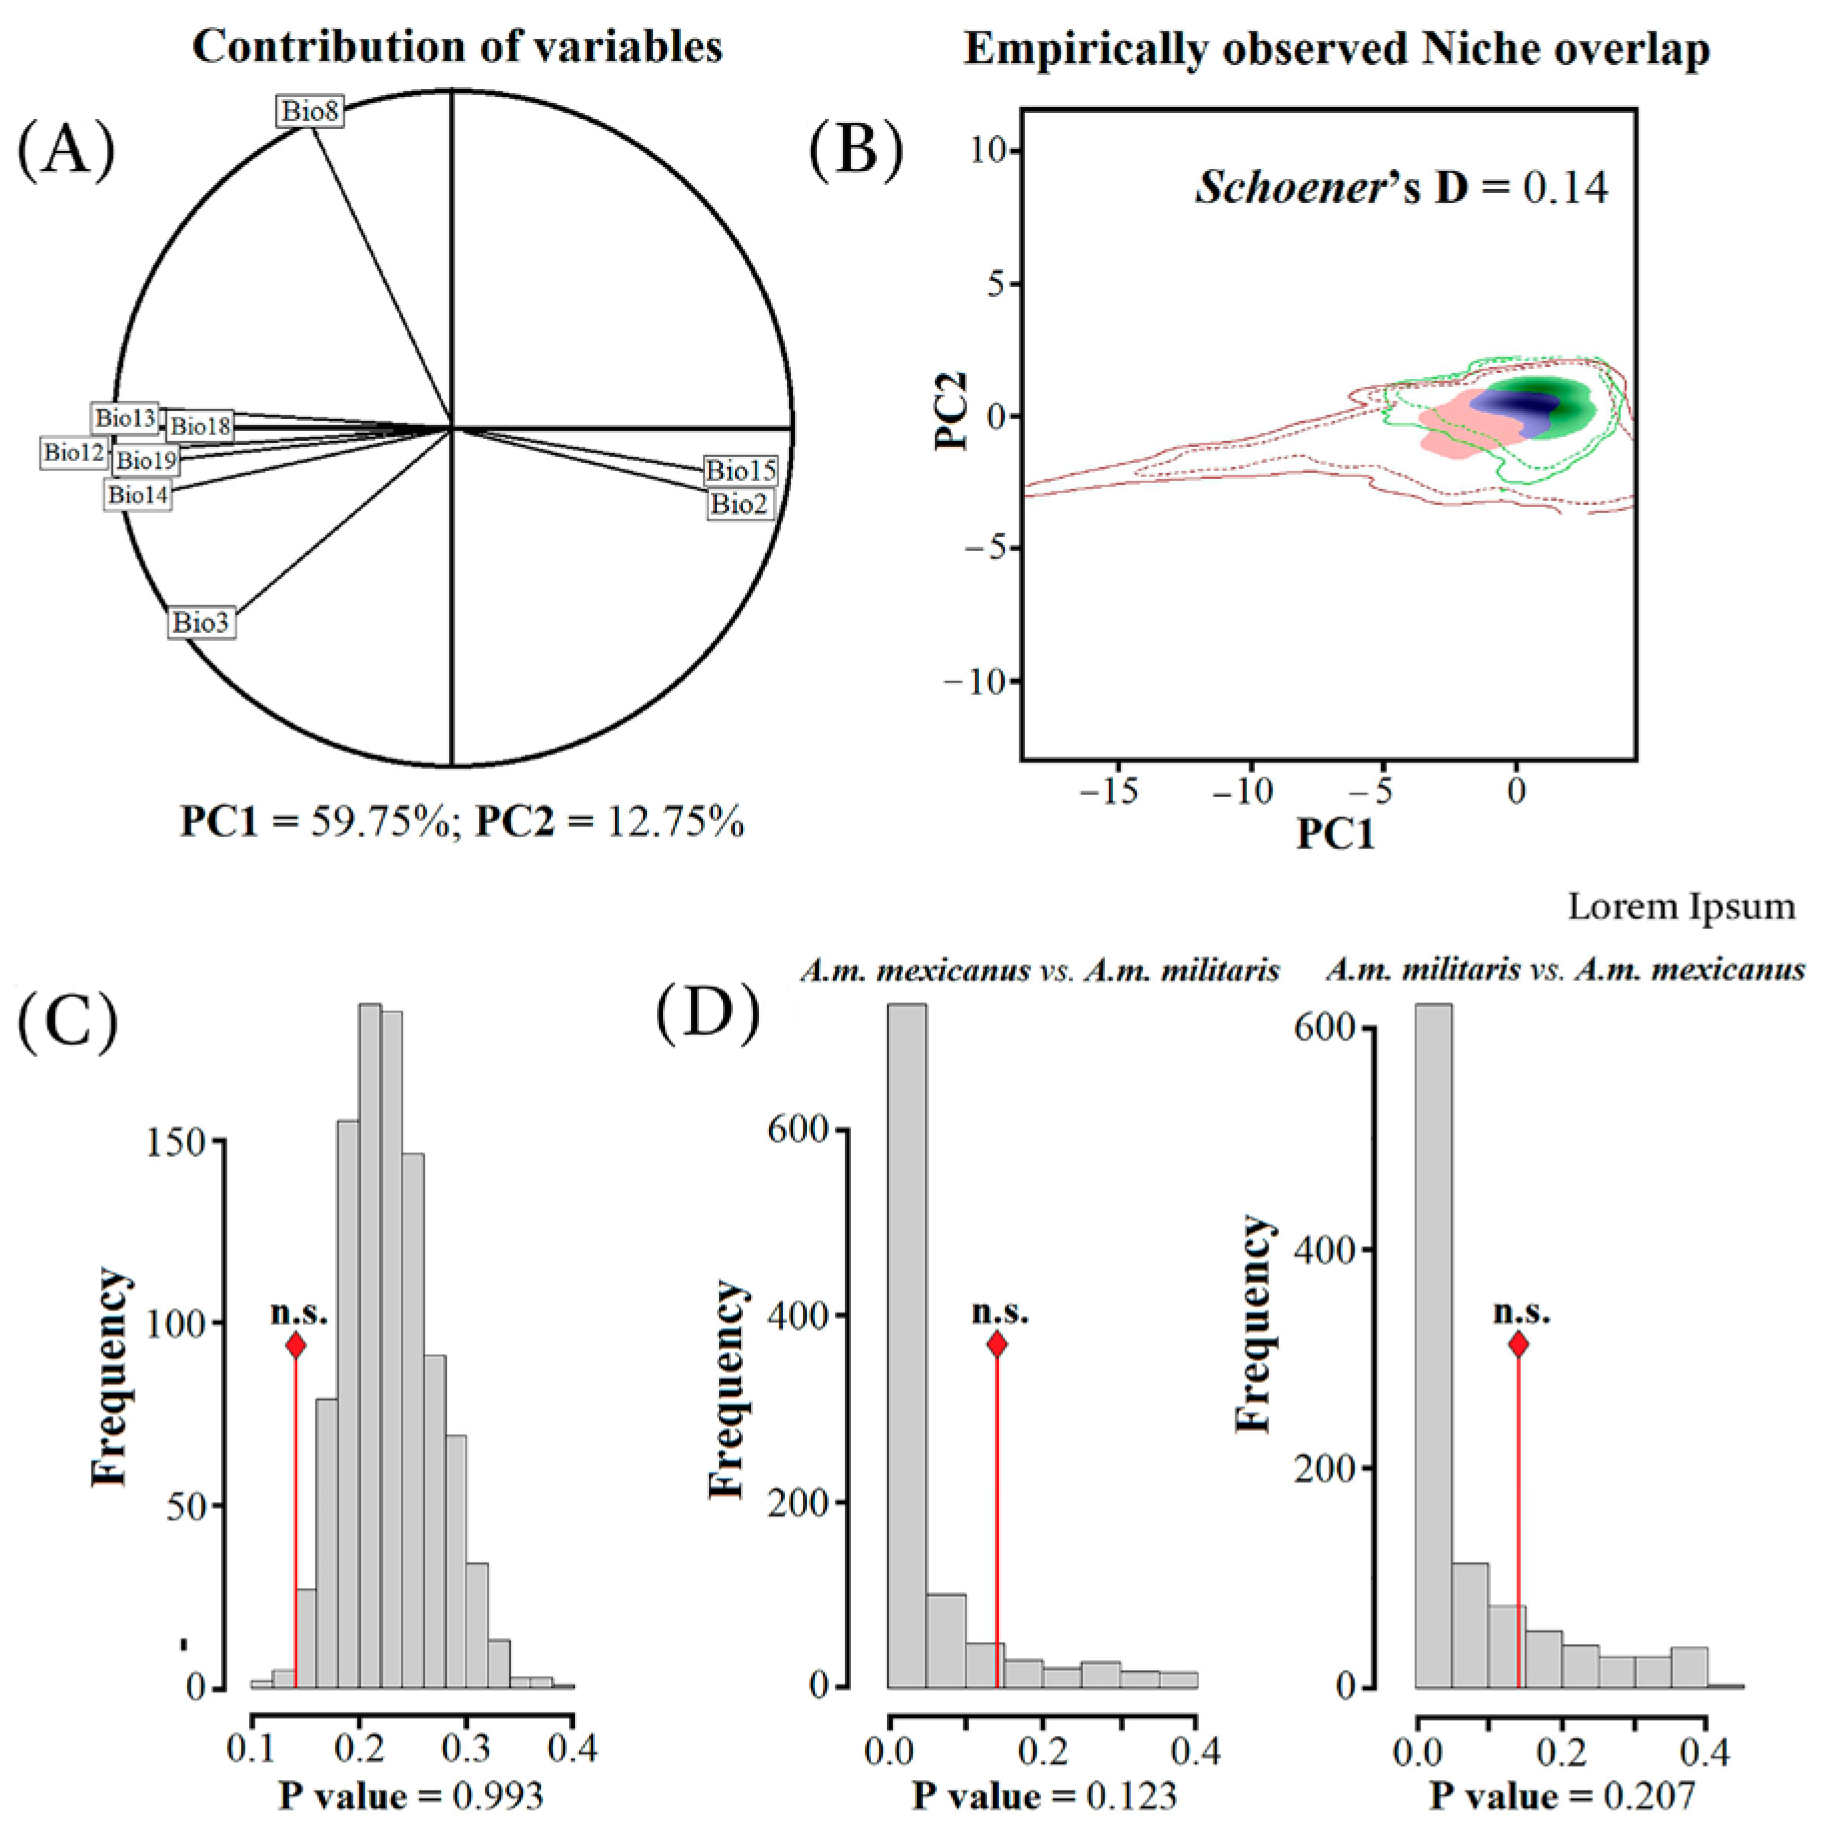
3.3. Niche Divergence Analyses and Paleo-Distributions Models

Our models showed a good fit for the current distribution for both the Mexican (partial-ROC test = 1.50; omission rate = 13.70%; AICc = 4,764.19) and the South American lineages (partial-ROC test = 1.46; omission rate = 14.6%; AICc = 5098.47). In both instances, the results indicated strong model performance, indicating that the models surpassed random outcomes and were therefore statistically descriptive of the Grinnellian niche of each lineage. The Jackknife test and variable contribution values within MaxEnt highlighted the most influential variables in the model construction for the A. m. mexicanus lineage, which included BIO 12 (34.8%), Bio 15 (16.0%), BIO 08 (15.6%), and Bio 03 (13.3%). In the case of the South American lineage (A. m. militaris and A. m. bolivianus), the most important variables were BIO 08 (38.9%), Bio 13 (23.3%), and BIO 19 (10.4%).
In contrast, the occurrence of density surfaces (dark spots in Figure 2) in environmental space, as determined by PCAenv, distinctly portrayed the differentiation in positioning between the South and North American lineages. Results from the PCA-env revealed that 72.50% of the environmental variation is explained by the two first principal components (PC1 = 59.75% and PC2 = 12.75%). Observed Schoeners’ D values were 0.14 and statistically non-significant in both niche equivalency (p = 0.99) and similarity tests (A. m. mexicanus–South American group: p = 0.12 vs. South American group–A. m. mexicanus: p = 0.21). These results suggest that the observed niche overlap was no more similar/equivalent than expected by chance (Figure 2), thus rejecting the hypothesis of niche conservatism between lineages (that is, lineages occupy different niches). Finally, both the linear and blob range-break tests supported the idea that significant environmental differences (p < 0.05) separate the lineages.
Furthermore, results from the paleodistribution models (Figure 3) demonstrated that the suitable areas’ distribution for the two lineages was markedly geographically differentiated. Notably, the allopredictions (i.e., predicted distributions of the Mexican lineage into the range of the South American lineage and vice versa) exhibited lower overlap values across all four scenarios (5.6% for the Recent, 6.7% for the mid-Holocene, 2.5% for the LGM, and 9.0% for the LIG). This suggests that environmental differentiation has been upheld since at least the Late Pleistocene. Overall, we observed that the South American lineage demonstrated an increase (~66%) in highly suitable areas during the LGM in comparison to the present, whereas the Mexican lineage displayed relatively smaller suitable areas (approximately 57%) that were also more fragmented. Moreover, the projected climatic stability areas for each lineage (crossed areas within the current distribution map, Figure 3) covered 38.62% of the presently recognized distribution for the Mexican lineage and 52.56% for the South American lineage. However, it is important to highlight that models predicted a higher surface of climatic stability areas for South American lineage across Central America and northwestern Mexico (Figure 3).

4. Discussion

4.1. Genetic Diversity and Structure

We detected relatively high levels of haplotype diversity but low nucleotide diversity in the Military Macaw, which is consistent with the high frequency of private haplotypes and limited genetic differentiation [83]. This genetic diversity profile is akin to that observed in the endangered species Hyacinth Macaw (Anodorhynchus hyacinthinus) [84] and in psittacidae species classified of least concern such as the Scarlet Macaw (A. macao) [85] and Burrowing Parakeet (Cyanoliseus patagonus) [17].
Nonetheless, the overall genetic diversity we observed in the Military Macaw surpasses that of other threatened bird species [86,87,88]. Despite experiencing population declines and increased fragmentation due to habitat loss [24,25,89], the relatively elevated levels of genetic diversity unveiled in this study suggest historically large population sizes for the species. Comparable scenarios have been proposed for other endangered bird species, including the Andean Condor (Vultur gryphus) [90], Whooping Crane (Grus americana) [43], Greater Prairie-Chicken (Tympanuchus cupido) [91,92], the Spotted Owl (Strix occidentalis) [93], and the Resplendent Quetzal (Pharomachrus mocinno) [94]. Furthermore, we observed higher levels of genetic diversity in A. m. militaris and A. m. bolivianus in comparison to A. m. mexicanus, implying that the South American populations historically maintained larger population sizes than the North American subspecies of the Military Macaw.
Our findings highlight the existence of two major populations within the Military Macaw. The Mexican population (subspecies A. m. mexicanus) shows significant genetic differentiation from the South American populations (A. m. militaris + A. m. bolivianus), with no shared haplotypes between them. This partitioning can be attributed to long-term population isolation, as observed in other macaw species such as Ara ararauna [8]. In contrast, for the populations of the subspecies A. m. bolivianus and A. m. militaris, no significant FST values were obtained. This implies that these taxa continue to experience gene flow, which is plausible given their geographical proximity. Nevertheless, this pattern can also be explained by incomplete lineage sorting within the mitochondrial genome of these subspecies [32].
We observed genetic differentiation among populations inhabiting the Sierra Madre Occidental/Sierra Madre del Sur and Sierra Madre Oriental in A. m. mexicanus. A previous study conducted in the same Mexican localities using nuclear markers (microsatellites) [37] reported limited gene flow between these regions, likely attributed to geographic barriers such as mountain ranges (Trans-Mexican Volcanic Belt, Sierra Madre Occidental, and the Sierra Madre Oriental, as well as the Central Mexican Plateau) [95,96]. Additionally, our study revealed further sub-structuring among populations in the northwestern Sierra Madre Occidental/Sierra Madre del Sur region. This pattern was not evident in previous microsatellite data [37] but can be explained by sex-biased dispersal [6,8,96,97]. For instance, if dispersal is predominantly male-biased while females tend to exhibit philopatry, nuclear markers are more likely to detect higher levels of gene flow among populations compared to mitochondrial markers [8]. Furthermore, in such a scenario, a significant proportion of localized mitochondrial haplotypes can be expected [8,98,99], mirroring the observed in our present study.

4.2. Phylogeography, Niche Divergence, and Paleo-Distributions Models

Our phylogenetic analysis revealed significant differentiation between the haplotypes of A. m. mexicanus and two South American subspecies (A. m. militaris and A. m. boliviaunus), providing support for the existence of two distinct lineages within A. militaris. This outcome aligns with previous phylogenetic inferences based on different mitochondrial genes [9] or on the whole mitochondrial genome of the species [32]. It is noteworthy that the populations of A. militaris from North America and South America are entirely allopatric. Furthermore, our results suggest the historically limited movement of mitochondrial lineages between these regions, as indicated by the absence of shared haplotypes among populations [8]. Additionally, our estimates of divergence time estimations indicate that the genetic divergence between these two populations likely occurred during the Pleistocene.
The repeated instances of discontinuous distributions observed in A. militaris can potentially be attributed to two distinct processes: Long-distance dispersal or local extinction of a once widely distributed ancestor [100]. However, it is important to note that long-distance dispersal is considered less likely in non-migratory avian taxa [100]. Furthermore, although individuals of A. militaris can fly distances of around 24 km per day, these movements are seasonal, altitudinal, and nomadic, primarily in response to fluctuations in food availability [37,101,102]. Additionally, there are no records of any species within the genus Ara undertaking latitudinal migratory movements [25,37]. These various lines of evidence collectively suggest that long-distance migration is an unlikely explanation for the discontinuous distribution observed in A. militaris.
On the other hand, extinction has been widely considered one of the most plausible explanations for the broad distributional gaps observed in non-migratory avian taxa, e.g., [100,103]. The disjunct distribution pattern of A. militaris could potentially be attributed to local extinctions that occurred relatively recently, possibly associated with the effects of Pleistocene climatic changes around 1.6 million years ago. In Central America, the Pleistocene climatic cycling between glacial and interglacial periods led to significant changes in the distribution and population sizes of various plant and animal species, as evidenced by fossil and genetic data spanning the Quaternary period (last 2.6 million years). These data demonstrate fluctuations in the composition and distribution of species currently found in dry forests [104,105]. During glacial periods, cooler and drier conditions prevailed in the Neotropics, facilitating the expansion and connectivity of dry forests across the Americas [106,107], including suitable habitats for species such as A. militaris.
In contrast, during interglacial periods, characterized by the conditions experienced today, warm and humid environments prevail. This can potentially lead to the disruption of the dry forest corridor due to the expansion of humid forests in the Neotropics [108,109]. Such expansion could significantly reduce the extent of dry forests, ultimately resulting in the local extinction of A. militaris populations in Central America and causing a separation between populations in North America and South America. The results of our paleodistribution models align with this extinction scenario in two main ways. First, for the South American lineage, a larger distribution was predicted during the last glacial maximum compared to the three different interglacial periods assessed (current, Holocene, and LIG). Second, although historically stable areas are predicted in Central America for this lineage, they are relatively small and widely fragmented, potentially harboring small populations that are more susceptible to local extinction events.
In addition to historical habitat reductions, the extinction of A. militaris in Central America could have been influenced by negative interactions with its sister species, A. ambiguus. This species primarily inhabits Central America and possesses a larger body size compared to the Military Macaw. While A. ambiguus is commonly associated with humid and lowland forests [110], these environmental conditions could provide a potential opportunity for A. ambiguus to outcompete A. militaris, potentially contributing to the latter’s extinction in Central America. However, this hypothesis warrants further investigation and should be explored more comprehensively.
In Mexico, we have identified two geographically structured monophyletic groups of A. m. mexicanus. One group is restricted to northeast Mexico in the Sierra Madre Oriental, while the other is confined to the northwestern portion of the Sierra Madre Occidental/Sierra Madre del Sur. These findings align with previous molecular studies on the species using mitochondrial [31] and nuclear [37] markers. However, our results also suggest additional genetic structure among the populations in western Mexico. The phylogeographic and genetic structure revealed in this study indicates historical isolation among the populations identified in Mexico. This isolation could be attributed to the presence of geographic barriers [37,111] as well as the responses of A. m. mexicanus populations to Quaternary climatic fluctuations [112].
Indeed, our paleodistribution models for the North American lineage of A. militaris indicate historically small and fragmented stable areas in Mexico. Additionally, we found that the distribution of this lineage has undergone changes during the climatic dynamics of the last glacial and interglacial periods, although in a different manner than observed for the South American lineage. Specifically, our models predict a smaller and more fragmented distribution during the glacial periods compared to the interglacial times. It is worth noting that palynological studies have indicated that climatic conditions in Mexico during interglacial or glacial times were not uniformly dry or wet, respectively [113,114,115]. Thus, during glacial periods, the dry forest biome could contract in response to more humid conditions, whereas it could expand during interglacial periods due to drier conditions. Similar responses to Quaternary climatic conditions, as observed in A. m. mexicanus, have also been identified in other dry forest species. For example, similar patterns have been observed in the Long-billed hermit (Phaethornis longirostris) [116], Red-eyed Vireo (Vireo hypochryseus) [33], Russet-crowned Motmot (Momotus mexicanus), Golden-cheeked Woodpecker (Melanerpes chrysogenys), Orange-breasted Bunting (Passerina leclancherii) [34], and Squirrel Cuckoo (Piaya cayana) [35].
If populations of A. m. mexicanus contracted during glacial periods and subsequently expanded from refugia during interglacial periods, we would expect to find evidence of a recent population expansion in the species. In line with this expectation, neutrality tests indicate a recent demographic expansion in at least two Mexican populations. Additionally, the star-like relationships observed in the haplotype network analysis for the Mexican populations are commonly observed in other taxa that have undergone recent demographic expansions, including invasive species [117,118].

4.3. Conservation and Taxonomic Implications

The destruction and fragmentation of natural forests due to increased human activities have had a significant impact on the natural habitat of A. militaris. Furthermore, the capture and illegal trade of wild macaw individuals have played a major role in the decline of wild populations [21,22,37]. In this context, conservation genetics has played a crucial role in developing appropriate conservation and management strategies [119]. One approach is the identification of conservation units, such as Evolutionarily Significant Units (ESUs) and Management Units (MUs) [119,120,121]. ESUs and MUs help to identify patterns in genetic variation that result from evolutionary history, enabling us to make informed decisions for the conservation of genetic diversity within a species [121]. In fact, the phylogeographic patterns of the Military Macaw identified in this study could contribute to defining conservation units, especially considering that most of the individuals included in the study were from breeding populations.
According to the Moritz model [36], the populations of Military Macaw in South America (A. m. militaris and A. m. bolivianus) should be considered a single ESU. This is further supported by the results of the ecological niche divergence analysis, which indicate that the environmental niches occupied by the North American and South American lineages are distinct. Therefore, the conservation efforts for these lineages should be separated. Within the ESU in South America, two subgroups can be distinguished corresponding to the subspecies A. m. militaris and A. m. bolivianus. These subgroups can be recognized as independent MUs because they possess unique and non-shared haplotypes [119,120,122].
For the Mexican populations of the Military Macaw, it is appropriate to recognize at least two ESUs. The first ESU corresponds to the populations in the Sierra Madre Oriental, as their genetic differentiation has been consistently observed using both mitochondrial markers [9,32] and nuclear [37] markers. The second ESU corresponds to the populations in the Sierra Madre Occidental/Sierra Madre del Sur. Within this ESU, two MUs can be considered: (1) The northern portion of the Sierra Madre Occidental and (2) the central and southern portion of the Sierra Madre Occidental/Sierra Madre del Sur. These regions show distinct genetic structures and differentiation. However, it is worth noting that Rivera-Ortiz et al. [37] considered the northwestern populations as a single MU.
Overall, our findings are largely consistent with previous phylogenetic studies on the Military Macaw, which were based on a larger number of mitochondrial loci [31], or the entire mitochondrial genome [32]. These studies identified two major lineages within the species: The North American subspecies (A. m. mexicanus) and the South American subspecies (A. m. militaris and A. m. bolivianus) [31,32]. These results suggest a historical isolation between the ancestral populations of the military macaw in North and South America, a separation that still persists in its discontinuous geographic distribution. Additionally, we have identified significant ecological niche differentiation between these two lineages. Taken together, these findings suggest that A. m. mexicanus can be recognized as a distinct species (Ara mexicanus) separated from the Military Macaw in South America, which can improve the conservation priorities for both taxa [94,120]. Nevertheless, genetic information from nuclear regions, as well as morphological measurements and ecological aspects, are indispensable to further support the taxonomic status of these two lineages [32,35].
Finally, we recognize that our inferences about the phylogeographic history of A. militaris can be limited by the use of short sequences of a single locus and the omission of its sister species (A. ambiguus). Although, our results were largely consistent among them, as well as with previous studies including a larger number of mitochondrial loci and samples of A. ambiguus [29,30], we also consider that further studies involving a broader set of independent markers and populations (of both A. militaris in South America and A. ambiguus) could enhance the understanding of the evolutionary and biogeographic history of the Military Macaw species complex. Moreover, our study highlights the significance of adopting a conservation unit approach for the effective protection and management of the Military Macaw. It is crucial to implement targeted conservation actions at the regional level to ensure the preservation of genetic integrity in these evolutionarily important populations. We recommend the protection and restoration of habitat within each recognized management unit of A. militaris and A. mexicanus to enhance local genetic connectivity and provide suitable conditions for the species. We also suggest collaboration with local communities to engage them in conservation efforts, raise awareness about the importance of protecting natural habitats, and reduce poaching activities, as well as the implementation of a well-supported ecotourism program that combines scientific research, community involvement, and environmental education. Such an approach has proven effective in combating illegal trafficking and mitigating habitat loss [37]. By implementing these recommendations, we can work towards the long-term conservation and management of the Military Macaw, safeguarding its genetic diversity and ensuring the persistence of this iconic species.

Supplementary Materials

The following supporting information can be downloaded at: https://www.mdpi.com/article/10.3390/d15101035/s1, Table S1: List of Military Macaw samples obtained for the study. Figure S1: We constructed mtDNA phylogenetic trees based on a Cyt-b gene dataset consisting of more than 300 base pairs, with a single outgroup species (Ara macao). (A) Maximum likelihood (ML) approach and (B) the Bayesian inference (BI) approach were employed in our analysis, including 68 terminals and 582 positions. SMOc1 to 6 = Mexico-Sierra Madre Occidental/Sierra Madre del Sur, SMOr1 to 2 = Mexico-Sierra Madre Oriental. C1 to 2 = Colombia, P1 = Peru, and B1 = Bolivia.

Author Contributions

Conceptualization, F.A.R.-O.; methodology, F.A.R.-O. and S.S.-U.; software, F.A.R.-O., S.S.-U. and D.A.P.-T.; validation, F.A.R.-O. and S.S.-U.; formal analysis, F.A.R.-O., S.S.-U. and D.A.P.-T.; investigation, F.A.R.-O., S.S.-U., D.A.P.-T., A.G.N.-S., M.d.C.A. and K.O.; resources, F.A.R.-O. and M.d.C.A.; writing—original draft preparation, F.A.R.-O. and S.S.-U.; writing—review and editing, F.A.R.-O., S.S.-U., D.A.P.-T., A.G.N.-S., M.d.C.A. and K.O. All authors have read and agreed to the published version of the manuscript.

Funding

This work was supported by UNAM-PAPIIT IA2017821, granted to F.A.R.-O.

Institutional Review Board Statement

Not applicable.

Data Availability Statement

All sequences were deposited in gene GenBank under the accession numbers ID KT957209 to KT957275. Also, all scripts and input information used for all ecological and geographical niche modelling are available at https://github.com/davidprietorres/ara_militaris_project (accessed on 25 May 2023).

Acknowledgments

This work was supported by UNAM-PAPIIT PAPIIT IA207821. F. A. Rivera-Ortiz is grateful for the logistical support provided by project SDEI-PTID-02-UNAM of P. Davila. Joel L. Craycraft and Paul R. Sweet of the collection of birds of American Museum of Natural History, by the loan of samples. We thank the various authorities for the facilities provided for the completion of fieldwork. Monserrat Serra Rojas de la Barrera by the illustration of the Military Macaw (PAPIIT IA210820 de Leopoldo Vázquez). Many colleagues participated in field research, and the authors are particularly grateful for the dedication shown by V. Garcia, A. M. Contreras-González, E. Berrones, V. H. Jiménez-Arcos, C. Villar, H. Verdugo, and Y. Rubio.

Conflicts of Interest

The authors declare no conflict of interest. The funders had no role in the design of the study; in the collection, analyses, or interpretation of data; in the writing of the manuscript; or in the decision to publish the results.

References

  1. Avise, J.C. Phylogeography: The History and Formation of Species; Harvard University Press: Cambridge, MA, USA, 2000. [Google Scholar] [CrossRef]
  2. Moritz, C.; Patton, C.J.; Schneider, C.J.; Smith, T.B. Diversification of rainforest faunas: An integrated molecular approach. Ann. Rev. Ecol. Evol. Syst. 2000, 31, 533–563. [Google Scholar] [CrossRef]
  3. Caparroz, R.; Fernandes, G.H.; Berkunsky, I.; Garcia, R. The role of demography and climatic events in shaping the phylogeography of Amazona aestiva (Psittaciformes, Aves) and definition of management units for conservation. Divers. Distrib. 2009, 15, 459–468. [Google Scholar] [CrossRef]
  4. Sotelo-Muñoz, M.; Maldonado-Coelho, M.; Svensson-Coelho, M.; Dos Santos, S.S.; Miyaki, C.Y. Vicariance, dispersal, extinction and hybridization underlie the evolutionary history of Atlantic forest fire-eye antbirds (Aves: Thamnophilidae). Mol. Phylogenet. Evol. 2020, 148, 106820. [Google Scholar] [CrossRef] [PubMed]
  5. Pârâu, L.G.; Wink, M. Common patterns in the molecular phylogeography of western palearctic birds: A comprehensive review. J. Ornithol. 2021, 162, 937–959. [Google Scholar] [CrossRef]
  6. Irwin, D.E. Phylogeographic breaks without geographic barriers to gene flow. Evolution 2002, 56, 2383–2394. [Google Scholar] [CrossRef]
  7. Juniper, T.; Parr, M. Parrots: A Guide to the Parrots of the World; Yale University Press: New Haven, CO, USA, 1998. [Google Scholar]
  8. Caparroz, R.; Miyaki, C.Y.; Baker, A.J. Characterization of microsatellite loci in Blue-and-Gold Macaw, Ara ararauna (Psittaciforme: Aves). Mol. Ecol. Notes 2003, 3, 441–443. [Google Scholar] [CrossRef]
  9. Eberhard, J.R.; Bermingham, E. Phylogeny and biogeography of the Amazona ochrocephala (Ave: Psittacidae) complex. Auk 2004, 121, 318–332. [Google Scholar] [CrossRef]
  10. Ribas, C.C.; Tavares, E.S.; Yoshihara, C.Y.; Miyaki, C.Y. Phylogeny and biogeography of Yellow-headed and Blue-fronted parrots (Amazona ochrocephala and Amazona aestiva) with special reference to the South American taxa. Ibis 2007, 149, 564–574. [Google Scholar] [CrossRef]
  11. Ribas, C.C.; Miyaki, C.Y. Molecular systematics in Aratinga parakeets: Species limits and historical biogeography in the ‘solstitialis’ group, and the systematic position of Nandayus nenday. Mol. Phylogenet. Evol. 2004, 30, 663–675. [Google Scholar] [CrossRef]
  12. Russello, M.A.; Amato, G. A molecular phylogeny of Amazona: Implications for Neotropical parrot biogeography, taxonomy, and conservation. Mol. Phylogenet. Evol. 2004, 30, 421–437. [Google Scholar] [CrossRef]
  13. Tavares, E.S.; Baker, A.J.; Pereira, S.L.; Miyaki, C.Y. Phylogenetic relationships and historical biogeography of Neotropical parrots (Psittaciformes: Psittacidae: Arini) inferred from mitochondrial and nuclear DNA sequences. Syst. Biol. 2006, 55, 454–470. [Google Scholar] [CrossRef]
  14. Ribas, C.C.; Miyaki, C.Y.; Cracraft, J. Phylogenetic relationships, diversification and biogeography in Neotropical Brotogeris parakeets. J. Biogeogr. 2009, 36, 1712–1729. [Google Scholar] [CrossRef]
  15. Avise, J.C.; Walker, D. Pleistocene phylogeography effects on avian populations and the speciation process. Proc. R. Soc. B Biol. Sci. 1998, 265, 457–463. [Google Scholar] [CrossRef] [PubMed]
  16. Tavares, E.S.; Yamashita, C.; Miyaki, C.Y. Phylogenetic relationships among some Neotropical parrot genera (Psittacidae: Aves) based on mitochondrial sequences. Auk 2004, 121, 230–242. [Google Scholar] [CrossRef]
  17. Masello, J.F.; Quillfeldt, P.; Munimanda, G.K.; Klauke, N.; Segelbacher, G.; Schaefer, H.M.; Failla, M.; Cortés, M.; Moodley, Y. The high Andes, gene flow and a stable hybrid zone shape the genetic structure of a wide-ranging South American parrot. Front. Zool. 2011, 8, 1–16. [Google Scholar] [CrossRef]
  18. Presti, F.T.; Guedes, N.M.R.; Antas, P.T.Z.; Miyaki, C.Y. Population genetic structure in Hyacinth Macaws (Anodorhynchus hyacinthinus) and identification of the probable origin of confiscated individuals. J. Hered. 2015, 106, 491–502. [Google Scholar] [CrossRef]
  19. Bennett, P.M.; Owens, I.P.F. Variation in extinction risk among birds: Chance or evolutionary predisposition? Proc. R. Soc. 1997, 264, 401–408. [Google Scholar] [CrossRef]
  20. Forshaw, J.M. Parrots of the World; Princeton University Press: Princeton, NJ, USA, 2010. [Google Scholar]
  21. Bird Life’s Online World Bird Database: The Site for Bird Conservation. Available online: http://www.birdlife.org (accessed on 28 June 2023).
  22. Collar, N.J.; Juniper, A.T. Dimensions and causes of the parrot conservation crisis. In New World Parrots in Crisis: Solutions from Conservation Biology; Beissinger, S.R., Snyder, N.F.R., Eds.; Smithsonian Institution: Washington, DC, USA, 1992; pp. 1–24. [Google Scholar]
  23. Olson, S.L.; Suárez, W. A fossil cranium of the Cuban Macaw Ara tricolor (Aves: Psittacidae) from Villa Clara Province, Cuba. Caribb. J. Sci. 2008, 44, 287–290. [Google Scholar] [CrossRef]
  24. Ríos-Muñoz, C.A. Navarro-Sigüenza, A.G. Efectos del cambio de uso de suelo en la disponibilidad hipotética de hábitat para los psitácidos de México. Ornitol. Neotrop. 2009, 20, 491–509. [Google Scholar]
  25. Rivera-Ortíz, F.A.; Oyama, K.; Ríos-Muñoz, C.A.; Solórzano, S.; Navarro-Sigüenza, A.G.; Arizmendi, M.C. Habitat characterization and modeling of the potential distribution of the Military Macaw (Ara militaris) in Mexico. Rev. Mex. Biodivers. 2013, 84, 1200–1215. [Google Scholar] [CrossRef]
  26. Landa, M.D.L.N.; Castro, J.C.M.; Monterrubio-Rico, T.C.; Lara-Cabrera, S.I.; Prieto-Torres, D.A. Predicting co-distribution patterns of parrots and woody plants under global changes: The case of the Lilac-crowned Amazon and Neotropical dry forests. J. Nat. Conserv. 2023, 71, 126323. [Google Scholar] [CrossRef]
  27. Nader, W.; Werner, D.; Wink, M. Genetic diversity of scarlet macaws Ara macao in reintroduction studies for threatened populations in Costa Rica. Biol. Conserv. 1999, 87, 269–272. [Google Scholar] [CrossRef]
  28. Caparroz, R.; Miyaki, C.Y.; Bampi, M.I.; Wajntal, A. Analysis of the genetic variability in a sample of the remaining group of Spix’s Macaw (Cyanopsitta spixii, Psittaciformes: Aves) by DNA fingerprinting. Biol. Conserv. 2001, 99, 307–311. [Google Scholar] [CrossRef]
  29. Eberhard, J.R.; Iñigo-Elias, E.E.; Enkerlin-Hoeflich, E.; Cun, E.P. Phylogeography of the Military Macaw (Ara militaris) and the Great Green Macaw (A. Ambiguus) based on MTDNA sequence data. Wilson J. Ornithol. 2015, 127, 661–669. [Google Scholar] [CrossRef]
  30. Dehasque, M. Applied Conservation Genomics of Military Macaws (Ara militaris). Ph.D. Thesis, Universiteit Antwerpen, Antwerp, Belgian, 2016. [Google Scholar]
  31. The Integrated Taxonomic Information System. Available online: http://www.catalogueoflife.org/annual-checklist/2010/info/about (accessed on 28 June 2023).
  32. Howell, S.N.G.; Webb, S. A Guide to the Birds of Mexico and Northern Central America; Oxford University Press: Oxford, UK, 1995; p. 337. [Google Scholar]
  33. Arbeláez-Cortés, E.; Roldán-Piña, D.; Navarro-Sigüenza, A.G. Multilocus phylogeography and morphology give insights into the recent evolution of a Mexican endemic songbird: Vireo hypochryseus. J. Avian Biol. 2014, 45, 253–263. [Google Scholar] [CrossRef]
  34. Arbeláez-Cortés, E.; Milá, B.; Navarro-Sigüenza, A.G. Multilocus analysis of intraspecific differentiation in three endemic bird species from the northern Neotropical dry forest. Mol. Phylogenet. Evol. 2014, 70, 362–377. [Google Scholar] [CrossRef] [PubMed]
  35. Sanchez-Gonzalez, L.A.; Cayetano, H.; Prieto-Torres, D.A.; Rojas-Soto, O.R.; Navarro-Sigüenza, A.G. The role of ecological and geographical drivers of lineage diversification in the Squirrel cuckoo Piaya cayana in Mexico: A mitochondrial DNA perspective. J. Ornithol. 2023, 164, 37–53. [Google Scholar] [CrossRef]
  36. IUCN. Red List of Threatened Species. Available online: https://www.iucnredlist.org/ (accessed on 24 June 2023).
  37. Rivera-Ortíz, F.A.; Solórzano, S.; Arizmendi, M.C.; Dávila-Aranda, P.; Oyama, K. Genetic diversity and structure of the Military Macaw (Ara militaris) in Mexico: Implications for conservation. Trop. Conserv. Sci. 2017, 10, 1–12. [Google Scholar] [CrossRef]
  38. Leeton, P.; Christidis, L. Feathers from Museum Bird Skins—A good source of DNA for Phylogenetic Studies. Condor 1993, 95, 465–466. [Google Scholar] [CrossRef]
  39. Murphy, S.A.; Double, M.C.; Legge, S.M. The phylogeography of palm cockatoos, Probosciger aterrimus, in the dynamic Australo-Papuan region. J. Biogeogr. 2007, 34, 1534–1545. [Google Scholar] [CrossRef]
  40. Miyaki, C.Y.; Matioli, S.R.; Burke, T.; Wajntal, A. Parrot evolution and paleogeographical events: Mitochondrial DNA evidence. Mol. Biol. Evol. 1998, 15, 544–551. [Google Scholar] [CrossRef]
  41. Groombridge, J.J.; Massey, J.G.; Bruch, J.C.; Malcolm, T.; Brosius, C.N.; Okada, M.M.; Sparklin, B.; Fretz, J.S.; VanderWerf, E.A. An attempt to recover the Po’ouli by translocation and an appraisal of recovery strategy for bird species of extreme rarity. Biol. Conserv. 2004, 118, 365–375. [Google Scholar] [CrossRef]
  42. Sorenson, M.D.; Ast, J.C.; Dimcheff, D.E.; Yuri, T.; Mindell, D.P. Primers for a PCRbased approach to mitochondrial genome sequencing in birds and other vertebrates. Mol. Phylogenet. Evol. 1999, 12, 105–114. [Google Scholar] [CrossRef] [PubMed]
  43. Glenn, T.C.; Stephan, W.; Braun, M.J. Effects of a population bottleneck on whooping crane mitochondrial DNA variation. Conserv. Biol. 1999, 13, 1097–1107. [Google Scholar] [CrossRef]
  44. Abbott, C.L.; Double, M.C. Phylogeography of Shy and White-capped albatrosses inferred from mitochondrial DNA sequences: Implications for population history and taxonomy. Mol. Ecol. 2003, 12, 2747–2758. [Google Scholar] [CrossRef]
  45. Kundu, S.; Jones, C.G.; Prys-Jones, R.P.; Groombridge, J.J. The evolution of the Indian Ocean parrots (family Psittacidae): Extinction, adaptive radiation and eustasy. Mol. Phylogenet. Evol. 2012, 62, 296–305. [Google Scholar] [CrossRef]
  46. Zink, R.M.; Barrowclough, G.F. Mitochondrial DNA under siege in avian phylogeography. Mol. Ecol. 2008, 17, 2107–2121. [Google Scholar] [CrossRef]
  47. Edgar, R.C. MUSCLE: Multiple sequence alignment with high accuracy and high throughput. Nucleic Acids Res. 2004, 32, 1792–1797. [Google Scholar] [CrossRef]
  48. Tamura, K.; Stecher, G.; Peterson, D.; Filipski, A.; Kumar, S. MEGA6: Molecular Evolutionary Genetics Analysis version 6.0. Mol. Biol. Evol. 2013, 30, 2725–2729. [Google Scholar] [CrossRef]
  49. Rozas, J.; Sánchez-De, I.; Barrio, J.C.; Messeguer, X.; Rozas, R. DnaSP, DNA polymorphism analysis by coalescent and other methods. Bioinformatics 2003, 19, 2496–2497. [Google Scholar] [CrossRef]
  50. Tajima, F. Statistical method for testing the neutral mutation hypothesis by DNA polymorphism. Genetics 1989, 123, 585–595. [Google Scholar] [CrossRef] [PubMed]
  51. Fu, Y.X. Statistical tests of neutrality of mutations against population growth, hitchhiking and background selection. Genetics 1997, 147, 915–925. [Google Scholar] [CrossRef] [PubMed]
  52. Excoffier, L.; Laval, G.; Schneider, S. Arlequin 3.01: An integrated software package for population genetics data analysis. Evol. Bioinform. Online 2005, 1, 47–50. [Google Scholar] [CrossRef]
  53. Dellicour, S.; Mardulyn, P. SPADS 1.0: A toolbox to perform spatial analyses on DNA sequence data sets. Mol. Ecol. Resour. 2014, 14, 647–651. [Google Scholar] [CrossRef] [PubMed]
  54. Raymond, M.; Rousset, F. GENEPOP Version 1.2: Population genetics software for exact tests and ecumenicism. J. Hered. 1995, 86, 248–249. [Google Scholar] [CrossRef]
  55. Tavares, M.G.; Dias, L.A.S.; Borges, A.A.; Lopes, D.M.; Busse, A.H.P.; Costa, R.G.; Fernandes-Salomão, T.M.; Campos, L.A.O. Genetics divergence between population of the stingless bee uruçu amarela (Melipona rufiventris group, Hymenoptera, Meliponini): Is there a new Melipona species in the Brazilian state of Minas Gerais? Genetic Mol. Biol. 2007, 30, 667–675. [Google Scholar] [CrossRef]
  56. DeSalle, R.; Narechania, A.; Tessler, M. Multiple outgroups can cause random rooting in phylogenetics. Mol. Phylogenet. Evol. 2023, 184, 107806. [Google Scholar] [CrossRef]
  57. Lanfear, R.; Kokko, H.; Eyre-Walker, A. Population size and the rate of evolution. Trends Ecol. Evol. 2014, 29, 33–41. [Google Scholar] [CrossRef]
  58. Huelsenbeck, J.P.; Ronquist, F. MRBAYES: Bayesian inference of phylogenetic trees. Bioinformatics 2001, 17, 754–755. [Google Scholar] [CrossRef]
  59. Rambaut, A.; Drummond, A. Tracer MCMC Trace Analysis Tool; Univeristy of Oxford: Oxford, UK, 2003; Available online: https://tree.bio.ed.ac.uk/software/tracer/ (accessed on 15 January 2023).
  60. Stamatakis, A. RAxML-VI-HPC: Maximum likelihood-based phylogenetic analyses with thousands of taxa and mixed models. Bioinformatics 2006, 21, 2688–2690. [Google Scholar] [CrossRef]
  61. Bandelt, H.J.; Forster, P.; Sykes, B.C.; Richards, M.B. Mitochondrial portraits of human populations using median networks. Genetics 1995, 141, 743–753. [Google Scholar] [CrossRef] [PubMed]
  62. Bouckaert, R.; Heled, J.; Kühnert, D.; Vaughan, T.; Wu, C.H.; Xie, D.; Suchard, M.A.; Rambaut, A.; Drummond, A.J. BEAST 2: A software platform for Bayesian evolutionary analysis. PLoS Comput. Biol. 2014, 10, e934. [Google Scholar] [CrossRef] [PubMed]
  63. Rödder, D.; Engler, J.O. Quantitative metrics of overlaps in Grinnellian niches: Advances and possible drawbacks. Glob. Ecol. Biogeogr. 2011, 20, 915–927. [Google Scholar] [CrossRef]
  64. Navarro-Sigüenza, A.G.; Ortíz-Pulido, R.; Peterson, T. Un panorama breve de la historia de la ornitología mexicana. Ornitol. Neotrop. 2008, 19, 367–379. [Google Scholar]
  65. Aiello-Lammens, M.E.; Boria, R.A.; Radosavljevic, A.; Vilela, B.; Anderson, R.P. spThin: An R package for spatial thinning of species occurrence records for use in ecological niche models. Ecography 2015, 38, 541–545. [Google Scholar] [CrossRef]
  66. Soberon, J.; Peterson, A.T. Interpretation of models of fundamental ecological niches and species’ distributional areas. Biodivers. Inform. 2005, 2, 1–10. [Google Scholar] [CrossRef]
  67. Dinerstein, E.; Olson, D.; Joshi, A.; Vynne, C.; Burgess, N.D.; Wikramanayake, E.; Hahn, N.; Palminteri, S.; Hedao, P.; Noss, R.; et al. An ecoregion-based approach to protecting half the terrestrial realm. BioScience 2017, 67, 534–545. [Google Scholar] [CrossRef]
  68. Morrone, J.J. Biogeographical regionalization of the Neotropical region. Zootaxa 2014, 3782, 1–110. [Google Scholar] [CrossRef]
  69. Hijmans, R.J.; Cameron, S.E.; Parra, J.L.; Jones, P.G.; Jarvis, A. Very high-resolution interpolated climate surfaces for global land areas. J. R. Meteorol. Soc. 2005, 25, 1965–1978. [Google Scholar] [CrossRef]
  70. Wei, T.; Simko, V.; Levy, M.; Xie, Y.; Jin, Y.; Zemla, J. Package ‘corrplot’. Statistician 2017, 56, e24. [Google Scholar]
  71. Naimi, B. USDM: Uncertainty analysis for species distribution models. R package version 1.1. RDocumentation 2015, 1, 1–15. [Google Scholar]
  72. Warren, D.L.; Glor, R.E.; Turelli, M. Environmental niche equivalency versus conservatism: Quantitative approaches to niche evolution. Evolution 2008, 62, 2868–2883. [Google Scholar] [CrossRef] [PubMed]
  73. Strubbe, D.; Beauchard, O.; Matthysen, E. Niche conservatism among non-native vertebrates in Europe and North America. Ecography 2015, 38, 321–329. [Google Scholar] [CrossRef]
  74. Broennimann, O.; Fitzpatrick, M.C.; Pearman, P.B.; Petitpierre, B.; Pellissier, L.; Yoccoz, N.G.; Thuiller, W.; Fortin, M.J.; Randin, C.; Zimmermann, N.E.; et al. Measuring ecological niche overlap from occurrence and spatial environmental data. Glob. Ecol. Biogeogr. 2012, 21, 481–497. [Google Scholar] [CrossRef]
  75. Di Cola, V.; Broennimann, O.; Petitpierre, B.; Breiner, F.T.; d’Amen, M.; Randin, C.; Engler, R.; Pottier, J.; Pio, D.; Dubuis, A.; et al. Ecospat: An R package to support spatial analyses and modeling of species niches and distributions. Ecography 2017, 40, 774–787. [Google Scholar] [CrossRef]
  76. Phillips, S.J.; Anderson, R.P.; Schapire, R.E. Maximum entropy modeling of species geographic distributions. Ecol. Modell. 2006, 190, 231–259. [Google Scholar] [CrossRef]
  77. Cobos, M.E.; Peterson, A.T.; Barve, N.; Osorio-Olvera, L. Kuenm: An R package for detailed development of ecological niche models using Maxent. PeerJ 2019, 7, e6281. [Google Scholar] [CrossRef]
  78. Peterson, A.T.; Stewart, A.; Mohamed, K.I.; Araújo, M.B. Shifting global invasive potential of European plants with climate change. PLoS ONE 2008, 3, e2441. [Google Scholar] [CrossRef]
  79. Owens, H.L.; Campbell, L.P.; Dornak, L.L.; Saupe, E.E.; Barve, N.; Soberón, J.; Ingenloff, K.; Lira-Noriega, A.; Hensz, C.M.; Myers, C.E.; et al. Constraints on interpretation of ecological niche models by limited environmental ranges on calibration areas. Ecol. Modell. 2013, 263, 10–18. [Google Scholar] [CrossRef]
  80. Alkishe, A.A.; Peterson, A.T.; Samy, A.M. Climate change influences on the potential geographic distribution of the disease vector tick Ixodes ricinus. PLoS ONE 2017, 12, e0189092. [Google Scholar] [CrossRef]
  81. Castillo-Chora, V.D.J.; Sánchez-González, L.A.; Mastretta-Yanes, A.; Prieto-Torres, D.A.; Navarro-Sigüenza, A.G. Insights into the importance of areas of climatic stability in the evolution and maintenance of avian diversity in the Mesoamerican dry forests. Biol. J. Linn. Soc. 2021, 132, 741–758. [Google Scholar] [CrossRef]
  82. Warren, D.L.; Matzke, N.J.; Cardillo, M.; Baumgartner, J.B.; Beaumont, L.J.; Turelli, M.; Glor, R.E.; Huron, N.A.; Simoes, M.; Iglesias, T.L.; et al. ENMTools 1.0: An R package for comparative ecological biogeography. Ecography 2021, 44, 504–511. [Google Scholar] [CrossRef]
  83. Rodríguez-Robles, J.A.; Jezkova, T.; Leal, M. Genetic structuring in the threatened “Lagartijo del Bosque Seco” (Anolis cooki) from Puerto Rico. Mol. Phylogenet. Evol. 2008, 46, 503–514. [Google Scholar] [CrossRef] [PubMed]
  84. Faria, P.J.; Guedes, N.M.R.; Yamashita, C.; Martuscelli, P.; Miyaki, C.Y. Genetic variation and population structure of the endangered Hyacinth Macaw (Anodorhynchus hyacinhinus): Implications for conservation. Biodivers. Conserv. 2008, 17, 765–779. [Google Scholar] [CrossRef]
  85. García, F.L. Un Enfoque Filogeográfico Para la Conservación de Poblaciones de Ara macao cyanoptera. Master’s Thesis, Instituto de Ecología, A.C., Xalapa, México, 2009. [Google Scholar]
  86. De Almeida, T.R.A.; Presti, F.T.; Cruz, V.P.; Wasko, A.P. Genetic analysis of the endangered Hyacinth Macaw (Anodorhynchus hyacinthinus) based on mitochondrial markers: Different conservation efforts are required for different populations. J. Ornithol. 2019, 160, 711–720. [Google Scholar] [CrossRef]
  87. Schmidt, K.L.; Aardema, M.L.; Amato, G. Genetic analysis reveals strong phylogeographical divergences within the Scarlet Macaw Ara macao. Ibis 2020, 162, 735–748. [Google Scholar] [CrossRef]
  88. Rivera-Arroyo, R.C.; Escalante-Pliego, P.; Aguilar-Torres, D.; Úbeda-Olivas, M.F. Phylogeography of the white-crowned parrot (Pionus senilis). Biota Neotrop. 2023, 22, 1382. [Google Scholar] [CrossRef]
  89. Marín-Togo, M.C.; Monterrubio-Rico, T.C.; Renton, K.; Rubio-Rocha, Y.; Macías-Caballero, C.; Ortega-Rodríguez, J.M.; Cancino-Murillo, R. Reduced current distribution of Psittacidae on the Mexican Pacific coast: Potential impacts of habitat loss and capture for trade. Biodivers. Conserv. 2012, 21, 451–473. [Google Scholar] [CrossRef]
  90. Hendrickson, S.L.; Bleiweiss, R.; Matheus, J.C. Low genetic variability in the geographically widespread Andean condor. Condor 2003, 105, 1–12. [Google Scholar] [CrossRef]
  91. Westemeier, R.L.; Brawn, J.D.; Simpson, S.A.; Esker, T.L.; Jansen, R.W.; Walk, J.W.; Kershner, E.L.; Bouzat, J.L.; Paige, K.N. Tracking the long-term decline and recovery of an isolated population. Science 1998, 282, 1695–1698. [Google Scholar] [CrossRef]
  92. Johnson, J.A.; Bellinger, M.R.; Toepfer, J.E.; Dunn, P. Temporal changes in allele frequencies and low effective population size in greater prairie-chickens. Mol. Ecol. 2004, 13, 2616–2630. [Google Scholar] [CrossRef] [PubMed]
  93. Barrowclough, G.F.; Gutiérrez, R.J.; Groth, J.G. Phylogeography of spotted owl (Strix occidentalis) populations based on mitochondrial DNA sequences: Gene flow, genetic structure, and a novel biogeographic pattern. Evolution 1999, 53, 919–931. [Google Scholar] [CrossRef] [PubMed]
  94. Solórzano, S.; Baker, A.J.; Oyama, K. Conservation priorities for resplendent quetzals based on analysis of mitochondrial DNA control region sequences. Condor 2004, 106, 449–456. [Google Scholar] [CrossRef]
  95. Mock, K.E.; Theimer, T.C.; Rhodes, O.E.; Greenberg, D.L.; Keim, P. Genetic variation across the historical range of the Wild Turkey. Mol. Ecol. 2002, 11, 643–657. [Google Scholar] [CrossRef]
  96. Proudfoot, G.A.; Honeycutt, R.; Slack, R. Mitochondrial DNA variation and phylogeography of the Ferruginous Pygmy-Owl (Glaucidium brasilianum). Conserv. Genet. 2006, 7, 1–12. [Google Scholar] [CrossRef]
  97. Firestone, K.B.; Elphinstone, M.S.; Sherwin, W.B.; Houlden, B.A. Phylogeographical population structure of tiger quolls Dasyurus maculatus (Dasyuridae: Marsupialia), an endangered carnivorous marsupial. Mol. Ecol. 1999, 8, 1613–1625. [Google Scholar] [CrossRef]
  98. Birky, C.W.; Fuerst, P.; Maruyama, T. Organelle gene diversity under migration, mutation, and drift: Equilibrium expectations, approach to equilibrium, effects of heteroplasrnic cells, and comparison to nuclear genes. Genetics 1989, 121, 613–627. [Google Scholar] [CrossRef]
  99. Perrin, N.; Mazalov, V. Local competition, inbreeding, and the evolution of sex-biased dispersal. Am. Nat. 2000, 155, 116–127. [Google Scholar] [CrossRef]
  100. Bonaccorso, E.; Peterson, A.T.; Navarro-Sigüenza, A.G.; Fleischer, R.C. Molecular systematics and evolution of the Cyanocorax jays. Mol. Phylogenet. Evol. 2010, 54, 897–909. [Google Scholar] [CrossRef]
  101. Rivera-Ortiz, F.A.; Contreras-González, A.M.; Soberanes-González, C.A.; Valiente-Banuet, A.; Arizmendi, M.C. Seasonal abundance and breeding chronology of the Military Macaw (Ara militaris) in a semi-arid region of central Mexico. Neotrop. Ornithol. 2008, 19, 255–263. [Google Scholar]
  102. Contreras-González, A.M.; Rivera-Ortiz, F.A.; Soberanes-González, C.; Valiente-Banuet, A.; Arizmendi, M.C. Feeding ecology of Military Macaw (Ara militaris) in a semiarid region of central Mexico. Wilson J. Ornithol. 2009, 121, 384–391. [Google Scholar] [CrossRef]
  103. Barhoum, D.N.; Burns, K.J. Phylogenetic relationships of the Wrentit based on mitochondrial cytochrome b sequences. Condor 2002, 104, 740–749. [Google Scholar] [CrossRef]
  104. Pennington, R.T.; Prado, D.E.; Pendry, C.A. Neotropical seasonally dry forests and Quaternary vegetation changes. J. Biogeogr. 2000, 27, 261–273. [Google Scholar] [CrossRef]
  105. Oswald, J.A.; Steadman, D.W. The changing diversity and distribution of dry forest passerine birds in northwestern Peru since the last ice age. Auk 2015, 132, 836–862. [Google Scholar] [CrossRef]
  106. Pennington, R.T.; Lavin, M.; Prado, D.E.; Pendry, C.A.; Pell, S.K.; Butterworth, C.A. Historical climate change and speciation: Neotropical seasonally dry forest plants show patterns of both Tertiary and Quaternary diversification. Phillos. Trans. R. Soc. 2004, 359, 515–538. [Google Scholar] [CrossRef]
  107. Oswald, J.A.; Overcast, I.; Mauck, W.M., III; Andersen, M.J.; Smith, B.T. Isolation with asymmetric gene flow during the nonsynchronous divergence of dry forest birds. Mol. Ecol. 2017, 26, 1386–1400. [Google Scholar] [CrossRef]
  108. Prado, D.E.; Gibbs, P.E. Patterns of species distributions in the dry seasonal forests of South America. Ann. Mo. Bot. Gard. 1993, 80, 902–927. [Google Scholar] [CrossRef]
  109. Wilkinson, G.S.; Fleming, T.H. Migration and evolution of lesser long-nosed bats Leptonycteris curasoae, inferred from mitochondrial DNA. Mol. Ecol. 1996, 5, 329–339. [Google Scholar] [CrossRef]
  110. Fjeldsâ, J.; Krabbe, N.; Ridgely, R.S. Great Green Macaw Ara ambigua collected in northwest Ecuador, with taxonomic comments on Ara militaris. Bull. Br. Ornithol. Club. 1987, 107, 28–31. [Google Scholar]
  111. Hinkelmann, C.; Schuchmann, K.L. Phylogeny of the hermit hummingbirds (Trochilidae: Phaethornithinae). Stud. Neotrop. 1997, 32, 142–163. [Google Scholar] [CrossRef]
  112. Ferrusquía-Villafranca, I.; Arroyo-Cabrales, J.; Martínez-Hernández, E.; Gama-Castro, J.; Ruiz-Gonzalez, J.; Polaco, O.J.; Johnson, E. Pleistocene mammals of Mexico: A critical review of regional chronofaunas, climate change response and biogeographic provinciality. Quatern. Int. 2010, 217, 53–104. [Google Scholar] [CrossRef]
  113. Sirkin, L. Late Quaternary stratigraphy and environments of the West Mexican coastal plain. Palynology 1985, 9, 3–25. [Google Scholar] [CrossRef]
  114. Cornejo-Romero, A.; Vargas-Mendoza, C.F.; Aguilar-Martínez, G.F.; Medina-Sánchez, J.; Rendón-Aguilar, B.; Valverde, P.L.; Zavala-Hurtado, J.A.; Serrato, A.; Rivas-Arancibia, S.; Pérez-Hernández, M.A.; et al. Alternative glacial-interglacial refugia demographic hypotheses tested on Cephalocereus columna-trajani (Cactaceae) in the intertropical Mexican drylands. PLoS ONE 2017, 12, e0175905. [Google Scholar] [CrossRef]
  115. Cordova, C.E. Lacustrine Change in the Late Quaternary. In The Lakes of the Basin of Mexico: Dynamics of a Lacustrine System and the Evolution of a Civilization; Cordova, C.E., Ed.; Springer: Stillwater, OK, USA, 2022; pp. 123–140. [Google Scholar] [CrossRef]
  116. Arbelaez-Cortes, E.; Navarro-Sigueenza, A.G. Molecular evidence of the taxonomic status of western Mexican populations of Phaethornis longirostris (Aves: Trochilidae). Zootaxa 2013, 3716, 81–97. [Google Scholar] [CrossRef] [PubMed]
  117. Perini, C.R.; Sosa, V.I.; Koda, V.E.; Silva, H.; Risso, A.A.; Vasconcelos, W.N.; Gonçalves, C.F.; Ugalde, G.A.; Machado, D.N.; Bevilacqua, C.B.; et al. Genetic structure of two Plusiinae species suggests recent expansion of Chrysodeixis includens in the American continent. Agric. For. Entomol. 2021, 23, 250–260. [Google Scholar] [CrossRef]
  118. Luo, Y.; Li, S. Global expansion of a solitary-social tropical spitting spider shaped by multiple long-distance dispersals. Ecography 2023, 3, e06632. [Google Scholar] [CrossRef]
  119. Moritz, C. Defining ‘evolutionary significant units’ for conservation. Trends Ecol. Evol. 1994, 9, 373–375. [Google Scholar] [CrossRef]
  120. Moritz, C. Applications of mitochondrial DNA analysis in conservation: Critical review. Mol. Ecol. 1994, 3, 401–411. [Google Scholar] [CrossRef]
  121. Frankham, R.; Ballou, J.D.; Briscoe, D.A. Introduction to Conservation Genetics; Cambridge University Press: Cambridge, UK, 2010; pp. 161–181. [Google Scholar]
  122. Avise, J.C.; Ball, M.R. Principles of geneological concordance in species concepts and biological taxonomy. In Oxford Surveys in Evolutionary Biology; Futuyma, D.J., Antonovics, J., Eds.; Oxford University Press: Oxford, UK, 1990; pp. 45–67. [Google Scholar]
Figure 1. Geographic distribution and phylogenetics of the Military Macaw. (A) mtDNA phylogenetic tree based on a Cyt-b gene (>300 bp) concatenated dataset. Numbers in branches indicate nodal support based on Bayesian posterior probabilities and strict consensus of maximum-likelihood. Numbers above branches indicate divergence time in red. (B) Geographic distribution in the natural range and distribution of Cyt-b haplotypes in the subspecies (A. m. militaris, A. m. bolivianus, and A. m. mexicanus). To make reading the figure easier, the haplotypes have been grouped according to position in median-joining network of Figure 1C. The black dots represent the sample populations in the distribution range of Military Macaw. Dotted lines depict both the accessible (or M) and projection areas for the models and the niche divergence analyses for the two evolutionary lineages herein assessed. Brown shading indicates areas at least 1000 m above sea level (m.a.s.l). (C) Haplotype network. Colors correspond to the vertical bar in the phylogenetic tree. The size of each circle is proportional to the corresponding haplotype frequency. Red circles inside the branches indicate missing intermediates; the size of each branch is proportional to the mutational steps.
Diversity 15 01035 g001
Figure 2. Equivalence and similarity test in the environmental space for the two herein-identified lineages of Military Macaw. (A) A Principal Component Analysis (PCA) of ecological niche for the lineages and the corresponding values of variables contribution. (B) Dark shading in the upper right plots depicts the density of the occurrences of each lineage by cell in the ecological space; green shading is the density of the occurrences of A. m. militaris, while the red color is the density of the occurrences of A. m. mexicanus. The solid and dashed lines indicate 100 and 50% of the available (background) environment, respectively. (C) Plot of the equivalence test comparing the ecological niche of two lineages. (D) Plots of the similarity test comparing the ecological niche of the two lineages in both directions (A. m. mexicanus vs. A. m. militaris/A. m. bolivianus and vice versa). We only present values for the D metrics for both tests. In all plots, the arrow with a red diamond represents the observed similarity value between niches; the gray columns represent 1000 randomly simulated expected values. The p-value is shown in each plot (n.s. = non-significant).
Diversity 15 01035 g002
Figure 3. Ecological niche model projected onto the geographic areas for the two herein identified lineages of Military Macaw: A. m. mexicanus (blue) and A. m. militaris/A. m. bolivianus (orange). Upper maps depict suitability areas for each lineage under recent climatic conditions; crossed lines and dotted red circles depict regions of historical climatic stability. Lower maps depict the predicted regions of historical distribution for climatic niches across four time periods, and the aloprediction areas (darker blue and darker orange) between lineages across the Late Pleistocene (LIG and LGM), the Holocene and the Recent.
Diversity 15 01035 g003
Table 1. Sample sites of the Military Macaw (Ara militaris) in North America and South America.
Regions
(Subspecies)
Locality
(State/Department)
Abbreviation
LocationAltitude
(m)
Precipitation
(mm)
Temperature
(°C)
Vegetation
Mexico
(A. m. mexicanus)
La Sierrita (Sonora)
LS º
26° 52′ 48″ N
108° 34′ 12″ W
800–12006022Tropical
deciduous forest
Cósala (Sinaloa)
C º
24° 24′ 44″ N
106° 41′ 22″ W
500–180025024Tropical
deciduous forest
Mirador del Águia
(Nayarit)
MA º
21° 30′ 28″ N
104° 55′ 47″ W
600–1200112121Tropical subdeciduous forest
Barranca del Oro (Jalisco)
T +
21° 50′ 53″ N
105° 07′ 44″ O
600–800100028Tropical
deciduous forest
Quimichis (Nayarit)
Q +
22° 15′ 49″ N
105° 34′ 55″O
100–300120026Tropical
deciduous forest
Los Mazos (Jalisco)
LM +
19° 33′ 57″ N
103° 30′ 25″ O
1400–18007821Tropical
deciduous forest
Las Peñas (Jalisco)
LP +
19° 41′ 58″ N
103° 26′ 41″ O
1500–180069027Tropical
deciduous forest
Volcán de Colima (Jalisco)
VC +
19° 28′ 15″ N
103° 56′ 19″ O
700–220080027Tropical subdeciduous forest
Bahia Balderas (Jalisco)
BB +
20° 34′ 10″ N
104° 59′ 22″ O
10–60093028Tropical subdeciduous forest
El Tuito (Jalisco)
ET º
20° 17′ 35″ N
105° 23′ 6.4″ W
0–40080026Tropical subdeciduous forest
Sta. Tecomavaca (Oaxaca)
ST º
17° 51′ 43″ N
97° 02′ 40″ W
660–82040022Tropical
deciduous forest
El Cielo (Tamaulipas)
EC º
23° 04′ 22″ N
99° 09′ 24″ W
700–1400180018Tropical subdeciduous forest
Sta. Cocos (Querétaro)
SC º
21° 18′ 37″ N
99° 40′ 4″ W
700–180040022Tropical
deciduous forest
Colombia
(A. m. militaris)
Sta. Marta (La Magdalena)
SM +
11° 9′ 41″ N
73° 42′ 26″ O
200–800100024Tropical
deciduous forest
Bogotá * (Cundinamarca)
B +
06° 17′ 20″ N
74° 37′ 36″ O
1200200025Tropical subdeciduous forest
Peru
(A. m. militaris)
Loreta (Loreto)
L +
04° 11′ 35″ S
74° 12′ 24″ O
100–300400025Tropical subdeciduous forest
Bolivia
(A. m. bolivianus)
Sara (Santa Cruz)
S +
14° 48′ 41″ S
62° 07′ 24″ O
200–400150027Tropical subdeciduous forest
* Extirpated population. + Samples obtained from museum collections. º Samples obtained directly in the field.
Table 2. Mitochondrial DNA diversity indices for A. militaris populations, including nucleotide (π) and haplotype (h) diversities, as well as Tajima´s D, and Fu´s Fs neutrality test indexes.
SubspeciesPopulations
Abbreviation
LocalityNPCyt-b HaplotypesπhDFs
A. m. mexicanusMexico-Sierra Madre Occidental/Sierra Madre del Sur 1
SMOc1
LS11Hap5
Mexico-Sierra Madre Occidental/Sierra Madre del Sur 2
SMOc2
C168Hap 15, Hap 23, Hap 24, Hap 25, Hap 26, Hap 27, Hap 28, Hap 29.0.00220.7000−1.6238−4.5029
Mexico-Sierra Madre Occidental/Sierra Madre del Sur 3 SMOc3Q, MA65Hap 12, Hap 13, Hap 16,
Hap 17, Hap 23.
0.00170.9333−1.23315.8783
Mexico-Sierra Madre Occidental/Sierra Madre del Sur 4 SMOc4LM, LP, VC139Hap 6, Hap 7, Hap 9, Hap 17, Hap 18, Hap 19, Hap 20, Hap 21, Hap 22.0.00180.92310.6005−1.6903
Mexico-Sierra Madre Occidental/Sierra Madre del Sur 5 SMOc5BB, ET, BO83Hap 8, Hap 17, Hap 23.0.00110.71430.333522.7426
Mexico-Sierra Madre Occidental/Sierra Madre del Sur 6 SMOc6ST44Hap 10, Hap 11,
Hap 14, Hap 23.
0.00400.97360.6501−1.6221
Mexico-Sierra Madre Oriental 1
SMOr1
SC22Hap 1, Hap 3.0.00510.98430.00001.0986
Mexico-Sierra Madre Oriental 2
SMOr2
EC33Hap 2, Hap 3, Hap 4.0.00340.98010.0000−0.6933
Total subspecies5335290.0024 ± 00.00020.7760 ± 0.0417
A. m. militarisColombia-1
C1
SM22Hap 39, Hap 40.0.00450.97650.00001.3862
Colombia-2 *
C2
B33Hap 30, Hap 31, Hap 38.0.02840.98560.00000.7032
Peru-1
P1
L44Hap 32, Hap 37, Hap 40, Hap 41.0.01470.9887−0.3144−0.5683
Total subspecies9980.0158 ± 0.00840.9836 ± 0.0032
A. m. bolivianusBolivia-1
B1
S54Hap 33, Hap 34, Hap 35, Hap 36.0.00970.9000−0.84294.7699
Overall6748410.0063 ± 0.00070.8382 ± 0.0257
N = individuals sequenced, P = number of haplotypes, Neutrality statistics Tajima’s D, and Fu’s Fs are bold when significant at a = 0.05. Values ± SD, * Extirpated population.
Table 3. Spatial analyses of molecular variance (SAMOVA).
Source of VariationPercentage of Variation
Among groups *45.33FCT = 0.8071
Among population within groups12.40FSC = 0.2208
Within populations42.26FST = 0.7525
* Group 1 (SMOr1 and SMOr2), Group 2 (SMOc1 and SMOc2), group 3 (SMOc3, SMOc4, SMOc5, and SMOc6), and group 4 (C1, C2, P1, and B1). SMOr1 to 2 = Mexico-Sierra Madre Oriental, SMOc1 to 6 = Mexico-Sierra Madre Occidental/Sierra Madre del Sur. C1 to 2 = Colombia, P1 = Peru, and B1 = Bolovia.
Table 4. Pair-wise comparison of FST values between the 12 populations of A. militaris.
SubspeciesA. m. mexicanusA. m. miliatris
A. m. mexicanusPopulationsSMOc1SMOc2SMOc3SMOc4SMOc5SMOc6SMOr1SMOr2C1C2 +P1
SMOc1
SMOc20.0606
SMOc30.13970.0146
SMOc40.09860.00080.8828
SMOc50.30080.00010.99900.4775
SMOc60.20020.00090.51750.75680.9990
SMOr10.35940.00970.04290.02630.99900.0634
SMOr20.24220.00090.00870.00390.98240.01660.6943
A. m. miliatrisC10.34280.00680.03410.01750.00970.04980.33390.0869
C2 +0.99900.00580.03510.00680.00190.12980.40130.41110.4111
P10.58690.07050.00580.00190.14880.05850.34470.05370.65230.0771
A. m. bolivianusB10.33890.01870.00480.01150.05400.01950.04300.01760.04300.01950.0127
+ Extirpated population. FST (Bonferroni correction p < 0.05) = those with significant differentiation are in bold print. SMOc1 to 6 = Mexico-Sierra Madre Occidental/Sierra Madre del Sur, SMOr1 to 2 = Mexico-Sierra Madre Oriental. C1 to 2 = Colombia, P1 = Peru, and B1 = Bolovia.
Disclaimer/Publisher’s Note: The statements, opinions and data contained in all publications are solely those of the individual author(s) and contributor(s) and not of MDPI and/or the editor(s). MDPI and/or the editor(s) disclaim responsibility for any injury to people or property resulting from any ideas, methods, instructions or products referred to in the content.

