Article

Biogeographic Patterns and Richness of the Meconopsis Species and Their Influence Factors across the Pan-Himalaya and Adjacent Regions

1
Chengdu Institute of Biology, Chinese Academy of Sciences, Chengdu 610041, China
2
College of Life Sciences, University of Chinese Academy of Sciences, Beijing 100049, China
3
Mangkang Biodiversity and Ecological Station, Tibet Ecological Safety Monitor Network, Changdu 854500, China
4
Earth Sciences College, Chengdu University of Technology, Chengdu 610059, China
5
Independent Researcher, 99 Old Nehru Colony, Dehradun 248001, India
6
Institute of Tibetan Plateau Research, Chinese Academy of Sciences, Beijing 100101, China
7
College of Resources and Environment, Aba Teachers University, Wenchuan 623002, China
8
Key Laboratory of Remote Sensing of Gansu Province, Northwest Institute of Eco-Environment and Resources, Chinese Academy of Sciences, Lanzhou 730000, China
9
Chengdu Botanical Garden, Chengdu 610503, China
*
Author to whom correspondence should be addressed.
These authors contributed equally to this work.
Diversity 2022, 14(8), 661; https://doi.org/10.3390/d14080661
Submission received: 22 June 2022 / Revised: 9 August 2022 / Accepted: 9 August 2022 / Published: 16 August 2022
(This article belongs to the Special Issue Mountain Biodiversity, Ecosystem Functioning and Services)

Abstract

:
Understanding the potential habitat of Meconopsis, their species richness distribution patterns, and their influencing factors are critical for the conservation and rational exploitation of this valuable resource. In this study, we applied the MaxEnt model to predict their potential distribution, mapped the distribution pattern of species richness, and analyzed the variation of species richness along environmental gradients. Finally, we calculated the landscape fragmentation indices between the five subregions. Our results found that: (1) the medium- and high-suitable habitats of Meconopsis were mainly distributed in the central and eastern Himalaya, the Hengduan Mountains, and the southeast edge of the plateau platform, with suitable habitats ranged from 3200 m to 4300 m, whose most important factor is precipitation of the warmest quarter; (2) species richness showed a hump pattern along the environmental gradients except for longitude that showed an increasing trend, mainly concentrated in the south and southeast; and (3) the subregions are in the descending order of species richness: plateau platform, Hengduan Mountains, central, eastern, and western Himalaya; the highest and lowest degree of landscape fragmentation were in the western Himalaya and eastern Himalaya, respectively. Our study provides a theoretical background for the conservation and sustainable exploitation of Meconopsis in the wild.

1. Introduction

Climate change is an indisputable reality today, evidenced by glacial melting from mountain areas, greening of alpine tundra or arctic, upward shifting of alpine tree lines, and shrub encroachment into alpine grassland [1,2,3]. Many scientists believe that mountains act as early warning systems and can provide direct evidence to understand potential changes in the lowland environment [4,5]. Mountains around the world vary in terms of shape, extension, elevation, climate change impact, and biodiversity because of the differences in their geographic locations coupled with the complex region-specific hydrothermal condition [5,6]. Most studies have shown that the Qinghai-Tibet Plateau sensu lato (QTPsl) is not a natural tectonic association, but rather comprises a “plateau platform” (i.e., Qinghai-Tibet Plateau sensu stricto; QTPss) [7,8], the Himalaya, and the Hengduan Mountains [9,10]. Together these three regions are also referred to as the pan-Himalayan region [10,11] which boasts of complex topography, diverse geomorphological types, a wide altitudinal range, and different soil textures and geological conditions. This region, where one can observe diverse habitats within a short distance, supports a variety of endemic and endangered species [11,12]. The pan-Himalayan region is an important biodiversity hotspot with the world’s highest diversity of alpine plants, attracting extensive scientific attentions [10,13,14].
Biodiversity, especially plant diversity, plays an important role in regulating climate, stabilizing the structure and functions of ecosystems, and providing ecosystem services for humans [15,16]. However, this diversity of plant resources has been constantly threatened by climate change and excessive anthropogenic disturbance since the last century [17,18]. As one of the most severe threats to global biodiversity, climate change has interfered with the composition, structure, and functioning of many mountainous ecosystems, resulting in an ecosystem imbalance that eventually affects human well-being [19,20,21]. Climate variables can determine the geographic distribution patterns of plant species [22] in addition to several non-climatic factors, such as topography, soil types, and land use, which equally impact species distribution [23]. The geographical distribution of alpine plants, in particular, is sensitive to the interaction between climate and topography [11,24]. Furthermore, human disturbances in mountainous landscapes not only accelerate climate change but also cause severe habitat loss and fragmentation and support the invasion of alien species, which are often directly or indirectly related to the loss of biodiversity [18,25,26,27]. Many native plant habitats have suffered habitat loss and fragmentation [23,25,27] that leads to the creation of isolated habitat patches resulting in an eventual decline in species viability across the landscape and ultimately reduction of species diversity across the ecosystem [18,28]. Numerous studies have shown the negative impact of fragmentation at the landscape scale on species diversity; however, the ecological effects of fragmentation at larger macroscopic scales are not clearly demonstrated [29,30]. Habitat loss and fragmentation are the primary drivers for the extinction of plant species [31]. Maintaining plant diversity while ensuring their sustainable utilization for human well-being is a common global concern [32]. Species richness is a fundamental scale for measuring regional diversity and the basis for constructing evolutionary and ecological models and conservation strategies [33]. Species diversity at the local scale is influenced by habitat heterogeneity such as geographic differences, climate, topography (elevation, slope, slope direction, etc.), and latitude and longitude, among other factors [34,35]. Thus, understanding the geographic distribution patterns of species richness in a particular area is of great scientific significance for the conservation, development, and sustainable utilization of plant resources.
The genus Meconopsis (Himalayan or blue poppies) belongs to the Papaveraceae family and contains over 70 species [36]. These plants are mainly localized in the Qinghai-Tibet Plateau, Hengduan Mountains, and Himalaya between the elevational range of 2000 m to 5800 m, where habitat changes from temperate forests to alpine meadows to screes and nival zones [37,38]. The East Himalaya-Hengduan Mountains region is the center of diversity for Meconopsis genus. Meconopsis plays a unique role in the alpine ecosystem. It is an important component of the regional biodiversity and participates in primary production, which is critical for ecosystem functioning [39]. Meconopsis is well-known for its colorful, attractive, and gracefully postured flower with high ornamental value and is widely used in horticultural gardening [40]. Species of this genus are symbols of tenacious vitalities since they bloom with beautiful flowers despite the extremely cold and harsh environment, inspiring those who live in the same extreme conditions [41]. These flowers are often shown in frescoes and thangkas, being closely related to Tibetan Buddhism, being the prototype of the ubala flower held by the Green Tara for relieving suffering [42]. Meconopsis is valued for its medicinal properties with a long clinical history in China and other Asian countries. The medicinal properties of the genus were first recorded in the Tibetan medicine book Yue Wang Yao Zhen. Famous masterpieces of traditional Tibetan herbal medicine such as The Four Medical Tantras and Jing Zhu Materia Medica have described the use of Meconopsis for its anti-inflammatory or analgesic properties [41]. For instance, the flowers or whole plant of M. integrifolia can be used for curing hepatitis, pneumonia, liver heat, lung heat, and edema [41]. Recently, a variety of isoquinoline alkaloids with bioactivities have been isolated from Meconopsis, which partly explains its unique therapeutic effects [41]. However, only a few species of this genus have been cultivated for floriculture successfully in a controlled environment [41,43]. With the development of the pharmaceutical economy in these regions, overexploitation and anthropogenic habitat destruction are increasingly threatening the survival of many wild Meconopsis species, and some Meconopsis species have been placed under protection by law [41,42]. Hence, it is of great necessity to map the habitat distribution and ensure the sustainable development of Meconopsis from both natural and social perspectives for their habitat conservation and sustainable development.
Predicting the potential species distribution is a significant step toward habitat protection, and the species distribution model (SDM) has become one of the most widely used tools for simulating the potential distribution of organisms [44,45]. The basic principle of SDM is to correlate current species distribution with corresponding environmental variables to estimate the ecological requirements of a species based on ecological niches, thus predicting the suitable habitat [46,47]. The MaxEnt model is the most widely used among the many SDMs because it not only provides stable and reliable prediction results even with small sample data sizes but can work with presence-only data unlike some other models [42,48,49]. Due to the high prediction accuracy, it has been widely used in studies on the spatial distribution of species in response to climate change [9], suitable planting areas for important economic crops, and priority conservation areas for endangered and rare species [50,51,52]. The screening of suitable habitats and identifying priority conservation areas is critical for habitat management. However, to develop effective landscape management plans, the role of landscape fragmentation in determining the distribution and survival of species cannot be ignored.
Landscape fragmentation is the process by which the surface of a landscape is transformed from a regular homogeneous entity into smaller, complex, and poorly connected patches, mainly as a result of human activities and environmental disturbances [53]. The landscape index can reflect the landscape information well and is a common method to study landscape fragmentation quantitatively. Landscape indices are generally calculated using FragStats (Fragment Statistic), a software program for calculating indices of different types of landscape patterns in classified map patterns or patch mosaics, and analysis of spatial patterns for quantifying landscape structure (i.e., composition and configuration) [54]. It offers a comprehensive choice for the calculation of landscape pattern indices, and three levels (individual patch, patch class, and landscape) of the landscape index can be obtained after the calculation [54]. It is of practical significance to clarify the relationship between landscape pattern and species richness for the conservation and sustainable development of diversity.
In this study, we used MaxEnt to predict the potential distribution pattern of Meconopsis and used regression analysis to explore the geospatial pattern of species richness for Meconopsis in the pan-Himalaya and its adjacent regions. In addition, we divided the study area into five subregions and used landscape index as a variable to measure landscape fragmentation, and compared the species richness of Meconopsis in each subregion (Figure 1). This paper aimed to: (1) predict the potential distribution of Meconopsis and determine the key factors affecting the distribution of these species in the pan-Himalaya and adjacent regions; (2) clarify the species richness pattern of Meconopsis and analyze the distribution characteristics of species richness under different altitude, latitude and longitude, and other topographical factors (aspect and slope); and (3) assess the degree of landscape fragmentation and species richness Meconopsis in five subregions. The results will contribute to identifying the appropriate geographical space available for Meconopsis species and help in ensuring sustainable utilization and management of the genus.

2. Materials and Methods
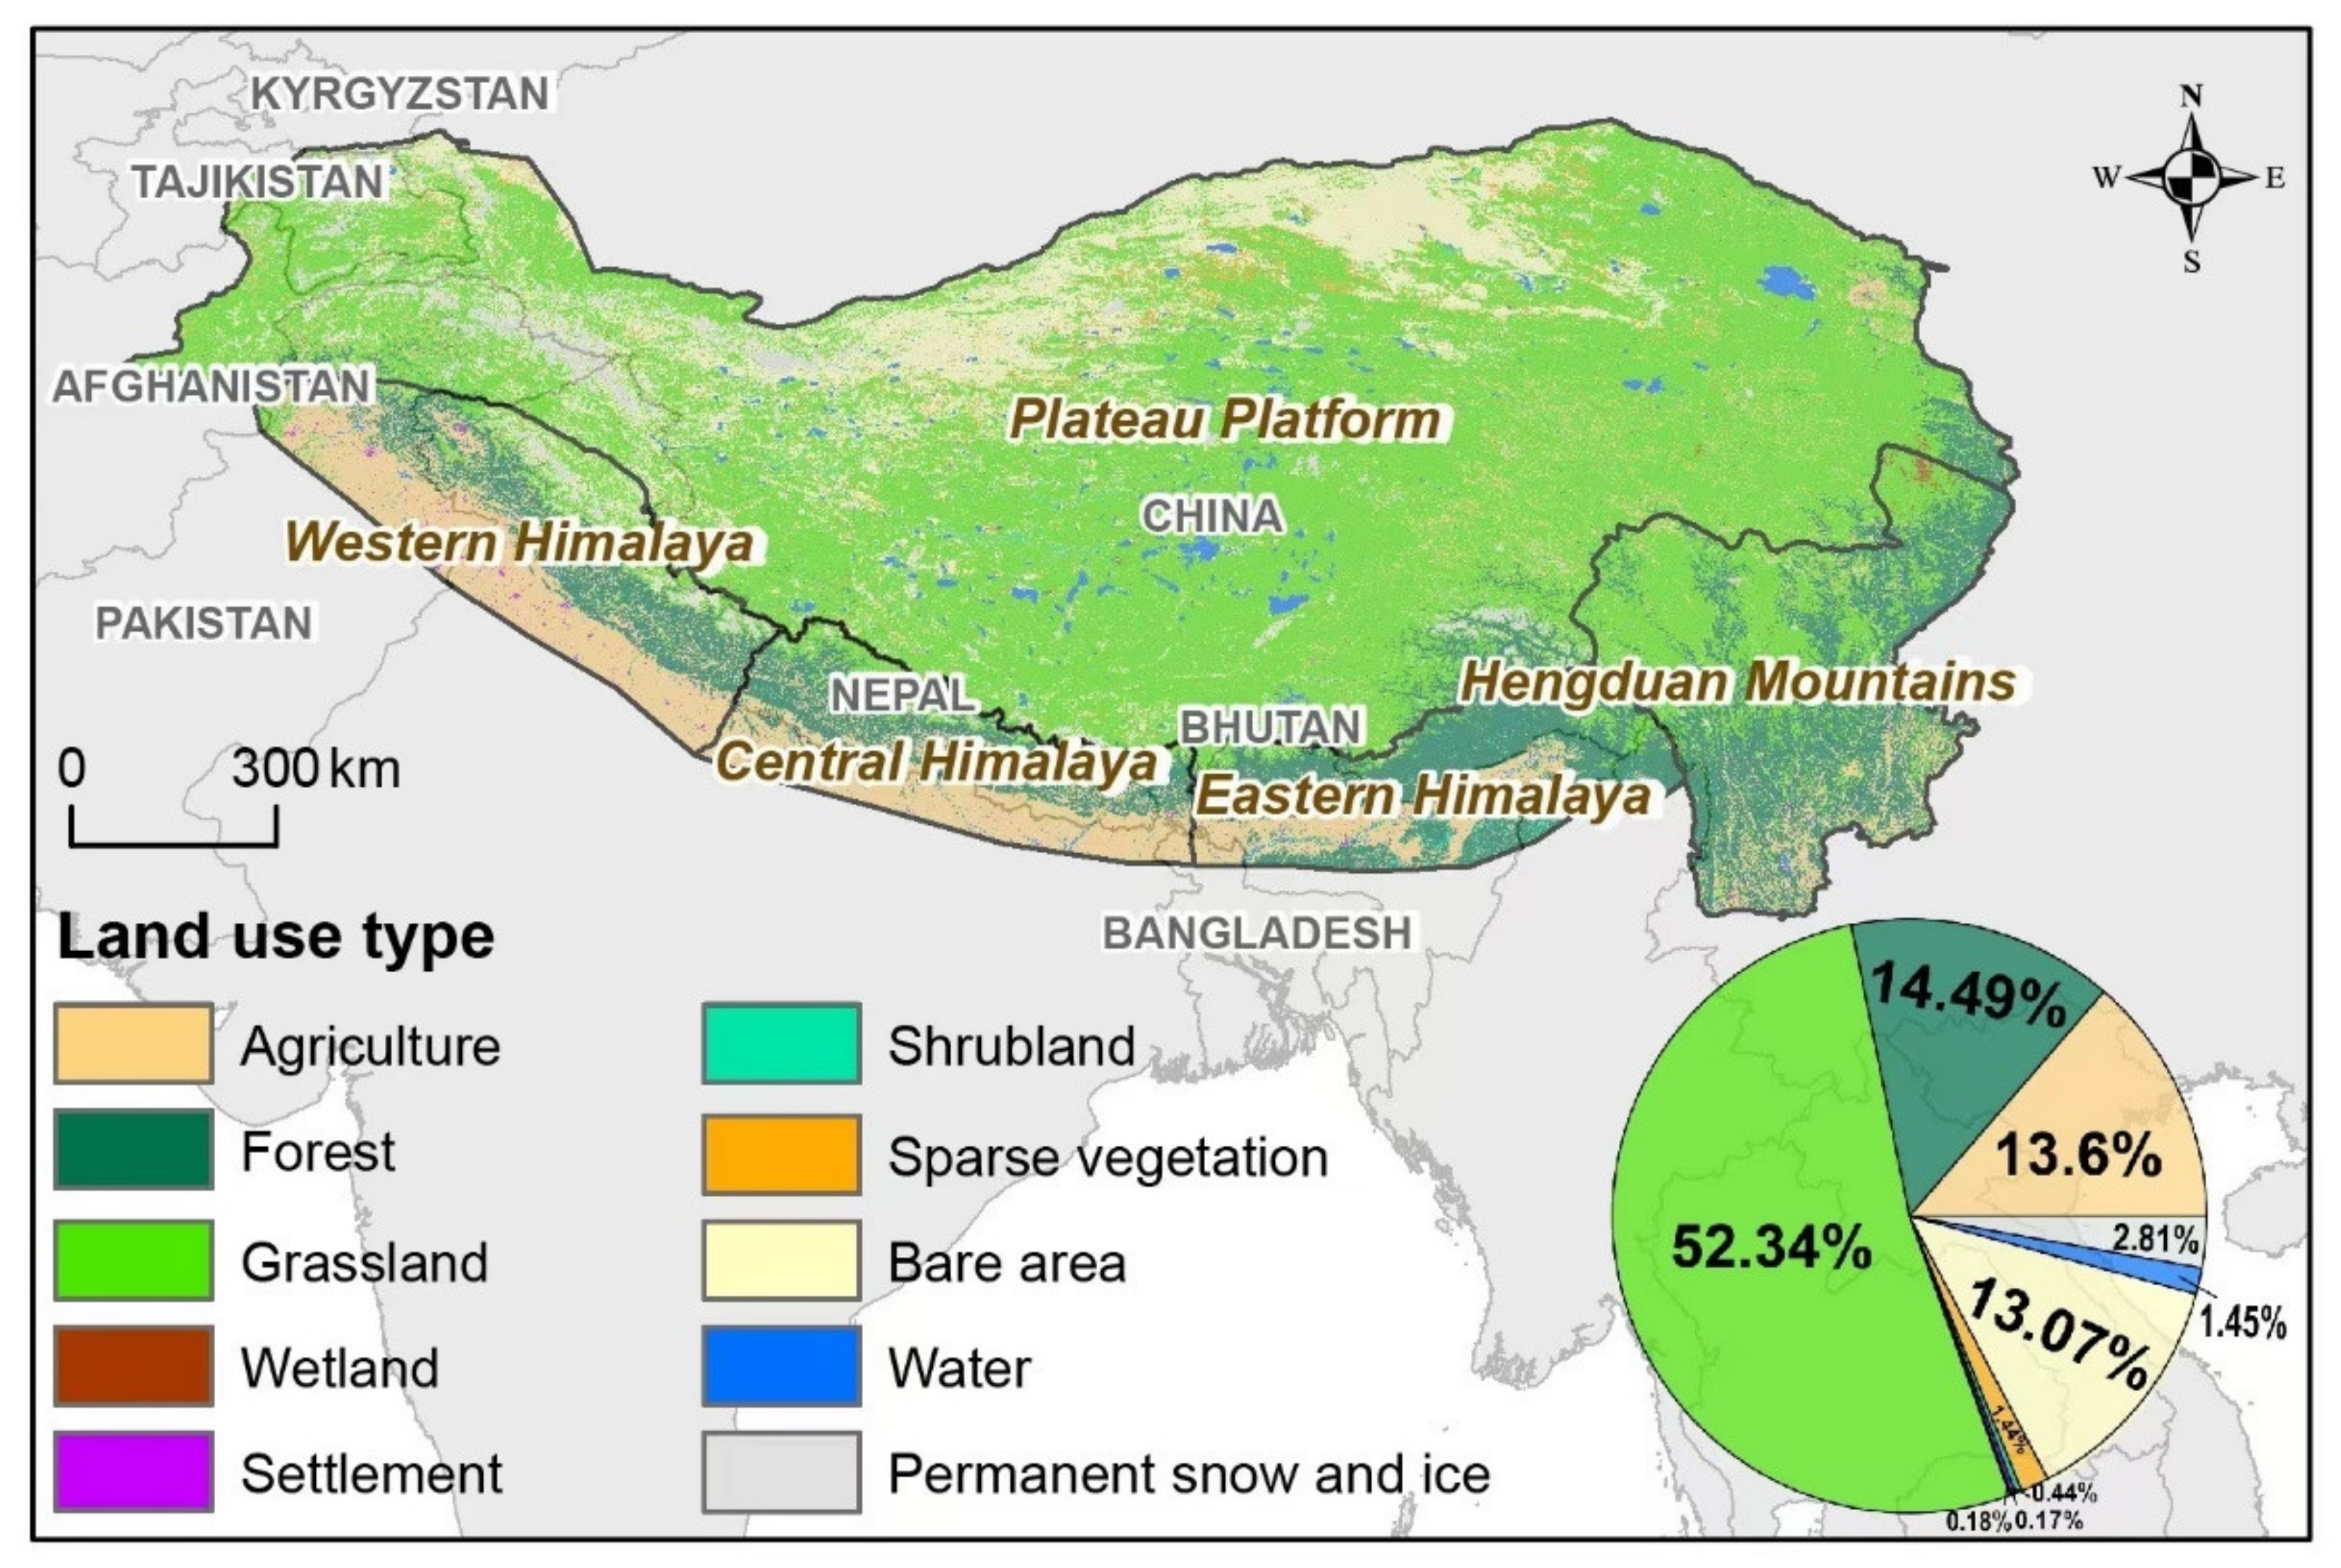
2.1. Study Area

The study area lies between 68°04′00″~104°40′00″ E and 27°25′30″~40°08′00″ N (Figure 2), which extends from the southern margin of the Himalaya to the northern margin of the Kunlun and Qilian Mountains, and the Pamirs Plateau and Karakorum Mountains in the west to the Hengduan Mountains in the east [55]. This area has the highest elevation (more than 4000 m above sea level) and diverse topography, which support a variety of vegetation types at different elevations. From low to high elevations, these vegetation types include dry and hot river valley scrubs, broadleaved forests, mixed coniferous broadleaved forests, coniferous forests, shrubs, meadows, cold subnival belts, and nival belts (glaciers). This region harbors the world’s most species-rich temperate alpine flora driven by orogenetic movements and climate change (monsoon intensification) [56]. It is currently home to approximately 12,000 species of vascular plants belonging to 1500 genera, of which more than 20% are endemic [57]. The mountain region is a diversity center for many species-rich genera, such as rhododendron, gentiana, saussurea, and pedicularis, all of which contain numerous endemic species [14]. We divided the entire study area into five subregions based on the boundaries of the Qinghai-Tibet Plateau, Hengduan Mountains, and Hindu-Kush Himalaya: plateau platform, Hengduan Mountains, eastern Himalaya, central Himalaya, and western Himalaya (Figure 2) [10,11,55]. Of these, the alpine plant biota in Hengduan Mountains is the richest [56].

2.2. Data Sources and Preprocessing

2.2.1. Species Occurrence Data

We collected the occurrence data for Meconopsis, M. integrifolia, M. horridula, M. racemosa, and M. punicea from the following three sources: (1) Chinese Virtual Herbarium (CVH, http://www.cvh.ac.cn/; accessed on 22 December 2021), (2) Global Biodiversity Information Facility (GBIF.org, https://www.gbif.org/; accessed on 22 December 2021), and (3) published literature (China National Knowledge Infrastructure, CNKI, https://www.cnki.net/; Web of Science, https://www.webofscience.com/; accessed on 22 December 2021). All data points were carefully evaluated to exclude duplicate data points and then validated via Google Earth to eliminate possible errors; finally, ArcGIS 10.8 was used to remove points that were not in the study region. We also ensured that the selected presence data points were evenly distributed throughout the study area to avoid sampling bias. Following this selection and elimination criteria, the selected presence locations of each species involved in our study are as follows: Meconopsis (1445), M. integrifolia (296), M. horridula (304), M. racemosa (111), and M. punicea (90) (Figure 2, Table S1).

2.2.2. Bioclimatic and Topographic Data

Bioclimatic data used for the study included 19 bioclimatic variables with the spatial resolution of 30 arc-seconds (~1 km at the equator) representing current climatic conditions (average for 1950–2000) [45], obtained from the WorldClim dataset (https://www.worldclim.org; accessed on 5 January 2022). Besides, three topographic variables (elevation, slope, and aspect) derived from digital elevation model (DEM) data downloaded from WorldClim were also used in the study. To improve the prediction accuracy by eliminating multicollinearity, we performed a Pearson correlation analysis on all environmental variables and retained the environmental factors with low correlation coefficients (|r| < 0.8) [58]. Among the environmental factors with high correlation coefficients (|r| > 0.8), we retained only one factor of the two variables [58]. Finally, a total of 11 environmental variables, including 8 bioclimatic variables and 3 topographic variables, were obtained to simulate the current potential habitat of Meconopsis (Table 1).

2.2.3. Land Type Data

ESA CCI-LC land use/cover data (300 m spatial resolution, 1992–2015) were downloaded from the European space agency (http://maps.elie.ucl.ac.be/CCI/viewer/; accessed on 11 January 2022). The ESA data (including 22 categories) were reclassified into 10 categories: agriculture, forest, grassland, wetland, settlement, shrubland, sparse vegetation, bare area, water, and permanent snow and ice (Figure 3).

2.3. Methods

2.3.1. MaxEnt Modeling

MaxEnt is a popular open-access species distribution model. It employs the maximum entropy algorithm and species occurrence points to predict the probability of species occurrence in potential distribution areas. In the study, we used MaxEnt 3.4.4 to model the current habitat distribution of typical Meconopsis species and the whole genus. Species occurrence data were divided into two data sets, 75% of total occurrence records were used for training the model, while the remaining 25% were used for validating the model. The number of iterations to run the algorithm is set to 1000 and the model was repeated for 10 runs, which allows adequate time for the model to converge [59], and the rest of the settings were the default settings.
Receiver operating characteristic (ROC) analysis was used to calibrate and validate the robustness of the evaluation of the MaxEnt model [58]. The area under the curve (AUC) of the ROC curve was used to estimate the model performance, which varies from 0 to 1 and is a diagnostic evaluation index with high recognition at present. Generally, the model performance can be categorized according to the value of AUC as fair (0.6–0.7), good (0.7–0.8), very good (0.8–0.9), and excellent (>0.9) [58]. A jackknife test was applied to identify variables that made a significant contribution to model output. The results of this test showed the training gains of each variable when the model was run in isolation and was compared with the training gains of all variables. Additionally, species response curves were created to explore the relationships between the probability of occurrence and environmental variables.
A threshold value of 25% was set based on the logistic output from the Maxent model, below which the probability of species occurring can be considered almost negligible. The final suitable habitat predictions were regrouped into three classes: low suitable (25–50%), medium suitable (50–75%), high suitable (>75%), and the values below 25% as nonsuitable.

2.3.2. Spatial Pattern Distribution of Species Richness

A total of 62 Meconopsis species were included in this study, which represents the species richness of Meconopsis genus in the study area. The species distribution pattern was affected by different spatial scales or areas, and to eliminate their influence, when calculating the species richness, the fishnet tool was used to divide the study area according to the equal area grid of 50 km × 50 km, and a total of 1314 grids were obtained. Then, the species distribution points of Meconopsis were associated with the grids, and the number of species in each equal-area grid was counted based on the actual recorded points of Meconopsis, and this value was taken as the species richness value of each grid. Finally, the species richness was divided into 15 levels using the classification function of ArcGIS 10.8, and the spatial pattern of species richness was visualized.

2.3.3. Distribution Pattern of Species Richness along Environmental Gradients

We extracted the topographic factor data of 1445 occurrence data points for 62 species of the genus Meconopsis in the study area, including elevation, slope, and aspect, and explored the relationship among topographic factors, longitude and latitude, and species richness. In this study, elevation was divided into 32 bands, each with an interval of 100 m, and the species richness was counted according to the altitudinal band. In terms of slope, aspect, longitude, and latitude, we divided them into 30, 36, 33, and 14 bands at 1° intervals, and calculated the species richness of each band in turn. The influence of environmental factors on Meconopsis plant species richness geospatial patterns were determined by running polynomial regression or nonlinear regression (GaussMod) models.

2.3.4. Landscape Fragmentation

Four landscape indices were used to measure landscape fragmentation in this paper (Table 2). Based on the reclassified land cover data grid-by-grid, the landscape indices in the grid based on the landscape scale were calculated, the spatial data were processed in ArcGIS 10.8, and the landscape indices were calculated by software Fragstats 4.2.1.

3. Results

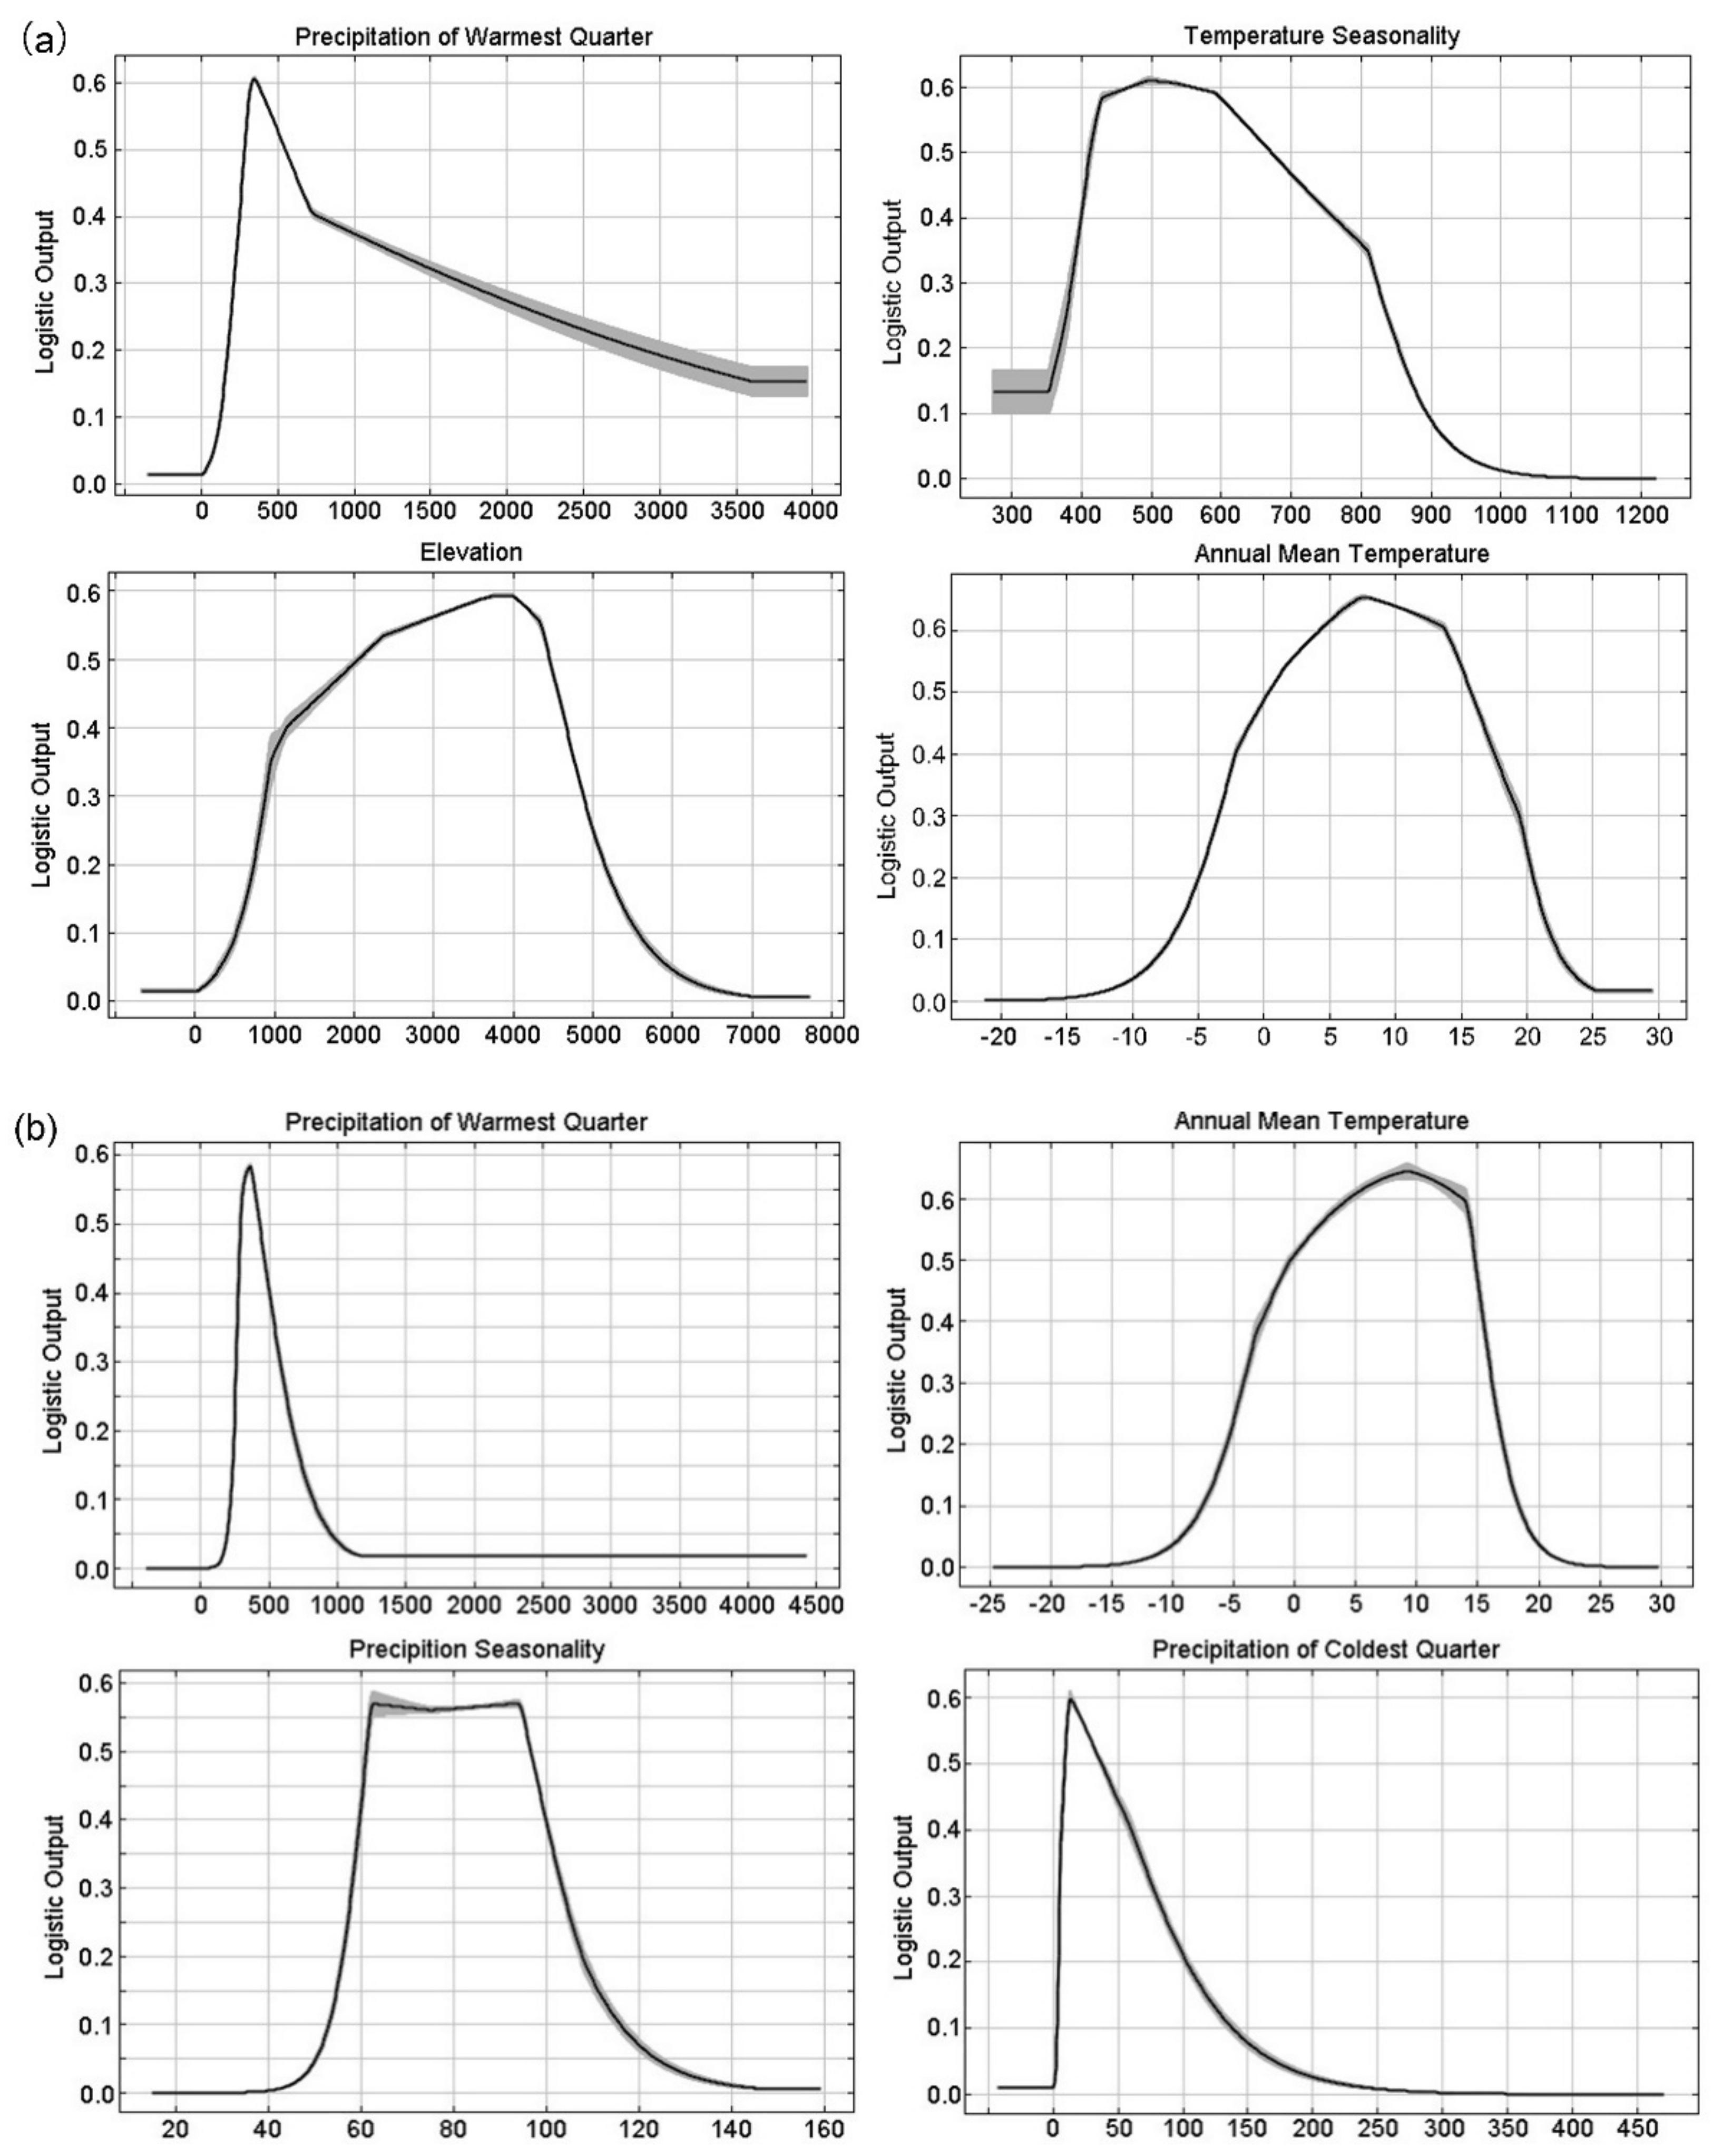
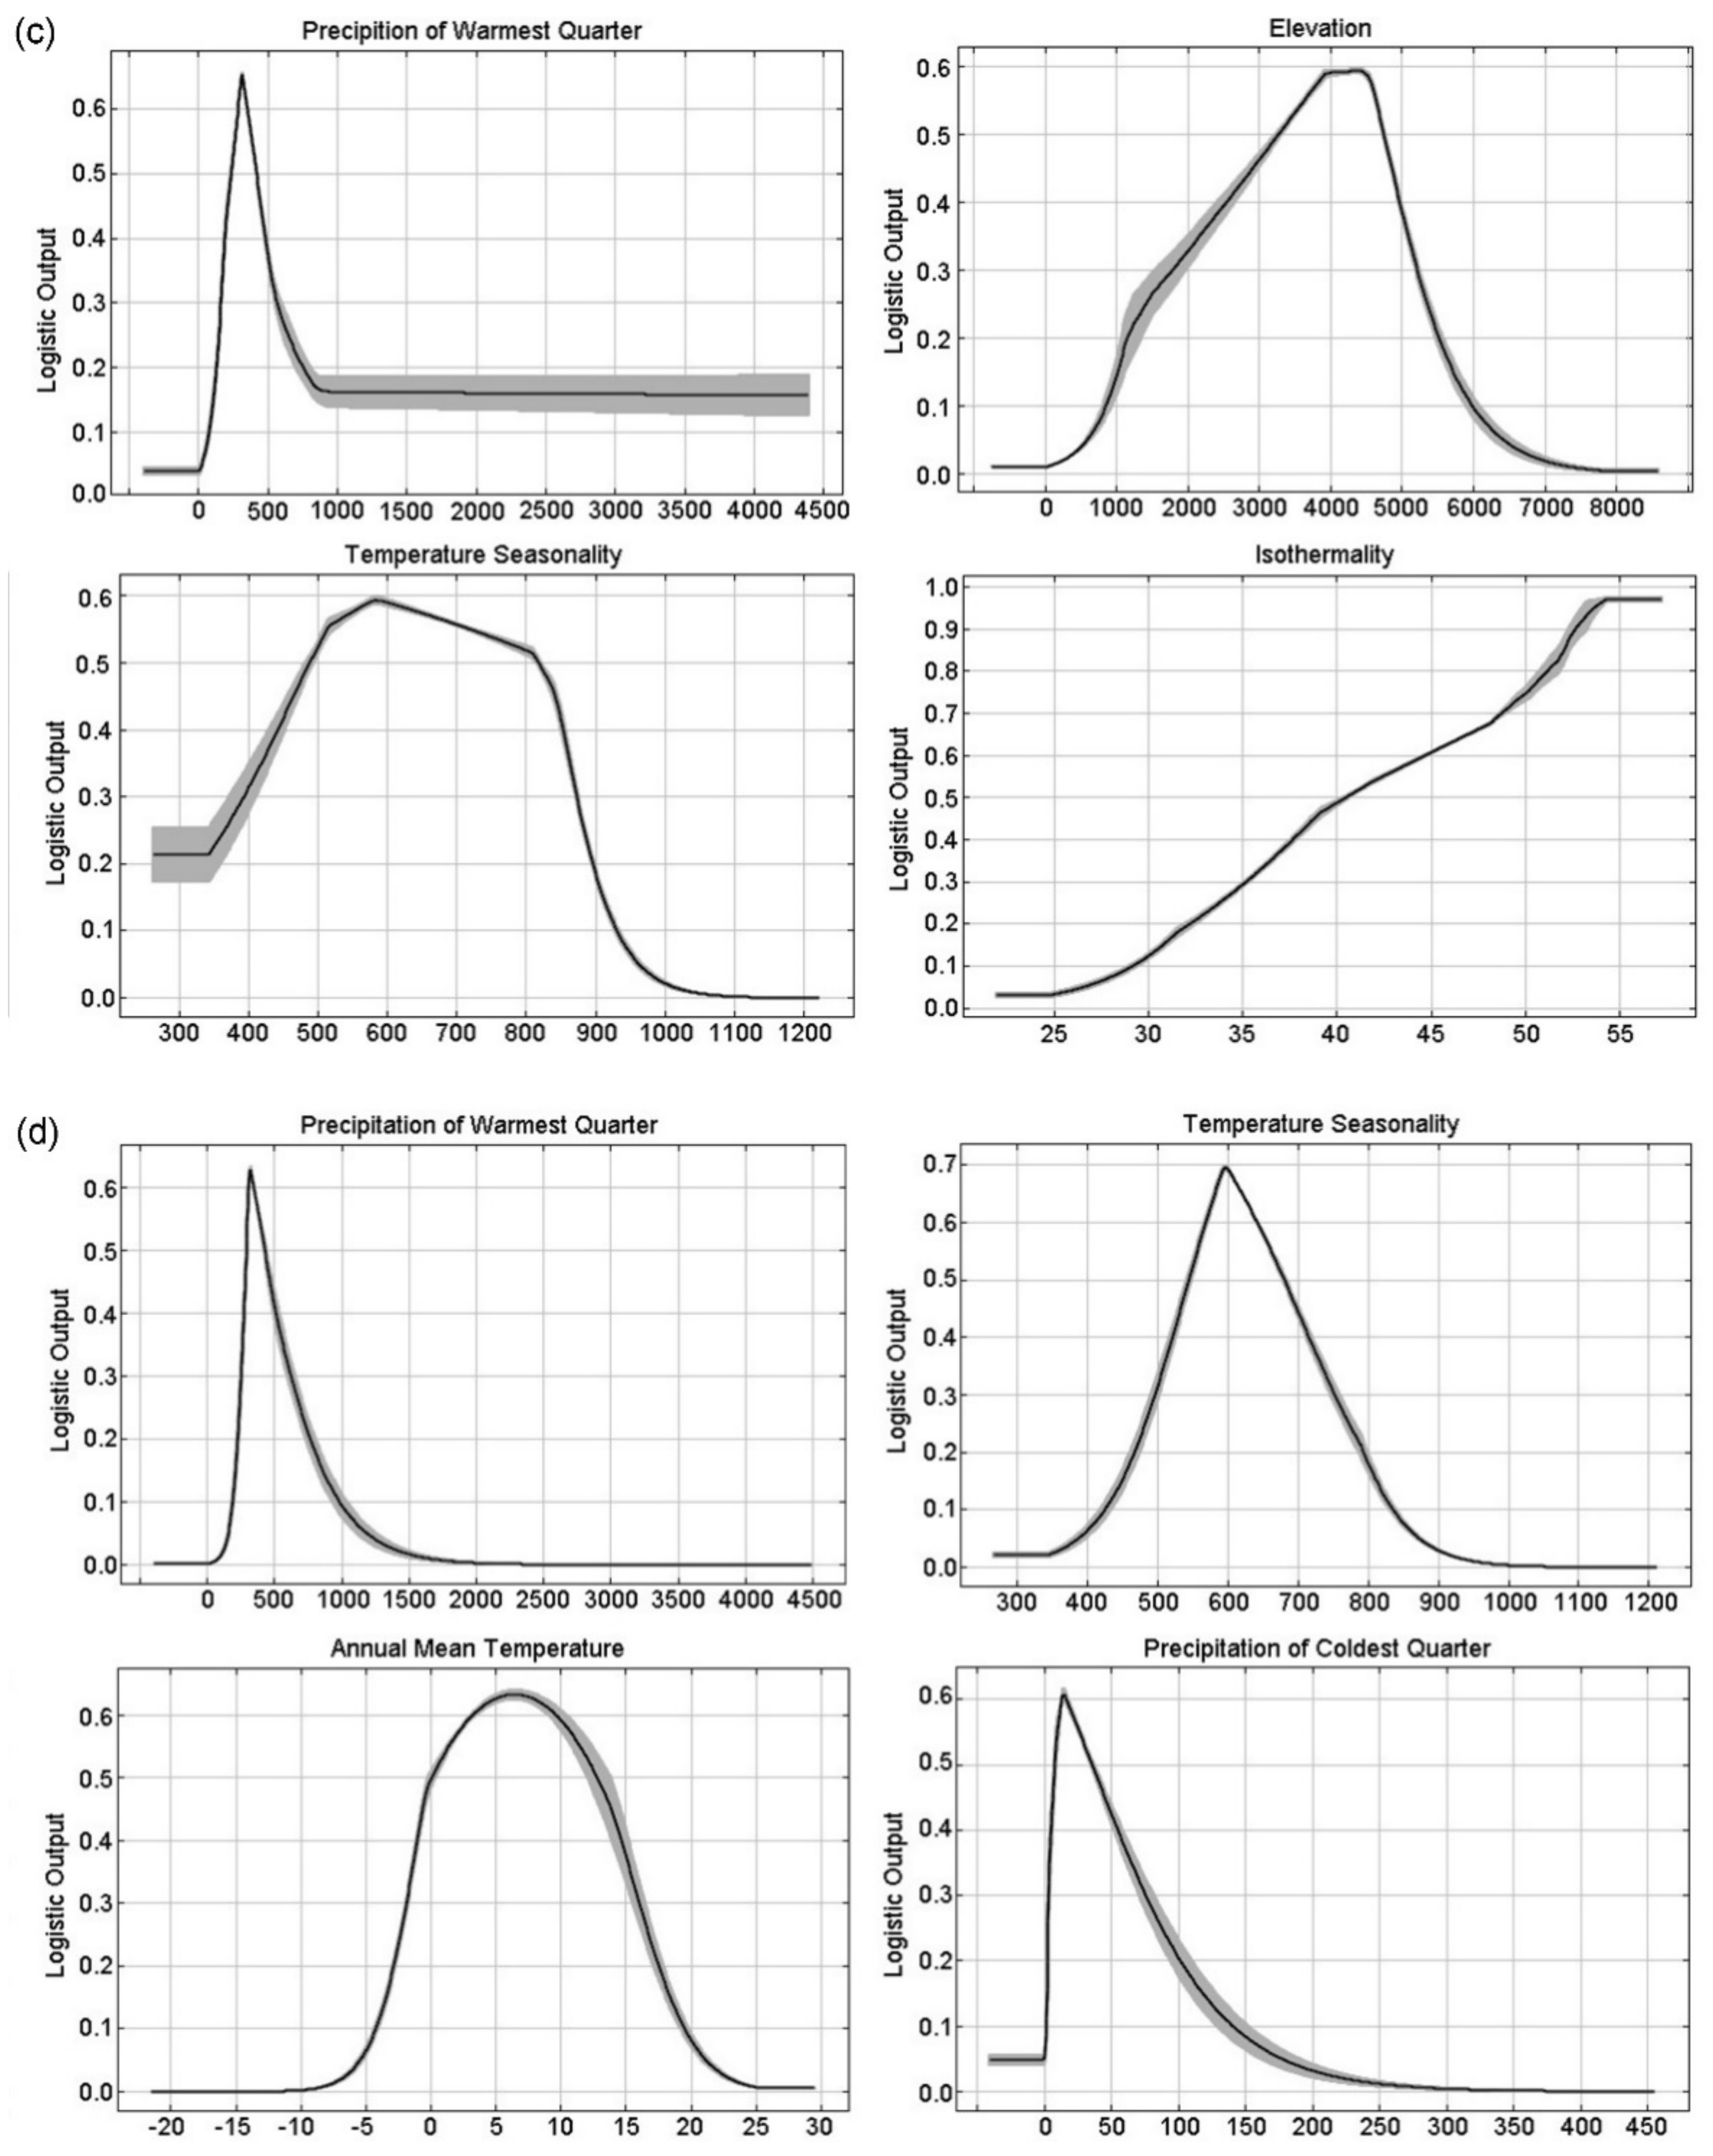
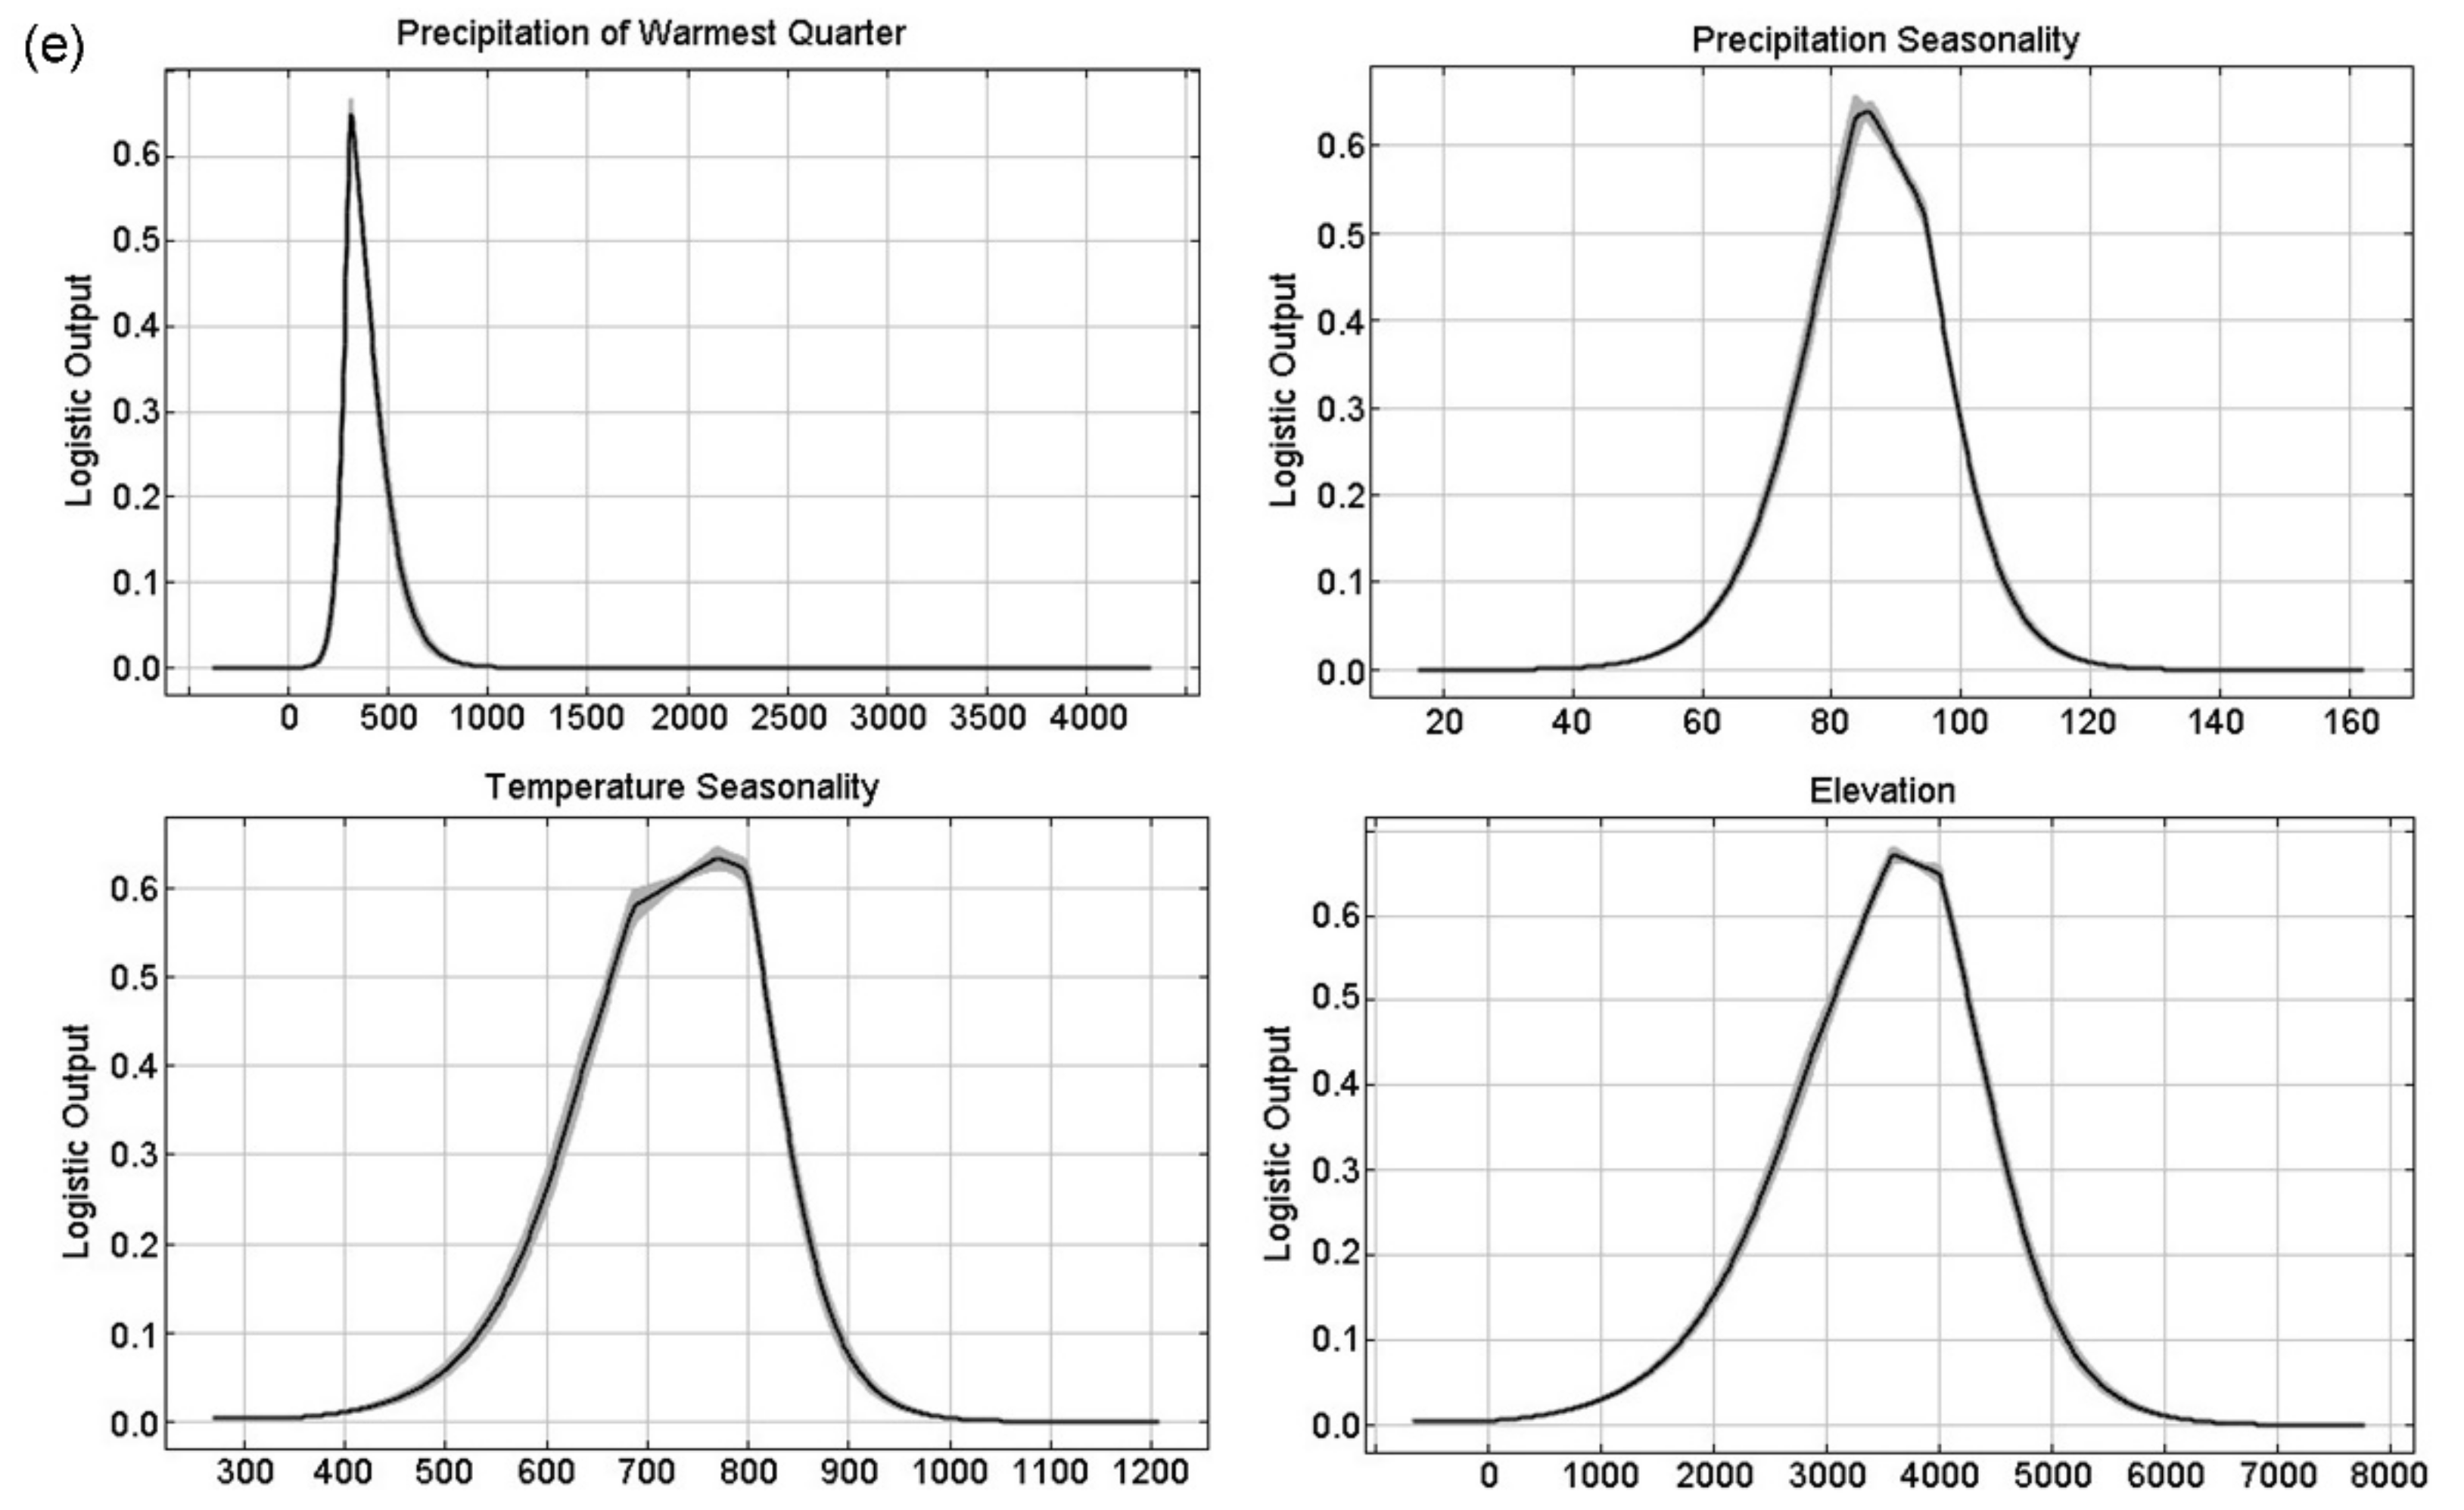
3.1. Model Performance and Key Variables to Predict Typical Meconopsis Species

Models for the Meconopsis, M. integrifolia, M. horridula, M. racemosa, and M. punicea performed better than random, with the given set of training and test data. The average AUC values for Meconopsis, M. integrifolia, M. horridula, M. racemosa, and M. punicea were 0.847, 0.888, 0.852, 0.914, and 0.951, respectively, indicating these five models performed well and generated very good (excellent) evaluations.
The results showed that precipitation of warmest quarter (Bio 18, 43.8%), temperature seasonality (Bio 4, 20%), elevation (13.5%) and annual mean temperature (Bio 1, 7.8%) made the greatest contributions to the distribution model for Meconopsis relative to other variables (Table 3), and the cumulative contributions of these factors reached values as high as 85.1%. Among the 11 environmental variables, precipitation of the warmest quarter (Bio 18, 59.2%), annual mean temperature (Bio 1, 18.9%), precipitation seasonality (Bio 15, 8.3%), and precipitation of the coldest quarter (Bio 19, 5.5%) made a greater contribution to the species distribution model for M. integrifolia than other environmental variables (Table 2), accounting for 91.9% of variation in total. For M. horridula, the most important factors were precipitation of the warmest quarter (Bio 18, 36%), elevation (11.8%), temperature seasonality (Bio 4, 11.5%), and isothermality (Bio 3, 10.2%) (Table 2); the cumulative contribution value accounted for 69.5% of the total contribution value of all environmental factors to the model. As for M. racemosa, precipitation of the warmest quarter (Bio 18, 37.7%), temperature seasonality (Bio 4, 24.4%), annual mean temperature (Bio 1, 16.7%), and precipitation of the coldest quarter (Bio 19, 4.4%) totally contributed 83.2% in the model (Table 2), which means these four variables contain the most significant and useful information to predict species distribution. Similarly, precipitation of the warmest quarter (Bio 18, 43.6%) had the highest contribution in the M. punicea model and, followed by precipitation seasonality (Bio 15, 15.8%), temperature seasonality (Bio 4, 8.6%), and elevation (8.5%) (Table 3), they totally accounted for 76.5% of the contribution value and were identified as main factors influencing the species’ spatial distribution.
The thresholds (presence probability > 0.25) of the main environmental parameters were obtained from the response curve (Figure 4). The presence probability of all species is the greatest with 300–400 mm precipitation of the warmest quarter (Figure 4). In Meconopsis, temperature seasonality (>500) and annual mean temperature (>8 °C) beyond thresholds affect the habitat suitability, and the most suitable elevation was about 3700 m (Figure 4a). M. integrifolia had the highest probability of existence when the annual mean temperature was about 10 °C and precipitation seasonality was 60–95. With the maximum probability of species occurrence when precipitation value reached 20 mm in the coldest quarter for M. integrifolia (Figure 4b). M. horridula was most likely to occur at elevations between 3200 and 4800 m, with the most suitable temperature seasonality ranging from 500 to 800, and isothermality had a sigmoid trend with the maximum species presence probability when its value up to 54 (Figure 4c). For M. racemosa, the optimum ranges of temperature seasonality, annual mean temperature, and precipitation of the coldest quarter were 540–690, 0–13 °C, and 10–30 mm, respectively (Figure 4d). The response curves of M. punicea indicated that precipitation seasonality, temperature seasonality and elevation followed a Gaussian shape, and they were within a certain range when the probability of species occurrence was higher (Figure 4e).

3.2. Current Potential Geographical Distribution Patterns of Species

The grade of the suitability zone of species has been presented in Figure 4 under the current climatic conditions across the whole study area. The potentially suitable habitats of Meconopsis are mainly distributed in the Himalaya and Hengduan Mountains, with an area of 1417.92 × 103 km2, 31.74% of the total area. The high-suitability area accounted for only 0.23% of the study area, which is mainly distributed in the central Himalaya and the Nujiang and Jinsha River Basins in Yunnan Province (Figure 5a, Table 4). The potentially suitable distribution area of M. integrifolia extended from the western Himalaya to the east of Hengduan Mountains, with 1105.33 × 103 km2 in total, accounting for 24.74% of the study area. Among these areas, the low and medium suitable areas were dominant, while the high suitable regions were concentrated in the Jinsha River Basins in Yunnan Province, with an area of only 9.14 × 10³ km2, accounting for 0.2% of the total study area (Figure 5b, Table 4). The most suitable region for M. horridula was located from the central Himalaya to the Hengduan Mountains, including the Minshan and Qilian Mountains, with a total area of 1428.40 × 103 km2, accounting for 31.98% of the study area, while the area of the middle- and low-suitability zone (31.52%) was much larger than that of high suitable area (0.46%) (Figure 5c, Table 4). Unlike M. integrifolia and M. horridula, the potentially suitable habitat area for M. racemosa was much smaller, accounting for only 15.78% of the study area, but with a slightly larger high suitable area than M. integrifolia and M. horridula (0.55%, 24.51 × 10³ km2), mainly scattered in the eastern Himalaya and the Hengduan Mountains (Figure 5d, Table 4). The suitable habitat for M. punicea covered an area of 407.19 × 10³ km2, accounting for less than 10% of the study area, and it was concentrated in the eastern part of the Hengduan Mountains, while regions with middle and high suitability for this species were mainly concentrated in the East Kunlun Mountains (Figure 5e, Table 4).
We found that the mean elevation distribution of suitable habitats for all species ranged from 3200 m to 4300 m (Table 5). For the genus Meconopsis, the distribution elevation range of the middle- and high-suitable zones was narrower than that of the low-suitable zones, and the elevation range of the high suitable zone was only 381 m, distributed in the area over 4000 m above sea level. The elevation widths of the low-suitable habitats of M. integrifolia, M. horridula, M. racemosa, and M. punicea were larger than those of the medium- and high-suitable habitats. In the high-suitable habitats, the elevational width of M. integrifolia was the narrowest at 843 m. In the medium-suitable habitats, the elevation width of M. punicea was 2320 m, which was the narrowest among them. M. punicea still had the narrowest elevation width of 2777 m in the low suitability habitat, and M. horridula had the widest in all suitability habitats, which means that it was better adapted than the other three species.

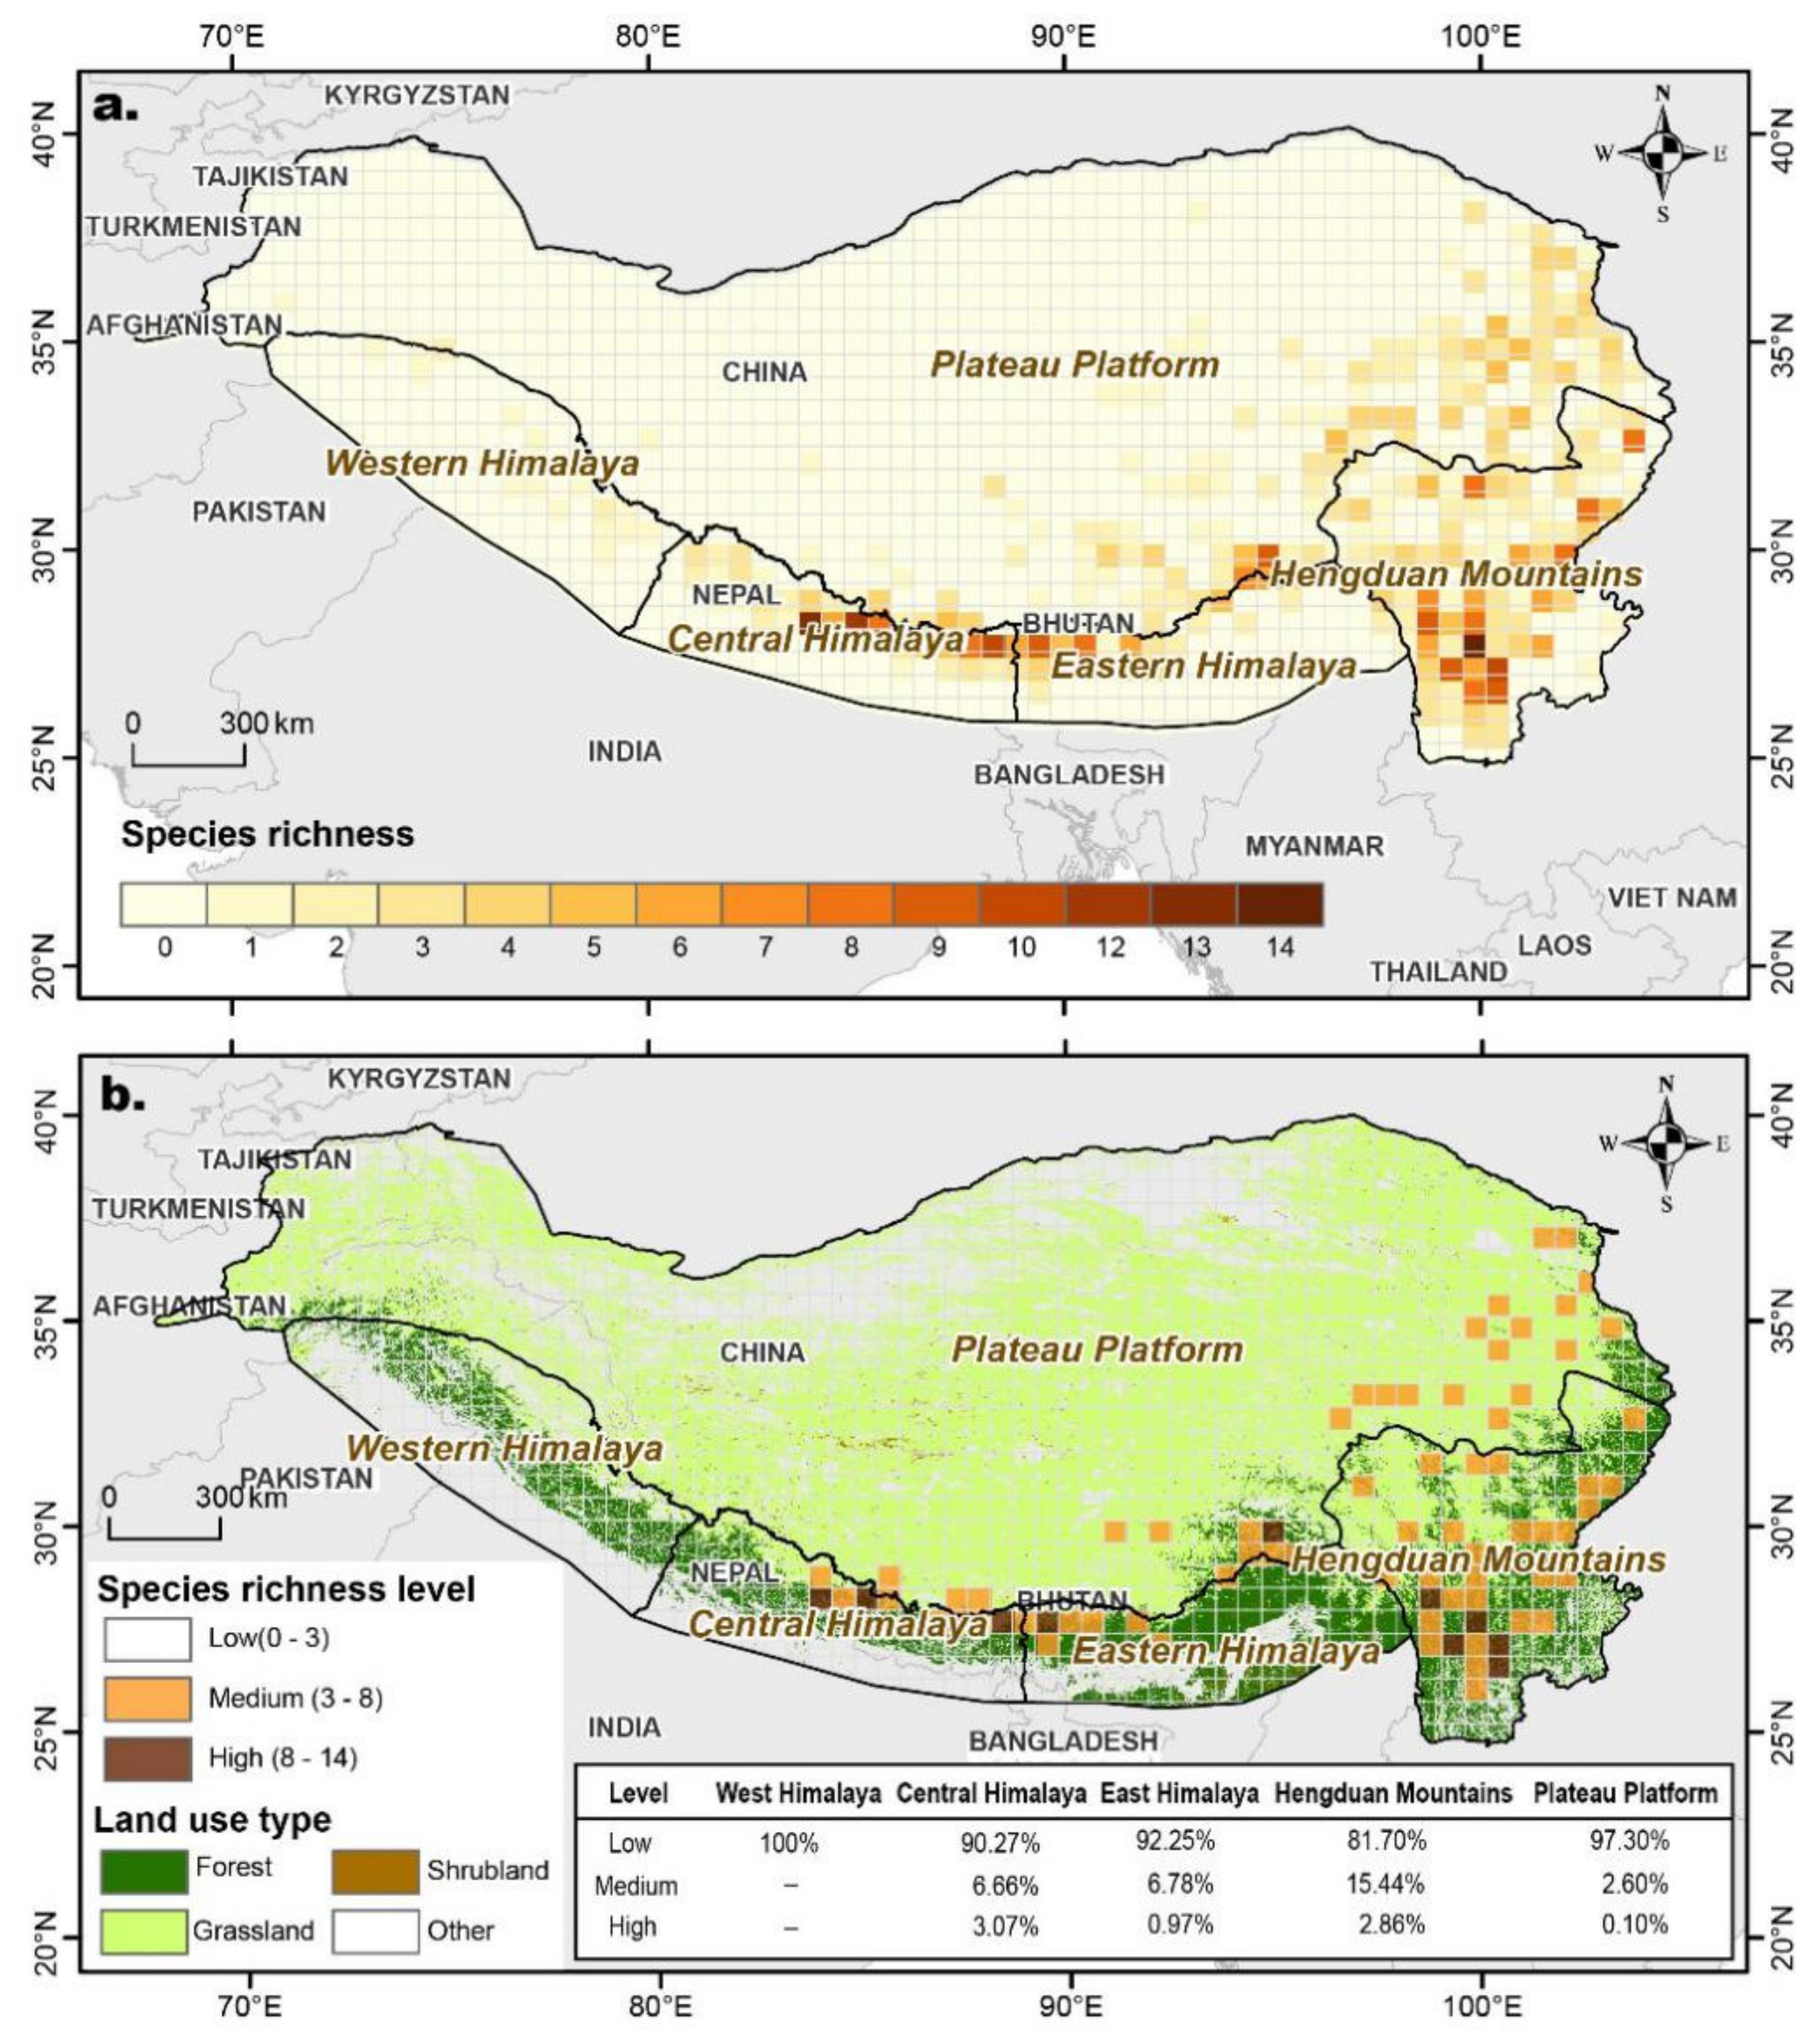
3.3. Species Richness Geospatial Patterns of Meconopsis

We found an uneven spatial distribution of Meconopsis, with species richness ranging from 0 to 14 species per grid; most of the species were concentrated in the southeastern and southern regions of the study area (Figure 6a), i.e., the Hengduan Mountains, the central and eastern Himalaya, and the southeastern part of the plateau platform adjacent to the Himalaya and Hengduan Mountains, with relatively higher the species richness than other parts. According to the number of species per grid, we divided species richness into three categories: low (0–3), medium (3–8), and high (8–14). From Figure 6b, we could find that the areas with high species richness were mainly forests, while the areas with moderate species richness were forests and grasslands. In the Hengduan Mountains, central and eastern Himalaya, the areas with high and medium species richness were mainly forests, and in the plateau were mainly grasslands. The area with medium–high species richness in all subregions accounted for less than 10%, except for 18.3% in the Hengduan Mountains. Particularly, there was no area with medium–high species richness.

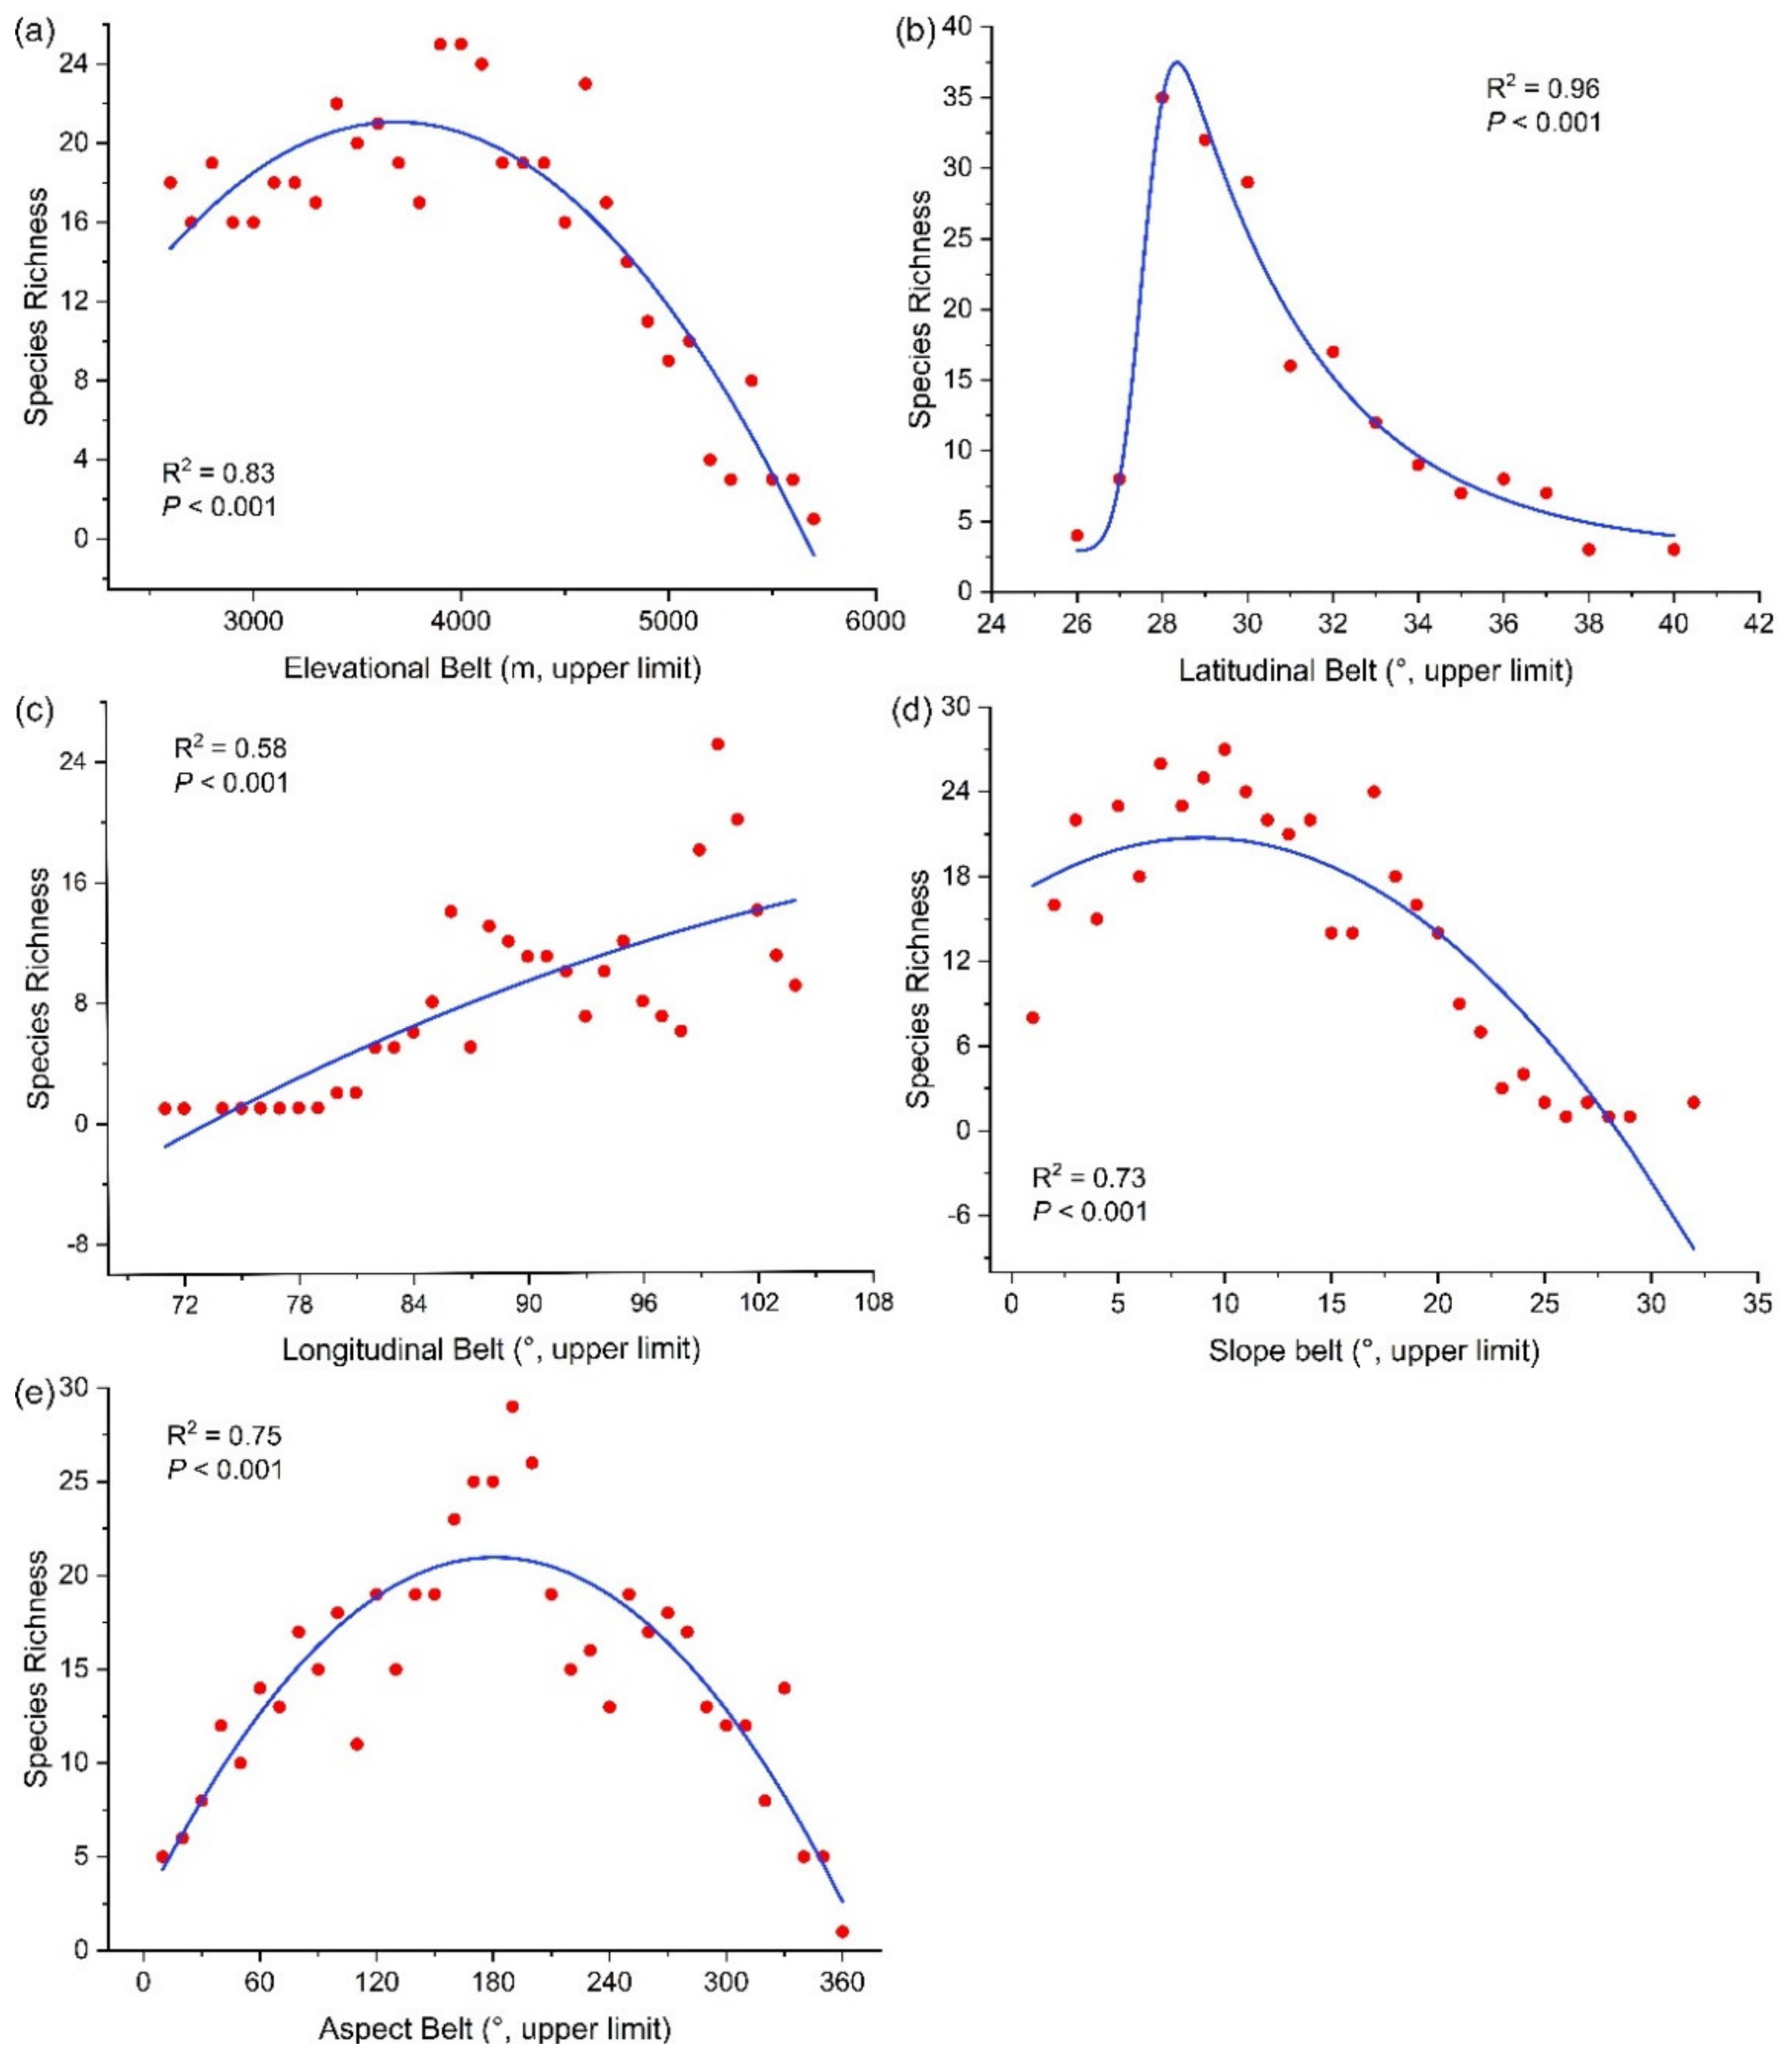
3.4. Species Richness Pattern along Environmental Gradients

The species richness gradient in the study area exhibited a hump-shaped pattern with increasing richness with elevation, peaking at around 3900–4100 m and declining toward the ends of the elevational gradient (Figure 7a). The pattern of Meconopsis plant richness along the latitudinal gradient increased remarkably to the maximum and gradually decreased with Gaussian shape fitted (R2 = 0.96, Figure 7b). The richness of Meconopsis species showed a more or less monotonous increasing trend along the longitudinal gradient and was found absent beyond 104° (Figure 7c). In our study area, their richness varied strongly with the slope gradient with peaks occurring between 6° and 11°, and decreasing in both directions (Figure 7d). The Meconopsis plant richness presented a clear hump-shaped pattern along the aspect gradient, reaching its peak at the range of 150° to 200° (south slope or sunny slope), and it was similar at both the highest (north and northwest slopes) and lowest (north and northeast slopes) aspect belts (Figure 7e). In a word, the polynomial curve fitted precisely for richness patterns of Meconopsis plant along the elevation, longitude, slope, and aspect, with reasonable R2 values (R2 > 0.5).

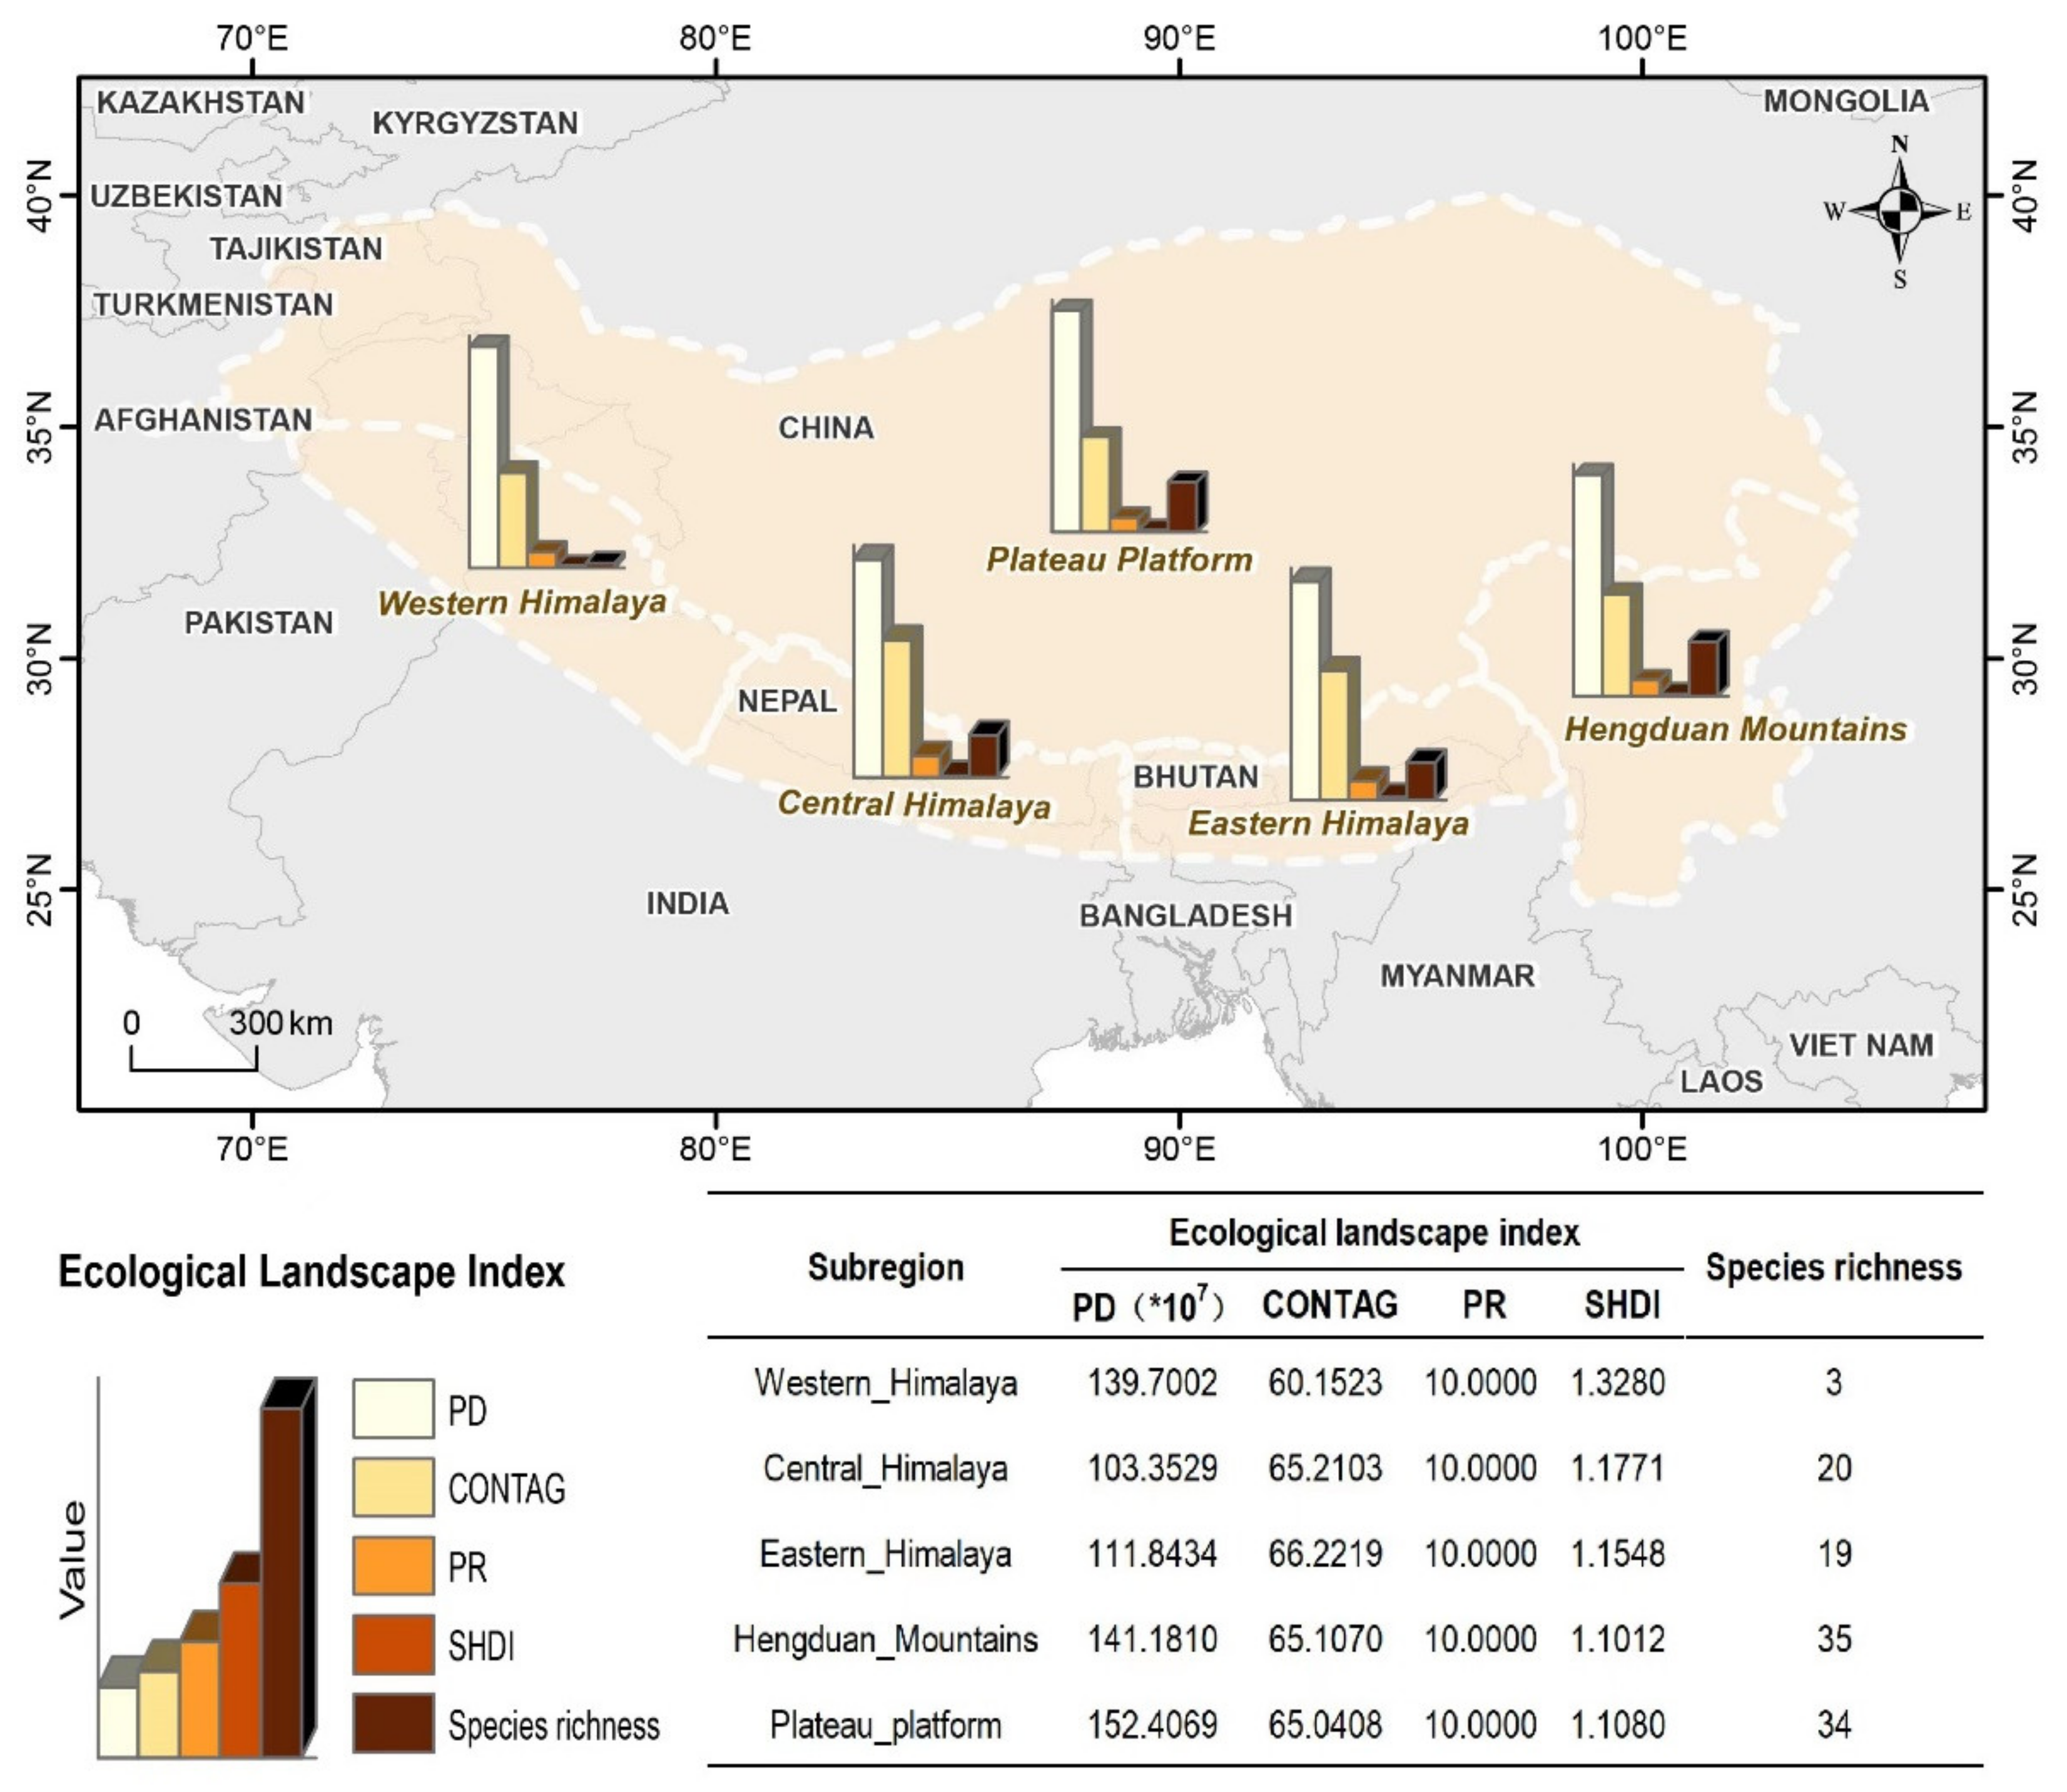
3.5. Ecological Landscape Fragmentation and Species Richness

High PD in all subregions indicated a relatively large degree of landscape fragmentation across the pan-Himalaya that was quite similar in all subregions (Figure 8). Specifically, the plateau platform occupied the largest proportion of the study area with the highest PD (152.4069), while the central Himalayan region had the lowest PD (103.3529). In terms of the CONTAG, the value was the highest in eastern Himalaya (66.2219), indicating better connectivity between dominant patches in the landscape, while the CONTAG of the western Himalaya was the lowest (60.1523). The results of PR illustrated that each subregion covered all land-use types. For SHDI, all subregions were greater than 0.8, indicating high landscape heterogeneity in the study area, and the highest SHDI value was in the western Himalayan region (1.3280). According to the four landscape indices, the degree of landscape fragmentation in each subregion from high to low was the western Himalaya, plateau platform, the Hengduan Mountains, the Central Himalaya, and eastern Himalaya. Areas with the highest species richness were the Hengduan Mountains (35) and plateau platform (34); the central Himalaya (20) and eastern Himalaya (19) had similar richness, while the lowest richness was in the western Himalaya.

4. Discussion

4.1. Divergent Environmental Factors Affect the Spatial Distribution of Meconopsis Species

The long-term joint influence of several factors resulted in the geographical distribution of plants. Climate is the most important factor determining the geographical distribution of plants on a regional scale [60,61]. The findings for MaxEnt indicated that the precipitation of the warmest quarter (Bio 18) had the greatest effect on the distribution of all Meconopsis species amongst the 11 environmental variables involved in modeling, and this is consistent with our previous study in Minjiang headwater region [42]. Since precipitation can affect plant growth, morphology, phenology, and biomass accumulation [62,63,64,65,66], in particular for seedling emergence and establishment [67], an appropriate degree of precipitation can supply sufficient water and promote plant growth; however, excessive rainfall can deteriorate the soil permeability [68], creating an anaerobic environment that inhibits the regular respiration of roots [69], and limits plant growth and development by influencing their metabolism [70]. Moreover, waterlogging can also cause stomata to close and photosynthesis to decrease, and increases the energy consumption for respiration, affecting the accumulation of organic matter [71]. In addition, high humidity caused by excess water favors the rapid multiplication of pathogens and the formation of serious diseases that not only threaten the survival of plants but also their distribution patterns on a geographical scale [72]. The species response curves demonstrated that the ecological amplitude of precipitation is small, indicating the narrow tolerance range of Meconopsis to precipitation and limiting the geographical distribution range.
Temperature variation affects plant distribution by influencing their germination, water absorption, photosynthesis, transpiration, respiration, reproduction, and growth [73]. Our results showed that temperature seasonality (Bio4) and mean annual temperature (Bio1) were the two dominant temperature-related factors affecting the habitat suitability of Meconopsis species. Elevation was another key variable that had a strong indirect impact on the distribution of Meconopsis species. It integrates the effect of temperature, humidity, light, and other indicators to make secondary allocation of resources for influencing species composition and distribution [74,75]. Under the current climate, a potentially suitable area for Meconopsis was mainly distributed in the southeast Qinghai-Tibet Plateau and Hengduan Mountains where have similar climate conditions, particularly in terms of hydro-thermal coupling. Monsoons, with sufficient rainfall with suitable temperature conditions, bolster the growth and development of alpine vegetation [76], accumulating assimilation products for overwintering and reproduction. Furthermore, high mountains and valleys are distributed in tandem with tremendous elevation variation, which creates a unique climate with cold temperatures at the mountain top and dry-hot conditions at the foot of the mountain. The suitable habitats of Meconopsis are mostly distributed in the alpine regions above 3500 m, consistent with their preference for cold and cool ecological habits [77,78]. This comprehensive analysis found that elevation and variables related to precipitation and temperature were the key factors restricting the distribution of Meconopsis.

4.2. The Richness of Meconopsis Species Varies along Geospatial Gradients

The decline of plant species richness from the equator to the poles is one of the most striking ecological patterns on Earth [79]. However, along the longitudinal gradient, from west to east, plant species richness increases with increasing wetness in different regions of the study area [80,81,82,83]. The highest species richness of Meconopsis was founded in Hengduan Mountain, which stands at the intersection of latitudinal and longitudinal curves (Figure 5) providing appropriate hydrothermal conditions, high habitat heterogeneity, and complex terrain [84,85] for the growth of Meconopsis species. Interestingly, many areas with medium and high species richness were forests. This contradicted our common knowledge that their favorable habitats are shrublands or grasslands, which might be due to scale variations or spatial resolution since shrub and grassland patches in forests are often classified as forests at a 300 m spatial resolution. Moreover, it is generally accepted that forests, shrubs, deserts, and other plant communities with woody plant coverage of less than 40% should be classified as grassland [86]. However, the grassland area calculated based on the area of herbaceous vegetation here is underestimated.
Topography (elevation, slope, and aspect) has a significant impact on the spatial distribution of plants by influencing habitat temperature and humidity [87,88]. Meconopsis species richness revealed a unimodal distribution pattern along the elevational gradients in mountainous regions (Figure 5), similar to prior studies [89,90,91]. This may be attributed to the appropriate mild habitats for plant growth in mid-elevation [92], and this mid-domain effect was highly pronounced in the Himalaya [91], which brings in more rainfall than higher elevations in monsoon and decreases from the southernmost to the northernmost slopes [93]. The optimum temperature decreases along with the elevation increase, and only a few species can adapt to harsh environments [91,94]. Lower Meconopsis species richness beyond mid-elevations can be attributed to the decrease of soil cover with more rocks and slow biogeochemical cycle in contrast with favorable mid-elevation providing higher atmospheric moisture and cooler summer temperature [95]. Some species have specific requirements for slope and aspect [96], which directly or indirectly influence the solar radiation, temperature, and soil conditions [97,98] In concordance with other studies, we found that species richness of Meconopsis was higher on the sunlit southern slope as compared to the northern slope [99]. Meanwhile, the steeper slope triggers soil erosion [97] which stunts seed settling and plant growth [100]. Therefore, gentle slopes have higher species richness and plant growth as compared to steeper slopes. [97]. All the aforementioned topographical variables play essential and unique roles in the distribution of Meconopsis.

4.3. Linkage and Relations between Landscape Heterogeneity and Species Richness

The complex spatial heterogeneity of mountain areas provides advantageous conditions for biodiversity with a variety of patch types [101]. However, our study did not find a relatively clear relationship between landscape fragmentation and species richness, which might be relevant to inconsistent scale and metastability [29,30,102]. At the landscape scale, the degree of landscape fragmentation seems to have little impact on the species richness of Meconopsis. Given that spatial heterogeneity such as topography can significantly affect the richness [103], the effects of landscape fragmentation are probably more pronounced at comparatively smaller scales.
A larger habitat can harbor more species and support richer plant communities with more available resources [104]. Therefore, it is easy to understand why the species richness is higher on the plateau platform than in other parts, whose higher species richness is mainly concentrated in the southeastern part. Blocked by the Himalaya and Gangdise mountains, warm moist air from the Indian Ocean flows into China along the Hengduan Mountains, thus bringing abundant rain to the southeastern of the Qinghai-Tibetan Plateau. While the western Himalaya has the lowest species richness with a quite fragmented landscape, the region is inherently less suitable for Meconopsis because of poor hydrothermal conditions [105], and this is consistent with the current potential distribution modeling results. The lower latitudes of the central and eastern Himalaya on the southern slope of the Himalaya with abundant summer rainfall have a higher species richness. [105,106]. The Hengduan Mountains are climatically influenced by the westerly circulation and the Indian and Pacific monsoon circulation, with dry winters and rainy summers, which are ideal for the more abundant Meconopsis; despite their smaller area than the plateau platform, the species richness of Meconopsis is more abundant.

5. Conclusions

Our study discovered that the potential distribution regions with medium- and high-suitable habitats for Meconopsis, under the current climate scenario, were mainly located in the central and eastern Himalaya, Hengduan Mountains, and the southeast edge of the plateau platform. Precipitation of the warmest quarter had the greatest impact on the distribution of Meconopsis species. We also found species richness within the genus Meconopsis was distributed in a unimodal pattern along geospatial gradients except for the longitudinal gradient in pan-Himalaya. However, no obvious consistent relationships exist between landscape fragmentation and species richness for Meconopsis. Our findings not only promote an understanding of the distribution and diversity of Meconopsis species but also provide an indispensable foundation for future studies on Meconopsis plant functions and the sustainability of alpine ecosystems. This study also provides data and theoretical support for species diversity protection policies in pan-Himalaya and adjacent regions.

Supplementary Materials

The following supporting information can be downloaded at https://www.mdpi.com/article/10.3390/d14080661/s1: Table S1: The number of presence locations of each species.

Author Contributions

Conceptualization, N.S., C.W. and J.W.; methodology, N.S. and C.W.; software, N.S. and C.W.; validation, N.S., C.W. and J.W.; formal analysis, N.S. and C.W.; investigation, N.S. and C.W.; resources, N.S. and C.W.; data curation, N.S. and C.W.; writing—original draft preparation, N.S.; writing—review and editing, N.S., C.W., J.W., N.W., N.N., L.Z., L.W., J.S., W.D., Y.W. (Yanqiang Wei), W.C. and Y.W. (Yan Wu); visualization, N.S. and C.W.; supervision, J.W.; project administration, J.W.; funding acquisition, J.W. All authors have read and agreed to the published version of the manuscript.

Funding

This research was funded by the National Natural Science Foundation of China (31971436), CAS “Light of West China” Program (2021XBZG_XBQNXZ_A_007), State Key Laboratory of Cryospheric Science, Northwest Institute of Eco-Environment and Resources, Chinese Academy Sciences (SKLCS-OP-2021-06), Talented Young Scientist Program (Indian-18-008) by China Science and Technology Exchange Centre, Ministry of Science and Technology, and China Biodiversity Observation Networks (Sino BON).

Institutional Review Board Statement

Not applicable.

Informed Consent Statement

Not applicable.

Data Availability Statement

The raw data supporting the conclusions of this article will be made available by the authors, without undue reservation.

Acknowledgments

Special thanks to Li Yike from the Chengdu Institute of Biology, Chinese Academy of Sciences for his valuable discussion about Fragstats and other issues.

Conflicts of Interest

The authors declare no conflict of interest.

References

  1. Huss, M.; Bookhagen, B.; Huggel, C.; Jacobsen, D.; Bradley, R.S.; Clague, J.J.; Vuille, M.; Buytaert, W.; Cayan, D.R.; Greenwood, G.; et al. Toward mountains without permanent snow and ice. Earth’s Future 2017, 5, 418–435. [Google Scholar] [CrossRef]
  2. Nie, Y.; Pritchard, H.D.; Liu, Q.; Hennig, T.; Wang, W.; Wang, X.; Liu, S.; Nepal, S.; Samyn, D.; Hewitt, K.; et al. Glacial change and hydrological implications in the Himalaya and Karakoram. Nat. Rev. Earth Environ. 2021, 2, 91–106. [Google Scholar] [CrossRef]
  3. Shi, H.; Zhou, Q.; He, R.; Zhang, Q.; Dang, H. Climate warming will widen the lagging gap of global treeline shift relative to densification. Agric. For. Meteorol. 2022, 318, 108917. [Google Scholar] [CrossRef]
  4. Pepin, N.; Bradley, R.S.; Diaz, H.F.; Baraer, M.; Caceres, E.B.; Forsythe, N.; Fowler, H.; Greenwood, G.; Hashmi, M.Z.; Liu, X.D.; et al. Elevation-dependent warming in mountain regions of the world. Nat. Clim. Chang. 2015, 5, 424–430. [Google Scholar] [CrossRef]
  5. Rogora, M.; Frate, L.; Carranza, M.; Freppaz, M.; Stanisci, A.; Bertani, I.; Bottarin, R.; Brambilla, A.; Canullo, R.; Carbognani, M.; et al. Assessment of climate change effects on mountain ecosystems through a cross-site analysis in the Alps and Apennines. Sci. Total Environ. 2018, 624, 1429–1442. [Google Scholar] [CrossRef]
  6. Beniston, M. Climatic Change in Mountain Regions: A Review of Possible Impacts. Clim. Chang. 2003, 59, 5–31. [Google Scholar] [CrossRef]
  7. Li, S.; Zhang, Y.; Wang, Z.; Li, L. Mapping human influence intensity in the Tibetan Plateau for conservation of ecological service functions. Ecosyst. Serv. 2018, 30, 276–286. [Google Scholar] [CrossRef]
  8. Zhang, Y.; Qian, L.; Spalink, D.; Sun, L.; Chen, J.; Sun, H. Spatial phylogenetics of two topographic extremes of the Hengduan Mountains in southwestern China and its implications for biodiversity conservation. Plant Divers. 2020, 43, 181–191. [Google Scholar] [CrossRef]
  9. Liang, Q.; Xu, X.; Mao, K.; Wang, M.; Wang, K.; Xi, Z.; Liu, J. Shifts in plant distributions in response to climate warming in a biodiversity hotspot, the Hengduan Mountains. J. Biogeogr. 2018, 45, 1334–1344. [Google Scholar] [CrossRef]
  10. Mao, K.; Wang, Y.; Liu, J. Evolutionary origin of species diversity on the Qinghai–Tibet Plateau. J. Syst. Evol. 2021, 59, 1142–1158. [Google Scholar] [CrossRef]
  11. Liu, Y.; Ye, J.; Hu, H.; Peng, D.; Zhao, L.; Lu, L.; Zaman, W.; Chen, Z.; Ebach, M. Influence of elevation on bioregionalisation: A case study of the Sino-Himalayan flora. J. Biogeogr. 2021, 48, 2578–2587. [Google Scholar] [CrossRef]
  12. Körner, C.; Jetz, W.; Paulsen, J.; Payne, D.; Rudmann-Maurer, K.; Spehn, E.M. A global inventory of mountains for bio-geographical applications. Alp. Bot. 2016, 127, 1–15. [Google Scholar] [CrossRef]
  13. Liu, J.; Li, J.; Lai, Y. Plant diversity and ecology on the Qinghai–Tibet Plateau. J. Syst. Evol. 2021, 59, 1139–1141. [Google Scholar] [CrossRef]
  14. Sun, H.; Zhang, J.; Deng, T.; Boufford, D.E. Origins and evolution of plant diversity in the Hengduan Mountains, China. Plant Divers. 2017, 39, 161–166. [Google Scholar] [CrossRef]
  15. Chen, S.; Wang, W.; Xu, W.; Wang, Y.; Wan, H.; Chen, D.; Tang, Z.; Tang, X.; Zhou, G.; Xie, Z.; et al. Plant diversity enhances productivity and soil carbon storage. Proc. Natl. Acad. Sci. USA 2018, 115, 4027–4032. [Google Scholar] [CrossRef]
  16. Quijas, S.; Schmid, B.; Balvanera, P. Plant diversity enhances provision of ecosystem services: A new synthesis. Basic Appl. Ecol. 2010, 11, 582–593. [Google Scholar] [CrossRef]
  17. Guo, F.; Lenoir, J.; Bonebrake, T.C. Land-use change interacts with climate to determine elevational species redistribution. Nat. Commun. 2018, 9, 1–7. [Google Scholar] [CrossRef]
  18. Wu, J.; Liu, Z.M. Effect of habitat fragmentation on biodiversity: A review. Chinese J. Ecol. 2014, 33, 1946–1952. [Google Scholar]
  19. Bálint, M.; Domisch, S.; Engelhardt, C.H.M.; Haase, P.; Lehrian, S.; Sauer, J.; Theissinger, K.; Pauls, S.U.; Nowak, C. Cryptic biodiversity loss linked to global climate change. Nat. Clim. Chang. 2011, 1, 313–318. [Google Scholar] [CrossRef]
  20. Boddy, L.; Büntgen, U.; Egli, S.; Gange, A.C.; Heegaard, E.; Kirk, P.M.; Mohammad, A.; Kauserud, H. Climate variation effects on fungal fruiting. Fungal Ecol. 2014, 10, 20–33. [Google Scholar] [CrossRef]
  21. Hooper, D.U.; Adair, E.C.; Cardinale, B.J.; Byrnes, J.; Hungate, B.A.; Matulich, K.L.; Gonzalez, A.; Duffy, J.E.; Gamfeldt, L.; O’Connor, M.I. A global synthesis reveals biodiversity loss as a major driver of ecosystem change. Nature 2012, 486, 105–108. [Google Scholar] [CrossRef]
  22. Zhang, K.; Yao, L.; Meng, J.; Tao, J. Maxent modeling for predicting the potential geographical distribution of two peony species under climate change. Sci. Total Environ. 2018, 634, 1326–1334. [Google Scholar] [CrossRef]
  23. Lenoir, J.; Gégout, J.-C.; Guisan, A.; Vittoz, P.; Wohlgemuth, T.; Zimmermann, N.E.; Dullinger, S.; Pauli, H.; Willner, W.; Svenning, J.-C. Going against the flow: Potential mechanisms for unexpected downslope range shifts in a warming climate. Ecography 2010, 33, 295–303. [Google Scholar] [CrossRef]
  24. Alatalo, J.M.; Jägerbrand, A.K.; Molau, U. Impacts of different climate change regimes and extreme climatic events on an alpine meadow community. Sci. Rep. 2016, 6, 21720. [Google Scholar] [CrossRef]
  25. Ceballos, G.; Ehrlich, P.R.; Barnosky, A.D.; García, A.; Pringle, R.M.; Palmer, T.M. Accelerated modern human–induced species losses: Entering the sixth mass extinction. Sci. Adv. 2015, 1, e1400253. [Google Scholar] [CrossRef]
  26. Di Giulio, M.; Holderegger, R.; Tobias, S. Effects of habitat and landscape fragmentation on humans and biodiversity in densely populated landscapes. J. Environ. Manag. 2009, 90, 2959–2968. [Google Scholar] [CrossRef]
  27. Fahrig, L. Effects of Habitat Fragmentation on Biodiversity. Annu. Rev. Ecol. Evol. Syst. 2003, 34, 487–515. [Google Scholar] [CrossRef]
  28. Fischer, J.; Lindenmayer, D.B. Landscape modification and habitat fragmentation: A synthesis. Glob. Ecol. Biogeogr. 2007, 16, 265–280. [Google Scholar] [CrossRef]
  29. Reino, L.; Beja, P.; Araújo, M.B.; Dray, S.; Segurado, P. Does local habitat fragmentation affect large-scale distributions? The case of a specialist grassland bird. Divers. Distrib. 2013, 19, 423–432. [Google Scholar] [CrossRef]
  30. Xu, C.; Huang, Z.Y.X.; Chi, T.; Chen, B.J.W.; Zhang, M.; Liu, M. Can local landscape attributes explain species richness patterns at macroecological scales? Glob. Ecol. Biogeogr. 2013, 23, 436–445. [Google Scholar] [CrossRef]
  31. Huang, H. Plant diversity and conservation in China: Planning a strategic bioresource for a sustainable future. Bot. J. Linn. Soc. 2011, 166, 282–300. [Google Scholar] [CrossRef] [PubMed]
  32. Brooks, T.M.; Mittermeier, R.A.; Da Fonseca, G.A.B.; Gerlach, J.; Hoffmann, M.; Lamoreux, J.F.; Mittermeier, C.G.; Pilgrim, J.D.; Rodrigues, A.S.L. Global Biodiversity Conservation Priorities. Science 2006, 313, 58–61. [Google Scholar] [CrossRef] [PubMed]
  33. Xin, L.; Zhi-Heng, W.; Zhi-Yao, T.; Shu-Qing, Z.; Jing-Yun, F. Geographic patterns and environmental correlates of terrestrial mammal species richness in China. Biodivers. Sci. 2009, 17, 652–663. [Google Scholar] [CrossRef]
  34. Stiles, A.; Scheiner, S.M. A multi-scale analysis of fragmentation effects on remnant plant species richness in Phoenix, Arizona. J. Biogeogr. 2010, 37, 1721–1729. [Google Scholar] [CrossRef]
  35. Giladi, I.; Ziv, Y.; May, F.; Jeltsch, F. Scale-dependent determinants of plant species richness in a semi-arid fragmented agro-ecosystem. J. Veg. Sci. 2011, 22, 983–996. [Google Scholar] [CrossRef]
  36. Xiao, W.; Simpson, B.B. A New Infrageneric Classification of Meconopsis (Papaveraceae) Based on a Well-supported Molecular Phylogeny. Syst. Bot. 2017, 42, 226–233. [Google Scholar] [CrossRef]
  37. Xie, H.; Ash, J.E.; Linde, C.; Cunningham, S.; Nicotra, A. Himalayan-Tibetan Plateau Uplift Drives Divergence of Polyploid Poppies: Meconopsis Viguier (Papaveraceae). PLoS ONE 2014, 9, e99177. [Google Scholar] [CrossRef]
  38. Egan, P.A. Meconopsis autumnalis and M. manasluensis (Papaveraceae), two new species of Himalayan poppy endemic to central Nepal with sympatric congeners. Phytotaxa 2011, 20, 47–56. [Google Scholar] [CrossRef]
  39. Duffy, J.E.; Godwin, C.M.; Cardinale, B.J. Biodiversity effects in the wild are common and as strong as key drivers of productivity. Nature 2017, 549, 261–264. [Google Scholar] [CrossRef]
  40. Li, X.X.; Tan, W.; Sun, J.Q.; Du, J.H.; Zheng, C.G.; Tian, X.X.; Zheng, M.; Xiang, B.B.; Wang, Y. Comparison of four complete chloroplast genomes of medicinal and ornamental Meconopsis species: Genome organization and species discrimination. Sci. Rep. 2019, 9, 112. [Google Scholar] [CrossRef]
  41. Guo, Q.; Bai, R.; Zhao, B.; Feng, X.; Zhao, Y.; Tu, P.; Chai, X. An Ethnopharmacological, Phytochemical and Pharmacological Review of the Genus Meconopsis. Am. J. Chin. Med. 2016, 44, 439–462. [Google Scholar] [CrossRef]
  42. Shi, N.; Naudiyal, N.; Wang, J.; Gaire, N.P.; Wu, Y.; Wei, Y.; He, J.; Wang, C. Assessing the Impact of Climate Change on Potential Distribution of Meconopsis punicea and Its Influence on Ecosystem Services Supply in the Southeastern Margin of Qinghai-Tibet Plateau. Front. Plant Sci. 2022, 12, 3338. [Google Scholar] [CrossRef]
  43. Xiao, W.; Simpson, B.B. The Role of Allotriploidy in the Evolution of Meconopsis (Papaveraceae): A Preliminary Study of Ancient Polyploid and Hybrid Speciation. Lundellia 2014, 17, 5–17. [Google Scholar] [CrossRef]
  44. Forester, B.R.; DeChaine, E.G.; Bunn, A.G. Integrating ensemble species distribution modelling and statistical phylogeography to inform projections of climate change impacts on species distributions. Divers. Distrib. 2013, 19, 1480–1495. [Google Scholar] [CrossRef]
  45. Booth, T.H.; Nix, H.A.; Busby, J.R.; Hutchinson, M.F.; Franklin, J. Bioclim: The first species distribution modelling package, its early applications and relevance to most current MaxEnt studies. Divers. Distrib. 2014, 20, 1–9. [Google Scholar] [CrossRef]
  46. Tang, Y.; Winkler, J.A.; Vina, A.; Liu, J.; Zhang, Y.; Zhang, X.; Li, X.; Wang, F.; Zhang, J.; Zhao, Z. Uncertainty of future projections of species distributions in mountainous regions. PLoS ONE 2018, 13, e0189496. [Google Scholar] [CrossRef]
  47. Liao, Z.; Nobis, M.P.; Xiong, Q.; Tian, X.; Wu, X.; Pan, K.; Zhang, A.; Wang, Y.; Zhang, L. Potential distributions of seven sympatric sclerophyllous oak species in Southwest China depend on climatic, non-climatic, and independent spatial drivers. Ann. For. Sci. 2021, 78, 5. [Google Scholar] [CrossRef]
  48. Liu, X.-T.; Yuan, Q.; Ni, J. Research advances in modelling plant species distribution in China. Chin. J. Plant Ecol. 2019, 43, 273–283. [Google Scholar] [CrossRef]
  49. Naudiyal, N.; Wang, J.; Ning, W.; Gaire, N.P.; Peili, S.; Wei, Y.; He, J.; Ning, S. Potential distribution of Abies, Picea, and Juniperus species in the sub-alpine forest of Minjiang headwater region under current and future climate scenarios and its implications on ecosystem services supply. Ecol. Indic. 2021, 121, 107131. [Google Scholar] [CrossRef]
  50. Du, Z.; He, Y.; Wang, H.; Wang, C.; Duan, Y. Potential geographical distribution and habitat shift of the genus Ammopiptanthus in China under current and future climate change based on the MaxEnt model. J. Arid Environ. 2020, 184, 104328. [Google Scholar] [CrossRef]
  51. Wu, X.; Dong, S.; Liu, S.; Liu, Q.; Han, Y.; Zhang, X.; Su, X.; Zhao, H.; Feng, J. Identifying priority areas for grassland endangered plant species in the Sanjiangyuan Nature Reserve based on the MaxEnt model. Biodivers. Sci. 2018, 26, 138–148. [Google Scholar] [CrossRef]
  52. Li, J.; Fan, G.; He, Y. Predicting the current and future distribution of three Coptis herbs in China under climate change conditions, using the MaxEnt model and chemical analysis. Sci. Total Environ. 2019, 698, 134141. [Google Scholar] [CrossRef]
  53. Saunders, D.A.; Hobbs, R.J.; Margules, C.R. Biological Consequences of Ecosystem Fragmentation: A Review. Conserv. Biol. 1991, 5, 18–32. [Google Scholar] [CrossRef]
  54. McGarigal, K.; Marks, B.J. FragStats: Spatial Pattern Analysis Program for Quantifying Landscape Structure; PNW-GTR-351; U.S. Department of Agriculture, Forest Service, Pacific Northwest Research Station: Portland, OR, USA, 1995; p. 122. [Google Scholar]
  55. Zhang, Y.; Li, B.; Liu, L.; Zheng, D. Redetermine the region and boundaries of Tibetan Plateau. Geogr. Res. 2021, 40, 1543–1553. [Google Scholar]
  56. Ding, W.-N.; Ree, R.H.; Spicer, R.A.; Xing, Y.-W. Ancient orogenic and monsoon-driven assembly of the world’s richest temperate alpine flora. Science 2020, 369, 578–581. [Google Scholar] [CrossRef] [PubMed]
  57. Wen, J.; Zhang, J.-Q.; Nie, Z.-L.; Zhong, Y.; Sun, H. Evolutionary diversifications of plants on the Qinghai-Tibetan Plateau. Front. Genet. 2014, 5, 4. [Google Scholar] [CrossRef]
  58. Merow, C.; Smith, M.J.; Silander, J.A., Jr. A practical guide to MaxEnt for modeling species’ distributions: What it does, and why inputs and settings matter. Ecography 2013, 36, 1058–1069. [Google Scholar] [CrossRef]
  59. Pearson, R.G.; Raxworthy, C.J.; Nakamura, M.; Peterson, A.T. Predicting species distributions from small numbers of occurrence records: A test case using cryptic geckos in Madagascar. J. Biogeogr. 2007, 34, 102–117. [Google Scholar] [CrossRef]
  60. Lambers, H.; Chapin, F.S.; Pons, T.L. Plant Physiology Ecology, 2nd ed.; Springer-Verlag: New York, NY, USA, 2008. [Google Scholar]
  61. Peng, J.; Gou, X.; Chen, F.; Li, J.; Liu, P.; Zhang, Y.; Fang, K. Difference in Tree Growth Responses to Climate at the Upper Treeline: Qilian Juniper in the Anyemaqen Mountains. J. Integr. Plant Biol. 2008, 50, 982–990. [Google Scholar] [CrossRef]
  62. Chmielewski, F.-M.; Rötzer, T. Response of tree phenology to climate change across Europe. Agric. For. Meteorol. 2001, 108, 101–112. [Google Scholar] [CrossRef]
  63. Molina-Montenegro, M.A.; Atala, C.; Gianoli, E. Phenotypic plasticity and performance of Taraxacum officinale (dandelion) in habitats of contrasting environmental heterogeneity. Biol. Invasions 2010, 12, 2277–2284. [Google Scholar] [CrossRef]
  64. Muhanguzi, H.D.R.; Obua, J.; Oryem-Origa, H.; Vetaas, O.R. Tree fruiting phenology in Kalinzu Forest, Uganda. Afr. J. Ecol. 2003, 41, 171–178. [Google Scholar] [CrossRef]
  65. Pol, R.G.; Pirk, G.I.; Marone, L. Grass seed production in the central Monte desert during successive wet and dry years. Plant Ecol. 2010, 208, 65–75. [Google Scholar] [CrossRef]
  66. Zhang, F.; Quan, Q.; Song, B.; Sun, J.; Chen, Y.; Zhou, Q.; Niu, S. Net primary productivity and its partitioning in response to precipitation gradient in an alpine meadow. Sci. Rep. 2017, 7, 15193. [Google Scholar] [CrossRef]
  67. Perring, M.P.; Hovenden, M.J. Seedling survivorship of temperate grassland perennials is remarkably resistant to projected changes in rainfall. Aust. J. Bot. 2012, 60, 328–339. [Google Scholar] [CrossRef]
  68. Koster, R.D.; Dirmeyer, P.A.; Guo, Z.; Bonan, G.; Chan, E.; Cox, P.; Gordon, C.T.; Kanae, S.; Kowalczyk, E.; Lawrence, D.; et al. Regions of Strong Coupling Between Soil Moisture and Precipitation. Science 2004, 305, 1138–1140. [Google Scholar] [CrossRef]
  69. Hopkins, F.; Gonzalez-Meler, M.A.; Flower, C.E.; Lynch, D.J.; Czimczik, C.; Tang, J.; Subke, J.-A. Ecosystem-level controls on root-rhizosphere respiration. New Phytol. 2013, 199, 339–351. [Google Scholar] [CrossRef]
  70. Brant, A.N.; Chen, H.Y. Patterns and Mechanisms of Nutrient Resorption in Plants. Crit. Rev. Plant Sci. 2015, 34, 471–486. [Google Scholar] [CrossRef]
  71. Yan, X.; Wang, S.; Duan, Y.; Han, J.; Huang, D.; Zhou, J. Current and future distribution of the deciduous shrub Hydrangea macrophylla in China estimated by MaxEnt. Ecol. Evol. 2021, 11, 16099–16112. [Google Scholar] [CrossRef]
  72. Xin, X.-F.; Nomura, K.; Aung, K.; Velásquez, A.C.; Yao, J.; Boutrot, F.; Chang, J.; Zipfel, C.; He, S.Y. Bacteria establish an aqueous living space in plants crucial for virulence. Nature 2016, 539, 524–529. [Google Scholar] [CrossRef]
  73. Zhang, K.; Sun, L.; Tao, J. Impact of Climate Change on the Distribution of Euscaphis japonica (Staphyleaceae) Trees. Forests 2020, 11, 525. [Google Scholar] [CrossRef]
  74. Li, Z.; Han, H.; You, H.; Cheng, X.; Wang, T. Effects of local characteristics and landscape patterns on plant richness: A multi-scale investigation of multiple dispersal traits. Ecol. Indic. 2020, 117, 106584. [Google Scholar] [CrossRef]
  75. Swenson, N.G.; Anglada-Cordero, P.; Barone, J.A. Deterministic tropical tree community turnover: Evidence from patterns of functional beta diversity along an elevational gradient. Proc. R. Soc. B Biol. Sci. 2011, 278, 877–884. [Google Scholar] [CrossRef] [PubMed]
  76. Li, X.; Zhang, L.; Luo, T. Rainy season onset mainly drives the spatiotemporal variability of spring vegetation green-up across alpine dry ecosystems on the Tibetan Plateau. Sci. Rep. 2020, 10, 8797. [Google Scholar] [CrossRef]
  77. Ren, Z.S. The effects of climate on the growth of Meconopsis seedlings in Kunming. Acta Bot. Yunnanica 1993, 15, 110–112. [Google Scholar]
  78. Still, S.; Kitto, S.; Swasey, J.; Harbage, J. Influence of Temperature on Growth and Flowering of Four Meconopsis Genotypes. Acta Hortic. 2003, 620, 289–298. [Google Scholar] [CrossRef]
  79. Willig, M.R.; Kaufman, D.M.; Stevens, R.D. Latitudinal Gradients of Biodiversity: Pattern, Process, Scale, and Synthesis. Annu. Rev. Ecol. Evol. Syst. 2003, 34, 273–309. [Google Scholar] [CrossRef]
  80. Behera, M.D.; Roy, P.S.; Panda, R.M. Plant species richness pattern across India’s longest longitudinal extent. Curr. Sci. India 2016, 111, 1220–1225. [Google Scholar] [CrossRef]
  81. O’Brien, E.M. Climatic Gradients in Woody Plant Species Richness: Towards an Explanation Based on an Analysis of Southern Africa’s Woody Flora. J. Biogeogr. 1993, 20, 181–198. [Google Scholar] [CrossRef]
  82. Chou, C. Land–sea heating contrast in an idealized Asian summer monsoon. Clim. Dyn. 2003, 21, 11–25. [Google Scholar] [CrossRef]
  83. Carpenter, C. The environmental control of plant species density on a Himalayan elevation gradient. J. Biogeogr. 2005, 32, 999–1018. [Google Scholar] [CrossRef]
  84. Zhang, Y.-Z.; Qian, L.-S.; Chen, X.-F.; Sun, L.; Sun, H.; Chen, J.-G. Diversity patterns of cushion plants on the Qinghai-Tibet Plateau: A basic study for future conservation efforts on alpine ecosystems. Plant Divers. 2021, 44, 231–242. [Google Scholar] [CrossRef]
  85. Shrestha, N.; Su, X.; Xu, X.; Wang, Z. The drivers of high Rhododendron diversity in south-west China: Does seasonality matter? J. Biogeogr. 2018, 45, 438–447. [Google Scholar] [CrossRef]
  86. Dong, S.K. Views on distinguishing the concepts of rangeland and grassland and proposing proper use of their terminology. Chinese J. Ecol. 2022, 41, 992–1000. [Google Scholar] [CrossRef]
  87. Nagamatsu, D.; Hirabuki, Y.; Mochida, Y. Influence of micro-landforms on forest structure, tree death and recruitment in a Japanese temperate mixed forest. Ecol. Res. 2003, 18, 533–547. [Google Scholar] [CrossRef]
  88. Palmer, M.W.; Dixon, P.M. Small-scale environmental heterogeneity and the analysis of species distributions along gradients. J. Veg. Sci. 1990, 1, 57–65. [Google Scholar] [CrossRef]
  89. Guo, Q.; Kelt, D.A.; Sun, Z.; Liu, H.; Hu, L.-J.; Ren, H.; Wen, J. Global variation in elevational diversity patterns. Sci. Rep. 2013, 3, 03007. [Google Scholar] [CrossRef]
  90. Manish, K.; Pandit, M.K.; Telwala, Y.; Nautiyal, D.C.; Koh, L.P.; Tiwari, S. Elevational plant species richness patterns and their drivers across non-endemics, endemics and growth forms in the Eastern Himalaya. J. Plant Res. 2017, 130, 829–844. [Google Scholar] [CrossRef]
  91. Pandey, B.; Nepal, N.; Tripathi, S.; Pan, K.; Dakhil, M.A.; Timilsina, A.; Justine, M.F.; Koirala, S.; Nepali, K.B. Distribution Pattern of Gymnosperms’ Richness in Nepal: Effect of Environmental Constrains along Elevational Gradients. Plants 2020, 9, 625. [Google Scholar] [CrossRef]
  92. Zhang, W.; Huang, D.; Wang, R.; Liu, J.; Du, N. Altitudinal Patterns of Species Diversity and Phylogenetic Diversity across Temperate Mountain Forests of Northern China. PLoS ONE 2016, 11, e0159995. [Google Scholar] [CrossRef]
  93. Miehe, G. Vegetation patterns on Mount Everest as influenced by monsoon and föhn. Vegetatio 1988, 79, 21–32. [Google Scholar] [CrossRef]
  94. Gao, J.; Liu, Y. Climate stability is more important than water–energy variables in shaping the elevational variation in species richness. Ecol. Evol. 2018, 8, 6872–6879. [Google Scholar] [CrossRef]
  95. Rai, H.; Upreti, D.K.; Gupta, R.K.; Rai, H. Diversity and distribution of terricolous lichens as indicator of habitat heterogeneity and grazing induced trampling in a temperate-alpine shrub and meadow. Biodivers. Conserv. 2012, 21, 97–113. [Google Scholar] [CrossRef]
  96. González-Tagle, M.A.; Schwendenmann, L.; Pérez, J.J.; Schulz, R. Forest structure and woody plant species composition along a fire chronosequence in mixed pine–oak forest in the Sierra Madre Oriental, Northeast Mexico. For. Ecol. Manag. 2008, 256, 161–167. [Google Scholar] [CrossRef]
  97. Zhang, Q.-P.; Wang, J.; Wang, Q. Effects of abiotic factors on plant diversity and species distribution of alpine meadow plants. Ecol. Inform. 2021, 61, 101210. [Google Scholar] [CrossRef]
  98. Burt, T.P.; Butcher, D.P. Topographic controls of soil moisture distributions. J. Soil Sci. 1985, 36, 469–486. [Google Scholar] [CrossRef]
  99. Dauber, J.; Hirsch, M.; Simmering, D.; Waldhardt, R.; Otte, A.; Wolters, V. Landscape structure as an indicator of biodiversity: Matrix effects on species richness. Agric. Ecosyst. Environ. 2003, 98, 321–329. [Google Scholar] [CrossRef]
  100. Marden, M.; Rowan, D.; Phillips, C. Stabilising Characteristics of New Zealand Indigenous Riparian Colonising Plants. Plant Soil 2005, 278, 95–105. [Google Scholar] [CrossRef]
  101. Gaston, K.J. Global patterns in biodiversity. Nature 2000, 405, 220–227. [Google Scholar] [CrossRef]
  102. Tsianou, M.A.; Koutsias, N.; Mazaris, A.D.; Kallimanis, A.S. Climate and landscape explain richness patterns depending on the type of species’ distribution data. Acta Oecologica 2016, 74, 19–27. [Google Scholar] [CrossRef]
  103. Katayama, N.; Amano, T.; Naoe, S.; Yamakita, T.; Komatsu, I.; Takagawa, S.-I.; Sato, N.; Ueta, M.; Miyashita, T. Landscape Heterogeneity–Biodiversity Relationship: Effect of Range Size. PLoS ONE 2014, 9, e93359. [Google Scholar] [CrossRef] [PubMed]
  104. Sun, L.; Luo, J.; Qian, L.; Deng, T.; Sun, H. The relationship between elevation and seed-plant species richness in the Mt. Namjagbarwa region (Eastern Himalayas) and its underlying determinants. Glob. Ecol. Conserv. 2020, 23, e01053. [Google Scholar] [CrossRef]
  105. Li, J.J. The Seed Plants Differentiation and It’s Response to the Uplifts in Himalayans. Ph.D. Thesis, Chengdu University of Technology, Chengdu, China, 2014. [Google Scholar]
  106. Boral, D.; Moktan, S. Predictive distribution modeling of Swertia bimaculata in Darjeeling-Sikkim Eastern Himalaya using MaxEnt: Current and future scenarios. Ecol. Process. 2021, 10, 26. [Google Scholar] [CrossRef]
Figure 1. The conceptual framework of the study.
Diversity 14 00661 g001
Figure 2. The presence points of Meconopsis species in the study area.
Diversity 14 00661 g002
Figure 3. The land-use type maps in the study area.
Diversity 14 00661 g003
Figure 4. Relationships between key predictor variables and probability of presence of (a) Meconopsis species, (b) M. integrifolia, (c) M. horridula, (d) M. racemose, and (e) M. punicea.
Diversity 14 00661 g004aDiversity 14 00661 g004bDiversity 14 00661 g004c
Figure 5. Potential geographic distributions of (a) Meconopsis species, (b) M. integrifolia, (c) M. horridula, (d) M. racemosa, and (e) M. punicea under current climate conditions in the study area. In this case, the probability of occurrence of Meconopsis species is categorized as low-, medium-, and high-suitable areas based on results of niche modeling.
Diversity 14 00661 g005
Figure 6. Spatial distribution of species richness of Meconopsis per 50 km × 50 km grid cell. (a) species richness distribution of each grid in the study area; (b) the distribution of species richness of Meconopsis in different vegetation.
Diversity 14 00661 g006
Figure 7. Species richness pattern of Meconopsis along the studied slope (a), latitudinal (b), longitudinal (c), elevational (d), and aspect (e) gradient.
Diversity 14 00661 g007
Figure 8. Ecological landscape index and species richness in each sub-region.
Diversity 14 00661 g008
Table 1. Environmental variables for modelling the habitat suitability for Meconopsis species and four typical species.
TypeVariable NameCodeData SourceUnitResolution
Bio-ClimaticAnnual Mean TemperatureBio1WorldClim°C30″
Mean Diurnal RangeBio2WorldClim°C30″
Isothermality (Bio2/Bio7) (×100)Bio3WorldClim°C30″
Temperature Seasonality (Standard Deviation × 100)Bio4WorldClim°C30″
Precipitation of Driest MonthBio14WorldClimmm30″
Precipitation Seasonality (Coefficient of Variation)Bio15WorldClim130″
Precipitation of Warmest QuarterBio18WorldClimmm30″
Precipitation of Coldest QuarterBio19WorldClimmm30″
TopographicElevationElevationWorldClimm30″
SlopeSlopeDEM°30″
AspectAspectDEM°30″
Table 2. Selected landscape indices and their ecological significance.
Landscape IndicesRange of ValueEcological Significance
Patch density index
(PD)
PD > 0It can reflect the degree of fragmentation of the landscape. The higher the value, the higher the degree of fragmentation.
Patch richness index
(PR)
PR >= 1It indicates the total number of all patch types in the landscape and is one of the key indicators of landscape components, as well as spatial heterogeneity, and has implications for many ecological processes.
Contagion index
(CONTAG)
0 < CONTAG <= 100It describes the degree of clustering or extension trend of different patch types in the landscape. Since this indicator contains spatial information, it is one of the most important indices to describe the landscape pattern. Generally, high spreading values indicate that some dominant patch types in the landscape form a good connectivity; conversely, it indicates that the landscape is a dense pattern with multiple elements and a high degree of fragmentation in the landscape.
Shannon’s diversity index
(SHDI)
SHDI >= 0An increase in SHDI indicates an increase in patch types or an equalizing trend in the distribution of each patch type in the landscape.
Table 3. Relative contribution (%) of environmental variables to the MaxEnt model output for (a) Meconopsis species, (b) M. integrifolia, (c) M. horridula, (d) M. racemosa, and (e) M. punicea.
VariableCodeabcde
Precipitation of Warmest QuarterBio1843.859.23637.743.6
Temperature SeasonalityBio4202.711.524.48.6
ElevationElevation13.51.811.84.48.5
Annual Mean TemperatureBio17.818.91016.77.5
Precipitation SeasonalityBio155.38.34.91.415.8
IsothermalityBio33.90.210.24.31.4
SlopeSlope2.62.35.42.42.3
Mean Diurnal RangeBio21.50.63.71.63.2
Precipitation of Driest MonthBio141.10.440.34.9
Precipitation of Coldest QuarterBio190.35.51.64.42.6
AspectAspect0.10.312.41.6
Table 4. The areas of different suitable habitat of Meconopsis species based on model predictions under current climate scenario. (Unit: 103 km2).
Probability of OccurrenceMeconopsisM. integrifoliaM. horridulaM. racemosaM. punicea
Unsuitable (<25%)3049.073361.653038.573761.984059.79
Low suitable (25–50%)944.89672.12920.74453.50231.63
Medium suitable (50–75%)462.92424.07486.94226.99152.11
High suitable (>75%)10.119.1420.7224.5123.45
Table 5. Elevational pattern in species potential distribution in climate change scenarios under current climate conditions, in regions exhibiting high, medium, and low probability of species occurrence. All values in meters above mean sea level. (a: Meconopsis, b: M. integrifolia, c: M. horridula, d: M. racemosa, e: M. punicea).
SpeciesLow Suitable (25–50%)Medium Suitable (50–75%)High Suitable (>75%)
Mean ± SDMinMaxMean ± SDMinMaxMean ± SDMinMax
a4111 ± 791201459833586± 737204949884194 ± 14240434424
b4139 ± 760203359833628 ± 713204949253620 ± 36732794122
c4265 ± 807204959534027 ± 643212654064118 ± 54025994617
d3877 ± 766204951423718 ± 647205847073697 ± 39129284259
e4084 ± 565218049583817 ± 454232646463234 ± 48422373677
Publisher’s Note: MDPI stays neutral with regard to jurisdictional claims in published maps and institutional affiliations.

