Article

The First Complete Chloroplast Genome Sequence and Phylogenetic Analysis of Pistachio (Pistacia vera)

1
Department of Plant Production and Genetic (Biotechnology), College of Agriculture, Jahrom University, Jahrom P.O. Box 74135-111, Iran
2
USDA Forest Service, Hardwood Tree Improvement and Regeneration Center (HTIRC), Department of Forestry and Natural Resources, Purdue University, West Lafayette, IN 47907, USA
3
Department of Evolution, Ecology, and Organismal Biology, The Ohio State University, Columbus, OH 43210, USA
4
Ohio Biodiversity Conservation Partnership, The Ohio State University, Columbus, OH 43210, USA
*
Authors to whom correspondence should be addressed.
Diversity 2022, 14(7), 577; https://doi.org/10.3390/d14070577
Submission received: 28 April 2022 / Revised: 8 July 2022 / Accepted: 9 July 2022 / Published: 18 July 2022
(This article belongs to the Special Issue Feature Papers in Plant Diversity)

Abstract

:
Pistachio is one of the most economically important nut crops worldwide. However, there are no reports describing the chloroplast genome of this important fruit tree. In this investigation, we assembled and characterized the complete pistachio chloroplast sequence. The Pistacia vera chloroplast genome was 160,598 bp in size, similar to other members of Anacardiaceae (149,011–172,199 bp) and exhibited the typical four section structure, including a large single copy region (88,174 bp), a small single copy region (19,330 bp), and a pair of inverted repeats regions (26,547 bp). The genome contains 121 genes comprised of 87 protein-coding genes, 30 tRNA genes and 4 rRNA genes. Thirteen intron-containing genes were identified in the genome wherein two genes had more than two introns. The genomic patterns of GC content resembled those for other Anacardiaceae. P. vera displayed the highest number of simple sequence repeats (SSRs) among the genera studied, which may be useful for molecular marker development and future population studies. Amino acid analysis revealed that Leucine is the most frequent (10.69%) amino acid in the chloroplast genome followed by Isoleucine (8.53%) and Serine (7.77%). Cysteine (1.30%) and Tryptophan (1.74%) were the least frequent amino acids. Phylogenetic analysis revealed P. vera is most like its taxonomically close relative P. weinmaniifolia, followed by Rhus chinensis; all placed taxonomically in the tribe Rhoeae. Members of Anacardiaceae were most closely related to Rhoeae, followed by members of Spondieae. The reports of this chloroplast genome will be useful for future conservation studies, genetic evaluation and breeding of P. vera, and more comprehensive phylogenetic analysis of the Pistacia species and its closely-related genera.

1. Introduction

Pistachio (Pistacia vera L.), a deciduous nut species, is the most economically important member of the Anacardiaceae family, with at least eleven species [1]. This diploid (2n = 2x = 30), dioecious, wind-pollinated fruit species is believed to originate from the Iranian plateau region spanning from northeast Iran to north Afghanistan and the central Asian republic [2]. Wild pistachio forests still exist in northeast Iran [3]. P. atlantica subsp. mutica and P. khinjuk are closely related to pistachio, but are mainly used as P. vera rootstocks and are naturally distributed throughout Iran, primarily in the Zagros Mountain range [3,4]. As the main center of pistachio origin, Iran has the largest pistachio cultivation area in the world. According to available statistics, the United States, Iran, and China are the three main producers of this nut crop, respectively [5]. Boasting a considerable number of branched and essential amino acids, vitamins, unsaturated fatty acids, antioxidant compounds, and additional minerals, pistachio is superior to other nut bearing species and is a healthy food source, rich in beneficial nutrients [6]. In addition to its nutritional benefits, pistachio is considered an economically important nut species worldwide. Estimates of pistachio economic values indicated roughly $2.811 billion of pistachio are exported around the world annually [7]. The United States and Iran lead with pistachio exports appropriating 32.2% ($1.084 billion) and 24.43% ($686 million) of total world exports, respectively [7].
Chloroplasts are oval, green organelles that are widely distributed in the cytoplasm of photosynthetic plant cells and contribute to the photosynthetic characteristics of the species. Chloroplasts, along with the nucleus and mitochondria, constitute the three main genetic systems in plant cells and are derived through endosymbiosis from co-evolution of cyanobacterium and ancient plants [8]. Although photosynthesis is considered to be the main role of these organelles, chloroplasts are also actively associated with other aspects of plant metabolism, including nucleotides, fatty acid, starch, phytohormones, pigment, vitamins, and amino acid synthesis [9]. Chloroplasts are also involved in the synthesis of several metabolites that play vital roles in plant defense against various biotic and abiotic stresses [10,11]. Chloroplasts are semi-autonomous and have independent genetic material, mostly encoding the genes involved in photosynthesis, transcription, and translation [12].
Due to the mono-parental nature of their inheritance, chloroplast genomes are highly valuable tools to investigate the molecular evolutionary and phylogenetic relationships of different plant lineages, as well as to estimate the effects of pollen and seeds on total gene flow [13].
Chloroplast genome sequences provide more reliable information about the phylogenetic relationship among different plant genera [14]. Chloroplast genomes have sufficient informative sites, which exhibit substantial variation either within or between plant species and enable scientists to improve their knowledge about the phylogeny and evolutionary adaption of different taxa [15,16,17]. The whole chloroplast sequence is a highly valuable tool for providing insights into the phylogenetic relationships among different plant lineages [18,19]. In addition, maternal inheritance of the chloroplast genome, and lack of cross recombination, make this subcellular organelle a good platform for genetic engineering studies.
The size of chloroplast DNA (cpDNA) is variable among different plant species. According to available records, Cathaya argyrophylla has the smallest chloroplast genome size (107 kb), while Pelargonium has the largest (218 kb) [15]. Despite the overall high variation in size, chloroplast genomes are highly conservative and have similar structural organization, including gene content and gene order, in different plant species [20]. This circular, double-stranded DNA molecule comprises of four sections, including two copies of inverted repeats (IRs) with the same length (20–28 kb) that separate the large single copy (LSC) (80–90 kb) and the small single copy (SSC) (16–27 kb) regions [15]. The cpDNA contains 110–130 genes that are involved in photosynthesis and gene expression (about 80 genes), as well as translation (4 rRNAs and 30 tRNAs) with overall conservation in their composition and arrangement [15]. However, there is considerable diversity in regulatory sequences of non-coding intergenic spacer regions, as well as occurrence of structural rearrangements, point mutation, gene/intron gains and losses, translocations, IR expansion and inversions, and insertion loss among different species [15,21]. This small variability in the chloroplast genome provides a valuable resource for investigation of plant phylogenetic and evolutionary events. Moreover, in cpDNA there are many repeated sequences, such as simple sequence repeats (SSRs), homo-polymeric repeats and long repeats, which can serve as a good source for designing molecular markers, one of the powerful tools for the evaluation of population genetic structures and phylogenetic relationships among different samples [22].
Despite being one of the most economically important nut species across the world, pistachio has not been subjected to comprehensive sequencing and there is no chloroplast sequence information about this plant species. In this study, we assembled, described, and characterized the complete chloroplast genome sequence of Pistacia vera. In addition, we compared and analyzed the chloroplast sequence of pistachio with other known chloroplast genomes, including those of its closely related species to determine their phylogenetic relationships. Results of the present study should provide good information about the phylogenetic relationship of the Pistacia species, as well as providing a theoretical basis for genetic improvement of this important nut crop.

2. Materials and Methods

2.1. Chloroplast Genome Assembly and Validation

Chloroplast genome data (paired-end read data, Illumina HiSeq 2000) was downloaded from the NCBI database (SRR4453367) [23]. The deposited sequences were derived from P. vera cv. ‘Siirt’ [23]. A multi-step pipeline involving the following was applied for assembly: Burrows-Wheeler aligner (bwa) [24]; Picard-tools, and Genome Analysis Tool-Kit (GATK) [25] and variant calling tools [26,27]. The pistachio chloroplast genome was used as a reference for chloroplast assembly.

2.2. Gene Annotation and Sequence Analysis

Structural features of the chloroplast genome were illustrated by OGDRAW v1.2 [28]. CpGAVAS [29] and DOGMA [30] were used to annotate the sequences, while analyses of sequence composition were performed by MEGA 6 software.

2.3. Simple Sequence Repeats (SSR) Analysis

MIcroSAtellite (MISA) was used to detect simple sequence repeats in the chloroplast genome of Pistacia and its closely-related genera [31]. The parameters for SSRs were set as follows: a minimum number of 10, 5, 4, 3, 3 and 3 repeat units was adjusted for identification of perfect mono-, di-, tri-, tetra-, penta-, and hexa-nucleotides motifs, respectively. In addition to the whole chloroplast genome, SSRs were separately analyzed in different regions of genomes.
Tandem repeat finder (https://tandem.bu.edu/trf/trf.submit.options.html, accessed on 27 April 2022) was used to identify tandem repeats in the chloroplast genomes. The alignment parameters were set 2 for match and 7 for indels and mismatch. Palindromic and forward repeats were detected by REPuter software [32]. The minimum sizes for repeat elements and the sequence identity were considered to be 30 bp and more than 90% (hamming distance of 3), respectively.

2.4. Phylogenetic Analysis

The phylogenetic analysis was performed using 17 complete chloroplast genomes, including P. vera and its 14 closely related species, from the Sapindales order, as well as two outgroups, including Nicotiana tabacum, as a plant model, and Prunus davidiana, as a fruit tree species (Table 1). The chloroplast genomes were aligned with clustalW [33] and a neighbor-joining tree was created with Geneious software [34]. The genetic differences among chloroplast genomes were computed using Geneious software [34]. All sequences were obtained from the NCBI Organelle Genome and Nucleotide Resources database where complete sequences were used to analyze their affinity.

3. Results

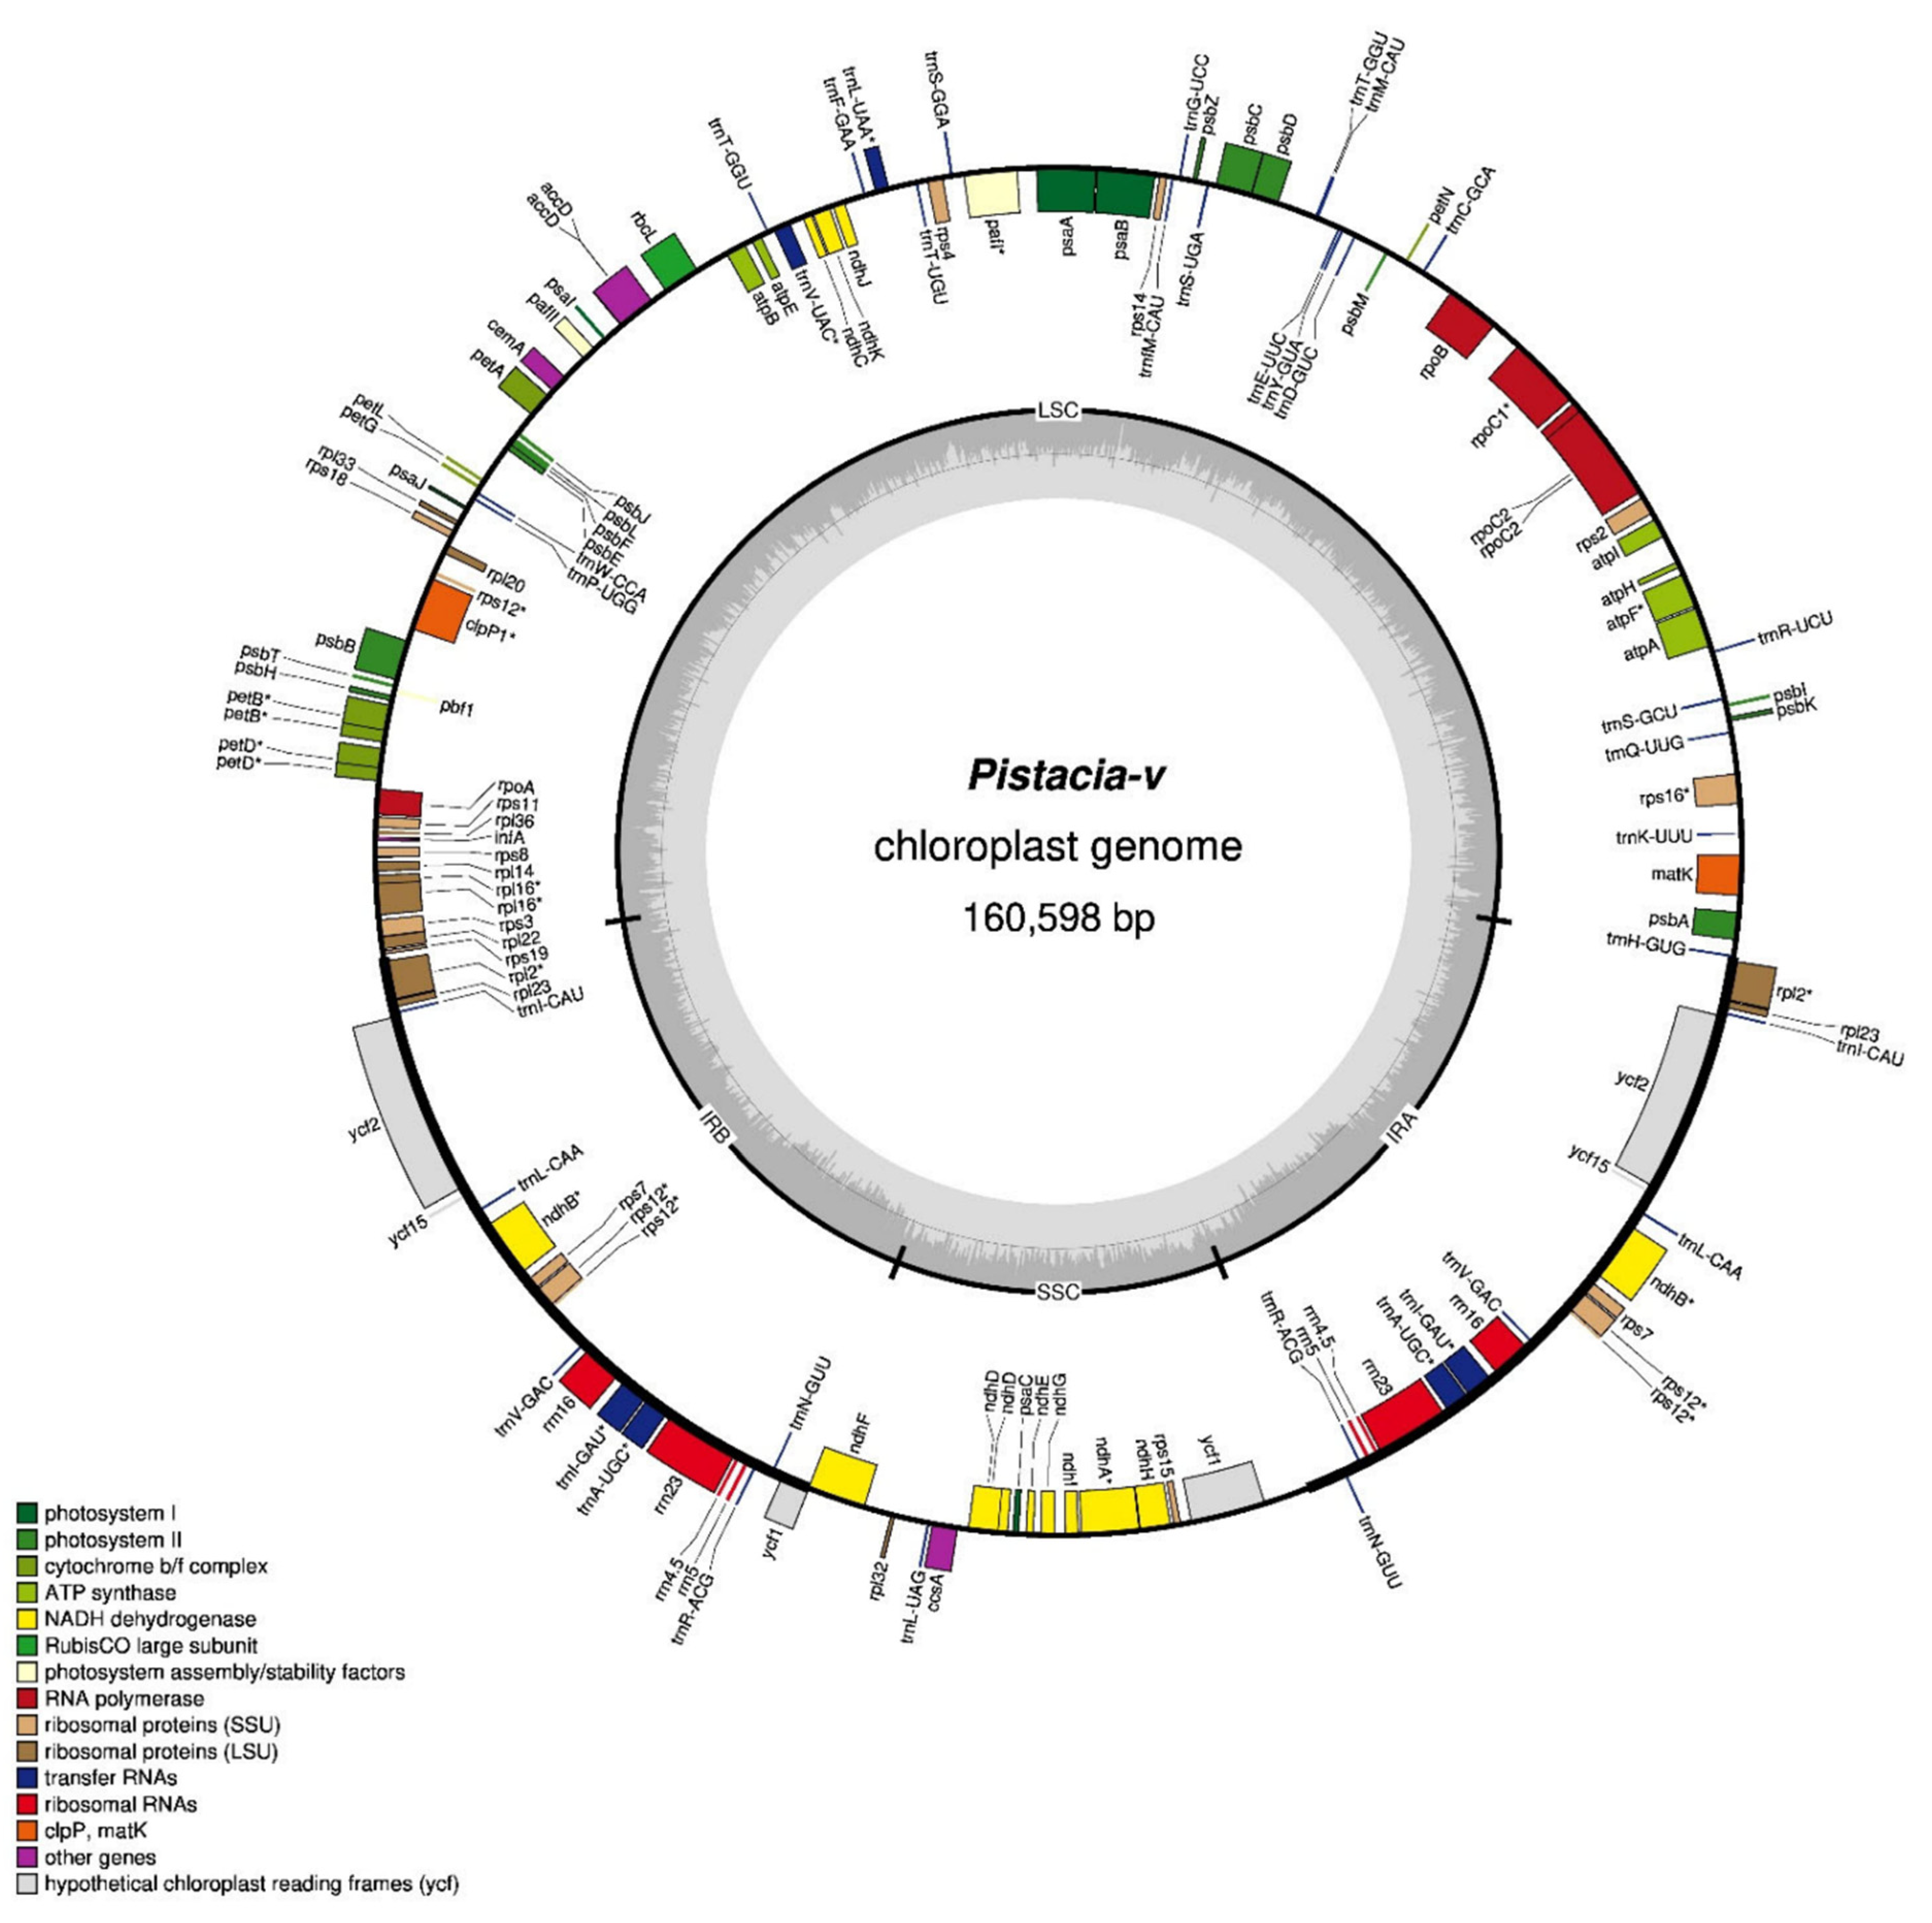
3.1. Structural Features of P. vera Chloroplast Genome

The Pistacia vera chloroplast genome is 160,598 bp in length with a typical quadruple structure comprising of an LSC region (88,174 bp; 54.90%), an SSC section (19,330 bp; 12.04%) and two IR regions (26,547 bp; 33.06%) (Figure 1). Within the genome, 121 genes were recognized, among which 18 genes were duplicated in the invert repeat regions, making a total number of 139 genes (Table 2). These genes included 4 rRNA genes, 30 tRNA genes and 87 protein-coding genes. Among the 87 protein-coding genes, photosynthesis-related genes were the most prevalent (43 genes), followed by proteins for subunits of ribosomal proteins (21 genes) and RNA polymerase-coding genes (4 genes). Ten protein-coding genes were categorized as genes with other functions, including protease, translational initiation factor, maturase, subunit acetyl-CoA-carboxylase, envelope membrane protein, c-type cytochrome synthesis gene, and four hypothetical open reading frames. Most of the predicted genes (90 genes) were localized to the LSC region. All of the rRNA genes and 10 tRNA genes were among those localized to the IR regions, while most NADH dehydrogenase genes were in the SSC region.
The highest nucleotide proportion of the P. vera chloroplast genome was dedicated to protein coding genes (76,749 bp; 47.80%), followed by intergenic spacers (IGSs) (67,561; 42.06%), introns (9031 bp; 5.65%), rRNA (9048 bp; 5.62%) and tRNA (2897 bp; 1.80%) genes, respectively (Table 3). The overall chloroplast genome GC content was 37.87%. However, nucleotide distribution was highly variable among different parts of the P. vera chloroplast genome with IR regions having the highest GC content (42.94%), followed by LSC (33.13%) and SSC (32.36%). Nucleotide composition was also highly variable among different gene classes. The rRNA-related sequences had the highest GC content (54.52%) among the chloroplast genes, while intergenic regions (34.07%) and intron sequences (36.68%) had the lowest GC content, respectively (Table 3). The GC content of tRNA genes was also relatively high (52.50%), but much lower (38.56%) in the protein coding genes.
Thirteen intron-containing genes were identified in the P. vera chloroplast genome, including 10 protein-coding genes, two tRNA genes and one rRNA gene (Table 4). Among these genes, eleven contained one intron while clP and ycf3 genes had more than one intron. In addition, five intron-containing genes were duplicated in the inverted regions. The longest intron sequence (1124 bp) was recorded in the ndhA genes, the only intron-containing gene located in the SSC region.
The frequency of amino acid usage was inferred for the chloroplast genome of P. vera (Table 5). In general, 25,708 codons were identified in pistachio chloroplast genes. Based on the analysis of codon usage frequency, leucine was the most prevalent amino acid and comprised 2742 codons (10.69%) of amino acids, followed by isoleucine with 2195 (8.53%). Contrarily, cysteine (320 codons, 1.30%) and tryptophan (447 codons, 1.74%) were the two least frequent amino acids found in proteins coded by the P. vera chloroplast genome. ATT (isoleucine) was the most frequent codon (1072) among the codons of P. vera chloroplast genome.

3.2. Comparison of P. vera Chloroplast Genome to Other Members of Anacardiaceae

The P. vera chloroplast genome size was comparable to other Anacardiaceae (Table 6). Among the six Anacardiaceae family chloroplast genomes, Rhus chinensis and Anacardium occidentale were the smallest (149,011 bp) and largest (172,199 bp), respectively. However, P. vera size was most like P. weinmaniifolia (160,767 bp). Irrespective of the sequence length, the LSC was the most variable chloroplast genome region (Table 6), and Rhus chinensis and Anacardium occidentale had the longest (96,882 bp) and the shortest (87,727 bp) LSC regions, respectively. Accordingly, the LSC chloroplast region of Anacardiaceous showed the highest variation in GC content (SD = 3.27%) compared to other parts of the chloroplast genome. Compared with LSC, the SSC had lower variation and ranged from 19,330 bp in P. vera to 18,349 in M. indica. The length of IRs exhibited the greatest variation (SD = 11.98%) among different parts of the sequenced chloroplast genomes in Anacardiaceous and varied from 25,792 bp in M. indica to 33,474 bp in Rhus chinensis. The numbers of genes in the genome were also variable in these species and P. weinmaniifolia (131 genes) and M. indica (112 genes) had the maximum and minimum numbers of genes, respectively. The tRNA-related genes were the most variable among different gene classes in the genome and were the main cause of higher numbers of genes in this plant. However, rRNA gene numbers were the least variable (SD = 0) among different classes of chloroplast genes.

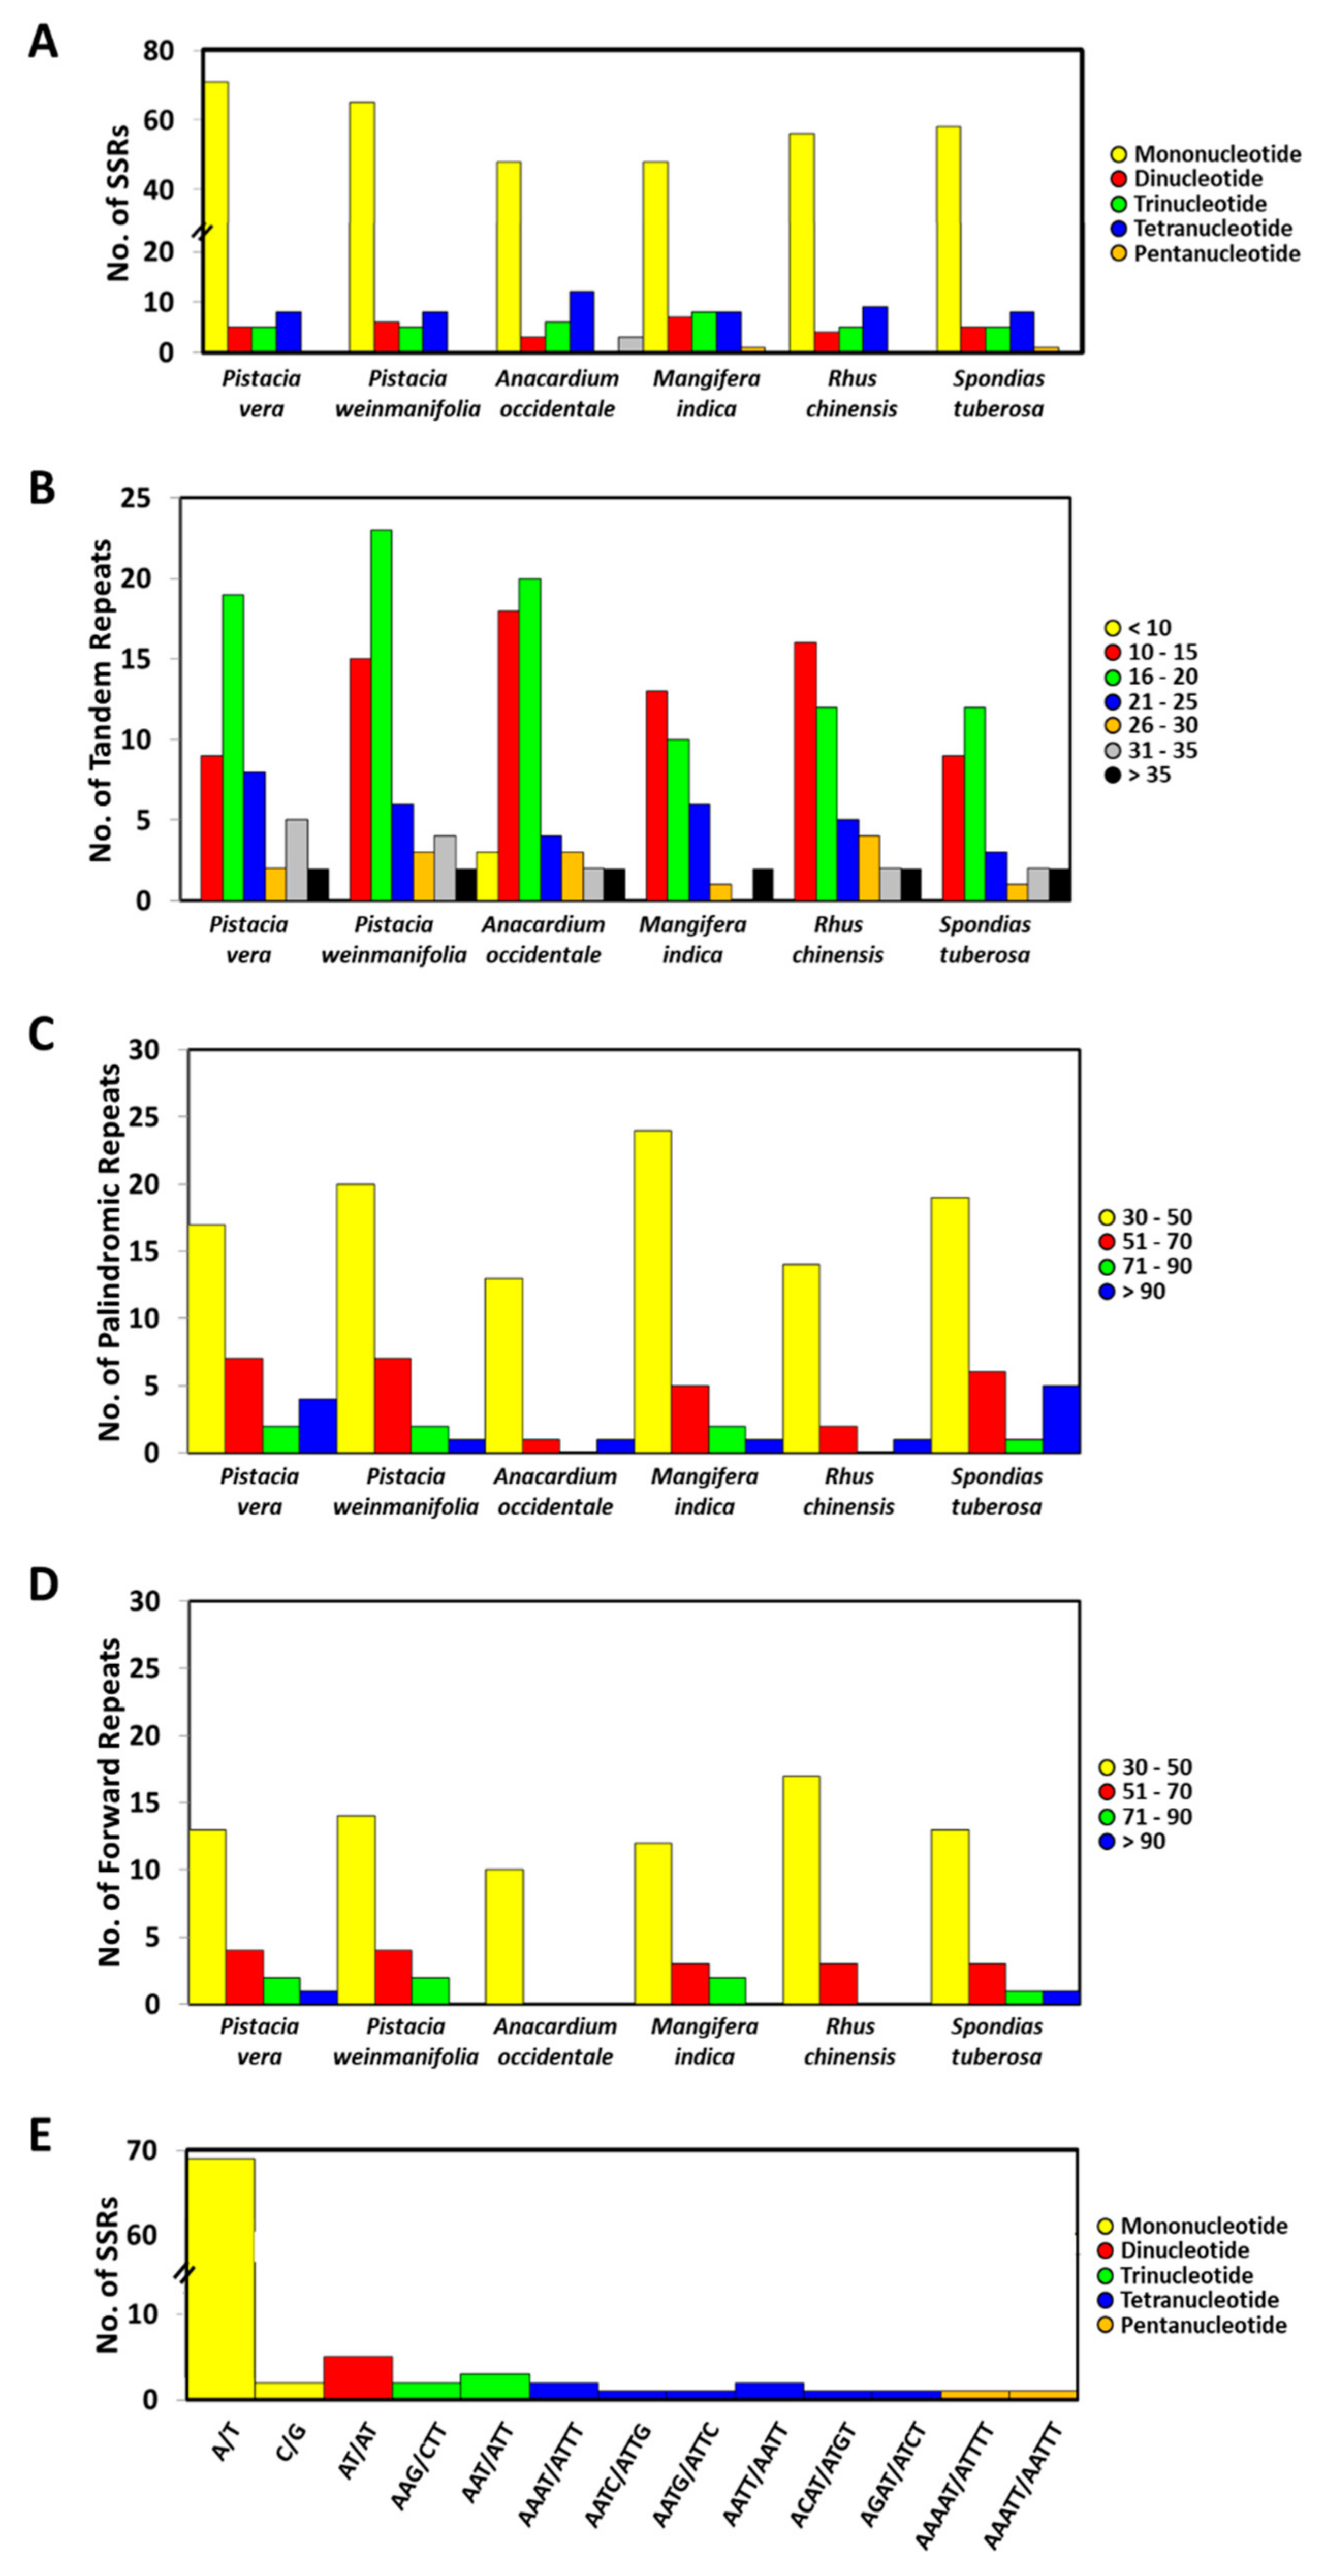
3.3. Repeat Sequences Analysis

The chloroplast genome of P. vera and its related genera were screened for SSR sequences. The number of SSRs in the chloroplast genomes of the six analyzed species varied from 72 (Anacardium occidentale) to 91 (Pistacia vera) (Table 6). Mononucleotide repeats were the most frequent motifs found in all analyzed genomes and comprised 66.67% (Anacardium occidentale) to 78.02% (Pistacia vera) of all SSR sequences, followed by tetranucleotide motifs (8.79–16.67%). Pentanucleotide SSRs were not detected in Anacardium occidentale and hexanucleotide repeats were not found in P. vera, P. weinmaniifolia and Rhus chinensis (Figure 2). The most frequent SSRs were A/T repeats that comprised 75.82% of the total SSRs identified in the pistachio chloroplast genome. In addition, the majority of SSRs (70.33%) were found in the LSC region. Intergenic spacer sequences had the highest SSR numbers (85.71%), followed by coding sequences (13.19%), and introns (4.4%). No SSRs were detected in tRNA and rRNA coding sequences.
The chloroplast genome of P. vera and its closely-related genera were also screened for long repeat sequences. Tandem repeats were the most frequent type of long repeats in the chloroplast of studied genera (Figure 2). Most (37.78%) tandem repeat sequences were in the range of 16–20 bp. The maximum (53) and the minimum (21) numbers of tandem repeats were detected in the Pistacia weinmaniifolia and Spondias tuberosa, respectively. Number of forward repeats varied from 10 (Anacardium occidentale) to 20 (P. vera, P. weinmaniifolia and Rhus chinensis) in the different genera studied, while palindromic repeats ranged from 17 (Rhus chinensis) to 32 (Mangifera indica) (Figure 2). Lengths of many forward (75.24%) and palindromic (69.03%) repeats were in the range of 30–50 bp. There were 20 forward, 30 palindromic and 45 tandem repeats in the chloroplast genome of P. vera. The chloroplast genome of Pistacia weinmaniifolia, also had the same number of forward (20) and palindromic repeats (30) as the P. vera; however, the tandem repeats were more prevalent in the chloroplast genome of P. weinmaniifolia, compared with P. vera (53).

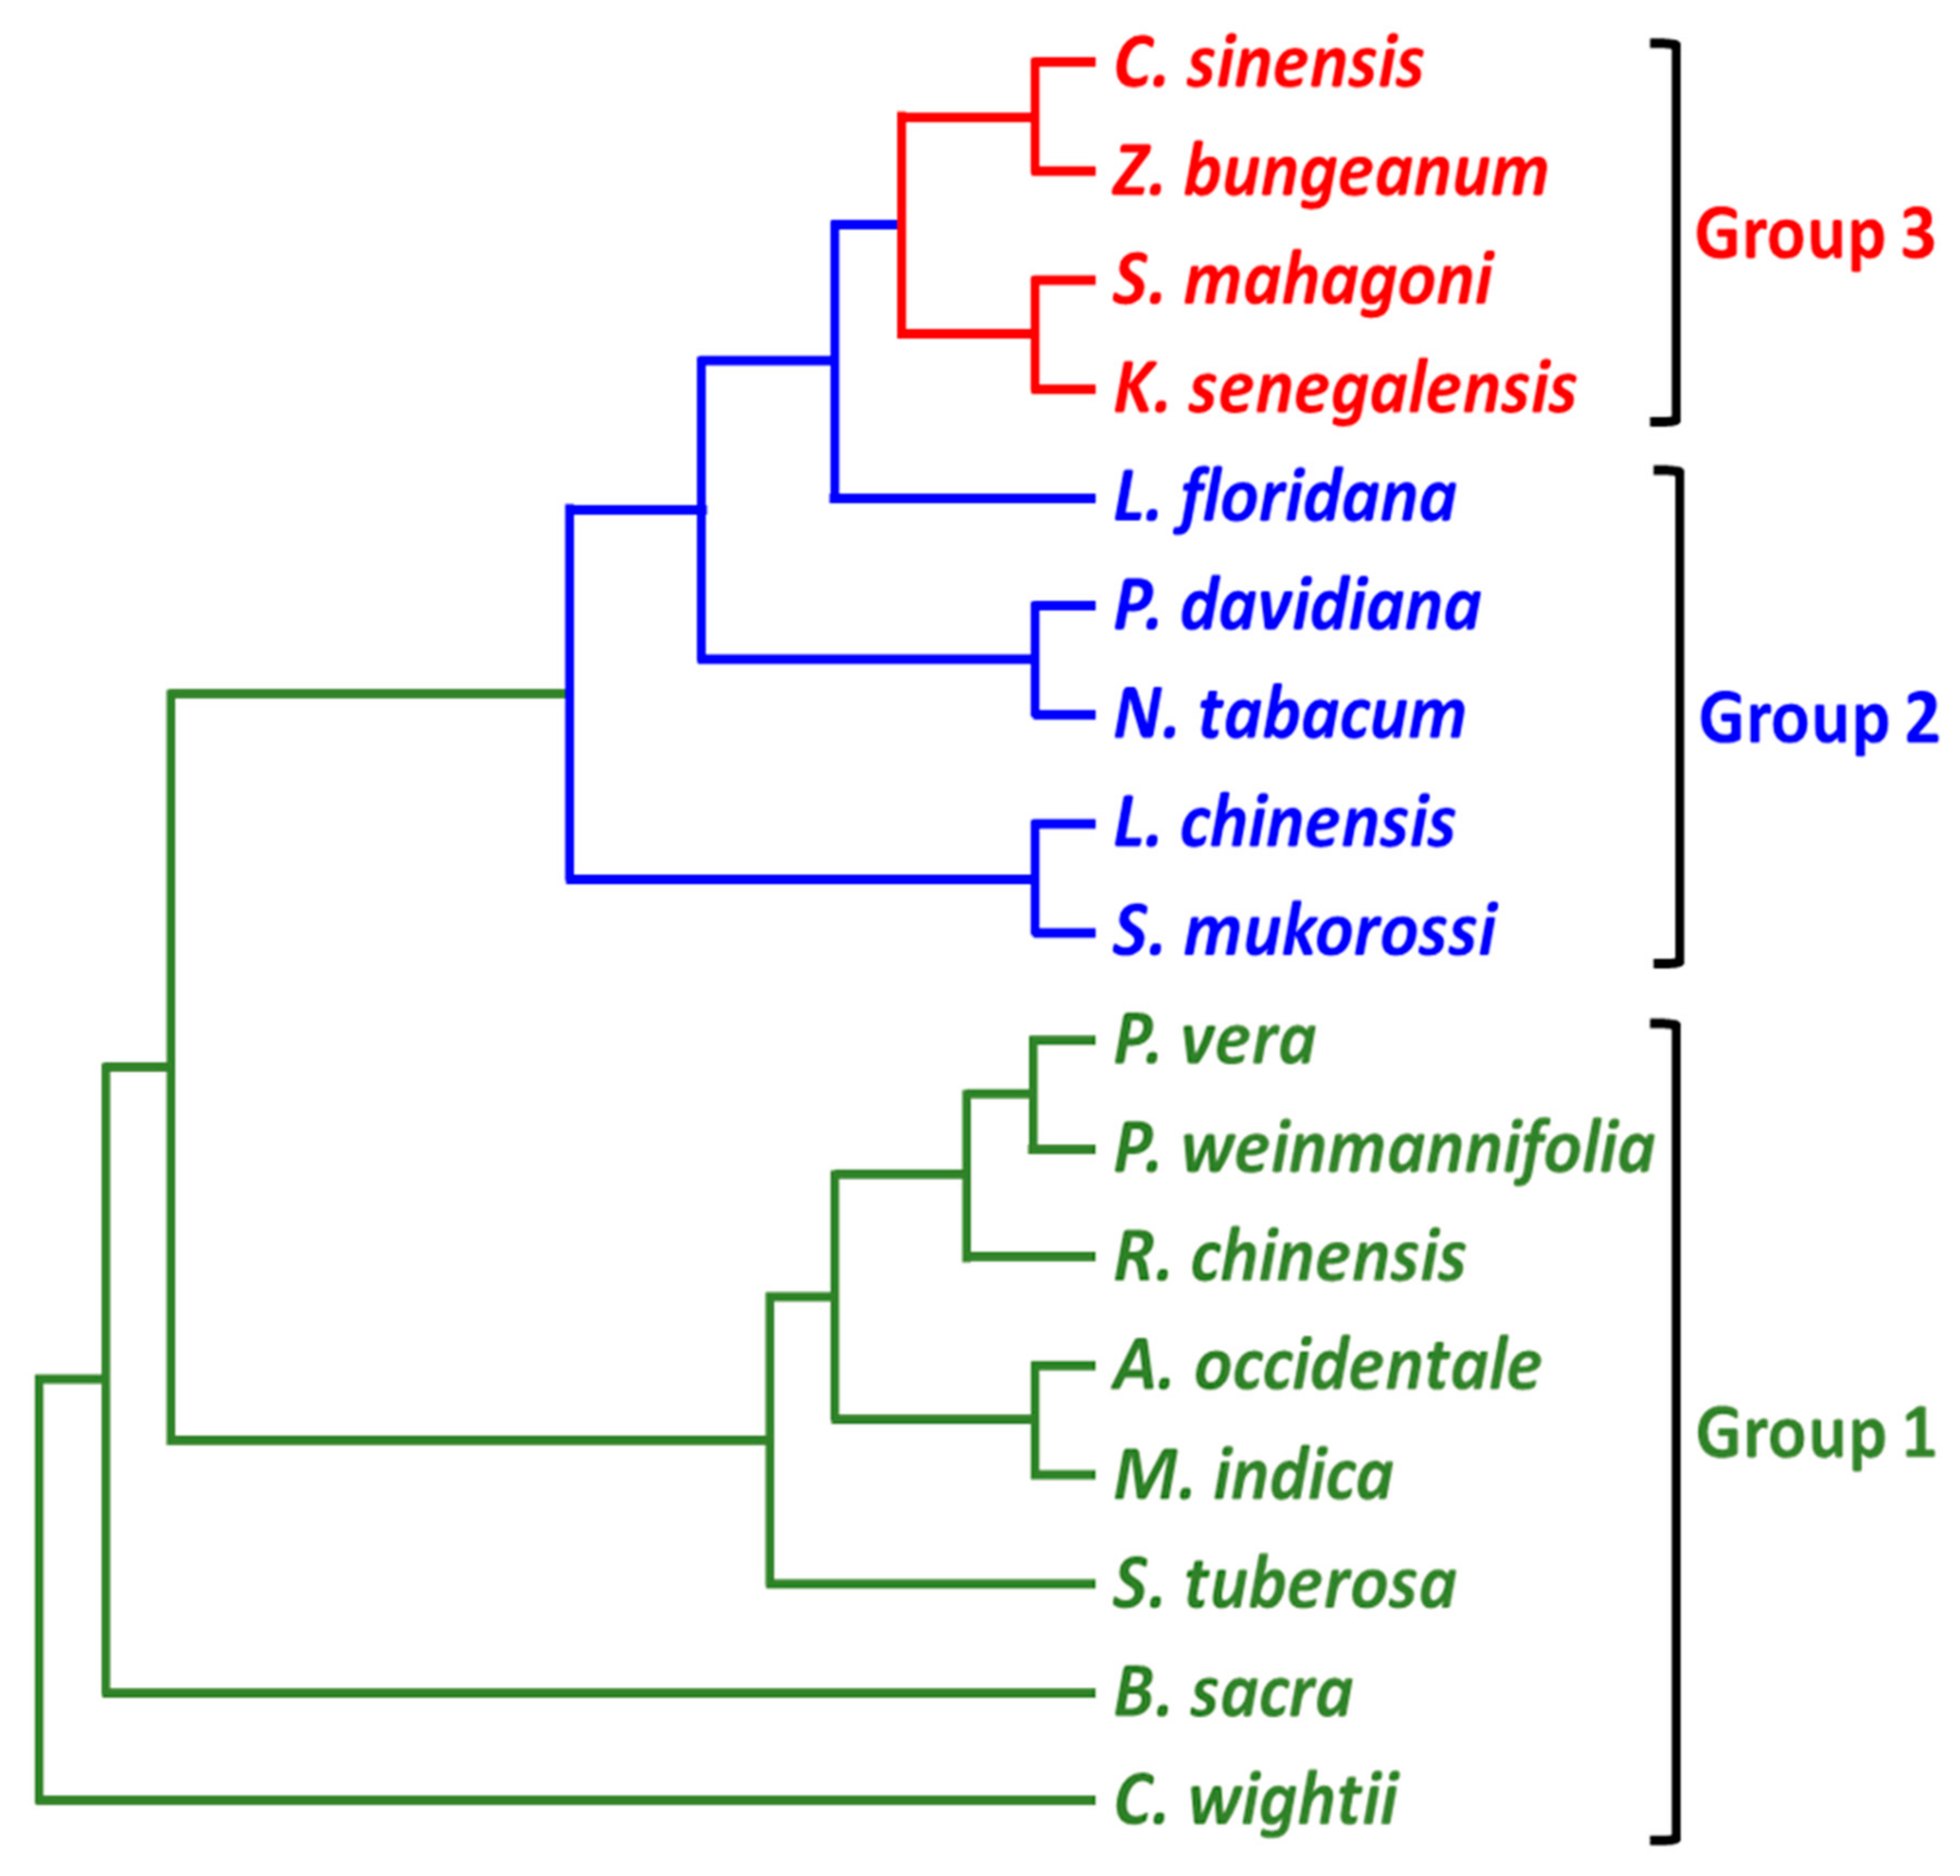
3.4. Phylogenetic Analysis

To build a phylogenetic tree (Figure 3), the complete chloroplast genome of P. vera was compared with 14 chloroplast sequences of other members of the Sapindales order published in NCBI (Table 6). In addition to the species in the Sapindales order, Nicotiana tabacum and Prunus davidiana from Solanaceae and Rosaceae were used as outgroup samples. Based on cluster analysis, all 17 chloroplast genomes were divided into three main groups. The first group consisted of six Anacardiaceae members (P. vera, P. weinmannifolia, Rhus chinensis, Anacardium occidentale, Mangifera indica, Spondias tuberosa) and two members of Burseraceae (Commiphora wightii and Boswellia sacra). Two members of Meliaceae (Khaya senegalensis and Swietenia mahagoni) and two members of Rutaceae (Citrus sinensis and Zanthoxylum bungeanum) were clustered together. Two members of Sapindaceae (Litchi chinensis and Sapindus mukorossi), along with Leitneria floridana from the Simaroubaceae family, were clustered with Nicotiana tabacum (Solanaceae) and Prunus davidiana (Rosaceae); two outgroup samples were used in this analysis. According to the generated tree, P. vera clustered with three other members of Anacardiaceae, from which the complete sequences of chloroplast were available in NCBI. However, P. vera was closest to Pistacia weinmannifolia. These two species, along with Rhoeae tribe member, Rhus chinensis, formed a sub-cluster, separate from other Anacardiaceae members, including the Anacardieae and Spondieae tribes.
As expected, the two outgroup samples were completely distinct and separated from other members of the Sapindales order. These two genera showed the highest genetic differences within Sapindales (Supplementary Table S1). Nicotiana tabacum was the species most distinct from P. vera (genetic dissimilarity = 0.085), followed by Prunus davidiana (0.075) (Supplementary Table S1). However, Prunus davidiana, as a tree species sample, showed higher genetic similarity with members of Sapindales order than herbaceous Nicotiana tabacum.

4. Discussion

4.1. Structural Features of P. vera Chloroplast Genome

Information about the organization and evolution of chloroplast genomes is beneficial, both for improving plant yield and for providing more accurate insights into plant phylogeny. In this study, the chloroplast genome of P. vera was assembled using high throughput next generation sequences. The complete chloroplast genome of P. vera is 160,598 bp, which is within the range of chloroplast genomes of other angiosperm plants [15]. The chloroplast genome of P. vera is highly conserved and is composed of a four-section circular DNA with similar structure, gene content, and order with other angiosperms [47,48,49,50]. Inverted repeat sections were the most size-variable (SD = 11.01%) chloroplast genome regions among different members of the Sapindales order. Expansion and contraction of invert repeat sections is considered the main reason for variation in the length of the chloroplast genome [51].
GC content is an important index for determining kinship relationships among different species [52,53]. P. vera chloroplast GC content resembled that of other genera within Anacardiaceae and was most similar to M. indica. As was typical in other plant chloroplast genomes, the highest GC content was detected in the IR regions [54]. This could be attributed to the high numbers of rRNA and tRNA genes that are aggregated in these regions [55,56].
Intron containing gene numbers were lower in the P. vera compared with other closely-related species and two genes clP and ycf3, had more than one intron. Finding multiple introns for clp and ycf3 was also disclosed in studies of other chloroplast genomes [48,49,50,54]. It has been reported that ycf3 is required for stable accumulation in the photosystem I complex [57] and the additional introns may be beneficial for studies of photosynthesis evolution [54].
Amino acid codons were highly biased towards a specific codon in P. vera chloroplast genome sequences. Codon degeneracy has an important biological role in higher organisms and can decrease the detrimental effects of point mutations [58,59,60]. On the other hand, uneven codon distribution of certain amino acids in the genome indicates nucleotide mutation is not random and there exists mutation preference and selective pressure, resulting in synonymous codon usage bias [47]. As noted in reports of nucleic acid composition for other angiosperm plants [47,49,50,54], codons ending in amino acids A and U(T) were most prevalent in synonymous codons and represented the highest value for relative synonymous codon usage (RSCU). An informative indicator to calculate level of codon preference, RSCU values ranged from 0.35 (AGC of serine) to 1.83 (TTA of leucine). RSCU index values may vary from 0.09 to 1.92 [61] and codon preference can be categorized into four groups, including no preference (RSCU ≤ 1.0), low preference (1.0 < RSCU ˂ 1.2), moderate preference (1.2 ˂ RSCU ˂ 1.3) and intense preference (RSCU > 1.3) [47]. Of the 64 codons responsible for coding 20 amino acids in the P. vera plastid genome, 20 showed high preference (RSCU > 1.3) and 6 showed moderate preference (1.2 ˂ RSCU ˂ 1.3). The amino acids tryptophan and methionine showed no codon preference (RSCU = 1.0). Most amino acids with multiple codons were highly biased towards one or two A/T ending codons, except phenylalanine, which showed moderate preference. Codon preference is highly pervasive among different plant genes and is considered the primary reason for sequence conservation among chloroplast genes in different plants [47].

4.2. Repeat Sequences

Repetitive sequences are highly important in the recombination and rearrangement of the chloroplast genome, as they promote genetic variation through slipped strand mispairing during DNA replication [62] and illegitimate recombination [17,22,63]. SSRs are a valuable tool for phylogenetic analysis, ecological studies, distinguishing between closely-related plant species, and plant breeding [64]. With a highly polymorphic nature or copy number variation, repetitive elements serve as powerful molecular markers for genetic diversity, phylogenetic and population genetic studies [49,65,66]. Most previous phylogenetic investigations in plant species were conducted using a small number of loci, which may be insufficient for precise understanding of evolutionary relationships, especially at low taxonomic levels and in controversial plant species [16,48]. In the present study, 91 SSRs were detected in the P. vera chloroplast genome which was higher than other closely related taxa, with poly A/T repeats being the most frequent repeat units. Most previous reports indicated mononucleotide SSRs as more common in the chloroplast genome of different plant lineages with a strong A/T bias in their base composition [48,49,50,54]. No six-nucleotide repeats were detected in three Rhoeae tribe members, which indicates the presence of pattern similarities among repeat units of closely related species.
In accordance with previous reports, most chloroplast SSRs were in the intergenic spacer regions, and only about 13% of detected SSRs were in the coding sequences. These observations support the idea that intergenic spacer regions are highly variable and crucial hotspots for reconfiguration of the chloroplast genome [52]. According to Eguiluz et al. [67], SSRs in the non-coding sequences of chloroplasts are usually short mononucleotide repeats and are highly intraspecific variables in repetitive units.
Considering chloroplast SSRs are informative molecular markers for genetic evaluation of phylogenetic relationships, some of the detected SSR loci will be extremely useful for genetic diversity studies in P. vera. Use of SSRs may improve discrimination efficiency among controversial taxonomic classifications of P. vera and its close relatives, such as P. khinjuk, P. atlantica, P. lentiscus, and P. integerrima [68], and, subsequently, may increase the power of interspecific discriminating, possibly in combination with other nuclear genomic SSRs.

4.3. Phylogenetic Reconstruction

Chloroplast genomes provide a good platform for resolving controversial phylogenetic relationships among different species, even at lower taxonomic levels [16,17]. Approaches such as morphological resemblance, molecular markers, and different barcode systems have been used to assign uncertain genera to proper families. In fact, many previous phylogenetic analyses were conducted based on a small number of loci, which were insufficient for delineating accurate phylogenetic relationships, especially for closely related species [48]. However, development of next generation sequencing technologies has expedited sequencing and assemblage of plastid genomes from varied plant species, compared to traditional sequencing methods. These advancements have enabled researchers to assign controversial species to their appropriate genera and species more accurately.
Phylogenetic analysis based on the complete chloroplast sequence of P. vera and its relatives revealed this species is most closely-related to P. weinmannifolia. Pistacia is genetically most like the Rhus genus. These two genera are placed in the Rhoeae tribe within Anacardiaceae. Our results were consistent with those of previous phylogenetic studies, based on nuclear markers, plastid DNA barcodes, and chloroplast genome sequences, which describe Rhus as a sister group of Pistacia [35,69]. Moreover, our results revealed Rhoeae is more closely-related to Anacardieae than Spondieae, two other tribes in the Anacardiaceae family. Based on morphological differences, special features of flower structure, pollen, and flower style, it has been suggested that Pistacia be separated from Anacardiaceae and placed into Pistaciaceae instead [69]. As low taxon sampling may result in differing cluster topology [67], supplementary studies with additional samples from various tribes within Anacardiaceae are needed to obtain a more reliable picture of phylogenetic relationships among the tribes in this family. Incidentally, all members of Anacardiaceae formed a highly supported clade in the cluster analysis.
We used previously sequenced chloroplast genomes from different families in Sapindales to investigate among-family relationships. Based on the phylogenetic analysis, the Anacardiaceae family is more similar to Burseraceae than other families in Sapindales, including Sapindaceae, Simaroubaceae, Meliaceae and Rutaceae. The chloroplast sequence divergence among the three main groups in this cluster was substantial, representing high genetic dissimilarities between different members of the main groups. However, we should bring to mind that great genetic diversity was reported among pistachio samples from different regions [3,70] and sequencing more pistachio cultivars, as well as its closely-related species, will shed more light on the phylogenetic relationships among Pistacia and its close genera.
Our results indicated two outgroup samples used in this study diverged from Sapindales members and formed an individual clade. Notably, these two outgroups were genetically similar to some Sapindales order members and clustered with Simaroubaceae and Sapindaceae family members. Sequences of the entire chloroplast genome may not reveal sufficient discrimination among highly similar species, and, therefore, informative loci from the nuclear genome should also be included for evolutionary analysis of young lineages [71].
Altogether, it seems that by increasing chloroplast sequence data in this family and scientific awareness of the relationship between different genera in Sapindales, a comprehensive revision of the order may be unavoidable. However, supplementary phylogenetic studies using sequence data from other members of the Sapindales order and its different sub-divisions, including family, subfamily and tribe, are needed to shed light on the phylogenetic relationships within this populous order and reach a more decisive conclusion regarding member assignment.

Supplementary Materials

The following supporting information can be downloaded at: https://www.mdpi.com/article/10.3390/d14070577/s1, Supplementary Table S1. Genetic differences among different plant species used for cluster analysis.

Author Contributions

All authors contributed to the study conception and design. A.E. designed the project, assembled the genome and analyzed the data. A.Z. drafted the manuscript and analyzed and interpreted the data. S.L. edited and revised the critically the manuscript for important intellectual content and did data visualization. S.M. revised the manuscript and analyzed data. All authors have read and agreed to the published version of the manuscript.

Funding

This research received no external funding.

Institutional Review Board Statement

Not applicable.

Data Availability Statement

The datasets generated during and/or analyzed during the current study are available from the corresponding author on reasonable request.

Acknowledgments

The authors acknowledge Jahrom University and Forestry & Natural Resources Department at Purdue University, and the USDA Forest Service, Northern Research Station for their support to accomplish this study. We thank Jennifer D. Antonides for contributing to the data analysis.

Conflicts of Interest

The authors have no conflict of interest to declare that are relevant to the content of this article.

References

  1. Zohary, M. A monographical study of the genus Pistacia. Palest. J. Bot. Jerus. Ser. 1952, 5, 187–228. [Google Scholar]
  2. Kafkas, S.; Özkan, H.; Ak, B.E.; Acar, L.; Atli, H.S.; Koyuncu, S. Detecting NA polymorphism and genetic diversity in a wide pistachio germplasm: Comparison of AFLP, ISSR and RAPD markers. J. Am. Soc. Hortic. Sci. 2006, 131, 522–529. [Google Scholar] [CrossRef]
  3. Zarei, A.; Erfani-Moghadam, J. SCoT markers provide insight into the genetic diversity, population structure and phylogenetic relationships among three Pistacia species of Iran. Genet. Resour. Crop. Evol. 2021, 68, 1625–1643. [Google Scholar] [CrossRef]
  4. Sagheb Talebi, K.; Sajedi, T.; Pourhashemi, M. Forests of Iran: A Treasure from the Past, a Hope for the Future; Springer: Dordrecht, The Netherlands, 2014; p. 152. [Google Scholar] [CrossRef]
  5. Food and Agriculture Organization. FAO. 2019. Available online: http://www.fao.org/faostat/en/#data/QC (accessed on 19 February 2019).
  6. Hernaddez-Alonso, P.; Bullo, M.; Salas-Salvado, J. Pistachios for health; what do we know about this multifaceted nut? Nutr. Today 2016, 51, 133–138. [Google Scholar] [CrossRef] [Green Version]
  7. Askan, E. Economic analysis and marketing margin of pistachios in Turkey. Bull. Natl. Res. Cent. 2019, 43, 177. [Google Scholar] [CrossRef] [Green Version]
  8. Dagan, T.; Roettger, M.; Stucken, K.; Landan, G.; Koch, R.; Major, P.; Gould, S.B.; Goremykin, V.V.; Rippka, R.; Tandeau de Marsac, N.; et al. Genomes of Stigonematalean cyanobacteria (subsection V) and the evolution of oxygenic photosynthesis from prokaryotes to plastids. Genome Biol. Evol. 2013, 5, 31–44. [Google Scholar] [CrossRef] [Green Version]
  9. Neuhaus, H.E.; Ernes, M.J. Nonphotosyntiietic metabolism in plastids. Annu. Rev. Plant Physiol. Plant Mol. Biol. 2000, 51, 111–140. [Google Scholar] [CrossRef]
  10. Yoo, Y.H.; Hong, W.J.; Jung, K.H. A systematic view exploring the role of chloroplasts in plant abiotic stress responses. BioMed Res. Int. 2019, 2019, 6534745. [Google Scholar] [CrossRef]
  11. Stavridou, E.; Michailidis, M.; Gedeon, S.; Ioakeim, A.; Kostas, S.; Chronopoulou, E.; Labrou, N.E.; Edwards, R.; Day, A.; Nianiou-Obeidat, I.; et al. Tolerance of transplastomic tobacco plants overexpressing a theta class glutathione transferase to abiotic and oxidative stresses. Front. Plant Sci. 2019, 9, 1861. [Google Scholar] [CrossRef] [Green Version]
  12. Chen, Y.; Hu, N.; Wu, H. Analyzing and characterizing the chloroplast genome of Salix Wilsonii. BioMed Res. Int. 2019, 5190425. [Google Scholar] [CrossRef] [Green Version]
  13. McCauley, D.E. The use of chloroplast DNA polymorphism in studies of gene flow in plants. Trends Ecol. Evol. 1995, 10, 198–202. [Google Scholar] [CrossRef]
  14. Bi, Y.; Zhang, M.; Xue, J.; Dong, R.; Du, Y.; Zhang, X. Chloroplast genomic resources for phylogeny and DNA barcoding: A case study on Fritillaria. Sci. Rep. 2018, 8, 1184. [Google Scholar] [CrossRef] [Green Version]
  15. Daniell, H.; Lin, C.S.; Yu, M.; Chang, W.J. Chloroplast genomes: Diversity, evolution, and applications in genetic engineering. Genome Biol. 2016, 17, 134. [Google Scholar] [CrossRef] [Green Version]
  16. Dong, W.; Xu, C.; Wu, P.; Cheng, T.; Yu, J.; Zhou, S.; Hong, D.Y. Resolving the systematic positions of enigmatic taxa: Manipulating the chloroplast genome data of Saxifragales. Mol. Phylogenet. Evol. 2018, 126, 321–330. [Google Scholar] [CrossRef]
  17. Zhao, Z.; Wang, X.; Yu, Y.; Yuan, S.; Jiang, D.; Zhang, Y.; Zhang, T.; Zhong, W.; Yuan, Q.; Huang, L. Complete chloroplast genome sequences of Dioscorea: Characterization, genomic resources, and phylogenetic analyses. PeerJ 2018, 6, e6032. [Google Scholar] [CrossRef] [Green Version]
  18. Welch, J.; Collins, K.; Ratan, A.; Drautz-Moses, D.I.; Schuster, S.C.; Lindqvist, C. The quest to resolve recent radiations: Plastid phylogenomics of extinct and endangered Hawaiian endemicmints (Lamiaceae). Mol. Phylogenet. Evol. 2016, 99, 16–33. [Google Scholar] [CrossRef] [Green Version]
  19. Xue, J.H.; Dong, W.P.; Cheng, T.; Zhou, S.L. Nelumbonaceae: Systematic position and species diversification revealed by the complete chloroplast genome. J. Syst. Evol. 2012, 50, 477–487. [Google Scholar] [CrossRef]
  20. Thode, V.A.; Lohmann, L.G. Comparative chloroplast genomics at low taxonomic levels: A case study using Amphilophium (Bignonieae, Bignoniaceae). Front. Plant Sci. 2019, 10, 796. [Google Scholar] [CrossRef]
  21. Magee, A.M.; Aspinall, S.; Rice, D.W.; Cusack, B.P.; Sémon, M.; Perry, A.S.; Stefanović, S.; Milbourne, D.; Barth, S.; Palmer, J.D.; et al. Localized hypermutation and associated gene losses in legume chloroplast genomes. Genome Res. 2010, 20, 1700–1710. [Google Scholar] [CrossRef] [Green Version]
  22. Ochoterena, H. Homology in coding and non-coding DNA sequences: A parsimony perspective. Plant Sys. Evol. 2009, 282, 151–168. [Google Scholar] [CrossRef]
  23. Khodaeiaminjan, M.; Kafkas, S.; Motalebipour, E.Z.; Coban, N. In silico polymorphic novel SSR marker development and the first SSR-based genetic linkage map in pistachio. Tree Genet. Genomes 2018, 14, 1–14. [Google Scholar] [CrossRef]
  24. Li, H.; Durbin, R. Fast and accurate short read alignment with Burrows-Wheeler transform. Bioinformatics 2009, 35, 1754–1760. [Google Scholar] [CrossRef] [Green Version]
  25. McKenna, A.; Hanna, M.; Banks, E.; Sivachenko, A.; Cibulskis, K.; Kernytsky, A.; Garimella, K.; Altshuler, D.; Gabriel, S.; Daly, M.; et al. The Genome Analysis Toolkit: A MapReduce framework for analyzing next-generation sequencing data. Genome Res. 2010, 20, 1297–1303. [Google Scholar] [CrossRef] [Green Version]
  26. DePristo, M.A.; Banks, E.; Poplin, R.; Garimella, K.V.; Maguire, J.R.; Hartl, C.; Philippakis, A.A.; Del Angel, G.; Rivas, M.A.; Hanna, M.; et al. A framework for variation discovery and genotyping using next-generation DNA sequencing data. Nat. Genet. 2011, 43, 491–498. [Google Scholar] [CrossRef]
  27. Van der Auwera, G.A.; Carneiro, M.O.; Hartl, C.; Poplin, R.; Del Angel, G.; Levy-Moonshine, A.; Jordan, T.; Shakir, K.; Roazen, D.; Thibault, J.; et al. From FastQ data to high-confidence variant calls: The Genome Analysis Toolkit Best Practices Pipeline. Curr. Protoc. Bioinform. 2013, 43, 11.10.1–11.10.33. [Google Scholar]
  28. Greiner, S.; Lehwark, P.; Bock, R. OrganellarGenomeDRAW (OGDRAW) version 1.3.1: Expanded toolkit for the graphical visualization of organellar genomes. Nucleic Acids Res. 2019, 47, W59–W64. [Google Scholar] [CrossRef] [Green Version]
  29. Liu, C.; Shi, L.; Zhu, Y.; Chen, H.; Zhang, J.; Lin, X.; Guan, X. CpGAVAS, an integrated web server for the annotation, visualization, analysis, and GenBank submission of completely sequenced chloroplast genome sequences. BMC Genom. 2012, 13, 715. [Google Scholar] [CrossRef] [PubMed] [Green Version]
  30. Wyman, S.K.; Jansen, R.K.; Boore, J.L. Automatic annotation of organellar genomes with DOGMA. Bioinformatics 2004, 20, 3252–3255. [Google Scholar] [CrossRef] [Green Version]
  31. Beier, S.; Thiel, T.; Münch, T.; Scholz, U.; Mascher, M. MISA-web: A web server for microsatellite prediction. Bioinformatics 2017, 33, 2583–2585. [Google Scholar] [CrossRef] [PubMed] [Green Version]
  32. Kurtz, S.; Choudhuri, J.V.; Ohlebusch, E.; Schleiermacher, C.; Stoye, J.; Giegerich, R. REPuter: The manifold applications of repeat analysis on a genomic scale. Nucleic Acids Res. 2001, 29, 4633–4642. [Google Scholar] [CrossRef] [Green Version]
  33. Thompson, J.D.; Higgins, D.G.; Gibson, T.J. CLUSTAL W: Improving the sensitivity of progressive multiple sequence alignment through sequence weighting, position-specific gap penalties and weight matrix choice. Nucleic Acids Res. 1994, 22, 4673–4680. [Google Scholar] [CrossRef] [Green Version]
  34. Grant, J.R.; Stothard, P. The CGView Server: A comparative genomics tool for circular genomes. Nucleic Acids Res. 2008, 36, W181–W184. [Google Scholar] [CrossRef]
  35. Zheng, W.; Li, K.; Wang, W.; Xu, X. The complete chloroplast genome of the threatened Pistacia weinmannifolia, an economically and horticulturally important evergreen plant. Conserv. Genet. Resour. 2017, 10, 535–538. [Google Scholar] [CrossRef]
  36. Lee, Y.S.; Kim, I.; Kim, J.K.; Park, J.Y.; Joh, H.J.; Park, H.S.; Lee, H.O.; Lee, S.C.; Hur, Y.J.; Yang, T.J. The complete chloroplast genome sequence of Rhus chinensis Mill Anacardiaceae). Mitochondrial DNA B Resour. 2016, 1, 696–697. [Google Scholar] [CrossRef] [Green Version]
  37. Rabah, S.O.; Lee, C.; Hajrah, N.H.; Makki, R.M.; Alharby, H.F.; Alhebshi, A.M.; Sabir, J.S.; Jansen, R.K.; Ruhlman, T.A. Plastome sequencing of ten nonmodel crop species uncovers a large insertion of mitochondrial DNA in cashew. Plant Genome 2017, 10. [Google Scholar] [CrossRef] [Green Version]
  38. Santose, V.; Almeida, C. The complete chloroplast genome sequences of three Spondias species reveal close relationship among the species. Genet. Mol. Biol. 2019, 42, 132–138. [Google Scholar] [CrossRef]
  39. Khan, A.L.; Al-Harrasi, A.; Asaf, S.; Park, C.E.; Park, G.S.; Khan, A.R.; Lee, I.J.; Al-Rawahi, A.; Shin, J.H. The first chloroplast genome sequence of Boswellia sacra, a resin-producing plant in Oman. PLoS ONE 2017, 12, e0169794. [Google Scholar] [CrossRef] [Green Version]
  40. Yang, B.; Li, M.; Ma, J.; Fu, Z.; Xu, X.; Chen, Q. The complete chloroplast genome sequence of Sapindus mukorossi. Mitochondrial DNA A 2016, 27, 1825–1826. [Google Scholar]
  41. Logacheva, M.D.; Shipunov, A.B. Phylogenomic analysis of Picramnia, Alvaradoa, and Leitneria supports the independent Picramniales: Phylogenomics of Picramniales. J. Sys. Evol. 2017, 55, 171–176. [Google Scholar] [CrossRef]
  42. Mader, M.; Pakull, B.; Blanc-Jolivet, C.; Paulini-Drewes, M.; Bouda, Z.H.; Degen, B.; Small, I.; Kersten, B. Complete chloroplast genome sequences of four Meliaceae species and comparative analyses. Int. J. Mol. Sci. 2018, 19, 701. [Google Scholar] [CrossRef] [Green Version]
  43. Bausher, M.G.; Singh, N.D.; Lee, S.B.; Jansen, R.K.; Daniell, H. The complete chloroplast genome sequence of Citrus sinensis (L.) Osbeck var ‘Ridge Pineapple’: Organization and phylogenetic relationships to other angiosperms. BMC Plant Biol. 2006, 6, 21. [Google Scholar] [CrossRef] [Green Version]
  44. Liu, Y.; Wei, A. The complete chloroplast genome sequence of an economically important plant, Zanthoxylum bungeanum (Rutaceae). Conserv. Genet. Resour. 2017, 9, 25–27. [Google Scholar] [CrossRef]
  45. Zhang, X.; Yan, J.; Ling, Q.; Fan, L.; Zhang, M. Complete chloroplast genome sequence of Prunus davidiana (Rosaceae). Mitochondrial DNA B Resour. 2018, 3, 890–891. [Google Scholar] [CrossRef] [Green Version]
  46. Shinozaki, K.; Ohme, M.; Tanaka, M.; Wakasugi, T.; Hayashida, N.; Matsubayashi, T.; Zaita, N.; Chunwongse, J.; Obokata, J.; Yamaguchi-Shinozaki, K.; et al. The complete nucleotide sequence of the tobacco chloroplast genome: Its gene organization and expression. EMBO J. 1986, 5, 2043–2049. [Google Scholar] [CrossRef]
  47. Zuo, L.H.; Shang, A.Q.; Zhang, S.; Yu, X.Y.; Ren, Y.C.; Yang, M.S.; Wang, J.M. The first complete chloroplast genome sequences of Ulmus species by de novo sequencing: Genome comparative and taxonomic position analysis. PLoS ONE 2017, 12, e0171264. [Google Scholar] [CrossRef] [Green Version]
  48. Song, Y.; Chen, Y.; Lv, J.; Xu, J.; Zhu, S.; Li, M.F. Comparative chloroplast genomes of Sorghum species: Sequence divergence and phylogenetic relationships. BioMed Res. Int. 2019, 2019, 5046958. [Google Scholar] [CrossRef] [Green Version]
  49. Zhou, T.; Ruhsam, M.; Wang, J.; Zhu, H.; Li, W.; Zhang, X.; Xu, Y.; Xu, F.; Wang, X. The complete chloroplast genome of Euphrasia regelii, pseudogenization of ndh genes and the phylogenetic relationships within orobanchaceae. Front. Genet. 2019, 10, 444. [Google Scholar] [CrossRef] [Green Version]
  50. Li, D.M.; Zhao, C.Y.; Liu, X.F. Complete chloroplast genome sequences of Kaempferia galanga and Kaempferia elegans: Molecular structures and comparative analysis. Molecules 2018, 24, 474. [Google Scholar] [CrossRef] [Green Version]
  51. He, L.; Qian, J.; Li, X.; Sun, Z.; Xu, X.; Chen, S. Complete chloroplast genome of medicinal plant Lonicera japonica: Genome rearrangement, intron gain and loss, and implications for phylogenetic studies. Molecules 2017, 22, 249. [Google Scholar] [CrossRef]
  52. Asaf, S.; Khan, A.L.; Khan, M.A.; Waqas, M.; Kang, S.M.; Yun, B.W.; Lee, I.J. Chloroplast genomes of Arabidopsis halleri ssp. gemmifera and Arabidopsis lyrata ssp. petraea: Structures and comparative analysis. Sci. Rep. 2017, 7, 7556. [Google Scholar] [CrossRef] [PubMed] [Green Version]
  53. Xu, C.; Dong, W.; Li, W.; Lu, Y.; Xie, X.; Jin, X.; Shi, J.; He, K.; Suo, Z. Comparative analysis of six Lagerstroemia complete chloroplast genomes. Front. Plant Sci. 2017, 8, 15. [Google Scholar] [CrossRef] [PubMed] [Green Version]
  54. Guo, S.; Guo, L.; Zhao, W.; Xu, J.; Li, Y.; Zhang, X.; Shen, X.; Wu, M.; Hou, X. Complete chloroplast genome sequence and phylogenetic analysis of Paeonia ostii. Molecules 2018, 23, 246. [Google Scholar] [CrossRef] [PubMed] [Green Version]
  55. He, Y.; Xiao, H.; Deng, C.; Xiong, L.; Yang, J.; Peng, C. The complete chloroplast genome sequences of the medicinal plant Pogostemon cablin. Int. J. Mol. Sci. 2016, 17, 820. [Google Scholar] [CrossRef] [PubMed] [Green Version]
  56. Shen, X.; Wu, M.; Liao, B.; Liu, Z.; Bai, R.; Xiao, S.; Li, X.; Zhang, B.; Xu, J.; Chen, S. Complete chloroplast genome sequence and phylogenetic analysis of the medicinal plant Artemisia annua. Molecules 2017, 22, 1330. [Google Scholar] [CrossRef]
  57. Naver, H.; Boudreau, E.; Rochaix, J.D. Functional studies of Ycf3: Its role in assembly of photosystem I and interactions with some of its subunits. Plant Cell 2001, 13, 2731–2745. [Google Scholar] [CrossRef] [Green Version]
  58. Freeland, S.J.; Hurst, L.D. Load minimization of the genetic code: History does not explain the pattern. Proc. R. Soc. Lond. B 1998, 265, 2111–2119. [Google Scholar] [CrossRef] [Green Version]
  59. Błażej, P.; Wnętrzak, M.; Mackiewicz, D.; Mackiewicz, P. Optimization of the standard genetic code according to three codon positions using an evolutionary algorithm. PLoS ONE 2018, 13, e0201715. [Google Scholar] [CrossRef] [Green Version]
  60. Gonzalez, D.L.; Giannerini, S.; Rosa, R. On the origin of degeneracy in the genetic code. Interface Focus 2019, 9, 20190038. [Google Scholar] [CrossRef]
  61. Zhao, J.J.; Qi, B.; Ding, L.J.; Tang, X.Q. Based on RSCU and QRSCU research codon bias of F/10 and G/11 Xylanase. J. Food Sci. Biotechnol. 2010, 29, 755–764. [Google Scholar]
  62. Cavalier-Smith, T. Chloroplast evolution: Secondary symbiogenesis and multiple losses. Curr. Biol. 2002, 12, R62–R64. [Google Scholar] [CrossRef] [Green Version]
  63. Weng, M.L.; Blazier, J.C.; Govindu, M.; Jansen, R.K. Reconstruction of the ancestral plastid genome in Geraniaceae reveals a correlation between genome rearrangements, repeats and nucleotide substitution rates. Mol. Biol. Evol. 2013, 31, 645–659. [Google Scholar] [CrossRef] [Green Version]
  64. Ebrahimi, A.; Zarei, A.; Zamani Faradonbeh, M.; Lawson, S. Evaluation of genetic variability among “Early Mature” Juglans regia using microsatellite markers and morphological traits. PeerJ 2017, 5, e3834. [Google Scholar] [CrossRef] [Green Version]
  65. Hu, Y.; Woeste, K.E.; Zhao, P. Completion of the chloroplast genomes of five Chinese Juglans and their contribution to chloroplast phylogeny. Front. Plant Sci. 2016, 7, 1955. [Google Scholar] [CrossRef] [Green Version]
  66. Zarei, A.; Sahraroo, A. Molecular characterization of Punica granatum l. accessions from Fars province of Iran using microsatellite markers. Hort Environ. Biotech. 2018, 59, 239–249. [Google Scholar] [CrossRef]
  67. Eguiluz, M.; Rodrigues, N.F.; Guzman, F.; Yuyama, P.; Margis, R. The chloroplast genome sequence from Eugenia uniflora, a myrtaceae from neotropics. Plant Sys. Evol. 2017, 303, 1199–1212. [Google Scholar] [CrossRef]
  68. AL-Saghir, M.G.; Porter, D.M. Taxonomic revision of the genus Pistacia L. (anacardiaceae). Am. J. Plant Sci. 2012, 3, 12–32. [Google Scholar] [CrossRef] [Green Version]
  69. Yi, T.; Wen, J.; Golan-Goldhirsh, A.; Parfitt, D.E. Phylogenetics and reticulate evolution in Pistacia (Anacardiaceae). Am. J. Bot. 2008, 95, 241–251. [Google Scholar] [CrossRef]
  70. Ibrahim Basha, A.; Padulosi, S.; Chabane, K.; Hadj-Hassan, A.; Dulloo, E.; Pagnotta, M.A.; Porceddu, E. Genetic diversity of Syrian pistachio (Pistacia vera L.) varieties evaluated by AFLP markers. Genet. Resour. Crop. Evol. 2007, 54, 1807–1816. [Google Scholar] [CrossRef]
  71. Ruhsam, M.; Rai, H.S.; Mathews, S.; Ross, T.G.; Graham, S.W.; Raubeson, L.A.; Mei, W.; Thomas, P.I.; Gardner, M.F.; Ennos, R.A.; et al. Does complete plastid genome sequencing improve species discrimination and phylogenetic resolution in Araucaria? Mol. Ecol. Res. 2015, 15, 1067–1078. [Google Scholar] [CrossRef]
Figure 1. Chloroplast genome map of P. vera depicted with OGDRAW software. Genes identified inside the circle are transcribed clockwise and those drawn outside of the circle are transcribed counter-clockwise. Genes having similar functions are shown in the same colors. The inner circle illustrates nucleotide compositions (light grey, AT content; dark grey, GC content). Itron containing genes are marked with ’*’.
Diversity 14 00577 g001
Figure 2. Statistics describing SSR (A) motif type and frequency, (B) number of tandem repeats, (C) number of palindromic repeats, (D) and number of forward repeats in the chloroplast genomes of different Anacardiaceae family members. (E) SSR repeat frequency within the P. vera chloroplast genome.
Diversity 14 00577 g002
Figure 3. Phylogenetic relationships constructed from the complete chloroplast genome sequences of the members of the Spindales order.
Diversity 14 00577 g003
Table 1. List of plant species with published chloroplast genomes used for phylogenetic cluster analysis.
OrderFamilyTribeGenusSpeciesNCBI Accession No.Reference
SapindalesAnacardiaceaeRhoeaePistaciaP. vera-Current study
SapindalesAnacardiaceaeRhoeaePistaciaP. weinmannifoliaNC_037471.1[35]
SapindalesAnacardiaceaeRhoeaeRhusR. chinensisNC_033535.1[36]
SapindalesAnacardiaceaeAnacardieaeAnacardium A. occidentaleNC_035235.1[37]
SapindalesAnacardiaceaeAnacardieaeMangifera M. indicaNC_035239.1[37]
SapindalesAnacardiaceaeSpondieaeSpondias S. tuberosaNC_030527.1[38]
SapindalesBurseraceaeBursereaeCommiphora C. wightiiNC_036978.1unpublished
SapindalesBurseraceaeBursereaeBoswellia B. sacraNC_029420.1[39]
SapindalesSapindaceaeNephelieaeLitchi L. chinensisNC_035238.1[37]
SapindalesSapindaceaeSapindeaeSapindus S. mukorossiKM454982.1[40]
SapindalesSimaroubaceae-Leitneria L. floridanaNC_030482.1[41]
SapindalesMeliaceaeSwietenieaeSwietenia S. mahagoniNC_040009.1unpublished
SapindalesMeliaceaeSwietenieaeKhaya K. senegalensisNC_037362.1[42]
SapindalesRutaceaeAurantieaeCitrus C. sinensisDQ864733.1[43]
SapindalesRutaceaeZanthoxyleaeZanthoxylum Z. bungeanumNC_031386.1[44]
RosalesRosaceaePruneaePrunus P. davidianaNC_039735.1[45]
SolanalesSolanaceaeNicotianeaeNicotiana N. tabacumZ00044.2[46]
Table 2. Functions of genes identified from the P. vera chloroplast genome.
CategoryGene GroupGene Names
Self replicationLarge subunit of ribosomal protein genesrpl32, rpl23 a, rpl2 *,a, rpl33, rpl20, rpl36, rpl14, rpl16, rpl22
Small subunit of ribosomal protein genesrps7 a, rps12 *,a, rps15, rps19 a, rps16 *, rps2, rps4, rps14, rps18, rps11, rps8, rps3
DNA-dependent RNA polymerase genes rpoA, rpoB, rpoC1 *,rpoC2
Ribosomal rRNA genes CGW73_pgr008 a, (16S); CGW73_pgr007 a, (23S); CGW73_pgr008 a,(4.5S); CGW73_pgr0085, (5S)
tRNA genestrnM-CAU a, trnI-CAU a, trnL-CAA a, trnV-GAC a, trnI-GAU *,a, trnA-UGC *,a, trnR-ACG a, trnR-ACG a, trnR-ACG a, trnN-GUU a, trnL-UAG, trnH-GUG, trnH-GUG, trn-H-GUG, trnK-UUU *, trnQ-UUG, trnS-GCU, trnT-CGU *, trnG-UCC, trnR-UCU, trnD-GUC, trnD-GUC, trnY-GUA, trnE-UUC *, trnE-UUC *, trnT-UGU, trnS-GGA, trnM-CAU, trnM-CAU, trnS-UGA, trnG-GCC, trnG-GCC, trnT-GGU, trnL-UAA *, trnF-GAA, trnV-UAC *, trnM-CAU, trnW-CCA, trnP-UGG, trnP-UGG, trnE-UUC *
PhotosynthesisPhotosystem IpsaA, psaB, psaJ, psaC
Photosystem IIpsbA, psbk, psbI, psbM, psbZ, psbC, psbD, psbJ, psbL, psbF, psbE, psbB, psbT, psbN, psbH
Cytochrome b/f complexpetN, petA, petL, petG, petB, petD
ATP synthaseatpA, atpF *, atpH, atpI, atpE, atpB
NADH dehydrogenasendhB *,a, ndhF, ndhD, ndhE, ndhG, ndhI, ndhA *, ndhH, ndhJ, ndhK, ndhC
RubisCo large subunitrbcL
Other genesProteaseclpP *
Translation initiation factorinfA
MaturasematK
Acetyl-CoA-carboxylase (subunit)accD
Envelope membrane proteincemA
Cytochrome synthesis (C-Type)ccsA
Chloroplast reading frames (hypothetical)ycf2 a, ycf1, ycf3 *,ycf4
* Genes containing introns; a duplicated genes.
Table 3. Nucleotide composition of specific P. vera chloroplast genome regions.
T(U)ACGGC ContentSSRsLength (bp)%
Whole Genome31.3730.7619.2618.6137.8791160,598100
LSC30.6736.2016.8916.2433.1364 (70.33%)88,17454.9
SSC33.7233.9216.8115.5532.3615 (16.48%)19,33012.04
IR28.3828.6720.6722.2742.9412 (13.19%)26,54716.53
tRNA26.6423.2322.2527.8850.13023461.46%
rRNA21.2024.2826.1428.3854.52010,6426.63%
Intron33.0230.3019.4217.2636.684 (4.4%)90995.65%
Intergenic space33.1632.7717.2816.7934.0778 (85.71%)67,56142.06
Table 4. Intron containing genes obtained from CPGAVAS analysis of the P. vera chloroplast genome.
GeneLocationStrandStartEndExon 1 Intron 1 Exon II Intron II Exon III
Base Pair (bp)
trnR-TCTLSC-1273513515238
atpFLSC-13,21814,526148694467
rpoC1LSC-22,31425,1334357771608
trn-CTALSC-39,13239,262385637
psaALSC-42,60144,742178830324
ycf3LSC-45,53447,564126724230801150
clpPLSC-73,65675,70274818290641224
rpl2IR-88,27489,760394626467
ycf2IR+92,99297,2602404571808
ycf15IR+97,35197,948155292151
ndhBIR-98,944101,154870588753
rrn23SIR+108,235111,706160383274
ndhASSC-125,134127,3495561124536
rrn23SIR-136,889140,360160383274
ndhBIR+147,441149,654777681756
ycf15IR-150,650151,244158289148
ycf2IR-151,338155,6332428331835
rpl2IR+158,853160,342391629470
Table 5. Frequency and patterns of codon usage and codon–anticodon recognition in the chloroplast genome of P. vera.
Amino acidGenomeCodonNo.RSCU *tRNAAmino AcidGenomeCodonNo.RSCU *tRNA
(%)(%)
Ala5.6GCA3991.13trnA-UGCIle8.53ATA6730.94trnI-UAU
GCC2350.66 ATC4500.62trnI-GAU
GCG1740.49 ATT10721.47
GCT6331.79 Lys4.91AAA9461.5trnK-UUU
Cys1.3TGT2281.43trnC-ACA AAG3190.5
TGC1070.67 Leu10.69CTA4090.89trnL-UAG
Asp3.86GAT7691.55 CTC2020.44
GAC2260.45trnD-GUC CTG2010.44
Glu4.79GAA9171.49trnE-UUC CTT5571.21trnL-UAA
GAG3170.51 TTA8411.83
Phe5.71TTC5190.71trnF-GAA TTG5411.18trnL-CAA
TTT9521.29 Met2.49ATG5841trnM-CAU
Gly7.16GGA7181.56trnG-UCCAsn4.6AAC2970.5trnN-GUU
GGC1920.42trnG-GCC AAT8861.5
GGG3290.71 Pro4.08CCA3111.18trnP-UGG
GGT6031.31 CCC2050.78
His2.56CAC1720.52trnH-GUG CCG1430.54
CAT4871.48 CCT3921.49
Gln3.34CAA6421.49trnQ-UUG
Thr5.19ACA4051.21trnT-UGU CAG2190.51
ACC2750.82trnT-GGUArg5.96AGA4661.82trnR-UCU
ACG1490.45trnT-CGU AGG1660.65
ACT5071.52 CGA3421.34trnR-ACG
Val5.49GTA5191.47trnV-UAC CGC1140.45
GTC1920.54trnV-GAC CGG1310.51
GTG1920.54 CGT3161.24
GTT5111.45 Ser7.77AGC1170.35trnS-GCU
Trp1.74TGG4671trnW-CCA AGT4171.25
Tyr3.65TAC2090.44trnY-GUA TCA3891.17trnS-UGA
TAT7311.56 TCC3451.03trnS-GGA
Stop0.57TAA631.28 TCG1860.56trnS-CGA
TAG420.85 TCT5471.64
TGA430.87
* Relative Synonymous Codon Usage.
Table 6. Sequence comparison of the P. vera chloroplast genome sequence with other Anacardiaceae family members.
SpeciesPistacia veraPistacia weinmannifoliaAnacardium occidentaleMangifera indicaRhus chinensisSpondias tuberosaVariationSD
Single-copy region (large)
Length (bp)88,17488,40287,72786,67396,88289,55010,209 bp4.13
G + C (%)33.133635.73636.235.83.0%3.27
Length (%)54.954.9850.9454.9365.0255.2614.0%8.41
Single-copy region (small)
Length (bp)19,33019,12919,04618,34918,64718,399981 bp2.17
G + C (%)32.3632.93232.432.532.21.0%0.94
Length (%)12.0411.911.0611.6312.5111.361.0%4.38
Inverted repeat
Length (bp)26,54726,61832,71325,79233,47427,0457,684 bp11.98
G + C (%)42.9442.9434345.442.73.0%2.36
Length (%)16.5316.561916.3422.4716.696.1%6.53
Total
Length (bp)160,598160,767172,199157,780149,011162,03923,188 bp4.65
G + C (%)37.8736.838.137.937.737.71.0%1.21
Length (%)1001001001001001000.0%0
Total genes132 (136) (+121)131126112120117206.5
Protein-coding genes87877978848394.64
tRNA30372930323039.4
rRNA44444400
Intron-containing genes (# with 2 introns)13 (2 with 2)16 (2 with 2)12 (3 with 2)16 (2 with 2)13 (2 with 2)14 (3 with 2)-9.56
SSRs/Compound SSRs91/1286/978/873/876/814/31911.95
Publisher’s Note: MDPI stays neutral with regard to jurisdictional claims in published maps and institutional affiliations.

