Article

Four in One: Cryptic Diversity in Geoffroy’s Side-Necked Turtle Phrynops geoffroanus (Schweigger 1812) (Testudines: Pleurodira: Chelidae) in Brazil

by
Vinicius Tadeu de Carvalho
1,2,
Richard C. Vogt
3,†,
Rommel R. Rojas
2,4,
Mário da Silva Nunes
2,
Rafael de Fraga
5,
Robson W. Ávila
6,
Anders G. J. Rhodin
7,8,
Russell A. Mittermeier
9,
Tomas Hrbek
2,10,* and
Izeni Pires Farias
2,*
1
Programa de Pós-graduação em Diversidade Biológica e Recursos Naturais, Universidade Regional do Cariri, Campus do Pimenta, Rua Cel. Antônio Luiz, 1161, Crato 63105-000, CE, Brazil
2
Laboratório de Evolução e Genética Animal, Departamento de Genética, Instituto de Ciências Biológicas, Universidade Federal do Amazonas, Av. Rodrigo Octávio Jordão Ramos, 6200, Mini-Campus, Coroado I, Manaus 69077-000, AM, Brazil
3
Coordenação de Biodiversidade, Instituto Nacional de Pesquisas da Amazônia, Av. André Araújo, 2936, Manaus 69060-001, AM, Brazil
4
Escuela de Ecología y Fauna, Facultad de Ciencias Biológicas, Universidad Nacional de la Amazonia Peruana-UNAP, Av. Grau 1072, Iquitos 16002, LO, Peru
5
Laboratório de Ecologia e Comportamento Animal, Universidade Federal do Oeste do Pará, Rua Vera Paz s/n, Salé, Santarém 68040-470, PA, Brazil
6
Departamento de Biologia, Universidade Federal do Ceará, Av. Mister Hull s/n, Pici, Fortaleza 60455-760, CE, Brazil
7
Chelonian Research Foundation, Arlington, VT 05250, USA
8
Turtle Conservancy, P.O. Box 1289, Ojai, CA 93024, USA
9
Re:wild, P.O. Box 129, Austin, TX 78767, USA
10
Department of Biology, Trinity University, San Antonio, TX 78212, USA
*
Authors to whom correspondence should be addressed.
Deceased.
Diversity 2022, 14(5), 360; https://doi.org/10.3390/d14050360
Submission received: 21 February 2022 / Revised: 25 April 2022 / Accepted: 26 April 2022 / Published: 3 May 2022
(This article belongs to the Special Issue Phylogeography of Freshwater Turtles and Tortoises)

Abstract

:
Turtles are one of the most threatened groups of vertebrates, with about 60% of species classified at some level of extinction risk. Compounding this extinction crisis are cryptic species and species complexes that are evaluated under a single species epithet but harbor multiple species, each of which needs to be evaluated independently. The Phrynops geoffroanus species group is a classic example. Described first in 1812, it is currently thought to harbor multiple species. To test this hypothesis, we collected mitochondrial and nuclear genomic data, morphometric data, and distribution and associated biome information. We applied statistically rigorous species delimitation analyses, taxonomic hypotheses tests, and fully coalescent phylogenetic reconstruction methods, concluding that the Phrynops geoffroanus species complex comprises four geographically structured species/lineages that diverged during the Pleistocene and are currently geographically structured along the main South American river basins and biomes. These species/lineages show subtle and largely non-significant differences in shape but are characterized by differences in coloration and patterns of marks on the head and plastron. Our results contribute to the understanding of species diversity and diversification of biodiversity in South America and provide an important basis for the conservation of freshwater turtles.

1. Introduction

It is becoming ever more apparent that many Neotropical taxonomic groups harbor cryptic diversity, i.e., evolutionarily divergent lineages that do not present obvious or any morphological differences, e.g., the works of [1,2,3,4,5,6]. Coupled with this issue is the conceptualization of species as evolving lineages [7], which often are easily identified through the analysis of molecular data, and current taxonomic practices that treat species as immutable categories defined by morphological diagnoses, the hallmark of Linnaean taxonomy. Yet it is only species as evolutionary lineages that fully capture the evolutionary history and species diversity of any given taxonomic group. In some taxonomic groups, the levels of cryptic diversity may be high enough to cause a “taxonomic crisis” since traditional taxonomy often does not reflect the diversity and distribution of species [5,8]. Consequently, the non-inclusion of cryptic diversity causes biases in biodiversity studies [9,10]. Considering that ecological and biogeographic models are fundamental bases for conservation actions and policies and that biodiversity is being lost faster than scientists can describe new species, cryptic diversity has also reduced the efficiency of conservation programs [11].
Molecular markers have been used efficiently to quantify lineage diversity and refine taxonomy, even in organisms showing relatively little morphological diversity, including certain South American and Australasian freshwater turtle groups [4,5,6,12,13]. The analyses of molecular data also permit powerful inferences about the evolutionary history of organisms [1,2,12,14,15,16,17], adding an additional dimension to traditional biodiversity studies [18]. A plethora of methods for obtaining and analyzing molecular data have been developed in the last decades, and mitochondrial markers used for DNA barcoding have been shown to be cost-effective for phylogenetic analyses focused on cryptic diversity [19]. Mitochondrial markers are particularly efficient in identifying cryptic diversity when analyzed under movement-or coalescent-based species delimitation methods, which objectively delimit boundaries between evolutionarily distinct lineages in non-arbitrary ways, e.g., the works of [20,21].
Ecological and biogeographic models biased by cryptic diversity are particularly problematic when focused on threatened organisms because different lineages may have different environmental requirements and sources of threat [22]. Turtles, along with primates, are the two most threatened groups of vertebrates, with about 60% of species classified at some level of extinction risk [23,24]. Several factors have been described as general sources of population declines, including habitat loss and environmental degradation, pet and food trade, traditional medicines, and climate change [25,26,27,28].
The intensity of these threats is expected to vary over the distribution of a species as a consequence of spatial heterogeneity of environment and sources of threat [2,29]. Yet broadly distributed species often are complexes of cryptic species that occur across a range of environments and geomorphological landscapes [1,2,6,29]. Due to the large geographic extent of these “species”, they tend to be evaluated as not threatened or in low-risk categories, yet clearly, conservation status needs to be assessed for each cryptic species [30,31,32].
Previous studies have suggested that Phrynops geoffroanus comprises a complex of cryptic species [5,13,24,30,32,33,34,35]. What are these cryptic species, where do they occur, and what are their phylogenetic relationships are, however, uncertain given the lack of sampling. It is likely, however, that these cryptic species will be structured along major river basins since this group depends on the drainage network to disperse.
In this study, we analyzed a geographically comprehensive sample of the Geoffroy’s side-necked turtle Phrynops geoffroanus (Chelidae) species complex spanning all known major South American river basins in which it is known to occur. For all collected specimens, we collected mitochondrial DNA, genomic ddRAD, and morphometric data, which we then used to test two principal hypotheses: (1) Phrynops geoffroanus is a species complex comprised of multiple evolutionary lineages. (2) The distribution of these cryptic species coincides with principal South American river basins. Additionally, we provide new insights into the phylogenetic relationships of Phrynops and other Chelidae.

2. Methods

Study area and turtle sampling. Between 2010 and 2017, we collected 71 Phrynops geoffroanus specimens and tissue samples from 22 localities in Brazil and Argentina (Figure 1A, Table S1). We captured turtles using a 1.5 m diameter dip net, barb-less n° 6 fish hooks baited with beef, 100 m wide by 2 m high trammel nets, 25 cm inner mesh, flag gill net with 7 cm mesh, and hoop net turtle traps with 30 cm diameter and 4 cm square nylon mesh [5], with one or two funnel entrances, baited with beef. We randomly distributed different traps in streams and lakes spread over approximately 5,250,000 km2 in Brazil and Argentina. We designed our sampling to cover all the main river basins in South America, draining the dry diagonal, which extends from the Chaco and Pantanal in southwestern South America and the Cerrado in the central Brazilian plateau to the Caatinga in the semi-arid northeastern Brazil. Additionally, we sampled humid rainforests in Amazônia and the Atlantic forest. Information (localities, country, basins, geographic coordinates, and museum voucher) for each specimen is available in Supplemental Table S1.
Molecular data. We extracted mitochondrial DNA from striated muscle tissue using the phenol-chloroform protocol [36]. DNA extracts were used to generate sequences of three mitochondrial genes and a genomic library from which haplotypes and single nucleotide polymorphisms were extracted.
We amplified partial fragments of the genes 16S rDNA, Cytochrome b (Cytb), and Cytochrome Oxidase I (COI) using a respective combination of the primers 16Sar(L) and 16Sbr(H) [37], L14725 [38], H15573 [39] and LturtCOIa, HturtCOIa [40]. The final volume of the PCR mixture was 12 µL and contained 4.8 µL ddH2O, 1.5 µL 25 mM MgCl2, 1.25 µL dNTPs (10 mM), 1.25 µL 10X (75 mM Tris HCl, 50 mM KCl, 20 mM KCl2), 1 µL solution 2 mM of each primer, 0.3 µL Taq DNA Polymerase 5 U/µL and 1 µL DNA (50 ng/µL). For 16S rDNA we used 35 cycles at 92 °C (1 min), 50 °C (40 s), 72 °C (90 s), and final extension of 72 °C (5 min); for Cytochrome b we used 95 °C (1 min) denaturation followed by 35 cycles 95 °C (10 s), 48 °C (30 s), 72 °C (40 s), and final extension at 72 °C (7 min); and for COI, we used 95 °C (5 min) denaturation followed by 35 cycles at 95 °C (45 s), 54 °C (45 s), 72 °C (45 s), and final extension at 72 °C (6 min).
We purified the PCR products using ExoSap, following the manufacturer’s instructions (ThermoFisher, Waltham, MA, USA). Sequencing reactions for the three genes were carried out using the Big Dye Terminator kit following the directions of the manufacturer (ThermoFisher, Waltham, MA, USA). We used the amplification primers for bidirectional sequencing at 55 °C, followed by precipitating the product of the sequencing reaction with EtOH and EDTA. The precipitated PCR products were resuspended in 10 µL of formamide and sequenced using ABI 3500 automatic sequencer (ThermoFisher, Waltham, MA, USA). The generated sequences were edited in Geneious 8.1.8 [41], aligned in Clustal W [42], and concatenated in CodonCode Aligner v.3.5.2 (http://www.codoncode.com/aligner/download.htm, accessed on 29 February 2018), resulting in a concatenated matrix of 1843 bp. The sequence data were deposited in GenBank under the following accession numbers: ON063048-ON063118 (COI), ON061103-ON061173 (Cytb), ON063137-ON063207 (16S); SUB11224878 (ddRAD).
We prepared the genomic library using a modified ddRADseq protocol [43] adapted for IonTorrentPGM (https://github.com/legalLab/protocols-scripts, accessed on 10 January 2016) for one individual per sampled locality plus other species of the genus (P. tuberosus and P. williamsi) and outgroup taxa (Mesoclemmys gibba, Ranacephala hogei, and Platemys platycephala). Briefly, after DNA extraction, the 200 ng of whole genomic DNA was digested with SdaI and Csp6I restriction enzymes, and barcoded sequencing adapters were added with T4 ligase. Following PCR, purification with AMPure Beads (Beckman Coulter, Brea, CA, USA) and fragment size selection (320–400 bp) on the Pippin Prep electrophoresis platform (Sage Science, Beverly, MA, USA), all samples were pooled in equimolar quantities and sequenced in the Genetic Sequencer Generation Ion Torrent PGM, using reagents and sequencing kits 400 pb and chip 318.
After demultiplexing our run, we added three representatives each of Chelus fimbriata and C. orinocensis generated for a previous study [6]; these individuals were outgroups and were used for calibrating divergence times of our ingroup taxa. We processed our demultiplexed runs in PyRAD [44] to generate data matrices for phylogenetic analyses. We filtered our reads on quality (nucleotides with PHRED scores <30 were changed to ambiguities, reads with >3 ambiguities were discarded) and coverage (a minimum 5× coverage per read). In the final data matrix, we included only those loci that were present in at least 75% of the individuals, resulting in a final alignment of 244 loci representing 83,703 bp. We also generated a matrix of SNPs using DiscoSnp-RAD [45]. We extracted single nucleotide polymorphisms (SNPs) from our reads using a minimum read depth of 5. The highest quality SNPs were then sampled from each locus, and the SNPs were further filtered on quality. We retained only those SNPs with a rank >0.9, a statistic incorporating the discriminant power and read coverage of each SNP, and those that were present in at least 80% of the samples. This resulted in 7668 SNPs and a matrix with 2.01% missing data.
Phylogenetic reconstruction-ddRAD. To infer phylogenetic relationships among individuals of the P. geoffroanus species complex, we ran a coalescent-based phylogenetic reconstruction using SVDQuartets [46] as implemented in PAUP* [47] using the SNP matrix as input. The result of this analysis was used in species hypotheses testing.
Single-locus species discovery analysis. We reconstructed the Bayesian inference mtDNA phylogeny of P. geoffroanus in the software BEAST v2.6 [48]. Markov chain Monte Carlo (MCMC) searches were made for 10 million generations, sampling every 1000th generation for a total of 10 000 trees using the coalescent constant population size and coalescent tree prior to implementing the GTR + G + I model of molecular evolution; the most likely model indicated in jModeltest [49]. We verified convergence of the Markov chain convergence using Tracer v1.7 [50] and summarized the topologies in TreeAnnotator v1.6.2 [48] using the maximum clade credibility criterion after discarding the first 10% of the trees as burn-in.
We subjected the resulting topology to four single-locus species discovery (SLSD) methods to partition our data set into putative species-like clusters and to assess the support for these clusters following Machado et al. [3]: GMYC, the general mixed Yule coalescent model; bGMYC, a Bayesian implementation of the GMYC [51]; mPTP, the Poisson tree process method [52]; and local minima (locMin), a distance threshold optimizing and clustering approach from the spider_1.3-0 software package [53].
For GMYC and bGMYC, we used splits_1.0-19 [51] and bGMYC_1.0.2 [54] packages in R [55]. We summarized the bGMYC posterior samples into putative species with a conservative posterior probability of conspecificity at 0.05. The locMin analyses were conducted as a point estimate and on a set of 1000 bootstrapped data sets to generate a confidence interval. For mPTP, the BEAST chronograms (ultrametric trees with branch lengths scaled by time) were transformed into phylograms using maximum likelihood optimization in phangorn_2.2.0 [56] under the GTR + G + I substitution model. We retained only those lineages that were discovered by at least three of the four methods. Finally, we calculated uncorrected p-distance among lineages using the concatenated sequences in MEGA 7.0 [57].
Species hypotheses testing-ddRAD. We used path sampling in BEAST2 and collected marginal probabilities of alternate taxonomic hypotheses. Taxonomic hypotheses represented the current taxonomic hypothesis, hypotheses derived from single-locus species analyses, and hypotheses derived from the SVDQuartet analyses. Phrynops geoffroanus was divided up into five lineages. L1, L2, L3, and L4 represent the four lineages of P. geoffroanus delimited in SLSD analyses. L1 is distributed in the Amazon and Paraná basins; however, SVDQuartets individuals from these two basins as monophyletic but not sister taxa, hence L1a and L1b. L2 occurs in the southwestern Amazon basin; however, in SVDQuartets analysis, L2 is nested within L1b. L3 occurs in the São Francisco basin, while L4 occurs in the coastal drainages of the southern Atlantic Rainforest. Alternate taxonomic hypotheses are as follows: one species (P. tuberosus + P. geoffroanus); two species–current taxonomy (P. tuberosus, P. geoffroanus); three species–SVDQuartet topology (P. tuberosus, P. geoffroanus L4, P. geoffroanus L1a + L1b + L2 + L3); four species–SVDQuartet topology (P. tuberosus, P. geoffroanus L4, P. geoffroanus L1a, P. geoffroanus L1b + L2 + L3); four species–alternate SLSD topology (P. tuberosus, P. geoffroanus L4, P. geoffroanus L3, P. geoffroanus L1a + L1b + L2); five species–best SLSD topology (P. tuberosus, P. geoffroanus L4, P. geoffroanus L3, P. geoffroanus L2, P. geoffroanus L1a + L1b); five species–SVDQuartet topology (P. tuberosus, P. geoffroanus L4, P. geoffroanus L1a, P. geoffroanus L3, P. geoffroanus L1a + L2); six species–SVDQuartet + SLSD topology (P. tuberosus, P. geoffroanus L4, P. geoffroanus L1a, P. geoffroanus L3, P. geoffroanus L1a, P. geoffroanus L2). Marginal probabilities of the competing taxonomic hypotheses were compared by Bayes factors [58].
Species tree analysis-ddRAD. We ran PartitionFinder2 [59] to select an optimal number of partitions and their respective models of molecular evolution in our genomic alignment, resulting in 86 partitions. We then generated an XML file for species tree analyses where species were clusters of individuals delimited as such in the species hypotheses tests. We analyzed the data in BEAST v2.6 [48], implementing the calibrated Yule tree prior, generating 5 × 10⁸ topologies, sampling every 5000th topology, and discarding the first 15% topologies as burn-in after verifying stationarity in Tracer v1.7 [50]. Topologies were visualized in DensiTree [48], and a final consensus maximum clade credibility tree was generated using TreeAnnotator v1.6.2 [48] after discarding 15% burn-in. The maximum clade credibility tree and divergence times calibrated using the Chelidae divergence prior (mean = 36.0 My; 95% HPD 26.5–46.8 My; Thomson et al. [60]) were then visualized in FigTree v1.3 [61].
Morphometric analyses. We collected 34 linear measurements from 198 individuals (127 individuals in addition to those used in the molecular analyses) of the Phrynops geoffroanus complex (Supplemental Table S2). In addition to linear measurements, we also recorded the sex, basin, and biome in which the individuals occurred, and posterior to the SLSD analysis, the lineage to which each individual belonged. Due to the undesirable properties of proportions in statistical analyses [62], we performed linear regression against total carapace length and retained residuals of each of the remaining 33 linear measurements; the residuals largely encompass components of shape. The residuals did not deviate from normality, so we used parametric analyses. After filtering all juveniles or individuals of undetermined sex, we retained 151 individuals, 73 females and 78 males. We tested for differences in shape between males and females. Since there are significant differences in shape between males and females, we analyzed males and females separately in subsequent analyses. We reduced the dimensionality of our data by performing principal component analysis and retaining the first 15 principal components; the first 15 principal components explain >90% of the total variance. We used ANOVA to test for shape differences among lineages among basins and among biomes. We subsequently applied the discriminant analysis of principal components-DAPC [63] to each data set to test if individuals of the different lineages could be discriminated morphologically. In the DAPC analysis groups (the cryptic species identified in the single-locus delimitation analyses) were identified a priory, and the first 15 principal components were used in the discriminant analyses.
Distribution analyses. Finally, we tested the association between lineages and their distribution classified as major river basin and biome using Chi-square and Fisher’s exact test.

3. Results

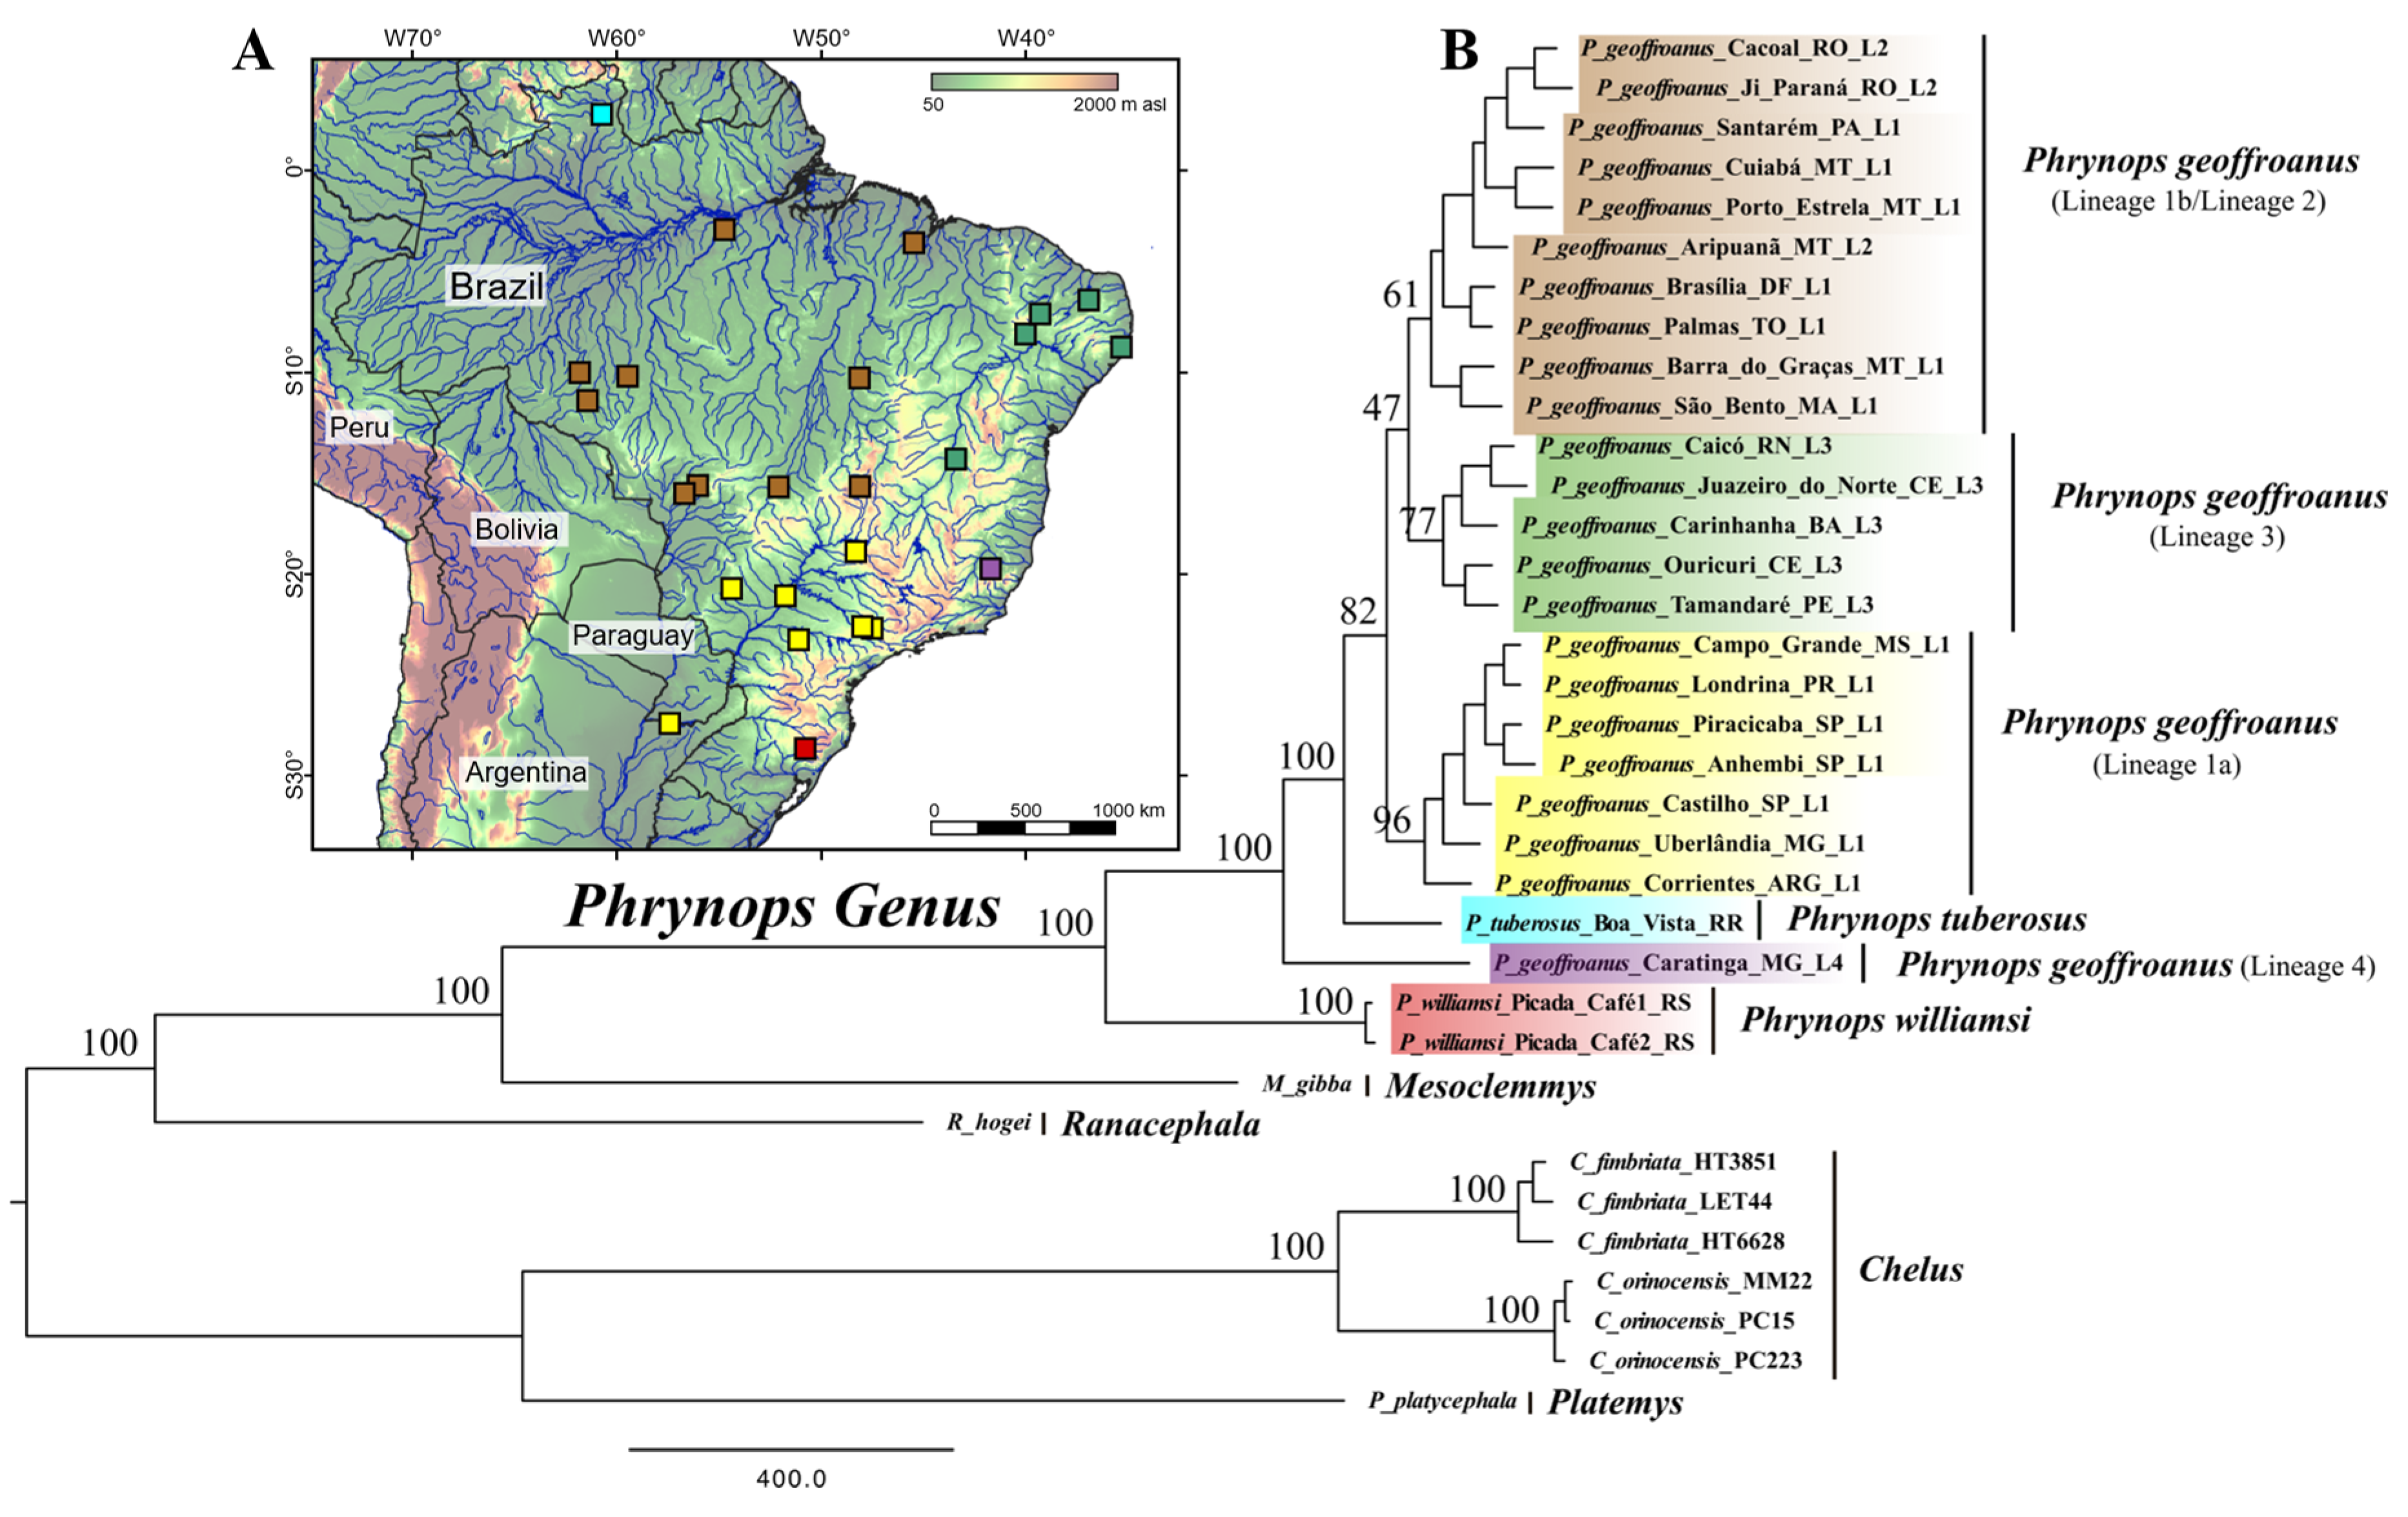
Single-locus discovery of species. The four single-locus species delimitation methods were consistent, discovering three (bGMYC) and four (locMin, mPTP, and GMYC) cryptic species (Table 1). bGMYC discovered the smallest range of cryptic species (2–6, considering 95% confidence intervals). The three other methods consistently returned four distinct, geographically structured cryptic species (Figure 1A,B); bGMYC did not differentiate between the two species from the Paraná and Amazon river basins.
SDVquartet phylogenetic reconstruction. SVDQuartet [46] analysis of the SNP data (Figure 2) resulted in a highly supported phylogenetic hypothesis whereby major clades of the P. geoffroanus species complex were geographically restricted to major river basins. In contrast to the mtDNA BEAST2 used in the single-locus species discovery analyses, lineage 1 was divided into two non-sister clades comprising animals from the Amazon and Paraná basins, and individuals of lineage 2 (individuals also from the Amazon basin) were nested within the Amazon clade.
Test of species hypotheses. Bayes factor analysis of the marginal probabilities of the alternate taxonomic hypotheses (Table 2) supported the four species hypothesis (P. tuberosus, P. geoffroanus L4, P. geoffroanus L1a, P. geoffroanus L1b + L2 + L3) as the best taxonomic hypothesis. However, the five species hypothesis (P. tuberosus, P. geoffroanus L4, P. geoffroanus L1a, P. geoffroanus L3, P. geoffroanus L1a + L2) was only marginally worse (BF = 11.64). The current taxonomic hypothesis (P. tuberosus, P. geoffroanus) had no support (BF = 11877.64), and the best SLSD hypothesis (P. tuberosus, P. geoffroanus L4, P. geoffroanus L3, P. geoffroanus L2, P. geoffroanus L1a + L1b) also had no support (BF = 1478.31). The alternate SLSD hypothesis (P. tuberosus, P. geoffroanus L4, P. geoffroanus L3, P. geoffroanus L1a + L1b + L2) also had no support (BF = 269.03).
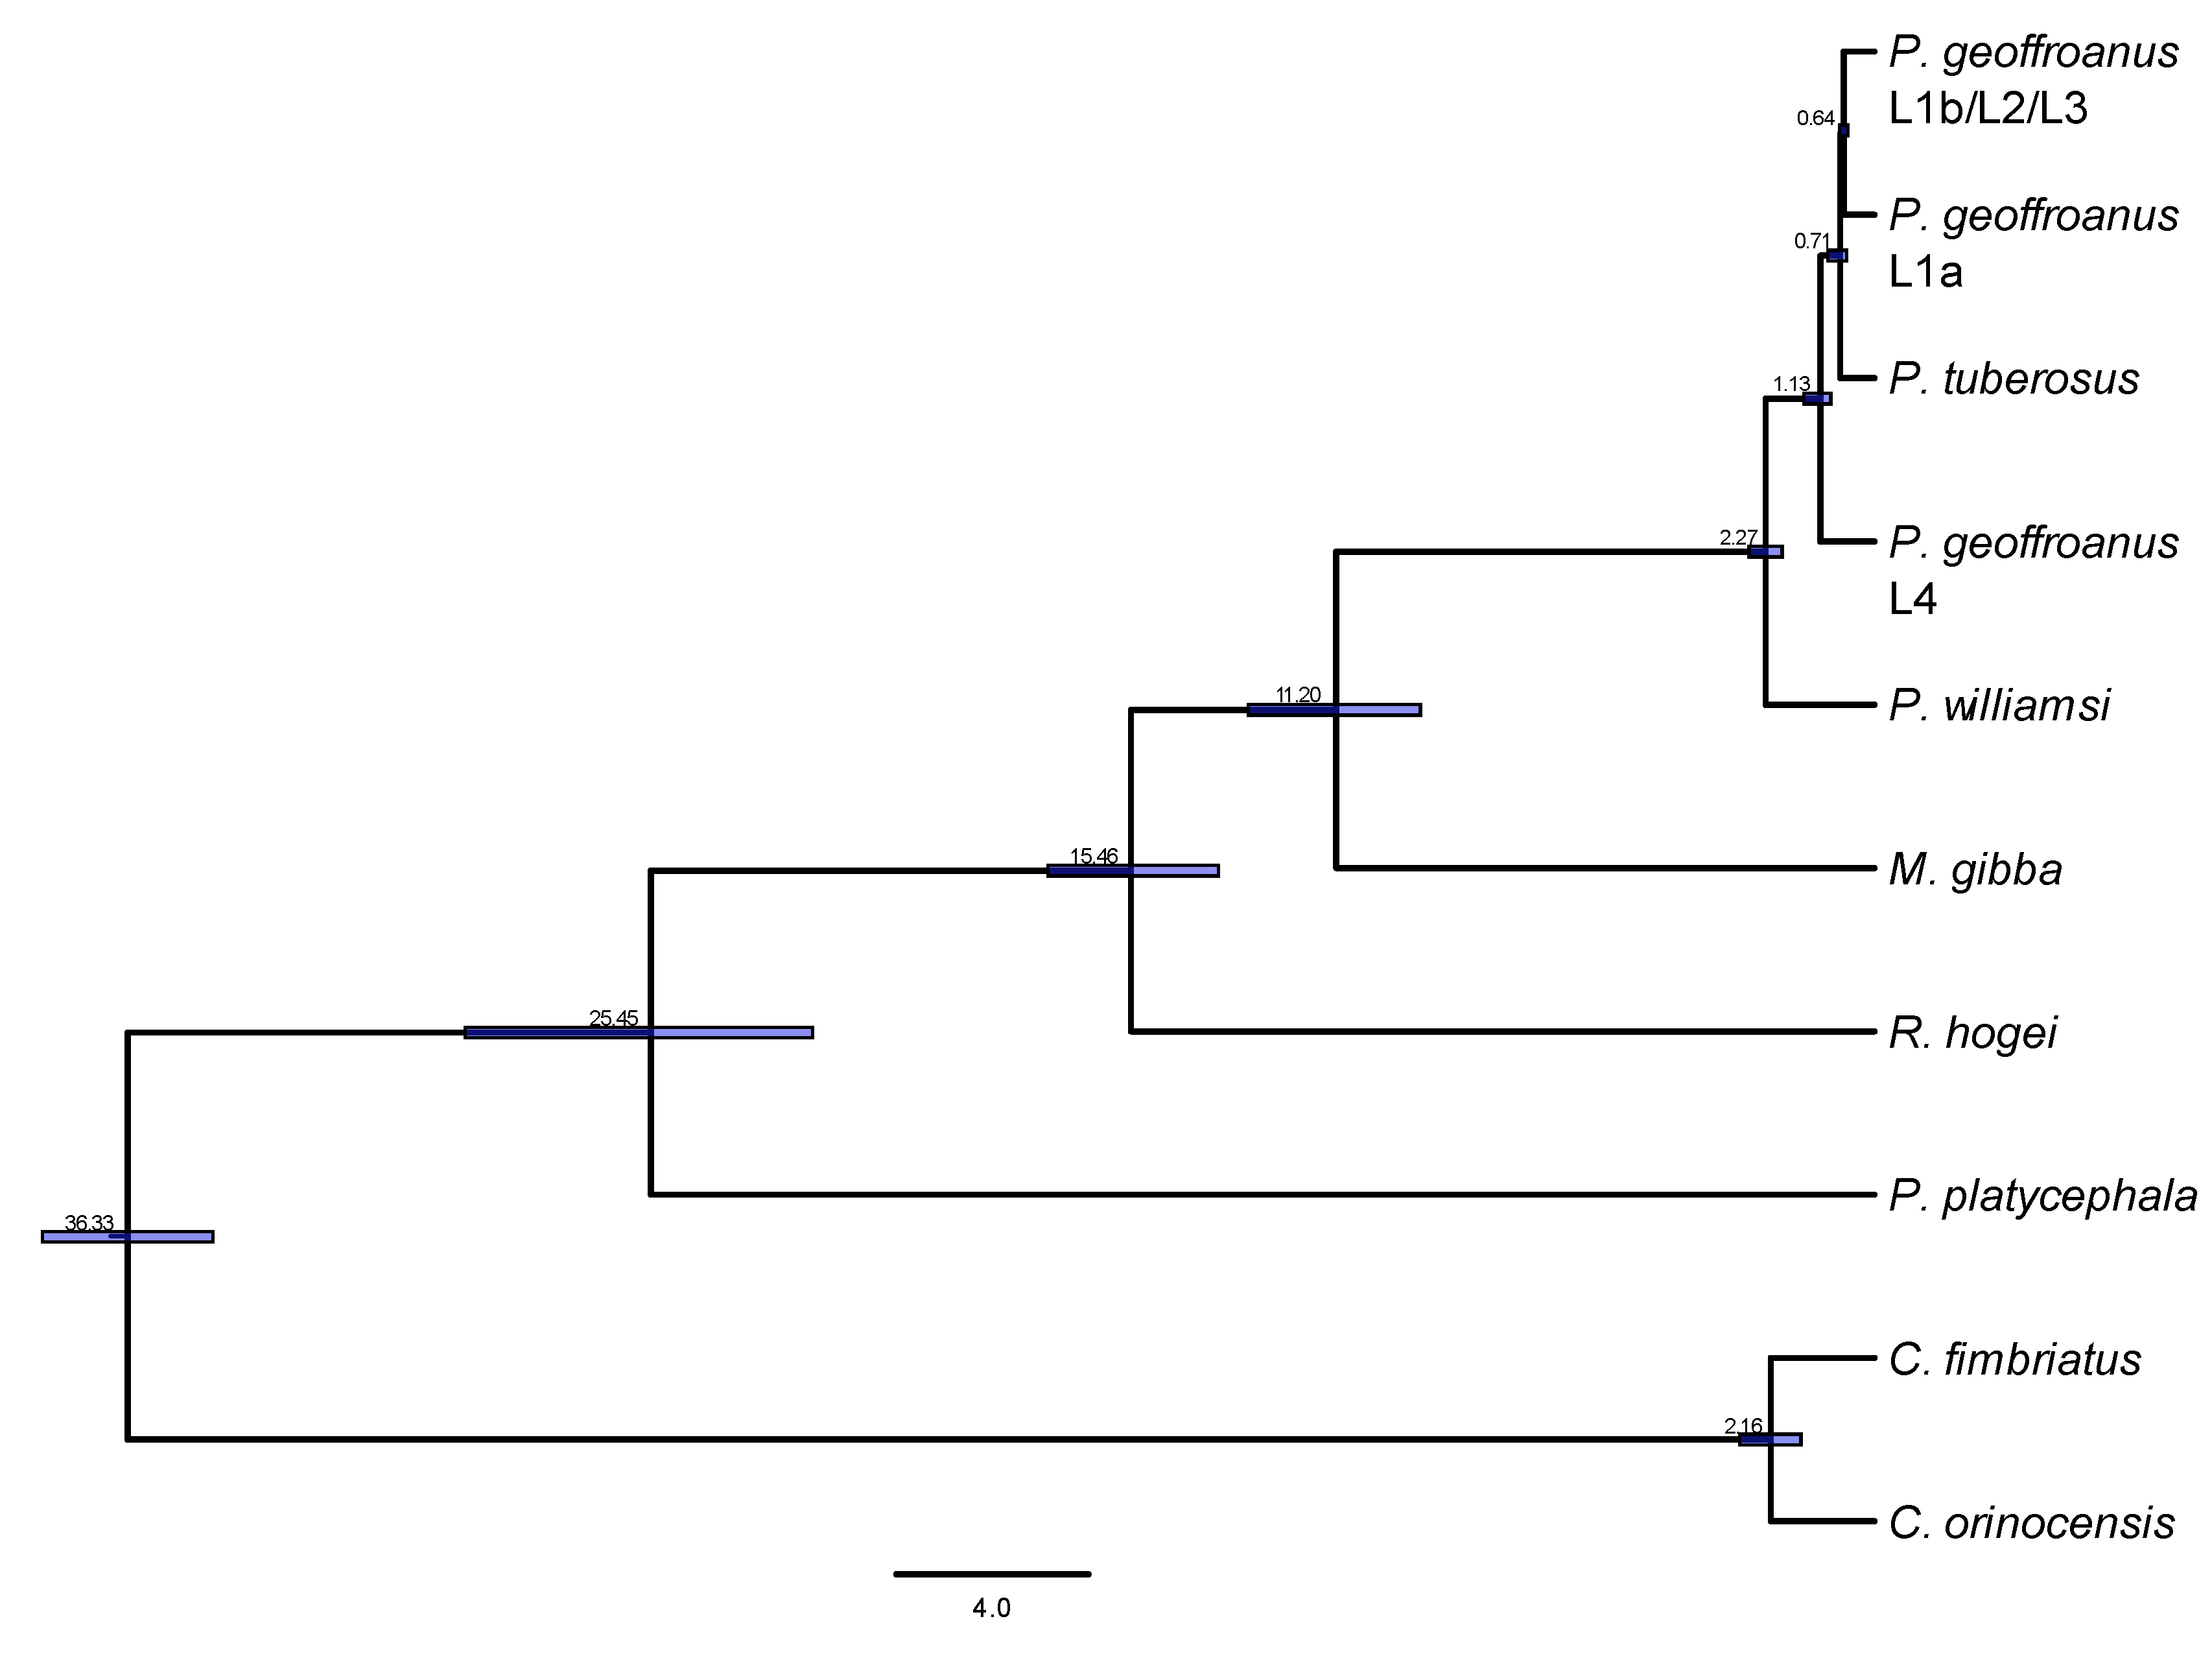
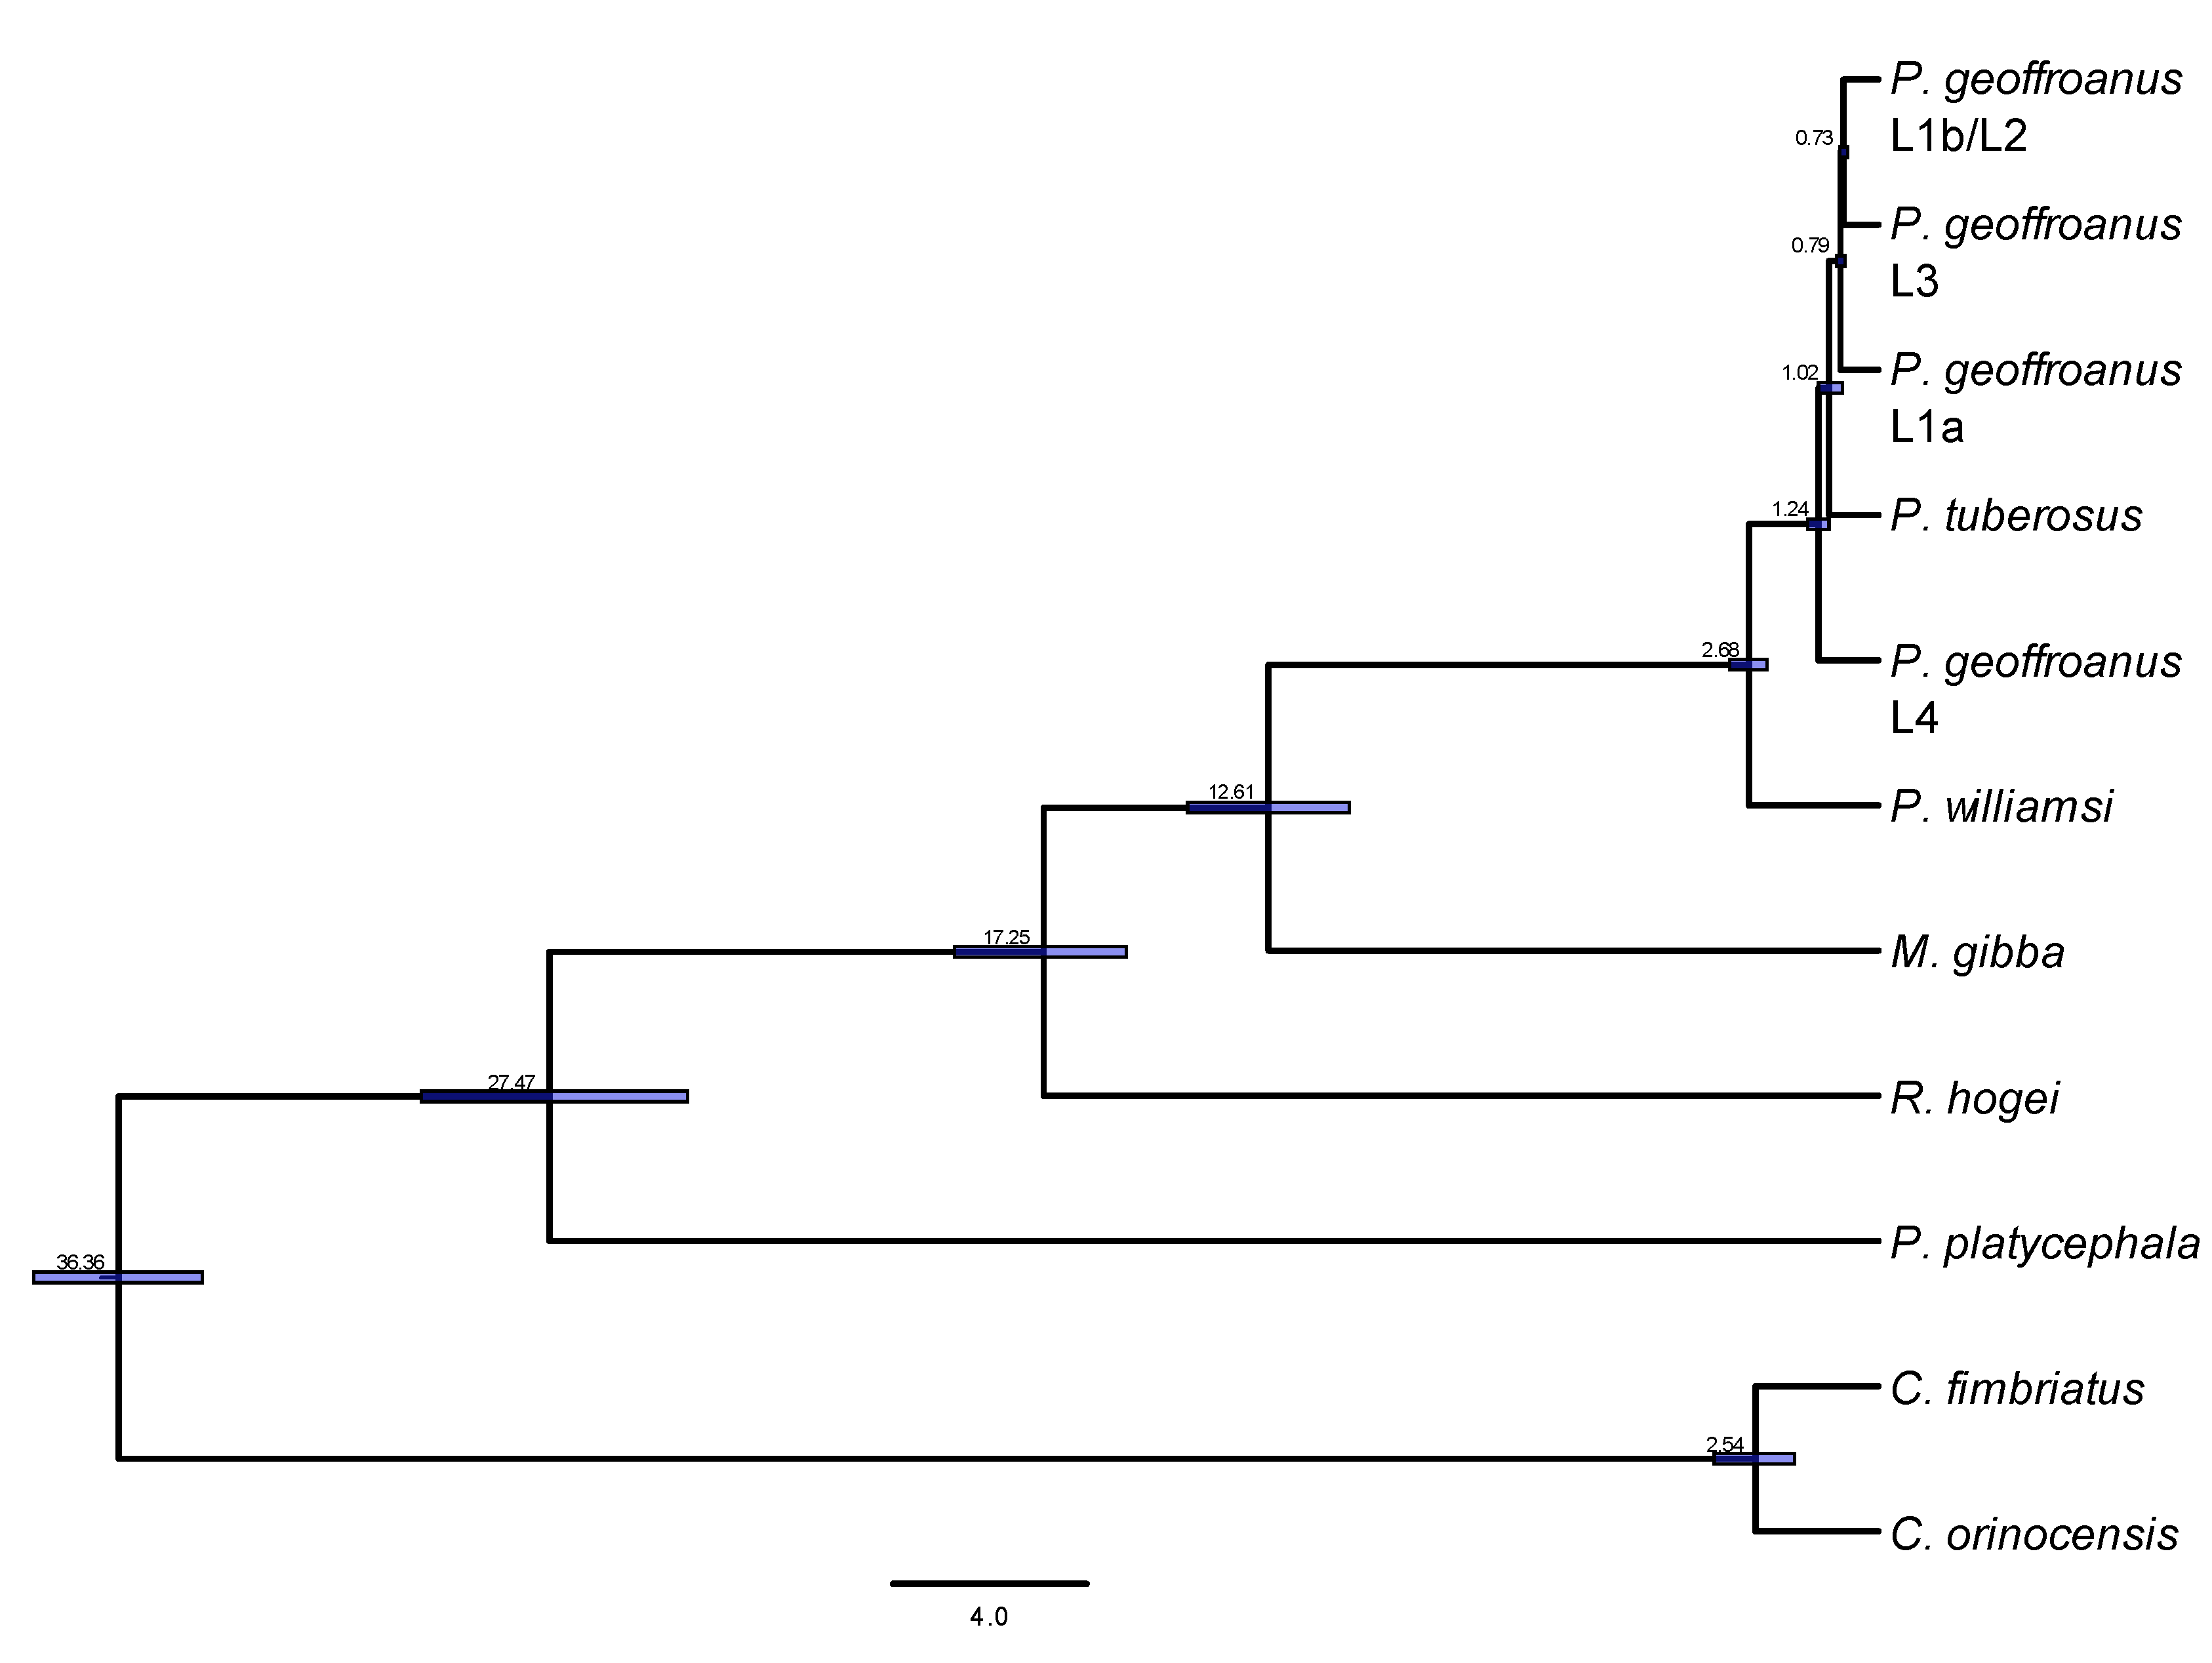
Genomic species trees. We reconstructed two dated species trees: the four species hypothesis (Figure 3) and the five species hypothesis (Figure 4). The topology of both phylogenies was congruent, as were divergence times. Phrynops williamsi diverged from the P. geoffroanus complex ~2.7 ma, and Phrynops tuberosus was nested within the P. geoffroanus complex. The crown age of the P. geoffroanus complex was 1.2 ma representing the divergence of the Atlantic Rainforest lineage of P. geoffroanus complex (L4) and all other lineages of the P. geoffroanus complex, including P. tuberosus, which occurs in the Amazonian savannas of Roraima. In the four species phylogeny, P. tuberosus diverged from all remaining lineages of P. geoffroanus at ~710 ka, and the Paraná lineage of P. geoffroanus diverged from the Amazon + São Francisco lineage of P. geoffroanus at ~640 ka; although the entire clade was highly supported (pp = 0.95), the sister taxon relationship of the Paraná and Amazon + São Francisco lineages was only weakly supported (pp = 0.57). In the five species phylogeny, P. tuberosus diverged from all remaining lineages of P. geoffroanus at ~1 ma, the Paraná lineage of P. geoffroanus diverged from the Amazon + São Francisco lineage of P. geoffroanus at ~790 ka, and the Amazon and São Francisco lineages diverged at ~730 ka of P. geoffroanus. The entire clade was weakly supported (pp = 0.70), and the sister relationships of the Paraná, Amazon, and São Francisco lineages were also weakly supported (pp = 0.92 and 0.90).
Morphometric analyses. The shape of males and females is significantly different (one-way MANOVA, F(1149) = 13.75, p = 0.00030). However, only 2 of the 33 linear measurements are significantly different between males and females, namely plastron width (t-test Holm’s p = 0.00196) and plastron length (t-test Holm’s p = 0.02425). The size of adult males and females is also significantly different, with females being approximately 7% larger than males (t-test t(148.75) = −2.6384, p = 0.00922). All subsequent analyses with morphometric data were therefore carried out separately for each sex.
We investigated which variables explain differences in shapes of each sex. Of the three variables analyzed (lineage, basin and biome) lineage and basin were significant for males (lineage: one-way MANOVA, F(74) = 5.911, p = 0.00113; basin: one-way MANOVA, F(71) = 3.332, p = 0.00600) and basin and biome were significant for females (basin: one-way MANOVA, F(66) = 2.604, p = 0.02510; biome: one-way MANOVA, F(67) = 3.733, p = 0.00485). Tukey’s honest significant differences test indicated this was caused by differences in the shape of males from the southern Atlantic forest basin where lineage L4 occurs when compared to males from other basins. In the case of females, Tukey’s honest significant differences test indicated differences in female shape were between the Caatinga and other biomes, but not the Amazon Forest biome; the significant difference by basin was accounted for by a single comparison between the Paraná and the northeastern Atlantic forest drainages. Significant results were observed in analyses of PCA data but not the residuals. Differences in the shape of both males and females are clearly very subtle to non-existent.
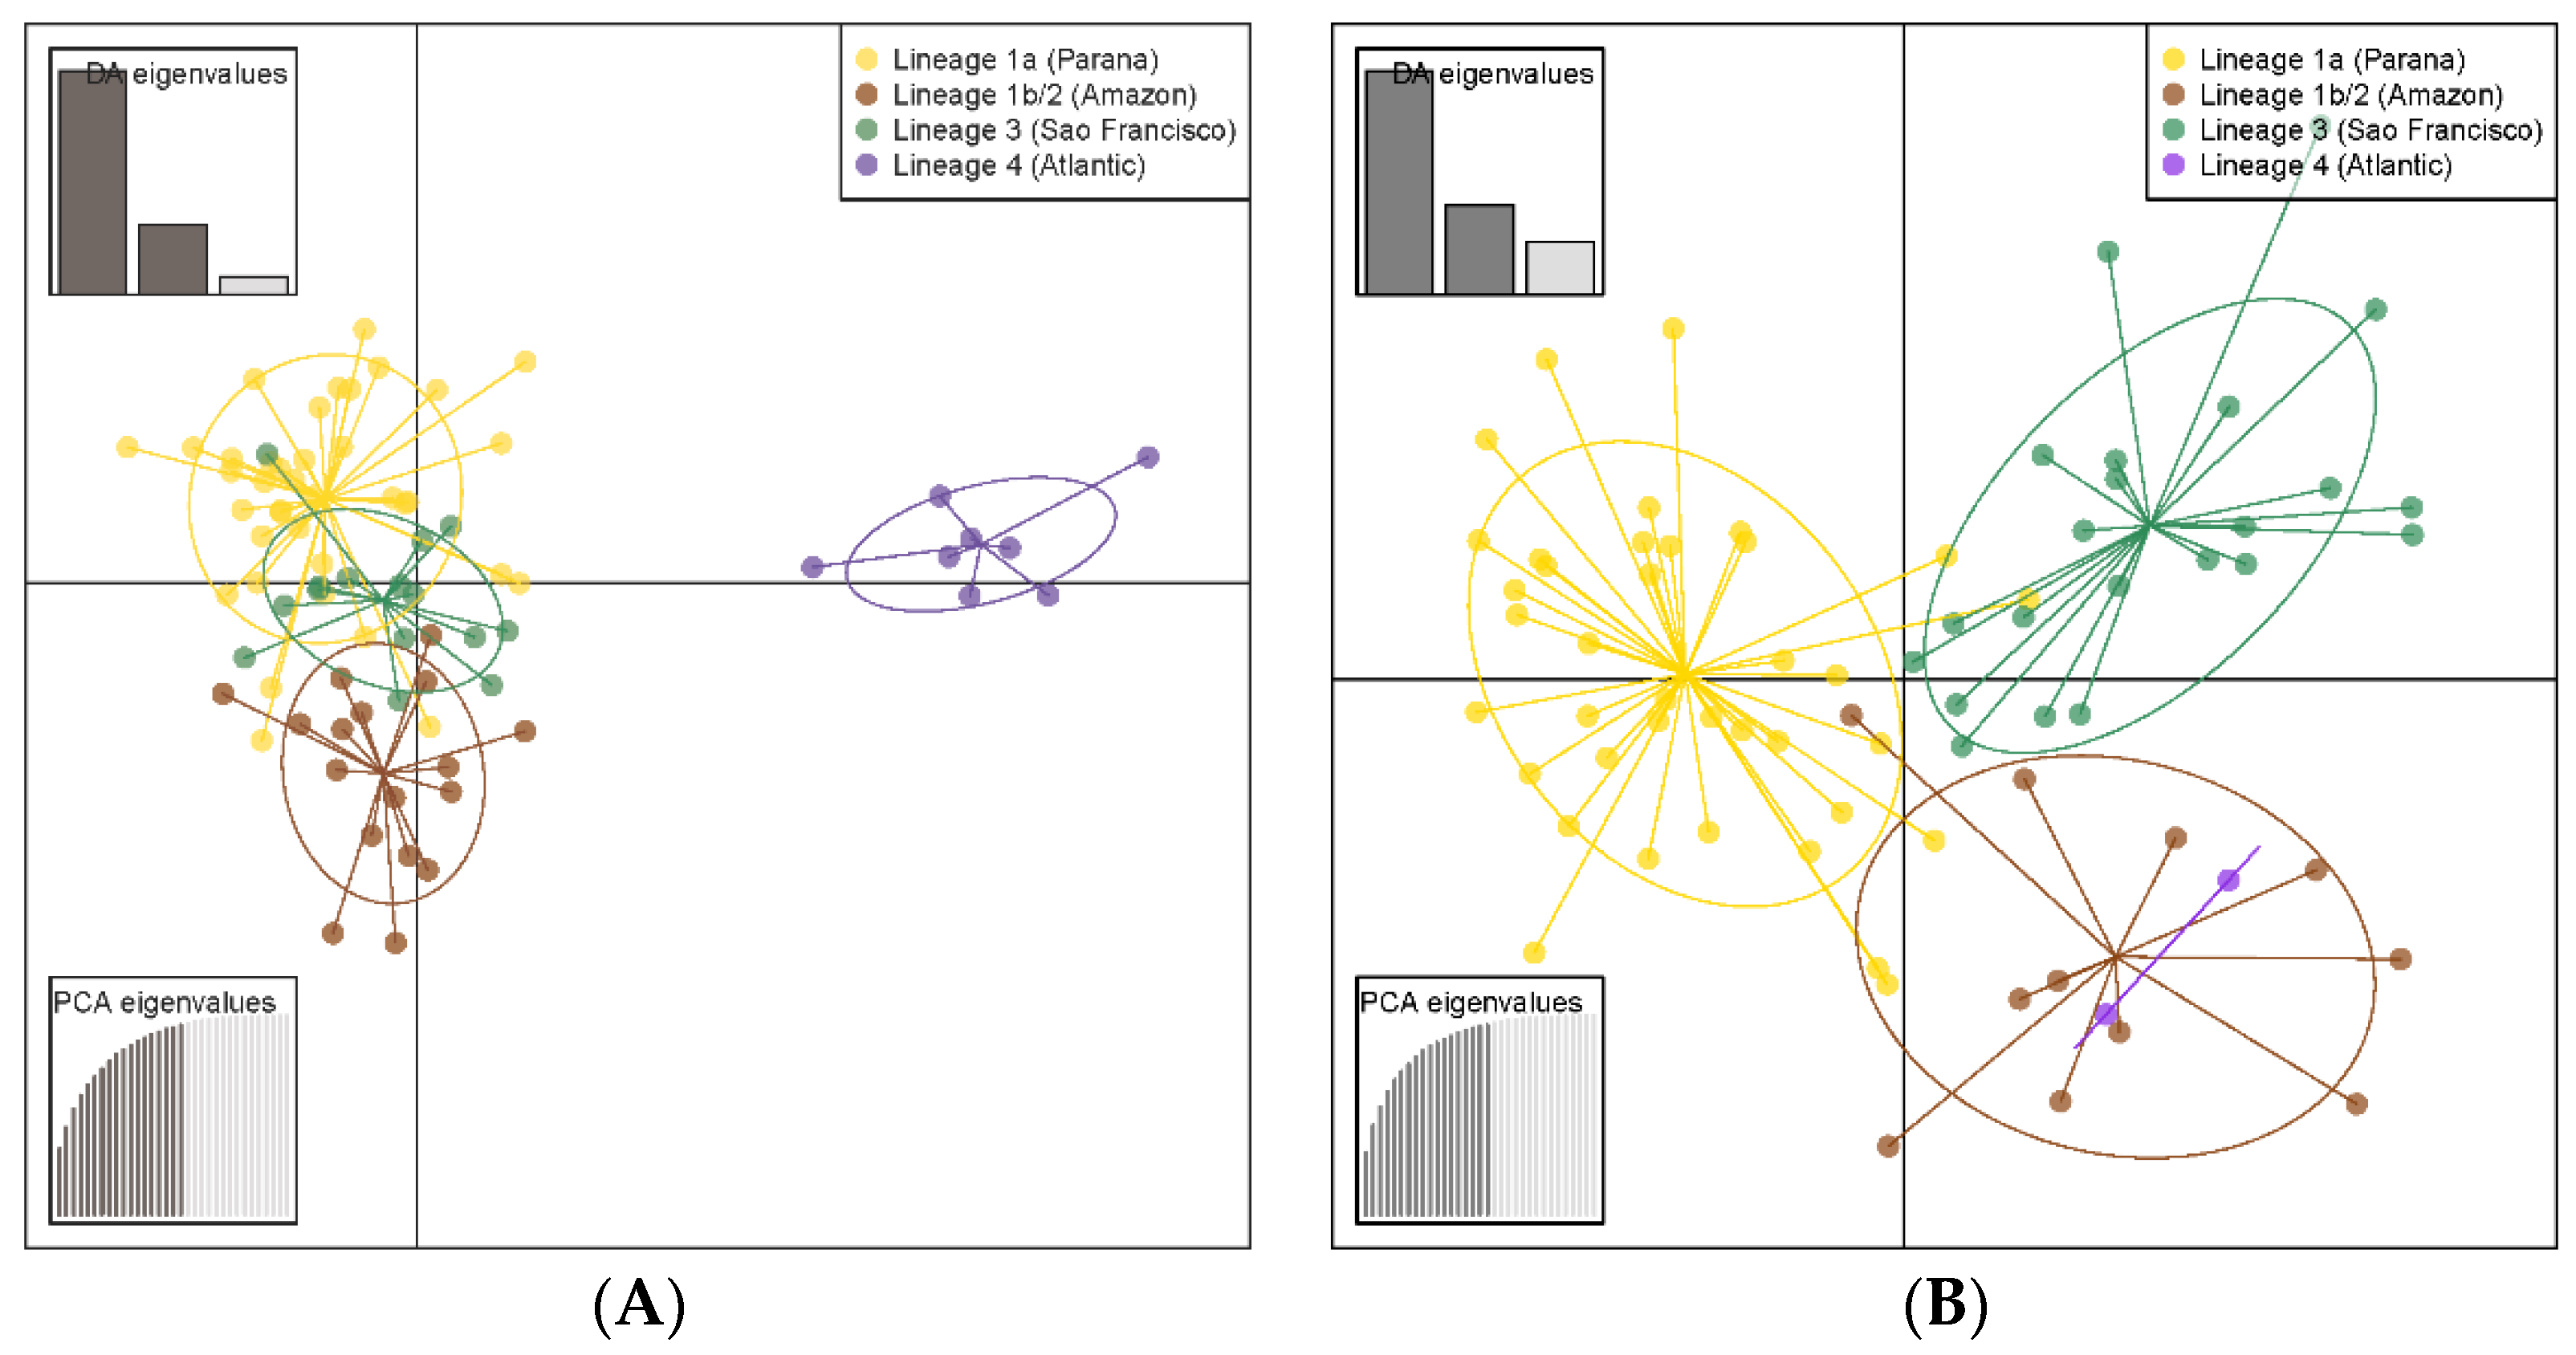
Discriminant analysis of principal components of males easily discriminated individuals of lineage L4 from the southern Atlantic forest, the first diverging lineage of the Phrynops geoffroanus species complex, from all others (Figure 5A). The other lineages could not be discriminated, however. For females, DAPC was able to largely unable to discriminate individuals (Figure 5B), with individuals of three of the four lineages overlapping in morphospace, while individuals of lineage L4 from the southern Atlantic forest were somewhat divergent, although this inference was hampered by low sample size.
Distribution analyses. Individuals of the four lineages of the Phrynops geoffroanus species complex are not randomly distributed among major river basins (Pearson’s X-squared = 440.67, df = 18, p < 2.2 × 10⁻¹⁶; Fisher’s exact test p < 2.2 × 10⁻¹⁶) and biomes (Pearson’s X-squared = 300.89, df = 15, p < 2.2 × 10⁻¹⁶; Fisher’s exact test p < 2.2 × 10⁻¹⁶) with major river basins being restricted to biomes.

4. Discussion

Testing taxonomic hypotheses using genomic data, we were able to provide support for four or potentially five species/lineages within the Phrynops geoffroanus species complex: Phrynops tuberosus from northern Amazonian savannas of Roraima, one species distributed in the Paraná–Paraguai basin (L1a), one species from southern and southeastern savannas of the Amazon basin (L1 + L2), one in the northeastern Atlantic forest–São Francisco basin (L3) and one in the southeastern Atlantic forest (L4). In the case of the four species hypothesis, animals from southern and southeastern savannas of the Amazon basin (L1 + L2) and the northeastern Atlantic forest–São Francisco basin (L3) would comprise just one taxon. Our results were consistent with the observation that many widely distributed Amazonian “species” are multiple geographically structured lineages/cryptic species that hide under the same epithet. This idea has been widely supported based on molecular evidence from terrestrial animals, e.g., the works of [1,2,14,64,65], and aquatic fauna, e.g., the works of [3,6,66].
Based on the dated species tree, these species/lineages diverged between 1.2 and 0.7 ma. These species/lineages are restricted to specific river basins and biomes (the two being largely correlated in our analysis) but are morphologically cryptic. While there are significant morphological differences between males and females, there were no statistically significant differences among the morphology of females and males of the different species, except for males from the southern Atlantic forest. In this region occurs species/lineage L4, a species/lineage that is sister to all other species/lineages of P. geoffroanus and P. tuberosus, from which it has diverged approximately 1.2 ma. Phrynops tuberosus and all other species/lineages of P. geoffroanus diverged at approximately 0.7 ma. The estimated divergence times are compatible with those of Thomson et al. [60], who estimated the divergence of P. tuberosus and P. geoffroanus at 1 ma.
An apparently surprising result of our analysis is the phylogenetic position of P. tuberosus. Phrynops tuberosus is generally considered the sister taxon of P. geoffroanus [60]; however, in our genomic analyses, it is sister to the clade comprising all species/lineages of P. geoffroanus except the southern Atlantic forest species/lineage. Males of the southern Atlantic forest species/lineage of P. geoffroanus are morphologically differentiated in the form of their plastron from other species/lineages of P. geoffroanus in addition to being the first diverging species of the P. geoffroanus species complex, and therefore likely represent a true case of mistaken identity, i.e., these individuals should not have been attributed to P. geoffroanus. Additionally, in the five species taxonomic hypothesis, the sister taxon relationship of P. tuberosus and all species/lineages except the southern Atlantic forest species/lineage was weakly supported (pp = 0.70), while in the four species taxonomic hypothesis, the posterior probability for this sister taxon relationship was 0.95. Similarly, in the SVDQuartet phylogeny (Figure 2), relationships among the species/lineages are also not well supported. In the mtDNA phylogeny (data not shown), P. tuberosus is a sister taxon to all species/lineages of the P. geoffroanus species complex. In conclusion, although there is strong support for the existence of multiple species/lineages in the P. geoffroanus complex, including P. tuberosus, phylogenetic relationships among these species/lineages are not well supported likely due to their relatively rapid and recent divergence.
Our data clearly show relatively recent divergences, from at least 1.2 to 0.7 ma, and very little divergence in morphology. The diversification of the P. geoffroanus species group is largely consistent with the evolutionary history of Chelidae in South America [6,33,67,68,69] and Neotropical Squamata [70,71,72], suggesting the same set of events that similarly affected the evolutionary history of multiple taxonomic groups.
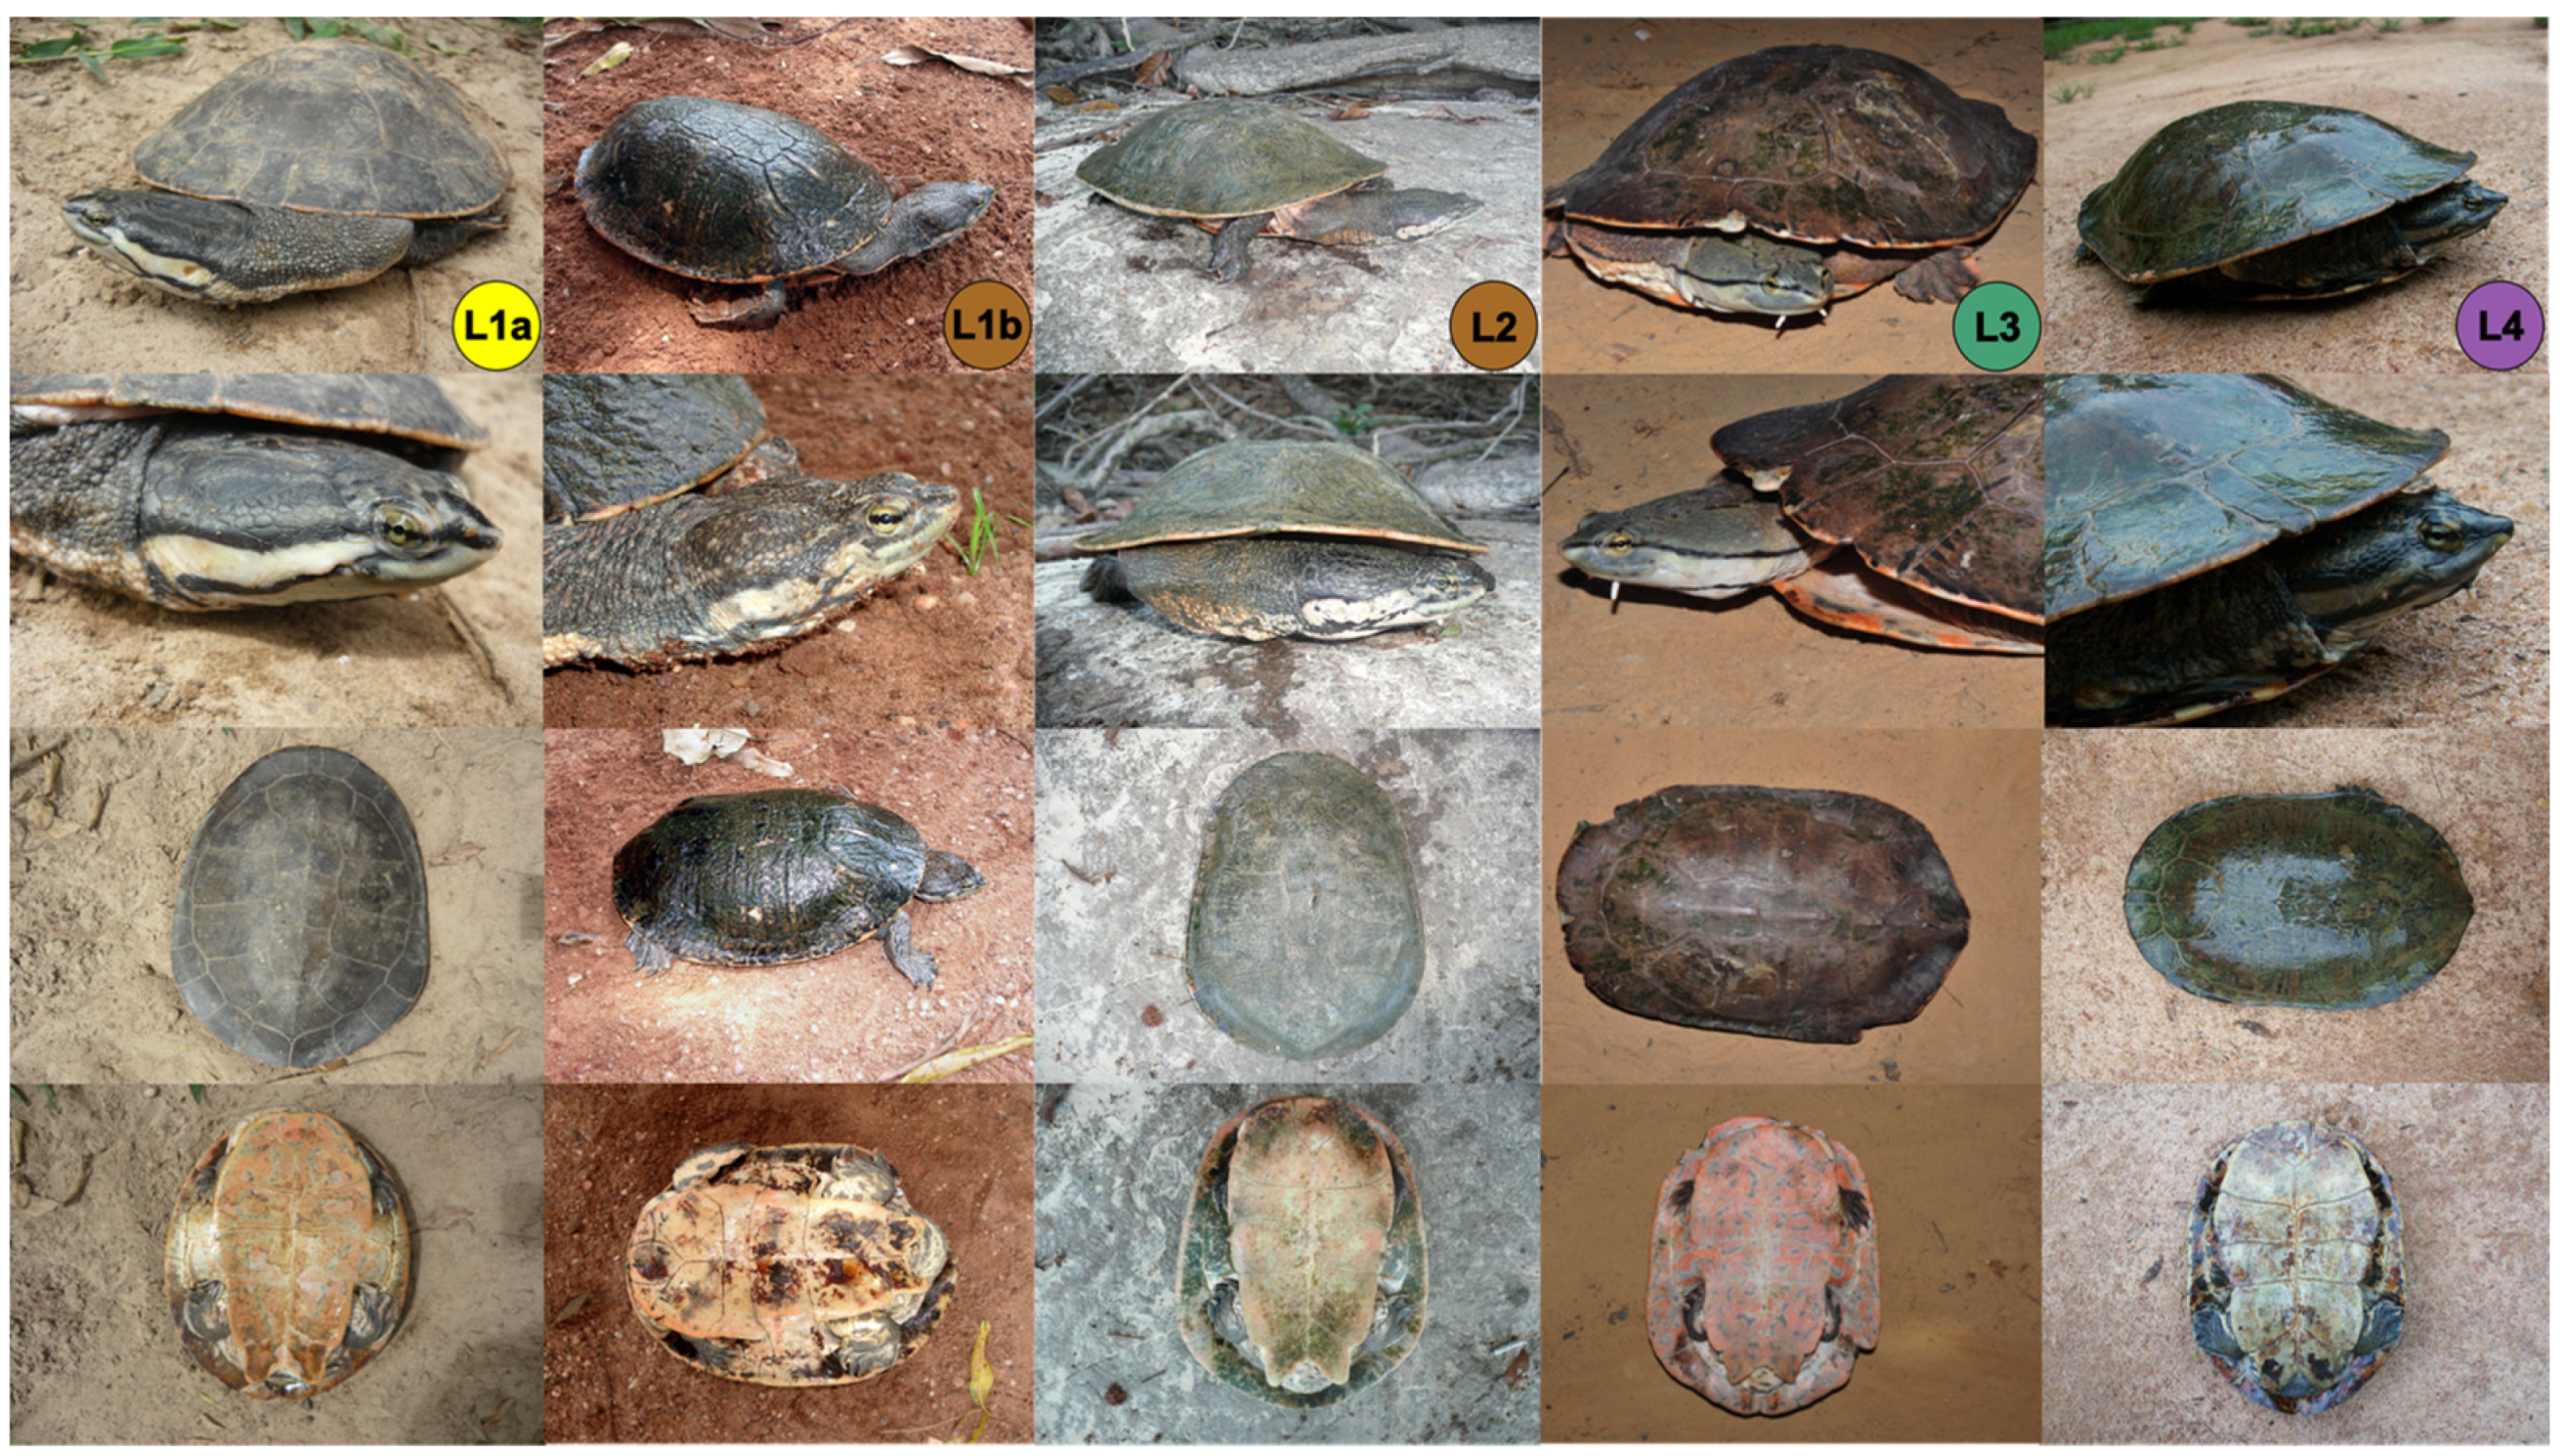
Morphologically cryptic diversification is also evident in many taxa that have divergence in the Late Miocene and the Pliocene. Possible explanations are simply just too little time and/or selective pressure for taxa that have speciated allopatrically but have not diverged ecologically to have accumulated any relevant morphological differences suitable for species-level diagnoses. The Neotropics in general and the Amazon specifically harbor large numbers of cryptic species, e.g., the works of [2,6,29,65,66,69,73,74,75]. Oftentimes, however, once discovered through phylogenetic and/or species delimitation methods, many of these taxa can be diagnosed once the search for diagnostic morphological characters is guided by molecular evidence. In the case of the P. geoffroanus species group, there really are minimal differences in the shape of individuals of the different cryptic species, even when a large number of individuals were analyzed and robust statistical methods were employed. However, there are differences in non-morphometric characters, including the color of the carapace, plastron, and lateral bands and stripes on the head (Figure 6). These findings are relevant to resolving the taxonomic uncertainties associated with the epithet P. geoffroanus. Historically this epithet has been applied to almost any and all individuals of the genus Phrynops from almost anywhere in South America [32,76]. Phrynops geoffroanus is also replete with junior synonyms that, although currently considered invalid, may, in fact, be valid taxa.
Rhodin and Mittermeier [34] were the first to investigate the taxonomic relationships within P. geoffroanus and to propose that P. geoffroanus is, in fact, a species complex, which has been accepted by other studies since then [24,30,32,73]. Our study supports this hypothesis for the first time based on broad geographic sampling, which revealed distinct and spatially structured species/lineages within P. geoffroanus. We provide clear evidence supporting four species/lineages that occupy distinct major river basins and biomes in South America. In addition, while taxonomic hypothesis tests support the existence of only one species/lineage shared between the Amazon and São Francisco basins, the second-best taxonomic hypothesis supports two species/lineages, one occupying the Amazon and one in the São Francisco basin. In addition, although not statistically significant, there are differences in shape and in color patterns of individuals from these two river basins. Therefore, animals from these two river basins may be in the early stages of divergence. We, therefore, propose that all these species/lineages be considered for conservation and decision-making purposes, although formal taxonomic revision needs to await a future study. As mentioned above, there are differences in color and pattern among the different species/lineages, and we are conducting a taxonomic revision of this group. However, any diagnostic characteristics are likely to be quite subtle, and therefore in situ species/lineage conservation efforts should focus less on identifying individuals and more on conserving individuals within a basin/biome.
Our results are relevant to future conservation decisions because decision making and policies are largely dependent on species and ecological and biogeographic models using these species [6,29,65,69]. Because reptiles have declined globally [24,27] and turtles are among the most endangered vertebrates [23,24], resolving the taxonomy of “P. geoffroanus” and other widely distributed taxa is particularly urgent. The IUCN has not yet evaluated P. geoffroanus, largely due to its large geographic distribution, but it is clear that “P. geoffroanus” is an epithet that encompasses multiple apparently cryptic species. These cryptic species are allopatrically distributed and occupy different portions of anthropogenic disturbance gradients (e.g., human density, pollution, deforestation). Therefore, we argue that a single conservation approach considering just one species of “P. geoffroanus” would be minimally ineffective if not detrimental.

Supplementary Materials

The following supporting information can be downloaded at: https://www.mdpi.com/article/10.3390/d14050360/s1. Table S1: List of genetic samples of Phrynops geoffroanus taxa used in this study, with localities, country, basins, geographic coordinates, museum voucher (see Methods). Table S2: List of morphometric data of Phrynops geoffroanus taxa used in this study.

Author Contributions

V.T.d.C., R.C.V., A.G.J.R. and R.A.M. conceived of the ideas; V.T.d.C., R.W.Á. and R.d.F. collected the data; V.T.d.C., T.H. and R.R.R., carried out the morphometric analyses; R.C.V., A.G.J.R., R.A.M., R.W.Á., T.H. and I.P.F. contributed fieldwork/reagents/materials/analysis tools; V.T.d.C. performed the molecular laboratory work; R.R.R. carried out the species delimitation analysis; V.T.d.C. and M.d.S.N. prepared the molecular data sets; V.T.d.C., T.H. and I.P.F. carried out the phylogenetic and data analyses. V.T.d.C., T.H. and I.P.F. coordinated and supervised the study; and V.T.d.C., T.H. and I.P.F. led the writing. All authors have read and agreed to the published version of the manuscript.

Funding

Collecting the turtles was financed by Conservation International, Global Wildlife Conservation, the Mohamed bin Zayed Species Conservation Fund 1025921, Conselho Nacional de Pesquisa e Desenvolvimento Tecnológico–CNPq SISBIOTA 563348/2010-0, and Fundação de Amparo à Pesquisa do Estado do Amazonas–FAPEAM, SISBIOTA/FAPEAM to IPF, Projeto Quelônios da Amazônia–Petrobrás Ambiental to RCV. RWA thanks Conselho Nacional de Pesquisa e Desenvolvimento Científico e Tecnológico (CNPq) for providing a research fellowship (# 303622/2015-6; 305988/2018-2) and CNPq/FUNCAP/CAPES (PROTAX–Processes 440511/2015-1; 5574685/2017; 88882.156872/2016-01). The doctoral studies scholarship to VTC was financed by Fundação de Amparo à Pesquisa do Estado do Amazonas and Coordenação de Aperfeiçoamento de Pessoal de Nível Superior–CAPES (PNPD).

Institutional Review Board Statement

Permission to carry out the fieldwork and the collection of tissue samples was granted by the Instituto Brasileiro do Meio Ambiente e dos Recursos Naturais Renováveis (IBAMA [Brazilian Institute of the Environment and Renewable Natural Resources]) and the Instituto Chico Mendes de Conservação da Biodiversidade (ICMBio [Chico Mendes Institute of Conservation of Biodiversity]) (licenses number: 43175–2). Animal tissue collection was undertaken in accordance with the ethical recommendations of the Conselho Federal de Biologia (CFBio; Federal Council of Biologists), Resolution 301 (8 December 2012).

Informed Consent Statement

Not applicable.

Data Availability Statement

Molecular data associated with this study are deposited in GenBank under the following accession numbers: ON063048-ON063118 (COI), ON061103-ON061173 (Cytb), ON063137-ON063207 (16S); SUB11224878 (ddRAD).

Acknowledgments

The number of people who helped in the field collecting the turtles is too numerous to mention here, but all are graciously acknowledged and thanked. Diego Baldo is thanked for the donation of samples from Argentina. We also thank Sandra Hernandez for generating the genomic data for the outgroups. The Instituto Chico Mendes de Conservação da Biodiversidade provided the collecting permit (MMA/ICMBio/SISBIO 43175–2). This article is a tribute to the lifetime of research of Richard Vogt, whose dedication to the study and conservation of Amazonian turtles was without precedent.

Conflicts of Interest

The authors declare no conflict of interest.

References

  1. De Oliveira, D.P.; de Carvalho, V.T.; Hrbek, T. Cryptic diversity in the lizard genus Plica (Squamata): Phylogenetic diversity and Amazonian biogeography. Zool. Scr. 2016, 45, 630–641. [Google Scholar] [CrossRef]
  2. Rojas, R.R.; Fouquet, A.; Ron, S.R.; Hernández-Ruz, E.J.; Melo-Sampaio, P.R.; Chaparro, J.C.; Vogt, R.C.; de Carvalho, V.T.; Pinheiro, L.; Ávila, R.W.; et al. A Pan-Amazonian species delimitation: High species diversity within the genus Amazophrynella (Anura: Bufonidae). PeerJ 2018, 6, e4941. [Google Scholar] [CrossRef] [PubMed] [Green Version]
  3. Machado, V.N.; Collins, R.A.; Ota, R.P.; Andrade, M.C.; Farias, I.P.; Hrbek, T. One thousand DNA barcodes of piranhas and pacus reveal geographic structure and unrecognised diversity in the Amazon. Sci. Rep. 2018, 8, 8387. [Google Scholar] [CrossRef]
  4. Kehlmaier, C.; Zhang, X.; Georges, A.; Campbell, P.D.; Thomson, S.A.; Fritz, U. Mitogenomics of historical type specimens of Australasian turtles: Clarification of taxonomic confusion and old mitochondrial introgression. Sci. Rep. 2019, 9, 5841. [Google Scholar] [CrossRef] [Green Version]
  5. Friol, N.R. Revisão Taxonômica e Filogenia das Espécies Sul-Americanas de Chelidae (Testudines: Pleurodira). Ph.D. Thesis, University of São Paulo, São Paulo, Brazil, 2019. [Google Scholar]
  6. Vargas-Ramírez, M.; Caballero, S.; Morales-Betancourt, M.A.; Lasso, C.A.; Amaya, L.; Martínez, J.G.; Viana, M.D.N.S.; Vogt, R.C.; Farias, I.P.; Hrbek, T.; et al. Genomic analyses reveal two species of the matamata (Testudines: Chelidae: Chelus spp.) and clarify their phylogeography. Mol. Phylogenet. Evol. 2020, 148, 106823. [Google Scholar] [CrossRef] [PubMed]
  7. de Queiroz, K. Species concepts and species delimitation. Syst. Biol. 2007, 56, 879–886. [Google Scholar] [CrossRef] [Green Version]
  8. Roe, A.D.; Sperling, F.A.H. Population structure and species boundary delimitation of cryptic Dioryctria moths: An integrative approach. Mol. Ecol. 2007, 16, 3617–3633. [Google Scholar] [CrossRef]
  9. Sites, J.W.; Marshall, J.C. Delimiting species: A Renaissance issue in systematic biology. Trends Ecol. Evol. 2003, 18, 462–470. [Google Scholar] [CrossRef] [Green Version]
  10. Vacher, J.-P.; Chave, J.; Ficetola, F.G.; Sommeria-Klein, G.; Tao, S.; Thébaud, C.; Blanc, M.; Camacho, A.; Cassimiro, J.; Colston, T.J.; et al. Large-scale DNA-based survey of frogs in Amazonia suggests a vast underestimation of species richness and endemism. J. Biogeogr. 2020, 47, 1781–1791. [Google Scholar] [CrossRef]
  11. Hay, W.W.; DeConto, R.; Wold, C.N.; Wilson, K.M.; Voigt, S.; Schulz, M.; Wold-Rossby, A.; Dullo, W.-C.; Ronov, A.B.; Balukhovsky, A.N.; et al. Alternative global cretaceous paleogeography. In The Evolution of Cretaceous Ocean/Climate Systems; Barrera, E., Johnson, C., Eds.; Geological Society of America Special Paper 332; Geological Society of America: Boulder, CO, USA, 1999; pp. 1–47. [Google Scholar]
  12. Huebinger, R.M.; Bickham, J.W.; Rhodin, A.G.J.; Mittermeier, R.A. Mitochondrial DNA corroborates taxonomy of the South American chelid turtles of the genera Platemys and Acanthochelys. Chelonian Conserv. Biol. 2013, 12, 168–171. [Google Scholar] [CrossRef]
  13. Carvalho, V.T.D.; Martínez, J.G.; Hernández-Rangel, S.M.; Astolfi-Filho, S.; Vogt, R.C.; Farias, I.P.; Hrbek, T. Giving IDs to turtles: SNP markers for assignment of individuals to lineages of the geographically structured Phrynops geoffroanus (Chelidae: Testudines). Conserv. Genet. Resour. 2017, 9, 157–163. [Google Scholar] [CrossRef]
  14. Ferrão, M.; Colatreli, O.P.; de Fraga, R.; Kaefer, I.L.; Moravec, J.; Lima, A.P. High species richness of Scinax treefrogs (Hylidae) in a threatened Amazonian landscape revealed by an integrative approach. PLoS ONE 2016, 11, e0165679. [Google Scholar] [CrossRef] [PubMed]
  15. Gehara, M.; Crawford, A.J.; Orrico, V.G.D.; Rodríguez, A.; Lötters, S.; Fouquet, A.; Barrientos, L.S.; Brusquetti, F.; De la Riva, I.; Ernst, R.; et al. High levels of diversity uncovered in a widespread nominal taxon: Continental phylogeography of the Neotropical tree frog Dendropsophus minutus. PLoS ONE 2014, 9, e103958. [Google Scholar] [CrossRef] [Green Version]
  16. Shamblin, B.M.; Dutton, P.H.; Bjorndal, K.A.; Bolten, A.B.; Naro-Maciel, E.; Santos, A.J.B.; Bellini, C.B.; Marcovaldi, M.A.; Nairn, C.J. Deeper mitochondrial sequencing reveals cryptic diversity and structure in Brazilian Green Turtle rookeries. Chelonian Conserv. Biol. 2015, 14, 167–172. [Google Scholar] [CrossRef]
  17. Guarnizo, C.E.; Werneck, F.P.; Giugliano, L.G.; Santos, M.G.; Fenker, J.; Sousa, L.; D’Angiolella, A.B.; dos Santos, A.R.; Strüssmann, C.; Rodrigues, M.T.U.; et al. Cryptic lineages and diversification of an endemic anole lizard (Squamata, Dactyloidae) of the Cerrado hotspot. Mol. Phylogenet. Evol. 2016, 94, 279–289. [Google Scholar] [CrossRef] [Green Version]
  18. Faith, D.P.; Reed, C.A.; Hunter, J. Integrating phylogenetic diversity, complementarity, and endemism for conservation assessment. Conserv. Biol. 2004, 18, 255–261. [Google Scholar] [CrossRef]
  19. Hebert, P.D.N.; Cywinska, A.; Ball, S.L.; deWaard, J.R. Biological identifications through DNA barcodes. Proc. R. Soc. Lond. Ser. B Biol. Sci. 2003, 270, 313–321. [Google Scholar] [CrossRef] [Green Version]
  20. Pons, J.; Barraclough, T.G.; Gomez-Zurita, J.; Cardoso, A.; Duran, D.P.; Hazell, S.; Kamoun, S.; Sumlin, W.D.; Vogler, A.P. Sequence-based species delimitation for the DNA taxonomy of undescribed insects. Syst. Biol. 2006, 55, 595–609. [Google Scholar] [CrossRef] [Green Version]
  21. Yang, Z.; Rannala, B. Bayesian species delimitation using multilocus sequence data. Proc. Natl. Acad. Sci. USA 2010, 107, 9264–9269. [Google Scholar] [CrossRef] [Green Version]
  22. Bickford, D.P.; Lohman, D.J.; Sodhi, N.S.; Ng, P.K.L.; Meier, R.; Winker, K.; Ingram, K.K.; Das, I. Cryptic species as a window on diversity and conservation. Trends Ecol. Evol. 2007, 22, 148–155. [Google Scholar] [CrossRef]
  23. Rhodin, A.G.J.; Stanford, C.B.; Dijk, P.P.V.; Eisemberg, C.C.; Luiselli, L.; Mittermeier, R.A.; Hudson, R.; Horne, B.D.; Goode, E.V.; Kuchling, G.; et al. Global Conservation Status of Turtles and Tortoises (Order Testudines). Chelonian Conserv. Biol. 2018, 17, 135. [Google Scholar] [CrossRef]
  24. Rhodin, A.G.J.; Iverson, J.B.; Bour, R.; Fritz, U.; Georges, A.; Shaffer, H.B.; van Dijk, P.P. Turtles of the World: Annotated Checklist and Atlas of Taxonomy, Synonymy, Distribution, and Conservation Status, 8th ed.; Chelonian Research Foundation & Turtle Conservancy: New York, NY, USA, 2017; ISBN 9781532350269. [Google Scholar]
  25. Moll, D.; Moll, E.O. The Ecology, Exploitation and Conservation of River Turtles; Oxford University Press: New York, NY, USA, 2004; ISBN 0195102290. [Google Scholar]
  26. Van Dijk, P.P.; Stuart, B.L.; Rhodin, A.G.J. Asian Turtle Trade: Proceedings of a Workshop on Conservation and Trade of Freshwater Turtles and Tortoises in Asia. Chelonian Res. Monogr. No. 2 2000, 2, 269. [Google Scholar]
  27. Gibbons, J.W.; Scott, D.E.; Ryan, T.J.; Buhlmann, K.A.; Tuberville, T.D.; Metts, B.S.; Greene, J.L.; Mills, T.; Leiden, Y.; Poppy, S.; et al. The global decline of reptiles, Déjà Vu amphibians. Bioscience 2000, 50, 653. [Google Scholar] [CrossRef] [Green Version]
  28. Bour, R. Global diversity of turtles (Chelonii; Reptilia) in freshwater. Hydrobiologia 2008, 595, 593–598. [Google Scholar] [CrossRef]
  29. Muniz, F.D.L.; Campos, Z.; Hernández-Rangel, S.M.; Martínez, J.G.; Souza, B.C.; de Thoisy, B.; Botero-Arias, R.; Hrbek, T.; Farias, I.P. Delimitation of evolutionary units in Cuvier’s dwarf caiman, Paleosuchus palpebrosus (Cuvier, 1807): Insights from conservation of a broadly distributed species. Conserv. Genet. 2018, 19, 599–610. [Google Scholar] [CrossRef]
  30. Vogt, R.C. Amazon Turtles; Grafica Biblos SA: Lima, Peru, 2008; ISBN 6034017076. [Google Scholar]
  31. Roberto, I.J.; Bittencourt, P.S.; Muniz, F.D.L.; Hernández-Rangel, S.M.; Nóbrega, Y.C.; Ávila, R.W.; Souza, B.C.; Alvarez, G.; Miranda-Chumacero, G.; Campos, Z.; et al. Unexpected but unsurprising lineage diversity within the most widespread Neotropical crocodilian genus Caiman (Crocodylia, Alligatoridae). Syst. Biodivers. 2020, 18, 377–395. [Google Scholar] [CrossRef]
  32. Rueda-Almonacid, J.V.; Carr, J.L.; Mittermeier, R.A.; Rodríguez-Mahecha, J.V.; Mast, R.B.; Vogt, R.C.; Rhodin, A.G.J.; de La Ossa-Velásquez, J.; Rueda, J.N.; Mittermeier, C.G. Las Tortugas y los Cocodrilianos de los Países Andinos del Trópico; Editorial Panamericana, Formas e Impressos: Bogota, Colombia, 2007; Volume 6. [Google Scholar]
  33. McCord, W.P.; Joseph-Ouni, M.; Lamar, W.W. A taxonomic reevaluation of Phrynops (Testudines: Chelidae) with the description of two new genera and a new species of Batrachemys. Rev. Biol. Trop. 2001, 49, 715–764. [Google Scholar]
  34. Rhodin, A.G.J.; Mittermeier, R.A. Description of Phrynops williamsi, a new species of chelid turtle of the South American P. geoffroanus complex. In Advances in Herpetology and Evolutionary Biology. Essays in Honor of Ernest E. Williams; Rhodin, A.G.J., Miyata, K., Eds.; Museum of Comparative Zoology: Cambridge, MA, USA, 1983; pp. 58–73. [Google Scholar]
  35. Schneider, L.; Ferrara, C.R.; Vogt, R.C.; Guilhon, A.V. Nesting ecology and nest predation of Phrynops geoffroanus (Testudines, Chelidae) in the Guaporé River of the Brazilian and Bolivian Amazon. Chelonian Conserv. Biol. 2011, 10, 206–212. [Google Scholar] [CrossRef]
  36. Sambrook, J.; Russell, D. Molecular Cloning: A Laboratory Manual, 3rd ed.; Cold Springs Harbor Laboratory Press: Cold Springs Harbor, NY, USA, 2001. [Google Scholar]
  37. Palumbi, S.R. Nucleic acids II: The polymerase chain reaction. In Molecular Systematics; Hillis, D.M., Moritz, C., Mable, B.K., Eds.; Sinauer Associates, Inc.: Sunderland, MA, USA, 1996; pp. 205–247. [Google Scholar]
  38. Pääbo, S. Amplifying ancient DNA. In PCR Protocols: A Guide to Methods and Applications; Innes, M.A., Gelfand, D.H., Sninsky, J.J., White, T.J., Eds.; Academic Press: San Diego, CA, USA, 1990; pp. 159–166. [Google Scholar]
  39. Taberlet, P.; Meyer, A.; Bouvet, J. Unusual mitochondrial DNA polymorphism in two local populations of blue tit (Parus caeruleus). Mol. Ecol. 1992, 1, 27–36. [Google Scholar] [CrossRef]
  40. Reid, B.N.; Le, M.; McCord, W.P.; Iverson, J.B.; Georges, A.; Bergmann, T.; Amato, G.; DeSalle, R.; Naro-Maciel, E. Comparing and combining distance-based and character-based approaches for barcoding turtles. Mol. Ecol. Resour. 2011, 11, 956–967. [Google Scholar] [CrossRef] [Green Version]
  41. Kearse, M.; Moir, R.; Wilson, A.; Stones-Havas, S.; Cheung, M.; Sturrock, S.; Buxton, S.; Cooper, A.; Markowitz, S.; Duran, C.; et al. Geneious basic: An integrated and extendable desktop software platform for the organization and analysis of sequence data. Bioinforma. Appl. Note 2012, 28, 1647–1649. [Google Scholar] [CrossRef] [PubMed]
  42. Thompson, J.D.; Higgins, D.G.; Gibson, T.J. CLUSTAL W: Improving the sensitivity of progressive multiple sequence alignment through sequence weighting, position-specific gap penalties and weight matrix choice. Nucleic Acids Res. 1994, 22, 4673–4680. [Google Scholar] [CrossRef] [PubMed] [Green Version]
  43. Peterson, B.K.; Weber, J.N.; Kay, E.H.; Fisher, H.S.; Hoekstra, H.E. Double digest RADseq: An inexpensive method for de novo SNP discovery and genotyping in model and non-model species. PLoS ONE 2012, 7, e37135. [Google Scholar] [CrossRef] [PubMed] [Green Version]
  44. Eaton, D.A.R. PyRAD: Assembly of de novo RADseq loci for phylogenetic analyses. Bioinformatics 2014, 30, 1844–1849. [Google Scholar] [CrossRef] [PubMed]
  45. Gauthier, J.; Mouden, C.; Suchan, T.; Alvarez, N.; Arrigo, N.; Riou, C.; Lemaitre, C.; Peterlongo, P. DiscoSnp-RAD: De novo detection of small variants for RAD-Seq population genomics. PeerJ 2020, 8, e9291. [Google Scholar] [CrossRef] [PubMed]
  46. Chifman, J.; Kubatko, L.S. Quartet inference from SNP data under the coalescent model. Bioinformatics 2014, 30, 3317–3324. [Google Scholar] [CrossRef] [Green Version]
  47. Swofford, D.L. PAUP*. Phylogenetic Analysis Using Parsimony (and Other Methods), Beta Version 4b10 2002. Available online: https://paup.phylosolutions.com/ (accessed on 15 July 2020).
  48. Bouckaert, R.R.; Vaughan, T.G.; Barido-Sottani, J.; Duchene, S.; Fourment, M.; Gavryushkina, A.; Heled, J.; Jones, G.; Kuhnert, D.; de Maio, N.; et al. BEAST 2.5: An advanced software platform for Bayesian evolutionary analysis. PLoS Comput. Biol. 2019, 15, e1006650. [Google Scholar] [CrossRef] [Green Version]
  49. Darriba, D.; Taboada, G.L.; Doallo, R.; Posada, D. jModelTest 2: More models, new heuristics and parallel computing. Nat. Methods 2012, 9, 772. [Google Scholar] [CrossRef] [Green Version]
  50. Rambaut, A.; Drummond, A.J.; Xie, D.; Baele, G.; Suchard, M.A. Posterior summarization in Bayesian phylogenetics using Tracer 1.7. Syst. Biol. 2018, 67, 901–904. [Google Scholar] [CrossRef] [Green Version]
  51. Fujisawa, T.; Barraclough, T.G. Delimiting species using single-locus data and the generalized mixed Yule coalescent approach: A revised method and evaluation on simulated data sets. Syst. Biol. 2013, 62, 707–724. [Google Scholar] [CrossRef] [Green Version]
  52. Kapli, P.; Lutteropp, S.; Zhang, J.; Kobert, K.; Pavlidis, P.; Stamatakis, A.; Flouri, T. Multi-rate Poisson Tree Processes for single-locus species delimitation under Maximum Likelihood and Markov Chain Monte Carlo. Bioinformatics 2017, 33, 1630–1638. [Google Scholar] [CrossRef] [PubMed] [Green Version]
  53. Brown, S.D.J.; Collins, R.A.; Boyer, S.; Lefort, M.-C.; Malumbres-Olarte, J.; Vink, C.J.; Cruickshank, R.H. Spider: An R package for the analysis of species identity and evolution, with particular reference to DNA barcoding. Mol. Ecol. Resour. 2012, 12, 562–565. [Google Scholar] [CrossRef] [PubMed]
  54. Reid, N.M.; Carstens, B.C. Phylogenetic estimation error can decrease the accuracy of species delimitation: A Bayesian implementation of the general mixed Yule-coalescent model. BMC Evol. Biol. 2012, 12, 196. [Google Scholar] [CrossRef] [PubMed] [Green Version]
  55. R Core Team. R: A Language and Environment for Statistical Computing; R Foundation for Statistical Computing: Vienna, Austria, 2018; ISBN 3-900051-07-0. [Google Scholar]
  56. Schliep, K.P. phangorn: Phylogenetic analysis in R. Bioinformatics 2011, 27, 592–593. [Google Scholar] [CrossRef] [Green Version]
  57. Kumar, S.; Stecher, G.; Tamura, K. MEGA7: Molecular evolutionary genetics analysis version 7.0 for bigger datasets. Mol. Biol. Evol. 2016, 33, 1870–1874. [Google Scholar] [CrossRef] [Green Version]
  58. Kass, R.E.; Raftery, A.E. Bayes factors. J. Am. Stat. Assoc. 1995, 90, 773–795. [Google Scholar] [CrossRef]
  59. Lanfear, R.; Frandsen, P.B.; Wright, A.M.; Senfeld, T.; Calcott, B. PartitionFinder 2: New methods for selecting partitioned models of evolution for molecular and morphological phylogenetic analyses. Mol. Biol. Evol. 2017, 34, 772–773. [Google Scholar] [CrossRef] [Green Version]
  60. Thomson, R.C.; Spinks, P.Q.; Shaffer, H.B. A global phylogeny of turtles reveals a burst of climate-associated diversification on continental margins. Proc. Natl. Acad. Sci. USA 2021, 118, e2012215118. [Google Scholar] [CrossRef]
  61. Rambaut, A. FigTree v1.4.4. 2018. Available online: https://github.com/rambaut/figtree/releases/tag/v1.4.4 (accessed on 10 August 2020).
  62. Atchley, W.R.; Gaskins, C.T.; Anderson, D. Statistical properties of ratios. I. empirical results. Syst. Zool. 1976, 25, 137–148. [Google Scholar] [CrossRef]
  63. Jombart, T.; Devillard, S.; Balloux, F. Discriminant analysis of principal components: A new method for the analysis of genetically structured populations. BMC Genet. 2010, 11, 94. [Google Scholar] [CrossRef] [Green Version]
  64. Fouquet, A.; Gilles, A.; Vences, M.; Marty, C.; Blanc, M.; Gemmell, N.J. Underestimation of species richness in neotropical frogs revealed by mtDNA analyses. PLoS ONE 2007, 2, e1109. [Google Scholar] [CrossRef] [PubMed]
  65. Mota, E.P.; Kaefer, I.L.; da Silva Nunes, M.; Lima, A.P.; Farias, I.P. Hidden diversity within the broadly distributed Amazonian giant monkey frog (Phyllomedusa bicolor: Phyllomedusidae). Amphibia-Reptilia 2020, 41, 349–359. [Google Scholar] [CrossRef]
  66. Hrbek, T.; da Silva, V.M.F.; Dutra, N.; Gravena, W.; Martin, A.R.; Farias, I.P. A new species of river dolphin from Brazil or: How little do we know our biodiversity. PLoS ONE 2014, 9, e0083623. [Google Scholar] [CrossRef] [PubMed] [Green Version]
  67. Ippi, S.; Flores-Villela, O. Las tortugas neotropicales y sus areas de endemismo. Acta Zool. Mex. 2001, 84, 49–63. [Google Scholar]
  68. Souza, F.L. Geographical distribution patterns of South American side-necked turtles (Chelidae). Rev. Esp. Herpetol. 2005, 19, 33–46. [Google Scholar]
  69. Vargas-Ramírez, M.; del Valle, C.; Ceballos, C.P.; Fritz, U. Trachemys medemi n. sp. from northwestern Colombia turns the biogeography of South American slider turtles upside down. J. Zool. Syst. Evol. Res. 2017, 55, 326–339. [Google Scholar] [CrossRef]
  70. Ávila-Pires, T.C.S. Lizards of Brazilian Amazonia (Reptilia: Squamata). Zool. Verh. 1995, 299, 1–709. [Google Scholar]
  71. Gamble, T.; Simons, A.M.; Colli, G.R.; Vitt, L.J. Tertiary climate change and the diversification of the Amazonian gecko genus Gonatodes (Sphaerodactylidae, Squamata). Mol. Phylogenet. Evol. 2008, 46, 269–277. [Google Scholar] [CrossRef] [Green Version]
  72. Miralles, A.; Carranza, S. Systematics and biogeography of the Neotropical genus Mabuya, with special emphasis on the Amazonian skink Mabuya nigropunctata (Reptilia, Scincidae). Mol. Phylogenet. Evol. 2010, 54, 857–869. [Google Scholar] [CrossRef]
  73. Arteaga, A.; Pyron, R.A.; Peñafiel, N.; Romero-Barreto, P.; Culebras, J.; Bustamante, L.; Yánez-Muñoz, M.H.; Guayasamin, J.M. Comparative phylogeography reveals cryptic diversity and repeated patterns of cladogenesis for amphibians and reptiles in northwestern Ecuador. PLoS ONE 2016, 11, e0151746. [Google Scholar] [CrossRef] [Green Version]
  74. Costa-Araújo, R.; Silva-Jr, J.S.; Boubli, J.P.; Rossi, R.V.; Canale, G.R.; Melo, F.R.; Bertuol, F.; Silva, F.E.; Silva, D.A.; Nash, S.D.; et al. An integrative analysis uncovers a new, pseudo-cryptic species of Amazonian marmoset (Primates: Callitrichidae: Mico) from the arc of deforestation. Sci. Rep. 2021, 11, 15665. [Google Scholar] [CrossRef] [PubMed]
  75. Lopes, G.P.; Röhe, F.; Bertuol, F.; Lima, I.J.; Polo, É.M.; Valsechi, J.; dos Santos, T.C.M.; Ennes, F.; Sampaio, R.; Nash, S.D.; et al. Taxonomic review of Saguinus mystax (Spix, 1823) (Primates, Callitrichinae), and description of a new species. PeerJ 2022. accepted. [Google Scholar]
  76. Wermuth, H.; Mertens, R. Liste der rezenten Amphibien und Reptilien: Testudines, Crocodylia, Rhynchocephalia. Tierreich 1977, 100, 1–174. [Google Scholar]
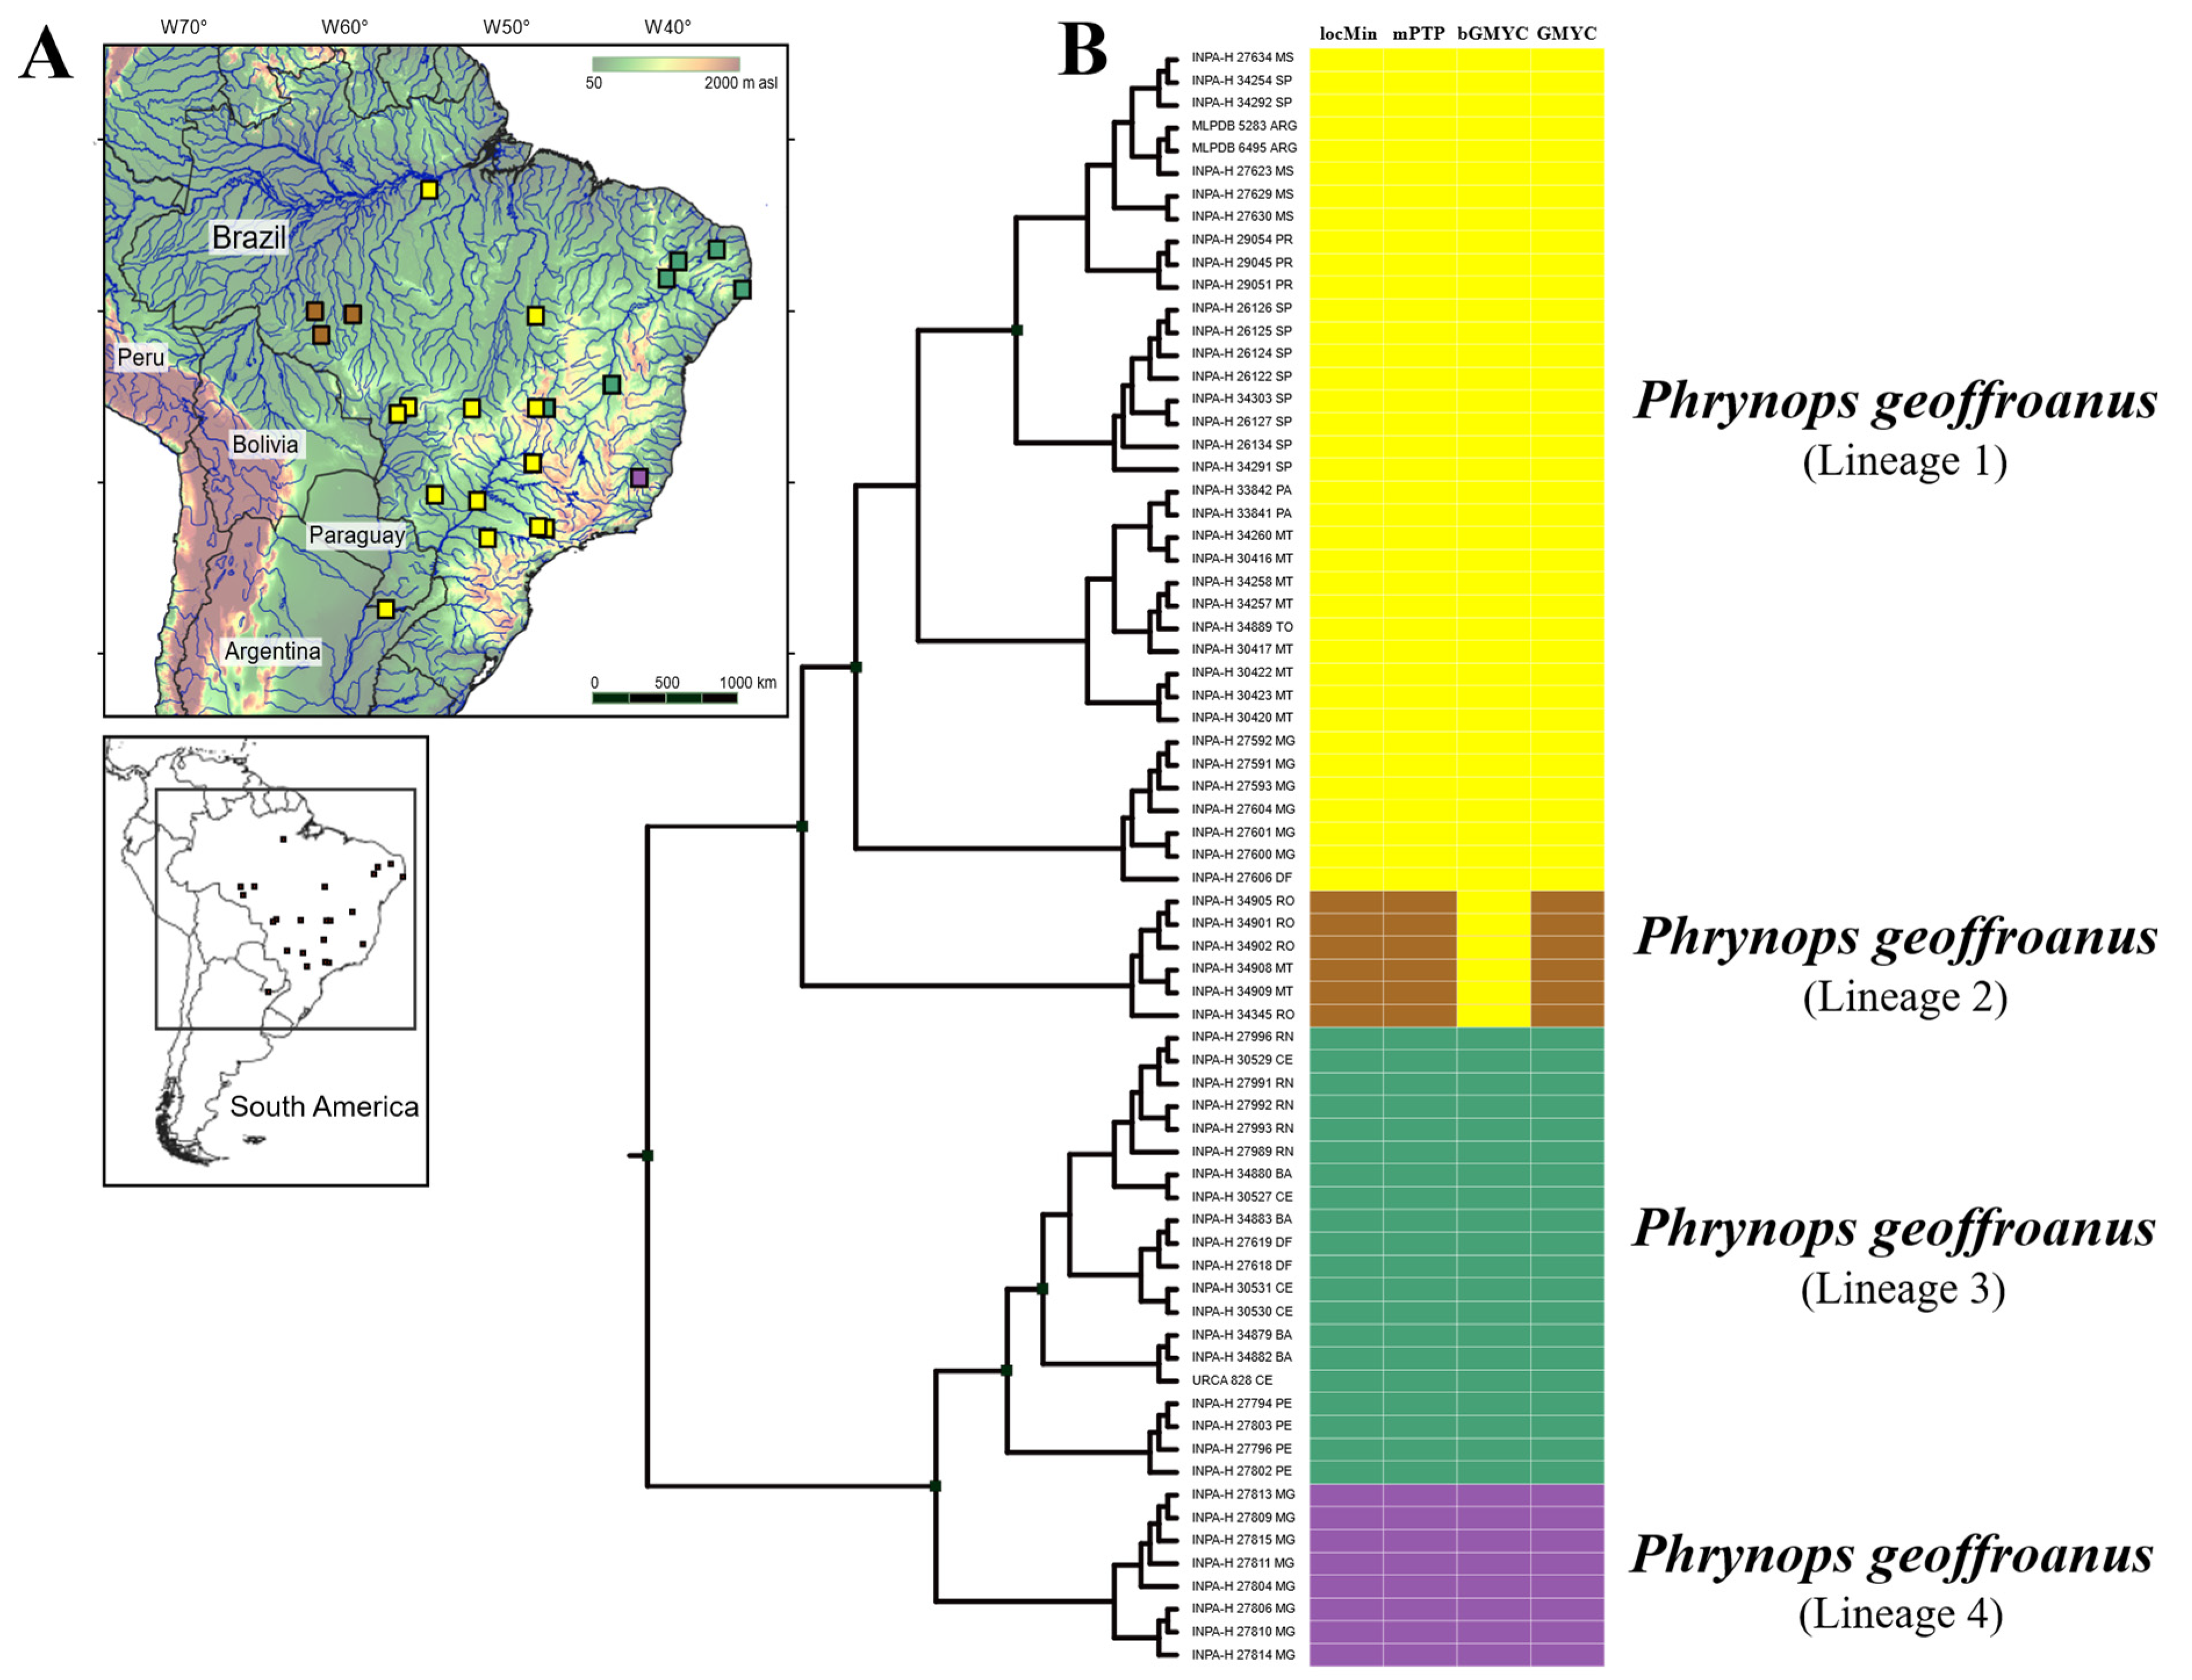
Figure 1. Patterns of genetic divergence in Phrynops geoffroanus estimated by four Bayesian methods of species discovery analysis. (A) Geographic distribution of lineages. (B) Maximum clade credibility chronogram from 1000 posterior trees generated using BEAST. Point estimate species delimitations are shown by method as colored boxes. Symbols and colors represent the same lineages in maps and trees. Phylogenetic relationships were based on Bayesian inference inferred from 1843 aligned sites of the 16S, Cytb, and COI mtDNA genes.
Diversity 14 00360 g001
Figure 2. SDVquartet phylogeny of SNP data. Numbers above branches are bootstrap values. (A) Geographic distribution of lineages. (B) Maximum clade credibility chronogram from 1000 posterior trees generated using BEAST.
Diversity 14 00360 g002
Figure 3. Dated species tree of Chelidae with emphasis on the Phrynops geoffroanus species complex assuming the most likely taxonomic hypothesis (P. tuberosus, P. geoffroanus L4 coastal Atlantic drainages, P. geoffroanus L1a Paraná basin, P. geoffroanus L3 + L1a + L2 São Francisco + Amazon basin).
Diversity 14 00360 g003
Figure 4. Dated species tree of Chelidae with emphasis on the Phrynops geoffroanus species complex assuming the second most likely taxonomic hypothesis (P. tuberosus, P. geoffroanus L4 coastal Atlantic drainages, P. geoffroanus L1a Paraná basin, P. geoffroanus L3 São Francisco basin, P. geoffroanus L1a + L2 Amazon basin).
Diversity 14 00360 g004
Figure 5. Distribution of samples along two discriminant analysis of principal components (DAPC) axes for males (A) and females (B). Colors represent different lineages bounded by ellipses denoting 67% confidence intervals (1 standard deviation).
Diversity 14 00360 g005
Figure 6. Morphological variation of the Phrynops geoffroanus species complex in shape and color of body and head. Lineages: lineage L1a = INPA-H 26127; lineage L1b = INPA-H 34260; lineage L2 = INPA-H 34345; lineage L3 = INPA-H 34879; lineage L4 = INPA-H 27810.
Diversity 14 00360 g006
Table 1. Numbers of candidate species estimated by four methods of species discovery analysis based on mitochondrial sequences from individuals of the Phrynops geoffroanus species complex. Point estimate = average, CI_95 = 95% confidence interval range, median, and mode.
MethodPoint_EstimateCI_95CI_MedianCI_Mode
bGMYC32–633
GMYC42–1544
locMin43–944
mPTP42–1444
Table 2. Test of taxonomic hypotheses using path sampling in BEAST2. Differences in marginal likelihoods were evaluated using Bayes factors. The four species hypothesis (P. tuberosus, P. geoffroanus L4, P. geoffroanus L1a, P. geoffroanus L1b + L2 + L3) was supported as the best taxonomic hypothesis, and the five species hypothesis (P. tuberosus, P. geoffroanus L4, P. geoffroanus L1a, P. geoffroanus L3, P. geoffroanus L1a + L2) as the second-best taxonomic hypothesis.
HypothesisMarginal LikelihoodBayes Factor
One species (P. tuberosus + P. geoffroanus)−198,684.320027,547.000
Two species–current taxonomy (P. tuberosus, P. geoffroanus)−190,849.636711,877.640
Three species–SVDQuartet topology (P. tuberosus, P. geoffroanus L4, P. geoffroanus L1a + L1b + L2 + L3)−185,023.1492224.663
Four species–SVDQuartet topology (P. tuberosus, P. geoffroanus L4, P. geoffroanus L1a, P. geoffroanus L1b + L2 + L3)−184,910.8179
Four species–alternate SLSD topology (P. tuberosus, P. geoffroanus L4, P. geoffroanus L3, P. geoffroanus L1a + L1b + L2)−185,045.3345269.033
Five species–best SLSD topology (P. tuberosus, P. geoffroanus L4, P. geoffroanus L3, P. geoffroanus L2, P. geoffroanus L1a + L1b)−185,649.97321478.311
Five species–SVDQuartet topology (P. tuberosus, P. geoffroanus L4, P. geoffroanus L1a, P. geoffroanus L3, P. geoffroanus L1a + L2)−184,916.638411.641
Six species–SVDQuartet + SLSD topology (P. tuberosus, P. geoffroanus L4, P. geoffroanus L1a, P. geoffroanus L3, P. geoffroanus L1a, P. geoffroanus L2)−185,173.1499524.664
Publisher’s Note: MDPI stays neutral with regard to jurisdictional claims in published maps and institutional affiliations.