Article

Safe Passage or Hunting Ground? A Test of the Prey-Trap Hypothesis at Wildlife Crossing Structures on NH 44, Pench Tiger Reserve, Maharashtra, India

Department of Animal Ecology and Conservation Biology, Wildlife Institute of India, Dehradun 248001, India
*
Author to whom correspondence should be addressed.
Diversity 2022, 14(5), 312; https://doi.org/10.3390/d14050312
Submission received: 27 January 2022 / Revised: 25 February 2022 / Accepted: 2 March 2022 / Published: 20 April 2022

Abstract

:
Crossing structures are widely accepted mitigation measures used to offset the impacts of roads in ecologically sensitive areas that serve as important animal corridors. However, altered interspecies interactions at crossing structures may reduce the potency of these structures for some species and groups. Anecdotes of predation events at crossing structures have necessitated the assessment of predator–prey interactions at crossing structures. We investigated the ‘prey-trap’ hypothesis at nine crossing structures on a highway in central India adjacent to a tiger reserve by comparing the geometric mean latencies between successive prey, predator and free-ranging dog camera trap capture events at the crossing structures. Among all interactions, prey–predator latencies were the shortest, and significantly lower than prey–dog and predator–prey latencies. Prey–predator sequences involving wild dogs had the shortest average latencies (65.6 ± 9.7 min). Prey–predator latencies decreased with increasing crossing structure width; however, these crossing structures are also the sites that are most frequently used by wildlife. Results indicate that the crossing structures presently do not act as ‘prey-traps’ from wild predators or free-ranging dogs. However, measures used to alleviate such prospects, such as heterogeneity in structure design and increase in vegetation cover near crossing structures, are recommended.

1. Introduction

The ecological impacts of roads on natural landscapes and wildlife are well-documented worldwide [1]. Roads create breaks in naturally contiguous landscapes and habitats [2,3,4] and consequently impede animal movement between resultant habitat patches [5]. Vehicular traffic on roads causes behavioural aversion and avoidance by wildlife [6,7], as well as animal–vehicle collisions, one of the leading causes of animal mortality in human-dominated landscapes [8]. Combined, these impacts ultimately result in genetic isolation [9,10] and species decline [11].
To mitigate the adverse impacts of roads, crossing structures for wildlife, including wildlife overpasses, underpasses, culverts and walkways, are increasingly being adopted across the world [12]. Wildlife crossing structures enable animal movement across roads and help to reduce the occurrence of wildlife–vehicle collisions. Long-term monitoring studies have demonstrated the efficacy of wildlife crossing structures for a wide variety of wild animal species, including carnivores, ungulates and small mammals [13,14,15,16]. Crossing structures are constructed with the aim of providing safe passage to animals. However, modified inter-species interactions within crossing structures, as a consequence of a concentration of animal movement at the structures [17], could potentially reduce their efficacy.
The prey-trap hypothesis suggests that over time, predators learn to exploit wildlife crossing structures to increase foraging opportunities [17,18]. Few reports of predation by wild predators in crossing structures have been reported [19,20,21]. Patterns of temporal co-occurrence between predator and prey and prey avoidance of crossing structures have also been observed [22]. In addition to wild predators, feral animals such as dogs may exploit crossing structures for the predation of wild prey species [18]. Such habituation of predators can ultimately result in an avoidance of crossing structures by prey species, reducing the overall efficacy of wildlife crossing structures. However, there is also evidence against the prey-trap theory, i.e., predators do not actively peruse mitigation structures in search of prey [23,24,25,26].
The nine crossing structures on National Highway 44 (NH 44) passing through the Pench Tiger Reserve (PTR), Maharashtra, were conceived for use by the entire suite of mammals found in the landscape, including the tiger, its co-predators, prey and associated species. During the three years of the continuous monitoring of the crossing structures, incidences of co-occurrence and predation attempts by tigers, wild dogs and free-ranging dogs were captured by camera traps deployed at the structures. Considering the potential decline in the efficacy of the crossing structures for prey in such a situation, a study of prey–predator interactions at the crossing structures was considered vital. Together, these structures are the largest operational set of mitigation measures, and one of the first crossing structures dedicated for use by wildlife in the Indian subcontinent. Evidence of adverse inter-species interactions would have repercussions for the adoption of such measures on other linear infrastructure in developing nations with increasing trends in infrastructure development.
The aim of this study was to investigate whether the nine crossing structures for NH 44 created a constricted funnel-like space in the habitat, where adverse interactions (competition or avoidance) between wild and free-ranging predators and prey could have implications for the effectiveness of the crossing structures for wildlife. We did so by comparing latencies (time between subsequent animal captures) between different pairs of animal groups (prey–predator, predator–prey, prey–feral dog) at the crossing structures and in a control habitat. Following Ford and Clevenger, 2010 [25], we predicted that for the crossing structures to presently or potentially create a prey-trap-like situation,
a.
prey–predator latencies at crossing structures would be lower than those in control habitats, and lower than predator–prey latencies at crossing structures, indicating that predators scout for prey at crossing structures;
b.
predator–prey latencies at crossing structures would be lower than those in control habitats, and higher than prey–predator latencies at crossing structures, indicating an avoidance of crossing structures by prey; and
c.
prey–dog latencies at crossing structures would be similar to or lower than prey–predator latencies at crossing structures, indicating that free-ranging dogs scout for prey at crossing structures.
We also assessed the influence of structural characteristics on the variation in inter-group latencies and expected lower latencies between prey–predator and prey–dog pairs at narrow crossing structures and crossing structures located near the tiger reserve.

2. Materials and Methods

2.1. Study Area

The study was carried out on 9 crossing structures on NH 44 passing through PTR, Maharashtra, India (Figure 1). The width of the crossing structures varies between 50 and 750 m, with a height of 5 m, according to prescribed dimensions for tiger landscapes [27]. Four of the crossing structures have natural drainage passing under them (type minor bridge (MNB)), while five were built as animal underpasses (type animal underpass (AUP)). The distance between the crossing structures ranges between 600 and 5800 m. Five of the crossing structures were located at the edge of PTR, while the other four are between 1263 and 3202 m away from the tiger reserve (Supplementary Table S1).

2.2. Field Methods

The crossing structures on NH 44 are being continuously monitored for use by wildlife since 2019 using camera traps. Given the relatively large sizes of the crossing structures and their extensive use by wildlife, camera traps were considered to be the most convenient means for monitoring. Camera traps provide fine-scale temporal data that was considered essential for evaluating adverse interactions between prey and predator species. Other methods for tracking the use of crossing structures by wildlife, such as track plots, would not provide temporal data, while radio-telemetry gives individual-level data (instead of population-level data) and is prone to time lags.
The crossing structures are supported by pairs of columns/pillars separated by a distance of 20–30 m, depending on the width of the structures. We deployed single motion-triggered Cuddeback [28] C1 camera traps on each column to cover the intervening span between two consecutive columns, as part of the long-term monitoring of the use of the crossing structures by wildlife. A total of 78 cameras were deployed across all structures. Data from camera traps were downloaded once every fortnight (comprising one session) during the monitoring period between March 2019 and December 2020. Data for natural animal movement rates, i.e., in an unrestricted manner unlike at the crossing structures, were obtained from the annual camera trapping carried out for monitoring tiger, co-predator and prey within PTR, Maharashtra, for a period of 20–25 days during the winter of 2020 with the same camera trap set-up. Camera trapping was carried out in a 2 × 2 km grid framework (298 camera traps) in the forest in PTR over an area of 735 sq. km, adjacent to the crossing structures that have the same environmental characteristics. Thus, all variability in habitat and terrain (as well as other possible variation) was accounted for in the control setting.

2.3. Analytical Methods

2.3.1. Comparison of Geometric Mean Latencies between Group Pairs and Sites

We classified leopard Panthera pardus, tiger Panthera tigris and wild dog Cuon alpinus in the ‘predator’ category, and the primary prey species of the tiger and its co-predators in the landscape [29,30]—chital or spotted deer Axis, gaur Bos gaurus, nilgai or blue bull Boselaphus tragocamelus, sambar deer Rusa unicolor, wild pig Sus scrofa—as ‘prey’. Free-ranging dogs, solitary or in packs, were categorised as ‘dog’. We calculated latency, i.e., the time elapsed (in minutes) between two successive captures for all predator–prey (prey following predator), prey–predator (predator following prey), and prey–dog (dog following prey) pairs following Martinig, Riaz and St. Clair, 2020 [31]. This was performed for individual cameras on each span of the crossing structure, i.e., for a 100 m-wide structure, we obtained data from 5 camera traps. We filtered out all observations with latency >1 day. We compared pair-wise geometric means between crossing structures and between crossing structures and the control habitat using one-tailed Wilcoxon’s tests. For the calculation of geometric means, a value of 1 min was given to all latency observations of less than one minute.

2.3.2. Assessment of Factors Influencing Variation in Latencies

We examined the influence of environmental and crossing structure-related features on the latency between groups using generalised linear mixed models (GLMMs). The latency period (in minutes) was taken as the response variable; structure type, season, crossing structure width (in metres), distance to tiger reserve (in metres), distance to nearest crossing structure (in metres) were taken as fixed effects; and the station ID was taken as a random effect. The most parsimonious models with ΔAIC < 2 were averaged using the package MuMIn [32] in the statistical software R [33].

3. Results

3.1. Comparison of Geometric Mean Latencies between Group Pairs and Sites

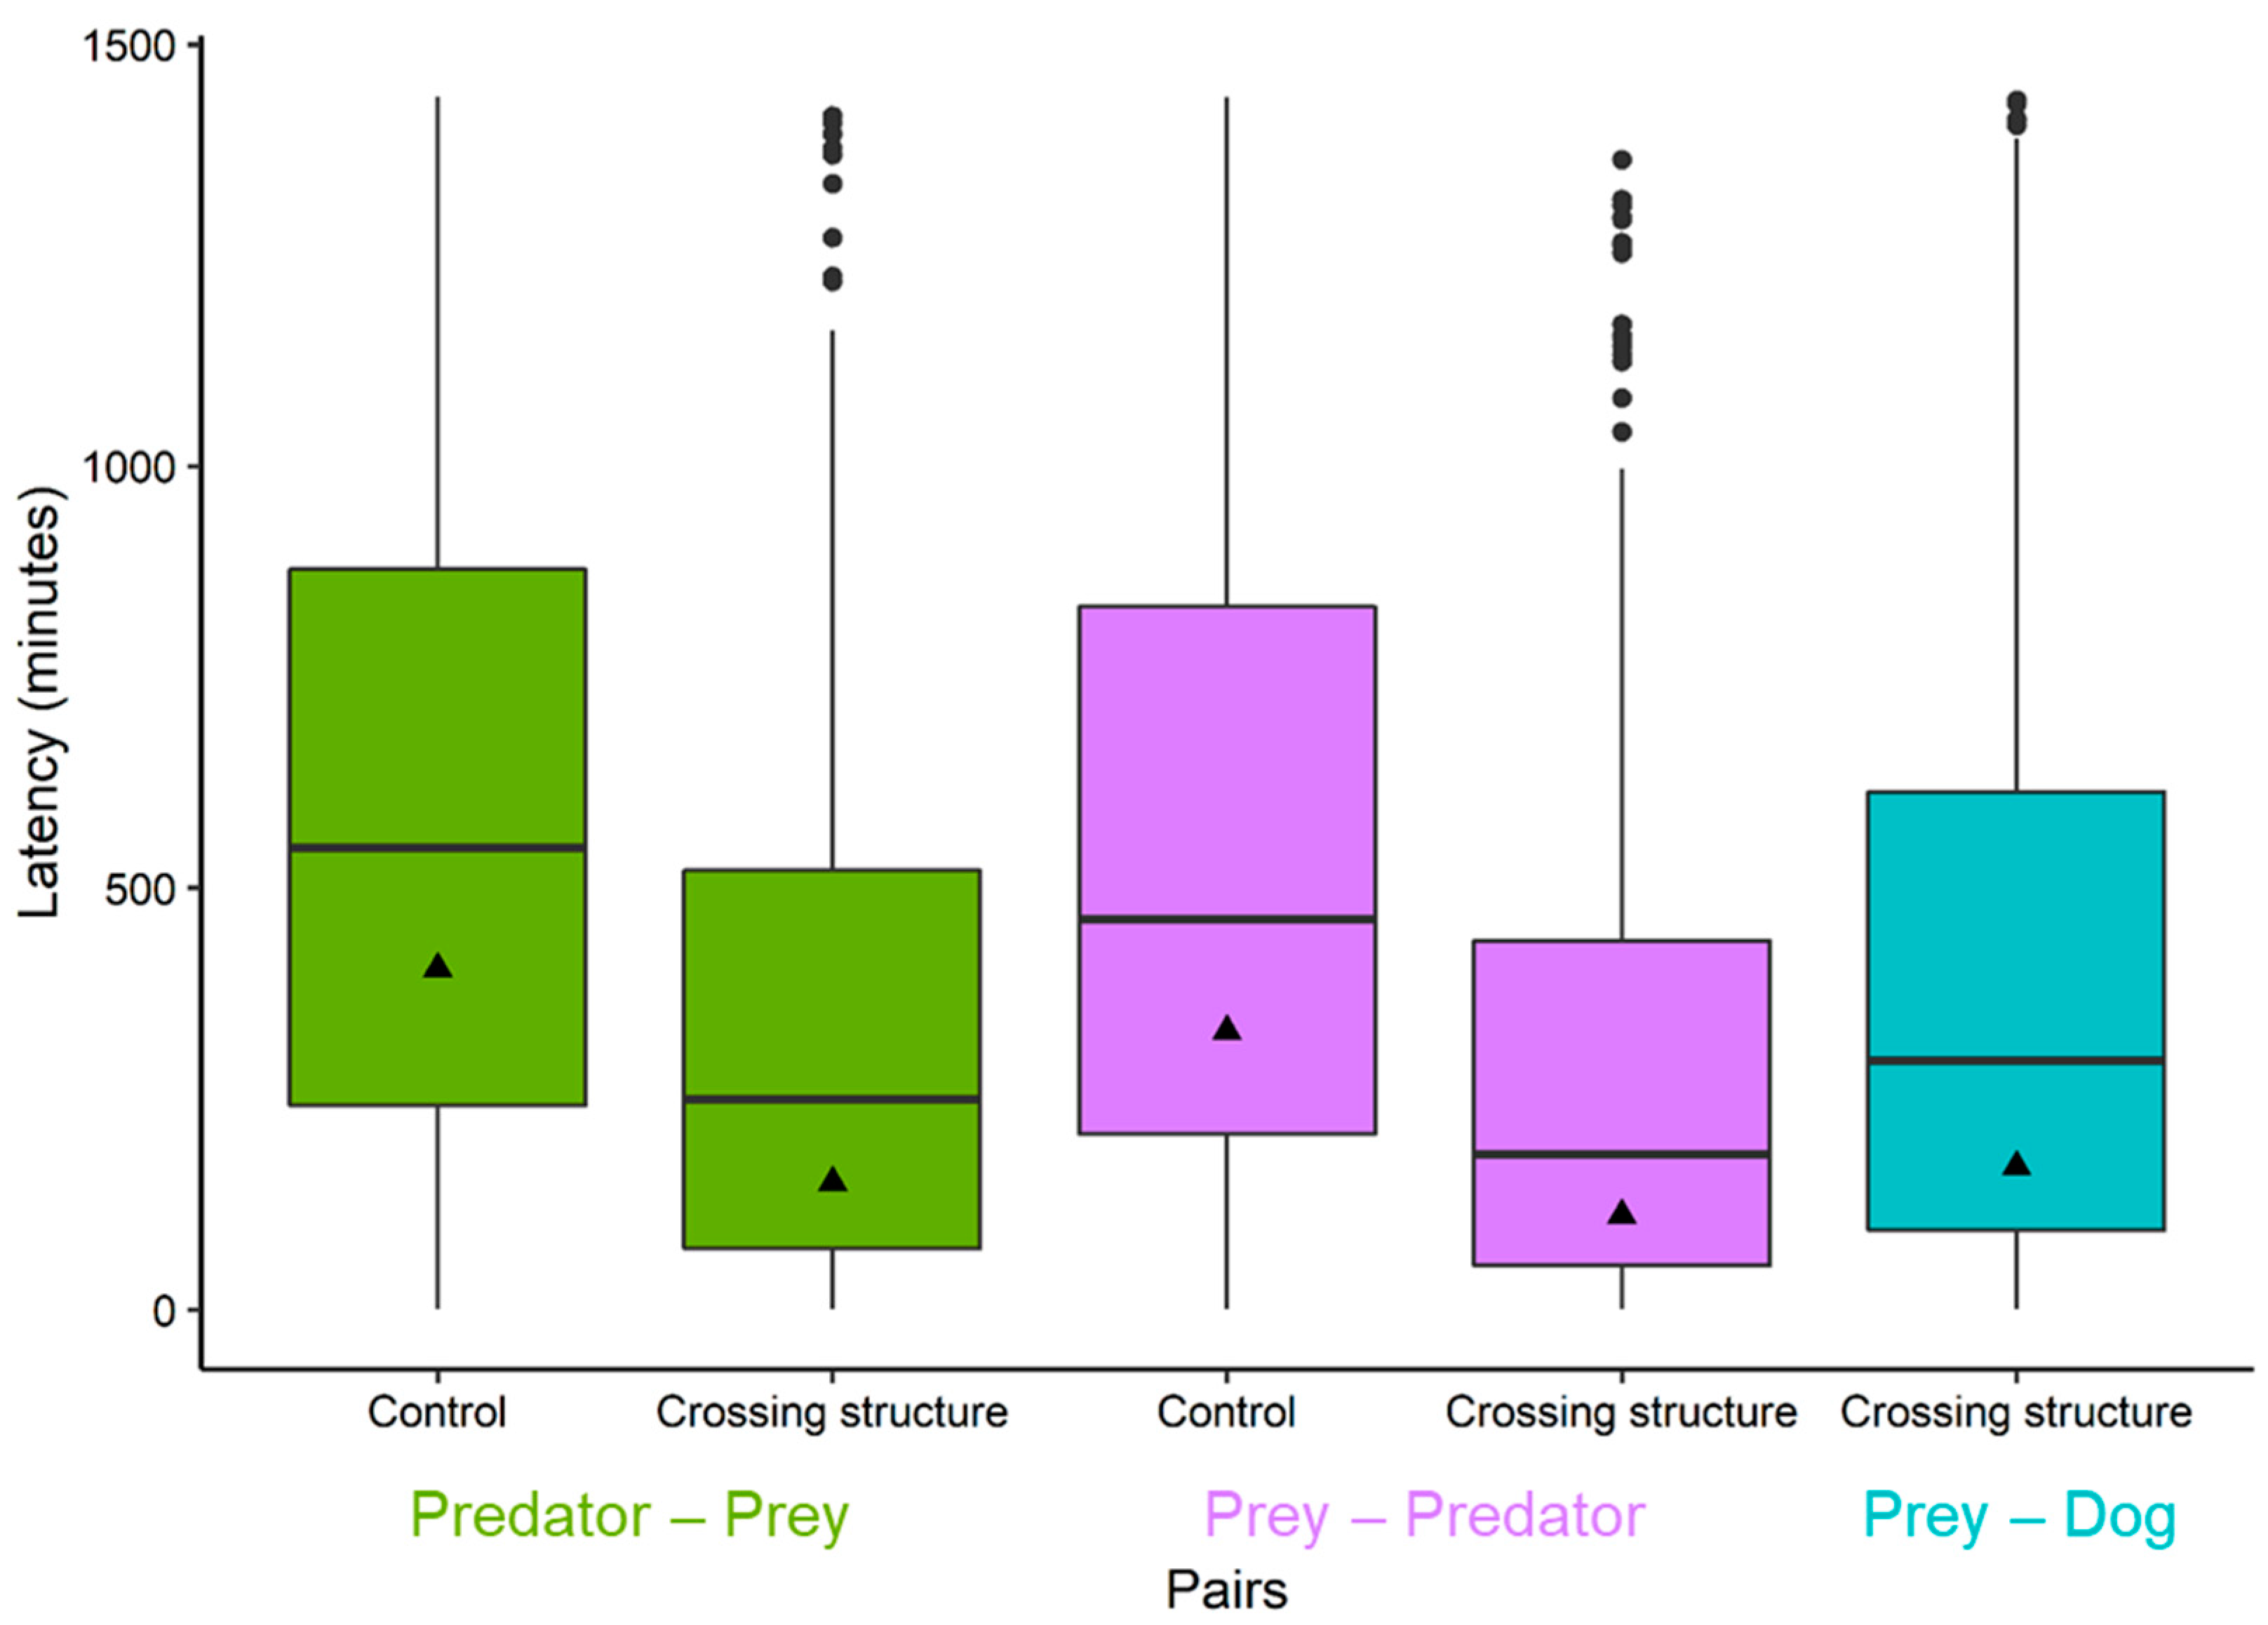
The least geometric mean latency at the crossing structures was observed between prey–predator sequences (112 min ± 10), followed by predator–prey sequences (151 min ± 15; Table 1; Figure 2). Both prey–predator and predator–prey geometric mean latencies were significantly lower than geometric mean latencies for these pairs in the control habitat (Wilcoxon rank sum test p < 0.05).
The geometric mean latencies for prey–predator sequences at crossing structures were significantly lower than predator–prey and prey–dog latencies at crossing structures (Wilcoxon rank sum test p < 0.05), while the latter two sequences were not significantly different (Wilcoxon rank sum test p = 0.106). The highest geometric mean latency among all pairs at crossing structures was observed between prey and dog (170 min ± 8). Prey–dog mean latency was significantly higher than that for prey–predator sequences at crossing structures (Wilcoxon rank sum test p <0.05), and lower than natural prey–predator latencies (Wilcoxon rank sum test p < 0.05).
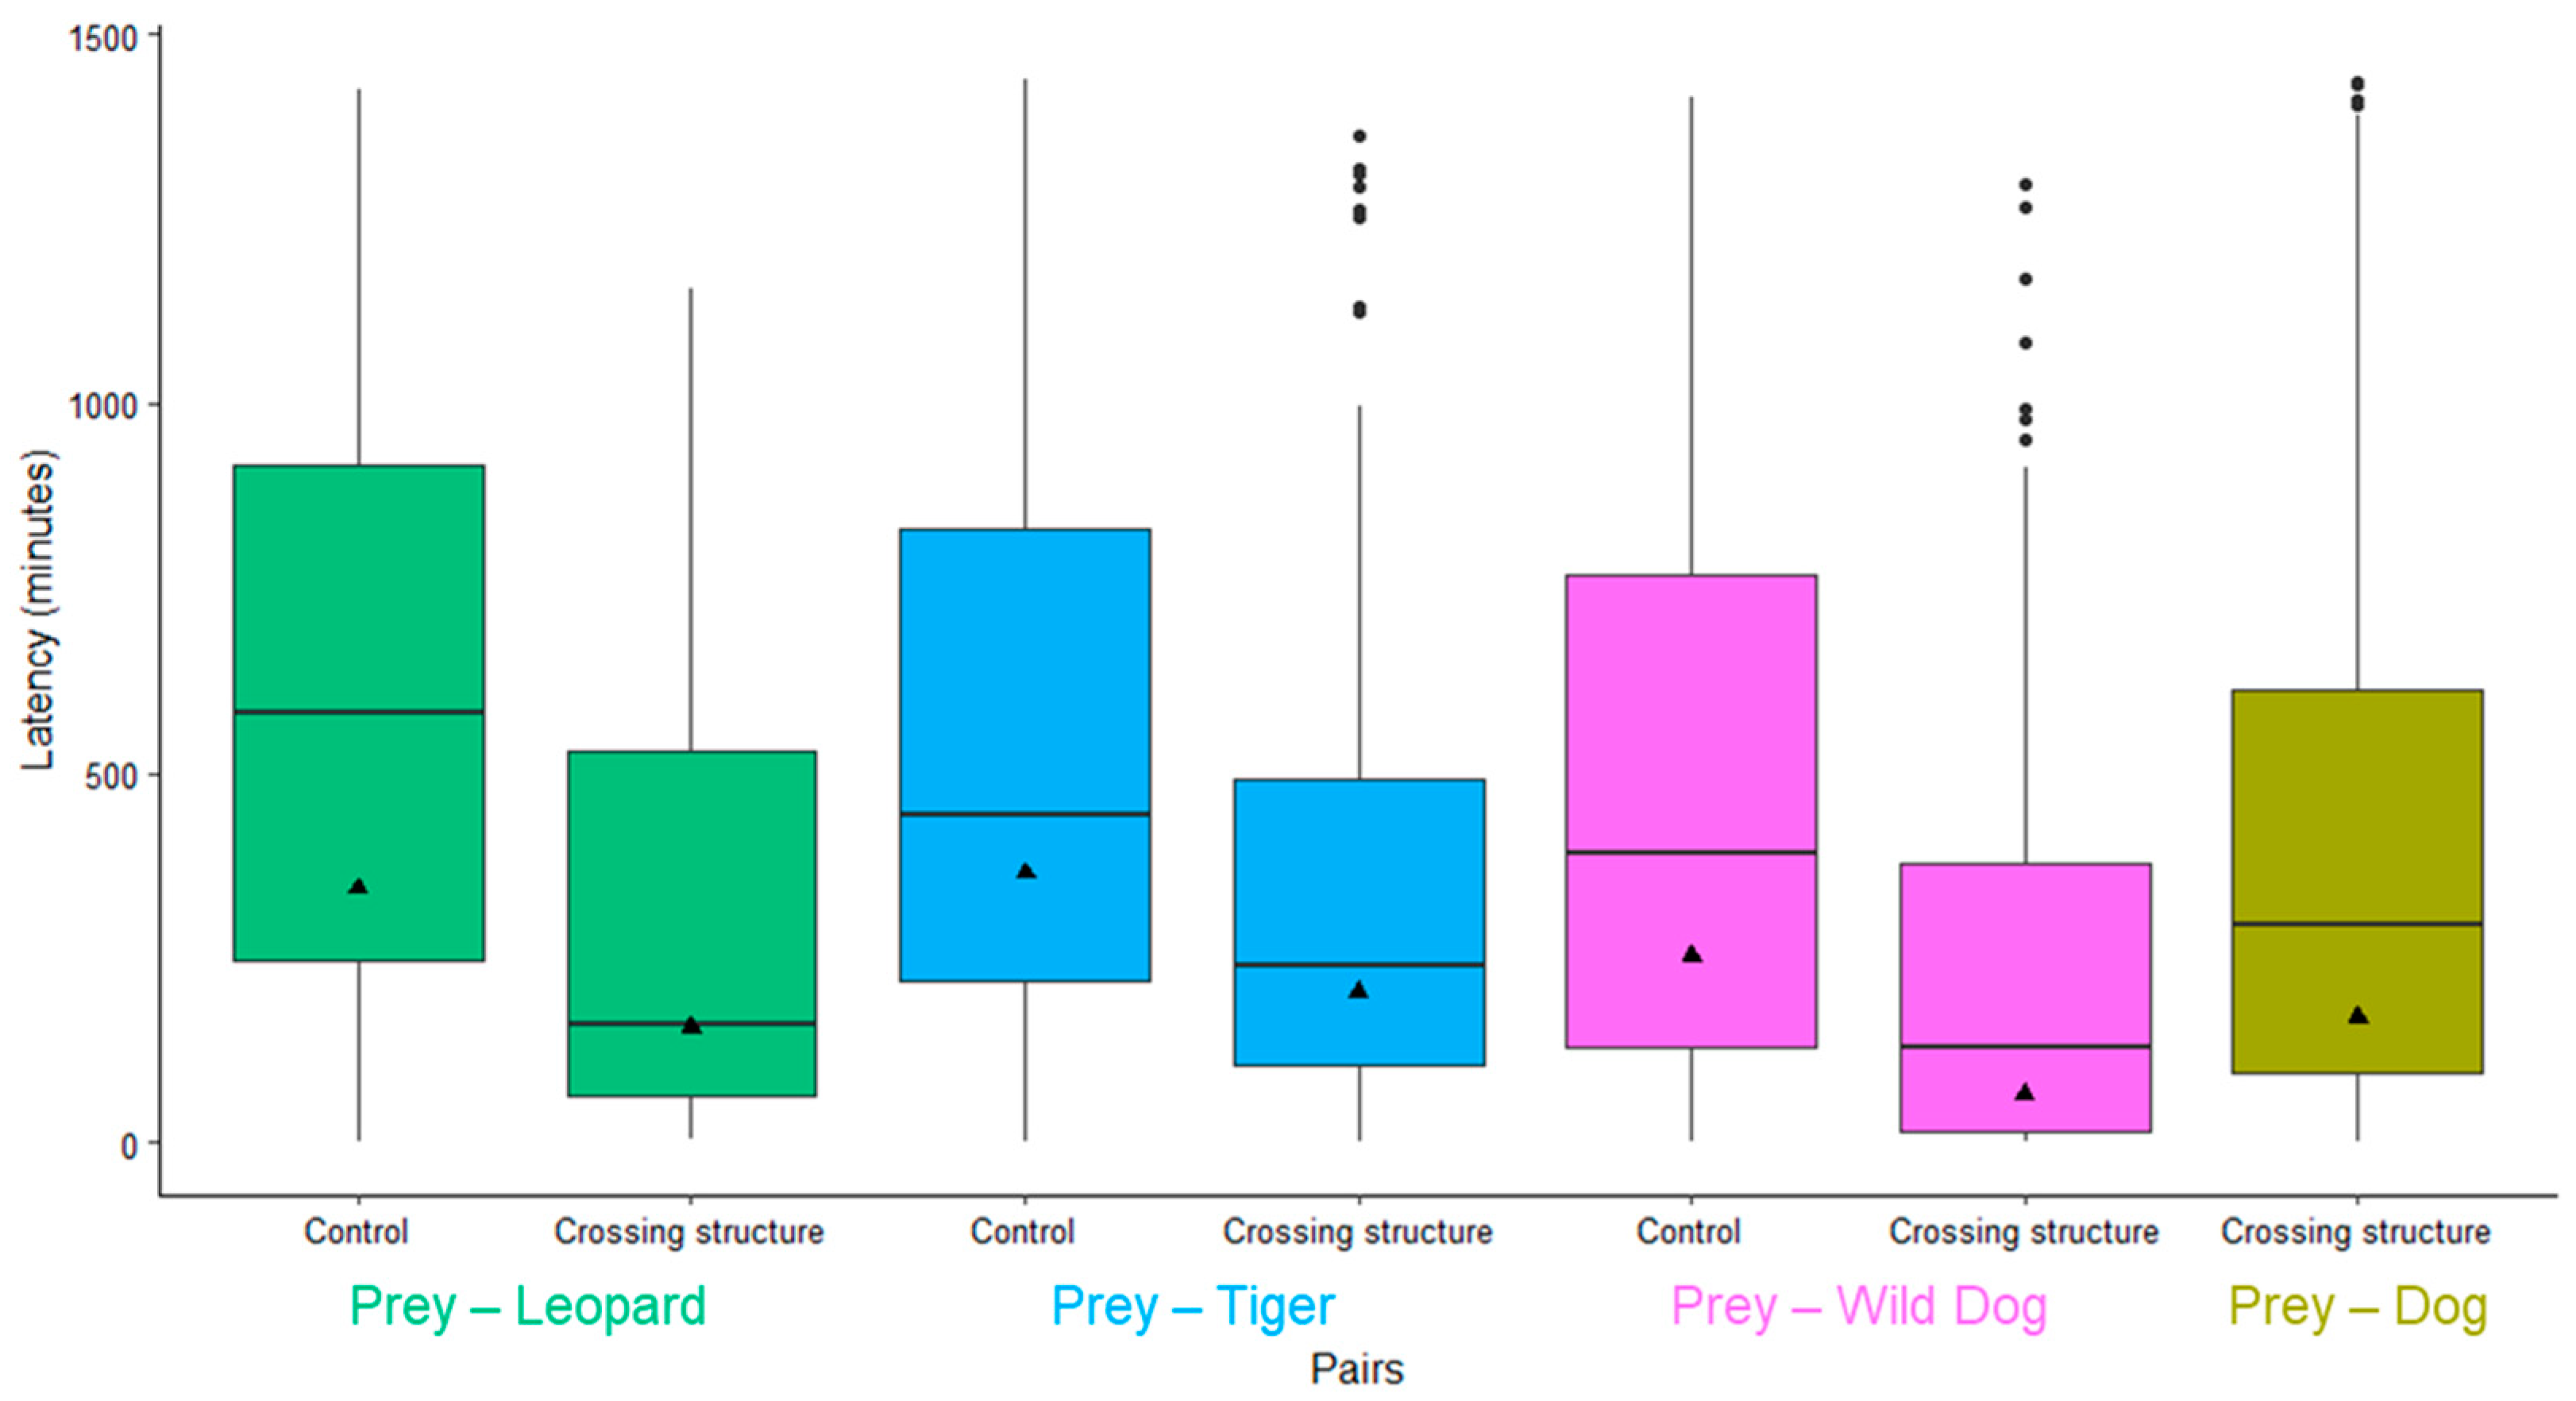
At the crossing structures, the number of prey–dog sequences was the highest as compared to other prey–predator species sequences. Among wild predator species for the same time period (Table 2, Figure 3), the highest number of prey–predator events were recorded for wild dogs (n = 186), with the lowest geometric mean latency of 65.6 min (55.9–76.9).

3.2. Assessment of Factors Influencing Variation in Latencies

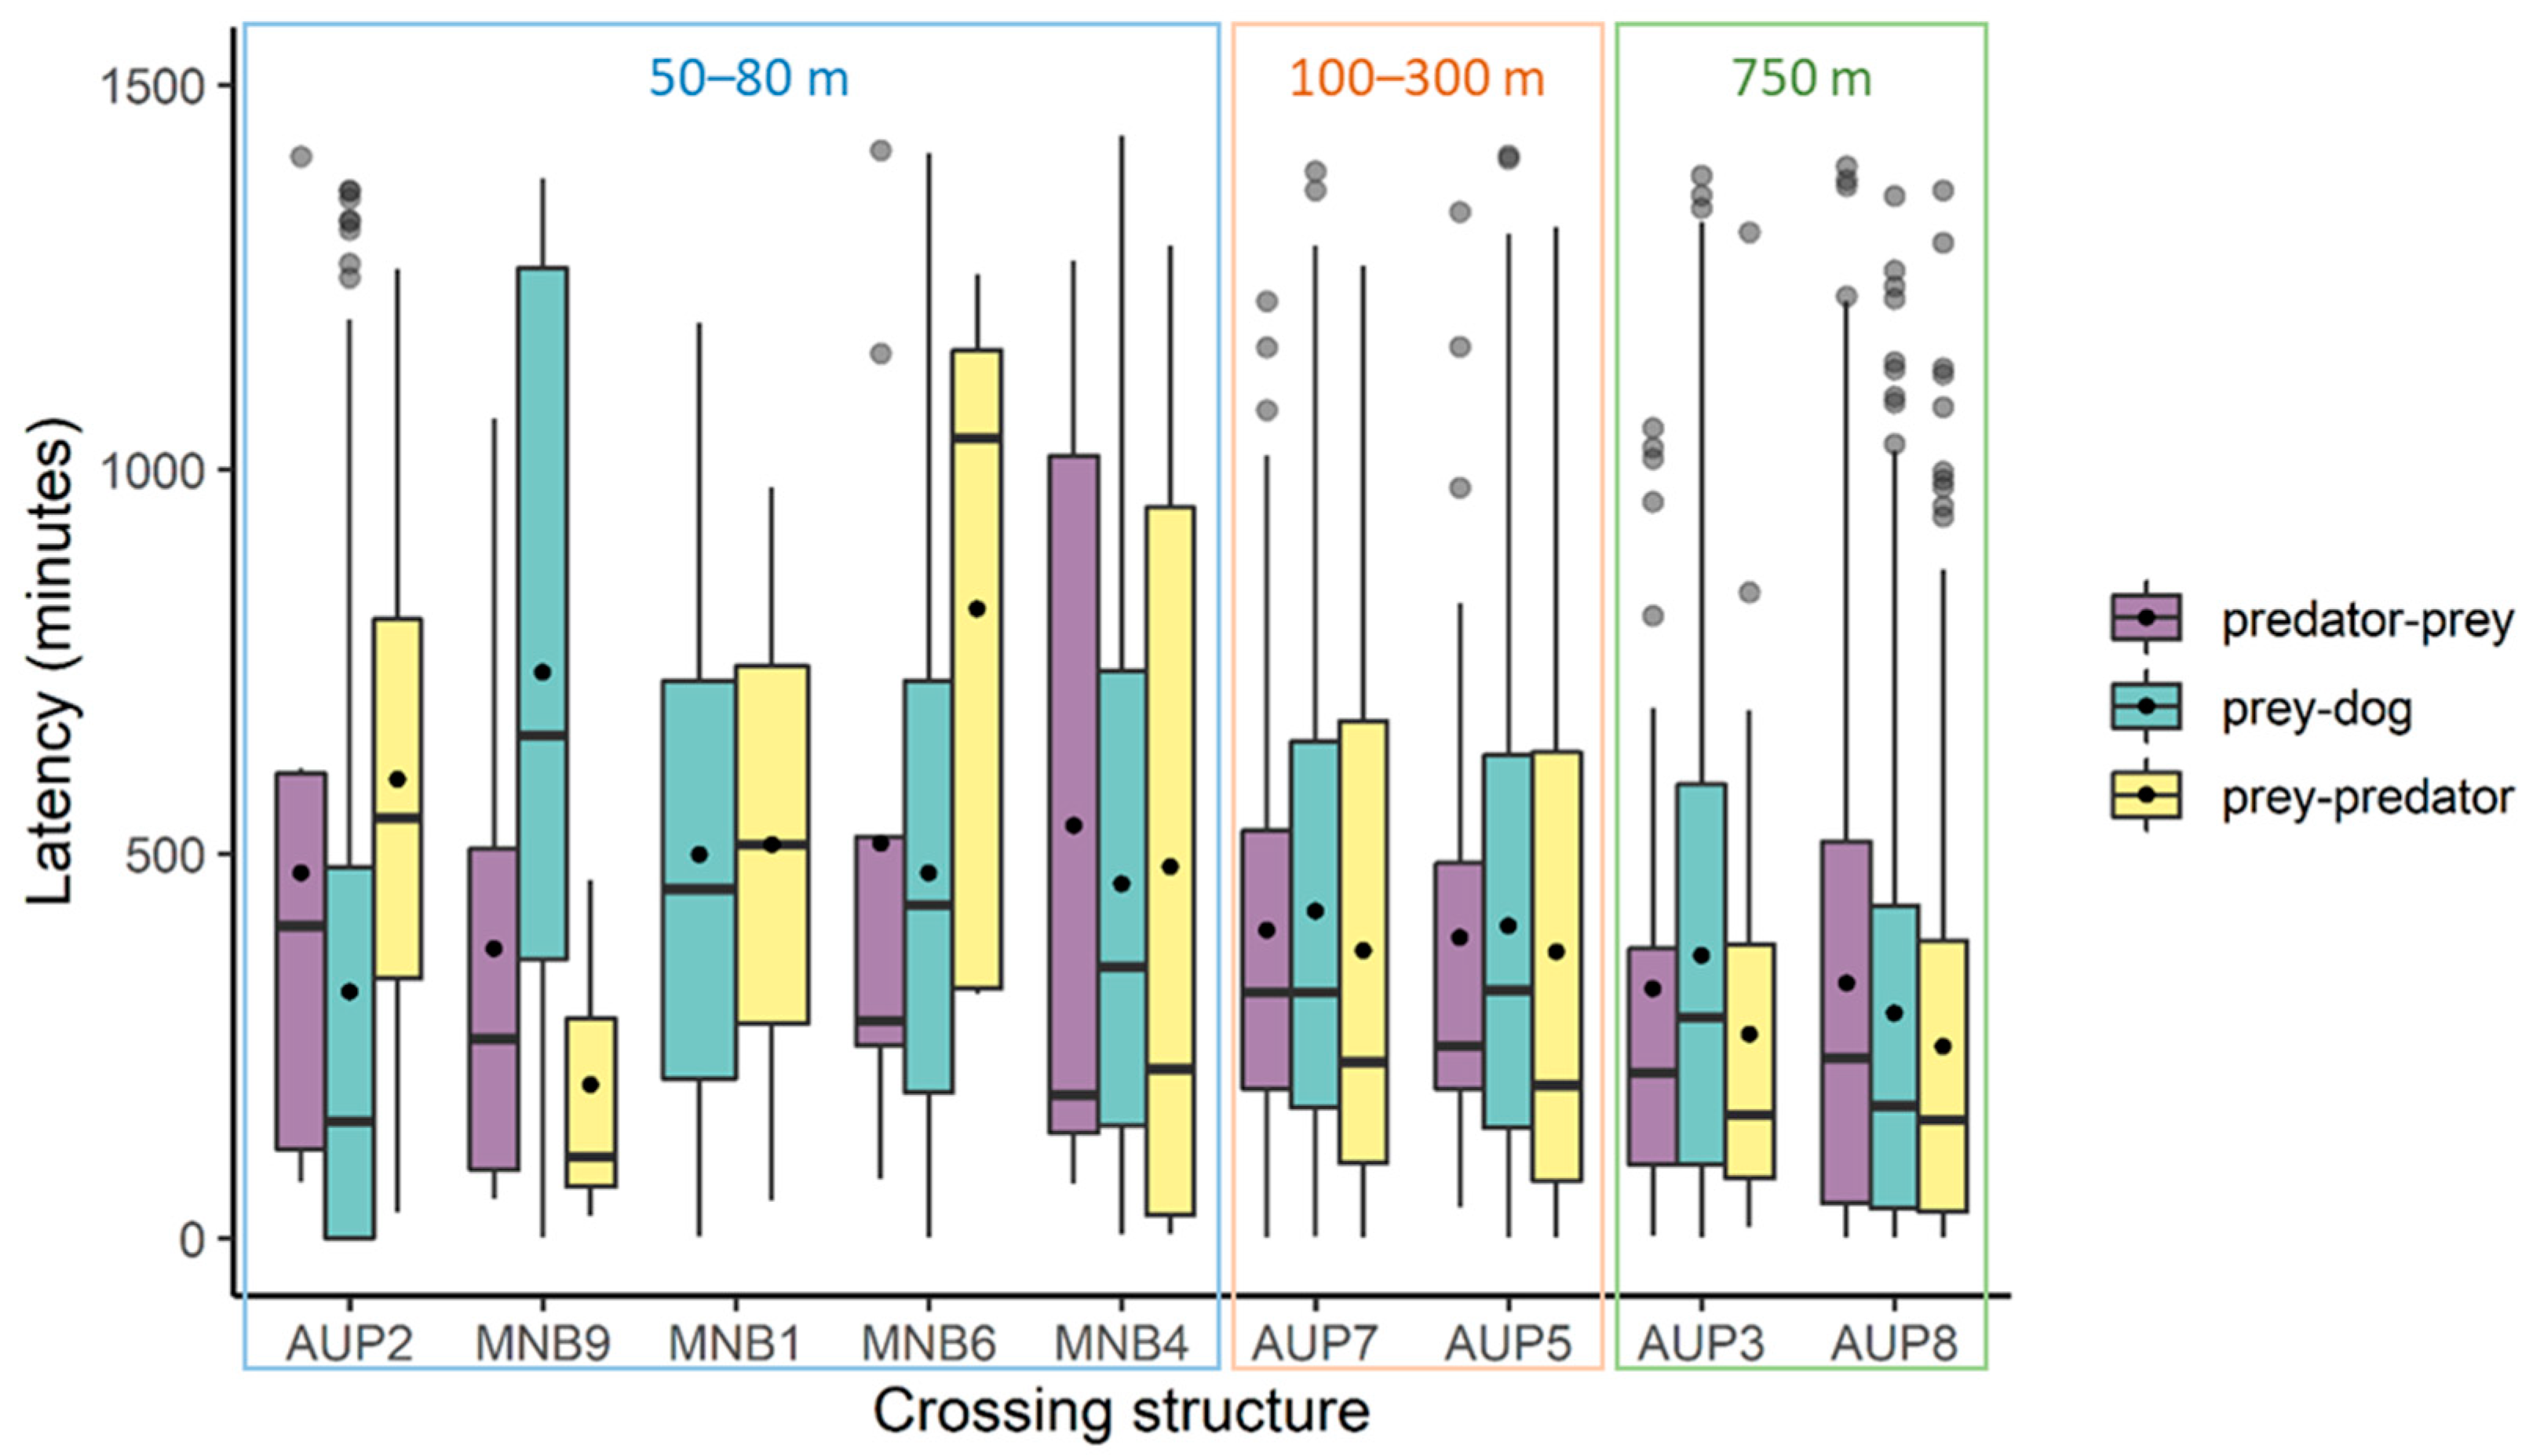
Among crossing structures, shorter mean latencies across all three pairs were observed among the wider structures (>100 m). The shortest predator–prey and prey–dog mean latencies were observed at the 750 m wide structures, while the shortest mean prey–predator latency was observed at the 50 m crossing structure, followed by the two 750 m-wide crossing structures (Figure 4).
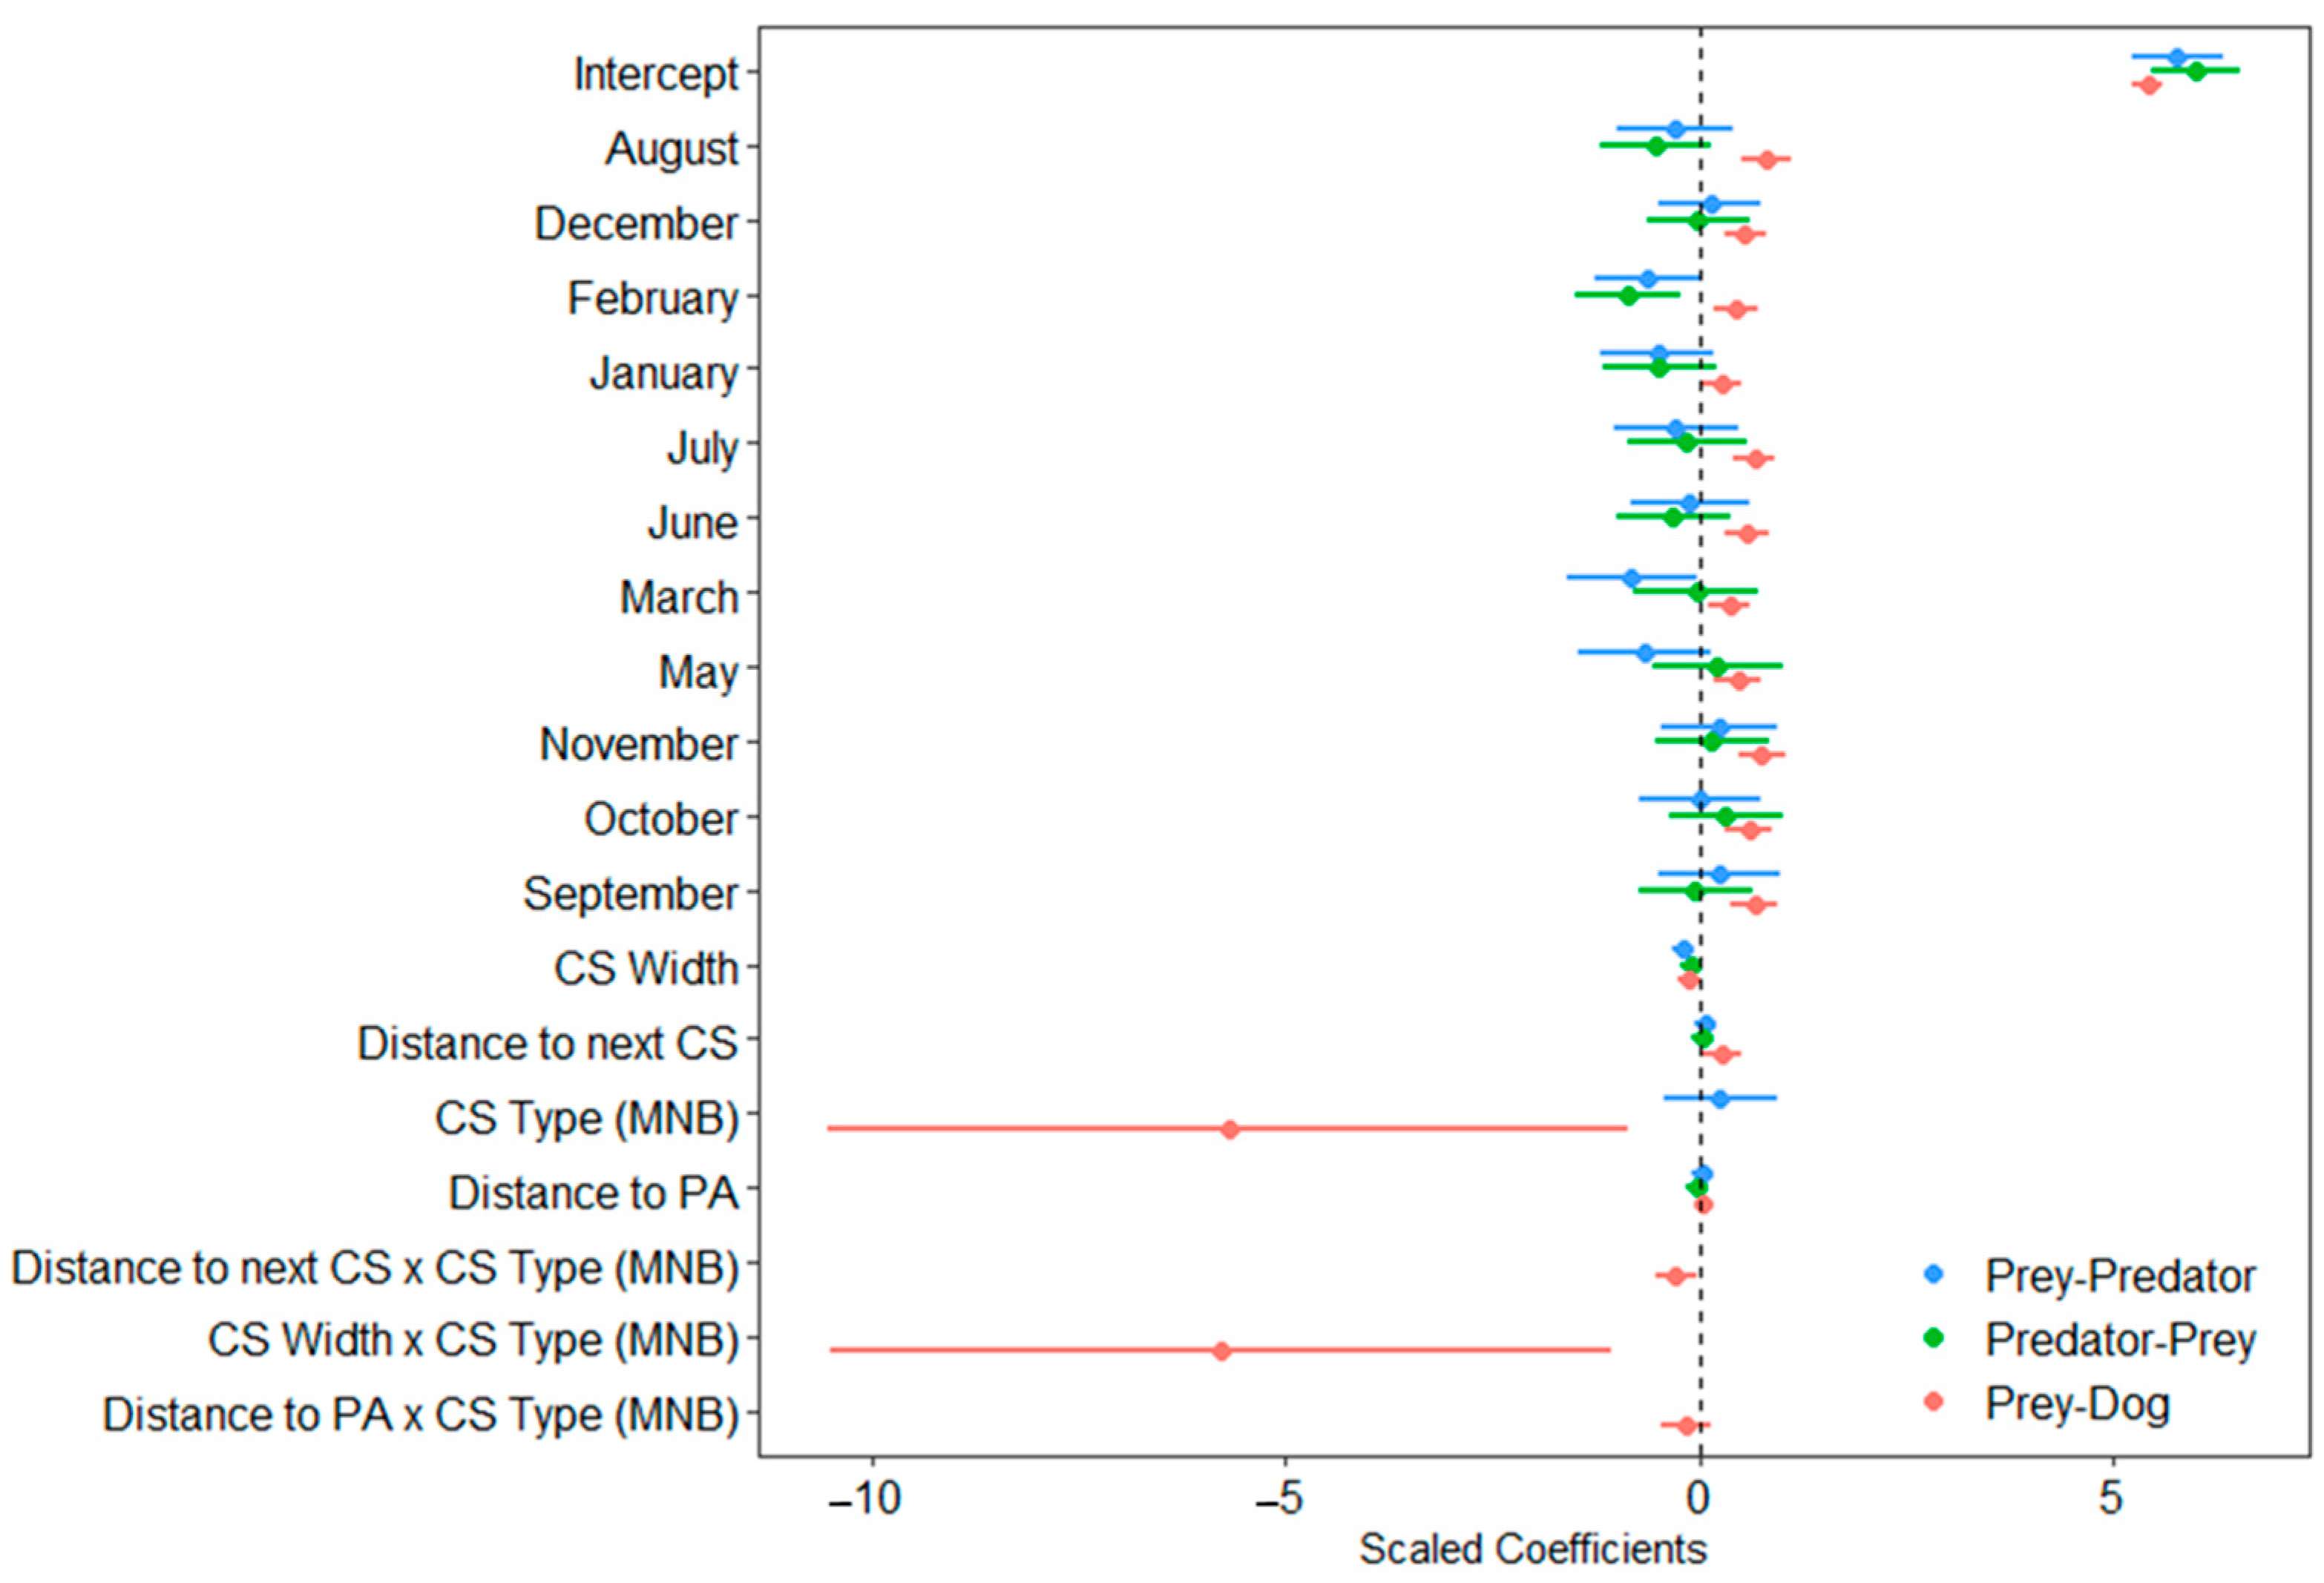
Latencies across all three groups decreased with increasing crossing structure width, most significantly for prey–predator sequences. Prey–dog latencies significantly decreased with increasing width of crossing structures with natural drainage (MNBs), and declined insignificantly with increasing animal underpass (AUP) width (Supplementary Figure S1). None of the variables were found to significantly influence the patterns of predator–prey latencies (Figure 5, Supplementary Tables S2 and S3).

4. Discussion

Geometric mean latencies across all pairs were shorter at crossing structures than the geometric mean latencies for the corresponding pairs at control sites. Shorter latencies at crossing structures are expected, since such structures tend to funnel animal movement into narrower restricted spaces [34], thus increasing the movement rates at crossing structures as compared to forest interiors. Consequently, mean prey–predator latencies were found to be lower than those in the control habitat, and significantly shorter than predator–prey latencies at crossing structures. However, the geometric mean prey–predator latencies at crossing structures are not short enough to suggest that predators actively scout for prey at crossing structures. Present evidence suggests that species’ use of the crossing structures on NH 44 is dictated by factors other than predator or prey activity (Saxena et al., in review).

4.1. Predator Following Prey into Crossing Structures

Regression analysis revealed that an increase in crossing structure widths was associated with a decrease in prey–predator latencies. This could be an artefact of the greater use and concentration of wildlife at wider crossing structures. This could also be because the relatively smaller size of some crossing structures (50–80 m) is a limiting factor for use by the major group-living prey species in the landscape, viz., chital, sambar and nilgai. Crossing structures on which prey–predator interactions have been studied to date are narrow and have limited escape routes (single entry and single exit), and possibly limit the utility of anti-predation strategies by prey [17]. However, AUPs on NH 44 are considerably wide (100–750 m wide). More open spaces under the crossing structures possibly enable the early detection of predators and escape by prey [18], which is why not many instances of predation near the crossing structures have been observed during the present study.
Further, after categorising prey–predator sequences by the predator species involved, we found that prey–-wild dog pairs were the most frequent, and had the shortest latencies. Four events of predation attempts by wild dogs at the crossing structures (and none involving other predator species) were recorded during the two years of continuous crossing structure monitoring. This suggests a proportionally larger weight of prey–wild dog sequences in the overall prey–predator latencies, as a consequence of frequent use of crossing structures by wild dogs in proximity to the tiger reserve and occasional predation attempts. Therefore, it would be prudent to interpret these findings in light of the relative use of crossing structures by species and structure type.

4.2. Prey Following Predator into Crossing Structures

Predator–prey latencies were shorter than those in the control habitat and longer than prey–predator latencies. However, none of the variables could significantly explain the structure-wise or width-wise patterns of predator–prey latencies. We did not find evidence of prey responding to changes in prey–predator latencies in either crossing structures with low or high prey–predator latencies (Supplementary Figure S2).

4.3. Free-Ranging Dogs Following Prey into Crossing Structures

Although high prey–dog latencies and no significant differences between prey–dog and prey–predator latencies were found during our study, two incidents of prey and dog co-occurrence and one instance of a predation attempt by a pack of dogs was recorded at the crossing structures. Moreover, given the presence of dogs in packs regularly accompanying domestic cattle and cattle herders, and the vicinity of the crossing structures to human settlements, the eventual possibility of the predation of wild prey by dogs at the crossing structures cannot be ruled out. In India, dogs—free-ranging or accompanied by humans—are responsible for attacks on 44 species of mammals, especially ungulates, in the vicinity of protected areas [35]. This also presents the problem of disease transmission between free-ranging dogs, wild dogs and other wildlife [36,37]. Free-ranging dogs usually accompanied by humans and livestock have the potential to learn about the availability of prey at crossing structures. Given the lack of co-evolution between dogs and wild prey, the latter may not be able to adapt quickly to the situation [34].
While the need for further research into predator–prey interactions within crossing structures has been emphasised [17,34], appropriate metrics to evaluate the same are required. In contrast to the use of track beds [22], the use of camera traps provides finer-scale temporal data for studying such interactions [31]. Further work towards establishing the trade-off between the effectiveness of crossing structures and the predation risk for prey species should include the study of predation patterns, kill site characteristics near roads [24,25], and aspects of predator and prey behaviour.
In addition to demonstrating the efficacy of crossing structures in mitigating road-related mortality and as a barrier to animal movement, it is critical for road ecology research to demonstrate the success of crossing structures in terms of maintaining natural or near-natural interspecies interactions. Evidence suggests that the prey-trap situation could be a concern if wildlife passages built for use by prey are exploited by predators for foraging [17]. However, given the richness of both predator and prey species using the crossing structures on NH 44 because of the proximity to PTR, exploitation by predators is unlikely. Although a few instances of wild dogs and free-ranging dogs preying on ungulates were observed in our study (as in Ford and Clevenger, 2010 [25]), these are rare events and possibly represent infrequent opportunism [17], and the role of the crossing structures in mitigating the impacts of roads currently outweighs these concerns. However, we suggest increasing spatial heterogeneity at crossing structures and vegetation cover near structures in a planned manner to enable their greater use by prey species [34]. Moreover, since crossing structure use is more often influenced by species preferences that may include anti-predation strategies, heterogeneity in structure design [38], increase in vegetation cover parallel to the crossing structures and measures to control the presence of free-ranging dogs in forest areas are recommended.

Supplementary Materials

The following are available online at https://www.mdpi.com/article/10.3390/d14050312/s1, Figure S1: Plot showing the interactive influence of crossing structure type and crossing structure width on geometric mean latencies (in minutes); Figure S2: Variation in predator–prey and prey–predator latencies among crossing structures with high (highlat) and low (lowlat) overall prey–predator latencies throughout the monitoring period; Table S1: Details of crossing structures on National Highway 44 passing through Pench tiger reserve, Maharashtra; Table S2: Model selection table showing best models with factors explaining prey–predator, predator–prey and prey–dog latencies, with Akaike’s Information Criterion values, difference in AIC (ΔAIC) from the best model, and degrees of freedom (df). Models with AIC < 2 were averaged; Table S3: Model-averaged coefficients (β) for models explaining factors affecting prey–predator, predator–prey and prey–dog latencies at crossing structures on NH 44 passing through Pench Tiger Reserve, Maharashtra, India.

Author Contributions

Conceptualisation, B.H. and A.S.; Methodology, B.H. and A.S.; Formal Analysis, A.S.; Investigation, A.S. and B.H.; Resources, B.H.; Data Curation, A.S.; Writing—Original Draft Preparation, A.S.; Writing—Review and Editing, A.S. and B.H.; Visualisation, A.S.; Supervision, B.H.; Project Administration, B.H.; Funding Acquisition, B.H. All authors have read and agreed to the published version of the manuscript.

Funding

Monitoring of the crossing structures was partially supported by funds from the Maharashtra Forest Department, Maharashtra State Road Development Corporation and National Tiger Conservation Authority, India.

Institutional Review Board Statement

Not applicable.

Informed Consent Statement

Not applicable.

Data Availability Statement

The data presented in this study are available on request from the corresponding author. The data are not publicly available because the study involves Schedule I species under the Wildlife (Protection) Act, 1972, of India.

Acknowledgments

The authors would like to thank the Maharashtra Forest Department for the necessary permissions and logistics support during the monitoring, and the National Tiger Conservation Authority and the National Highway Authority of India for field support and encouragement during monitoring. Yash Dabholkar and Indranil Bhowmick, project fellows, WII, are thanked for helping with field data collection. The authors also acknowledge field collaborators Kuldeep Dubey, Gautam Meshram and Nishant Choudhary. The Director, the Dean and the Research Coordinator at the Wildlife Institute of India are thanked for their administrative support and encouragement. The authors thank the anonymous reviewers for their helpful comments on improving the manuscript.

Conflicts of Interest

The authors declare no conflict of interest.

References

  1. Van Der Ree, R.; Smith, D.J.; Grilo, C. The ecological effects of linear infrastructure and traffic: Challenges and opportunities of rapid global growth. In Handbook of Road Ecology; Van Der Ree, R., Smith, D.J., Grilo, C., Eds.; John Wiley & Sons, Ltd.: Hoboken, NJ, USA, 2015. [Google Scholar]
  2. Ibisch, P.L.; Hoffmann, M.T.; Kreft, S.; Pe’Er, G.; Kati, V.; Biber-Freudenberger, L.; DellaSala, D.A.; Vale, M.M.; Hobson, P.R.; Selva, N. A global map of roadless areas and their conservation status. Science 2016, 354, 1423–1427. [Google Scholar] [CrossRef] [PubMed]
  3. Pinto, F.A.S.; Bager, A.; Clevenger, A.P.; Grilo, C. Giant anteater (Myrmecophaga tridactyla) conservation in Brazil: Analysing the relative effects of fragmentation and mortality due to roads. Biol. Conserv. 2018, 228, 148–157. [Google Scholar] [CrossRef]
  4. Nayak, R.; Karanth, K.K.; Dutta, T.; Defries, R.; Ullas Karanth, K.; Vaidyanathan, S. Bits and pieces: Forest fragmentation by linear intrusions in India. Land Use Policy 2020, 99, 104619. [Google Scholar] [CrossRef]
  5. Colchero, F.; Conde, D.A.; Manterola, C.; Chávez, C.; Rivera, A.; Ceballos, G. Jaguars on the move: Modeling movement to mitigate fragmentation from road expansion in the Mayan Forest. Anim. Conserv. 2011, 14, 158–166. [Google Scholar] [CrossRef]
  6. Chen, H.L.; Koprowski, J.L. Barrier effects of roads on an endangered forest obligate: Influences of traffic, road edges, and gaps. Biol. Conserv. 2016, 199, 33–40. [Google Scholar] [CrossRef] [Green Version]
  7. Jacobson, S.L.; Bliss-Ketchum, L.L.; De Rivera, C.E.; Smith, W.P. A behavior-based framework for assessing barrier effects to wildlife from vehicle traffic volume. Ecosphere 2016, 7, 1–15. [Google Scholar] [CrossRef]
  8. Schwab, A.C.; Zandbergen, P.A. Vehicle-related mortality and road crossing behavior of the Florida panther. Appl. Geogr. 2011, 31, 859–870. [Google Scholar] [CrossRef]
  9. Jackson, N.D.; Fahrig, L. Relative effects of road mortality and decreased connectivity on population genetic diversity. Biol. Conserv. 2011, 144, 3143–3148. [Google Scholar] [CrossRef]
  10. Riley, S.P.D.; Pollinger, J.P.; Sauvajot, R.M.; York, E.C.; Bromley, C.; Fuller, T.K.; Wayne, R.K. A southern California freeway is a physical and social barrier to gene flow in carnivores. Mol. Ecol. 2006, 15, 1733–1741. [Google Scholar] [CrossRef]
  11. Ceia-Hasse, A.; Navarro, L.M.; Borda-de-Água, L.; Pereira, H.M. Population persistence in landscapes fragmented by roads: Disentangling isolation, mortality, and the effect of dispersal. Ecol. Modell. 2018, 375, 45–53. [Google Scholar] [CrossRef]
  12. Smith, D.J.; van der Ree, R.; Rossel, C. Wildlife crossing structures: An effective strategy to restore or maintain wildlife connectivity across roads. In Handbook of Road Ecology; van der Ree, R., Smith, D.J., Grilo, C., Eds.; John Wiley & Sons, Ltd.: Hoboken, NJ, USA, 2015. [Google Scholar]
  13. Gagnon, J.W.; Dodd, N.L.; Ogren, K.S.; Schweinsburg, R.E. Factors associated with use of wildlife underpasses and importance of long-term monitoring. J. Wildl. Manag. 2011, 75, 1477–1487. [Google Scholar] [CrossRef]
  14. Wang, Y.; Guan, L.; Piao, Z.; Wang, Z.; Kong, Y. Monitoring wildlife crossing structures along highways in Changbai Mountain, China. Transp. Res. Part D Transp. Environ. 2017, 50, 119–128. [Google Scholar] [CrossRef]
  15. González-Gallina, A.; Hidalgo-Mihart, M.G.; Castelazo-Calva, V. Conservation implications for jaguars and other neotropical mammals using highway underpasses. PLoS ONE 2018, 13, e0206614. [Google Scholar] [CrossRef] [PubMed] [Green Version]
  16. Andis, A.Z.; Huijser, M.P.; Broberg, L. Performance of arch-style road crossing structures from relative movement rates of large mammals. Front. Ecol. Evol. 2017, 5, 1–13. [Google Scholar] [CrossRef] [Green Version]
  17. Little, S.J.; Harcourt, R.G.; Clevenger, A.P. Do wildlife passages act as prey-traps? Biol. Conserv. 2002, 107, 135–145. [Google Scholar] [CrossRef]
  18. Hunt, A.; Dickens, H.J.; Whelan, R.J. Movement of mammals through tunnels under railway lines. Aust. Zool. 1987, 24, 89–93. [Google Scholar] [CrossRef] [Green Version]
  19. Foster, M.L.; Humphrey, S.R. Use of highway underpasses by Florida panthers and other wildlife. Wildl. Soc. Bull. 1995, 23, 95–100. [Google Scholar]
  20. Soanes, K.; Mitchell, B.; van der Ree, R. Quantifying predation attempts on arboreal marsupials using wildlife crossing structures above a major road. Aust. Mammal. 2016, 39, 254–257. [Google Scholar] [CrossRef]
  21. Harris, I.M.; Mills, H.R.; Bencini, R. Multiple individual southern brown bandicoots (Isoodon obesulus fusciventer) and foxes (Vulpes vulpes) use underpasses installed at a new highway in Perth, Western Australia. Wildl. Res. 2010, 37, 127–133. [Google Scholar] [CrossRef]
  22. Mata, C.; Herranz, J.; Malo, J.E. Attraction and Avoidance between Predators and Prey at Wildlife Crossings on Roads. Diversity 2020, 12, 166. [Google Scholar] [CrossRef]
  23. Dickson, B.G.; Jenness, J.S.; Beier, P. Influence of vegetation, topography, and roads on cougar movement in southern California. J. Wildl. Dis. 2005, 69, 264–276. [Google Scholar] [CrossRef]
  24. Dupuis-Desormeaux, M.; Davidson, Z.; Mwololo, M.; Kisio, E.; Taylor, S.; MacDonald, S.E. Testing the Prey-Trap Hypothesis at Two Wildlife Conservancies in Kenya. PLoS ONE 2015, 10, e0139537. [Google Scholar] [CrossRef] [PubMed] [Green Version]
  25. Ford, A.T.; Clevenger, A.P. Validity of the Prey-Trap Hypothesis for Carnivore-Ungulate Interactions at Wildlife-Crossing Structures. Conserv. Biol. 2010, 24, 1679–1685. [Google Scholar] [CrossRef] [PubMed]
  26. Mysłajek, R.W.; Olkowska, E.; Wronka-Tomulewicz, M.; Nowak, S. Mammal use of wildlife crossing structures along a new motorway in an area recently recolonized by wolves. Eur. J. Wildl. Res. 2020, 66, 79. [Google Scholar] [CrossRef]
  27. Wildlife Institute of India. Eco-Friendly Measures to Mitigate the Impacts of Linear Infrastructure on Wildlife; Wildlife Institute of India: Dehradun, India, 2016. [Google Scholar]
  28. Cuddeback. Green Bay, Wisconsin, N.D. Available online: https://www.cuddeback.com/ (accessed on 17 November 2021).
  29. Karanth, K.U.; Sunquist, M.E. Prey Selection by Tiger, Leopard and Dhole in Tropical Forests. J. Anim. Ecol. 1995, 64, 439. [Google Scholar] [CrossRef]
  30. Majumder, A. Prey Selection, Food Habits and Population Structure of Sympatric Carnivores: Tiger panthera tigris tigris (L.), Leopard Panthera pardus (L.) and Dhole Cuon alpinus (PALLAS) in Pench Tiger Reserve, Madhya Pradesh (India). Ph.D. Thesis, Saurashtra University, Rajkot, India, 2011. [Google Scholar]
  31. Martinig, A.R.; Riaz, M.; St. Clair, C.C. Temporal clustering of prey in wildlife passages provides no evidence of a prey-trap. Sci. Rep. 2020, 10, 11489. [Google Scholar] [CrossRef]
  32. Barton, K. MuMIn: Multi-Model Inference. R Package. 2020. Available online: https://cran.r-project.org/package=MuMIn (accessed on 23 November 2021).
  33. RStudio Team. RStudio: Integrated Development Environment for R. 2020. Available online: https://www.rstudio.com/ (accessed on 15 July 2017).
  34. Mata, C.; Bencini, R.; Chambers, B.K.; Malo, J.E. Predator-prey interactions at wildlife crossing structures: Between myth and reality. In Handbook of Road Ecology; van der Ree, R., Smith, D.J., Grilo, C., Eds.; John Wiley & Sons, Ltd.: Chichester, UK, 2015; pp. 190–197. [Google Scholar]
  35. Home, C.; Bhatnagar, Y.V.; Vanak, A.T. Canine Conundrum: Domestic dogs as an invasive species and their impacts on wildlife in India. Anim. Conserv. 2018, 21, 275–282. [Google Scholar] [CrossRef]
  36. Acosta-Jamett, G.; Chalmers, W.S.K.; Cunningham, A.A.; Cleaveland, S.; Handel, I.G.; Bronsvoort, B.M. Urban domestic dog populations as a source of canine distemper virus for wild carnivores in the Coquimbo region of Chile. Vet. Microbiol. 2011, 152, 247–257. [Google Scholar] [CrossRef] [Green Version]
  37. Furtado, M.M.; Hayashi, E.M.K.; Allendorf, S.D.; Coelho, C.J.; de Almeida Jácomo, A.T.; Megid, J.; Ramos Filho, J.D.; Silveira, L.; Tôrres, N.M.; Ferreira Neto, J.S. Exposure of Free-Ranging Wild Carnivores and Domestic Dogs to Canine Distemper Virus and Parvovirus in the Cerrado of Central Brazil. EcoHealth 2016, 13, 549–557. [Google Scholar] [CrossRef] [Green Version]
  38. Kintsch, J.; Jacobson, S.L.; Cramer, P. The wildlife crossing guild decision framework: A behavior-based approach to designing effective wildlife crossing structures. In Proceedings of the 2015 International Conference on Ecology and Transportation (ICOET 2015) Session, Raleigh, NC, USA, 20–24 September 2015. [Google Scholar]
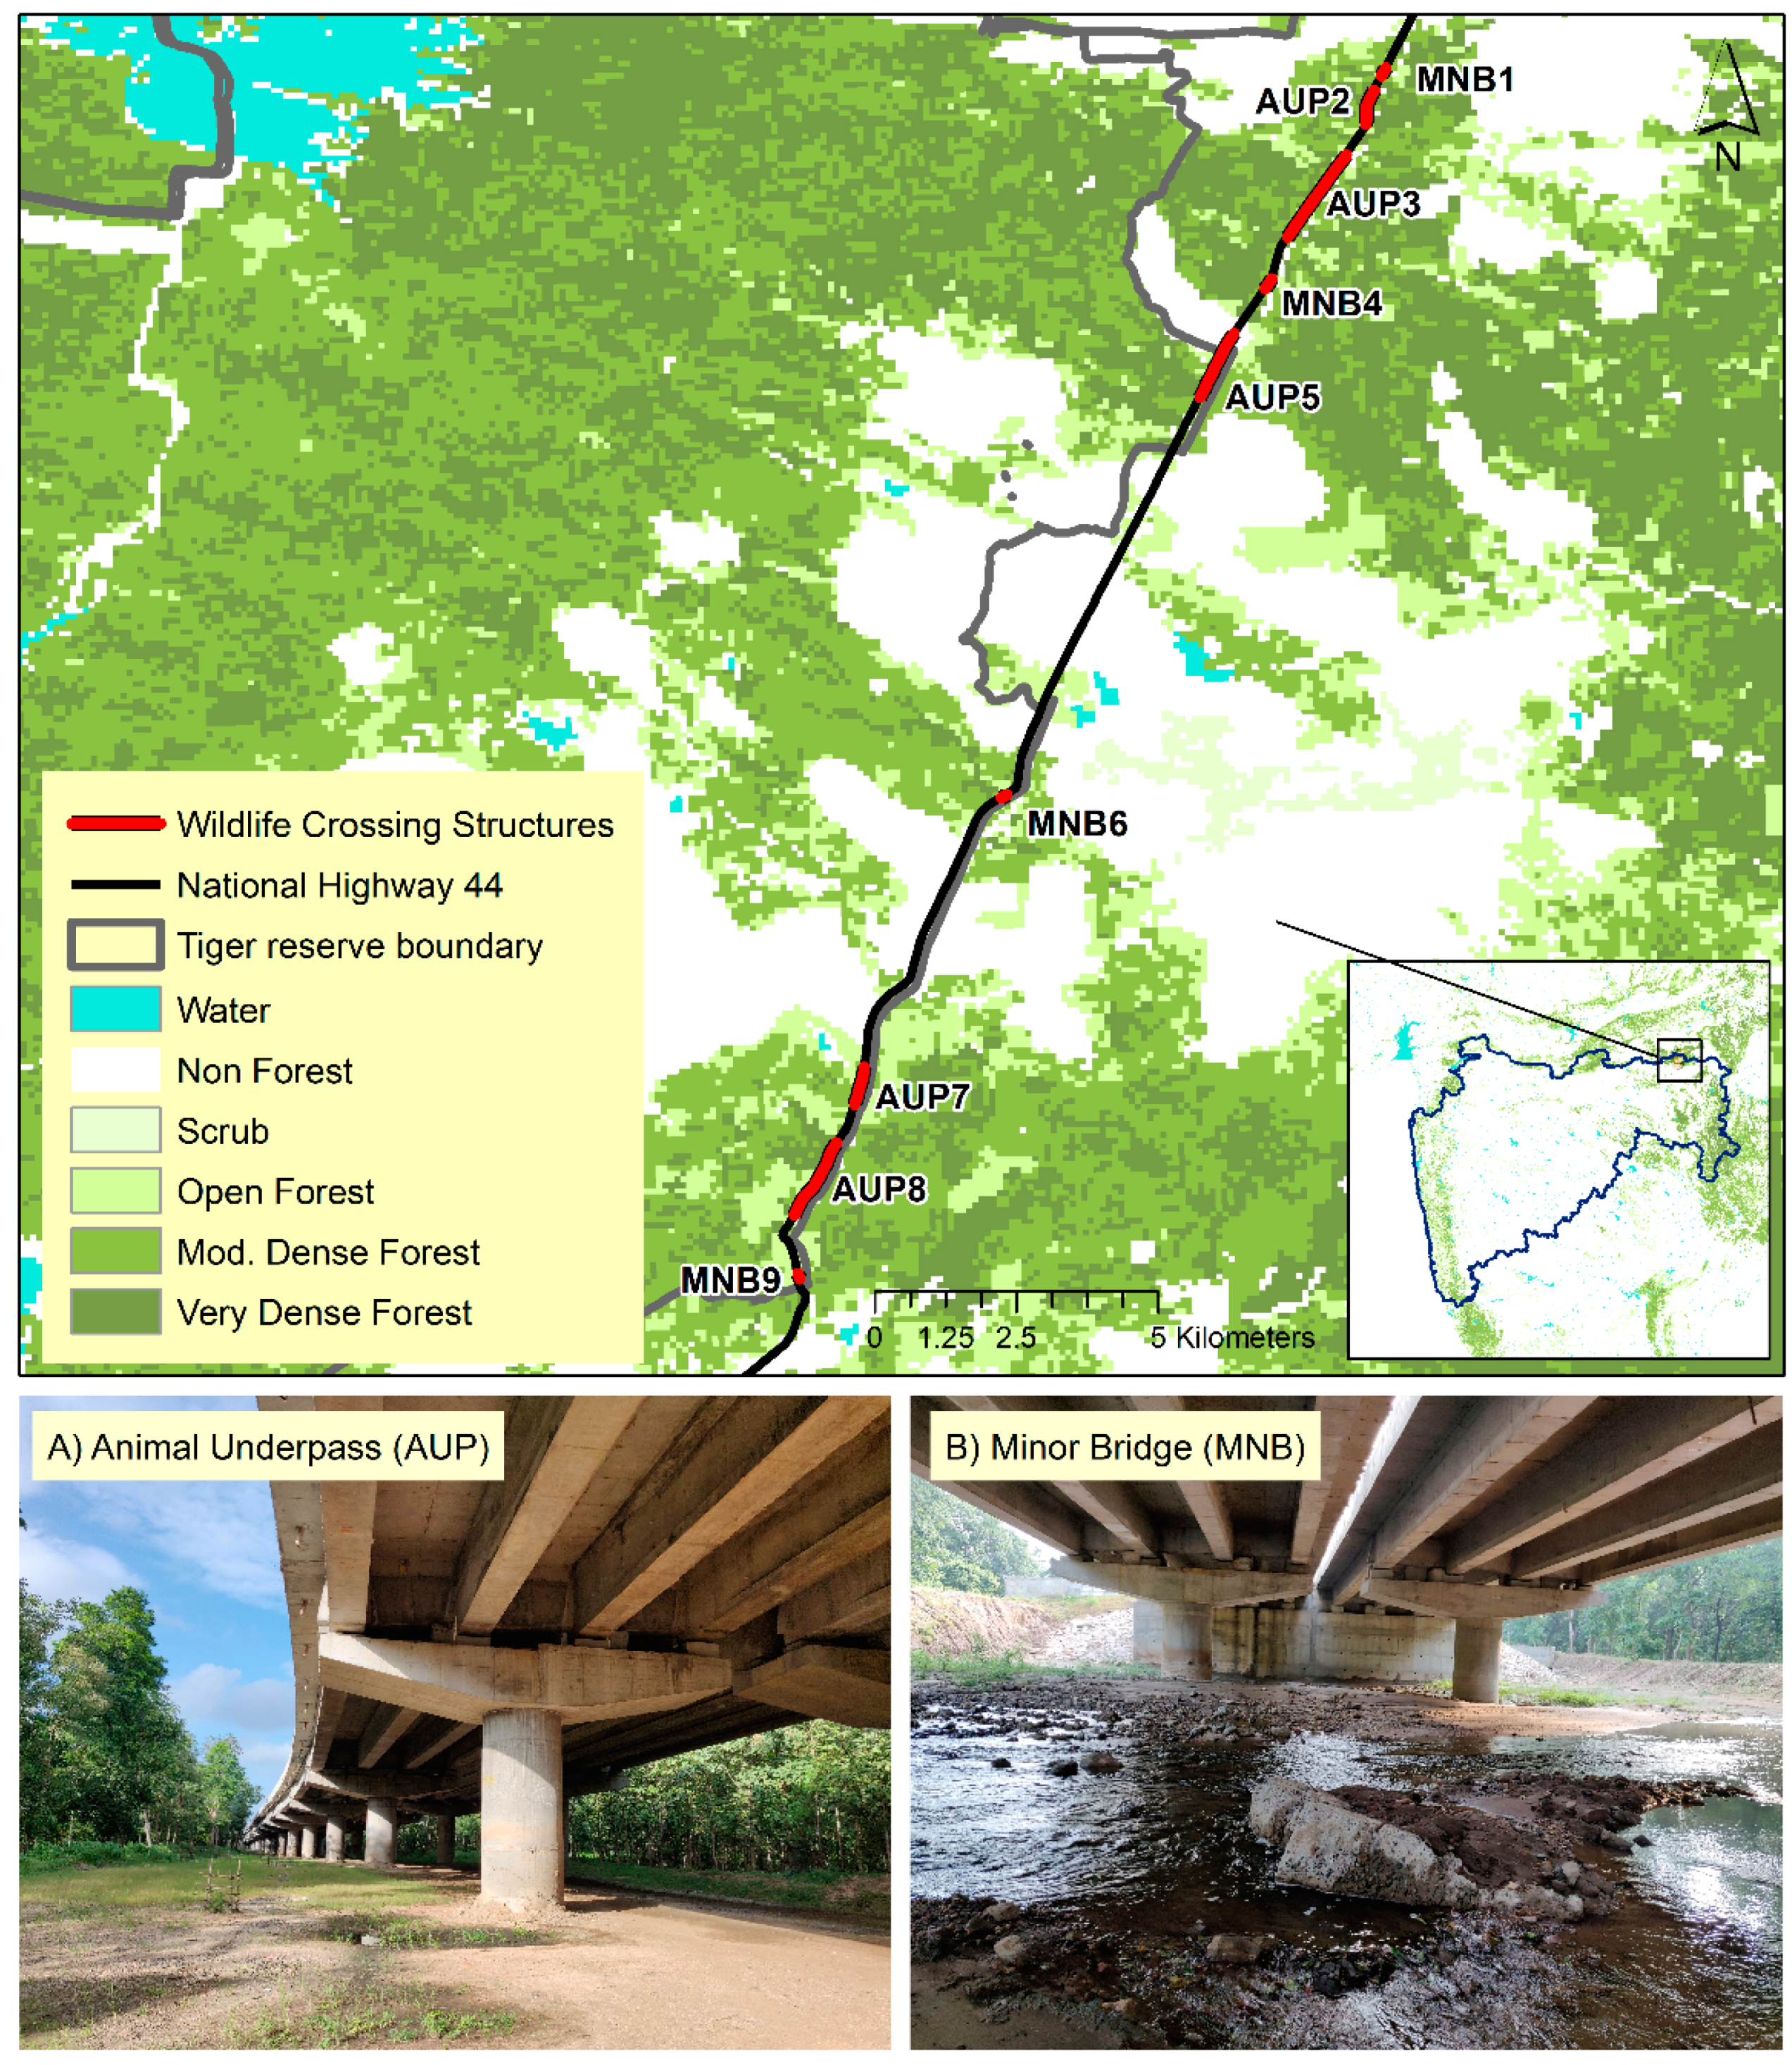
Figure 1. Location of nine crossing structures on National Highway 44 passing through Pench Tiger reserve, Maharashtra (top): (A) a typical animal underpass (AUP), and (B) a typical minor bridge (MNB).
Diversity 14 00312 g001
Figure 2. Comparison of geometric mean latencies (black triangle) and median latencies between predator–prey, prey–predator, and prey–dog pairs at crossing structures and control site. Error bars indicate 95% confidence intervals. Black dots represent outliers.
Diversity 14 00312 g002
Figure 3. Comparison of geometric mean latencies (black triangle) and median latencies between prey–leopard, prey–tiger, prey–wild dog and prey–dog pairs at crossing structures and control site. Error bars indicate 95% confidence intervals. Black dots represent outliers.
Diversity 14 00312 g003
Figure 4. Variation in mean latencies (black dots) of predator–prey, prey–dog and prey–predator latencies at animal crossing zones on National Highway 44. Structures have been arranged in increasing order of width (AUP = animal underpass; MNB = minor bridge). Grey dots represent outliers.
Diversity 14 00312 g004
Figure 5. Comparison of model-averaged coefficients of variables explaining predator, prey and dog interactions at crossing structures on NH 44, Pench Tiger Reserve, Maharashtra, India.
Diversity 14 00312 g005
Table 1. Geometric mean latencies (minutes) between predator–prey, prey–dog and prey–predator under crossing structures on NH 44, Pench Tiger Reserve, Maharashtra, India.
PairSitenGeometric Mean
(Minutes)
MeanStandard DeviationStandard Error95% Confidence Interval
1Predator–preyControl475405589134–1220385–426366–447
Crossing structure37415135524.1–948137–166125–182
2Prey–dogCrossing structure160217038527.3–1060162–178155–186
3Prey–predatorControl49233154088–1240311–351294–372
Crossing structure38711229517.4–726102–12393.2–135
Table 2. Geometric mean latencies (minutes) between prey–predator sequences for different wild predator species and free-ranging dogs at crossing structures on NH 44, Pench Tiger Reserve, Maharashtra, India.
Prey–Predator SpeciesSitenGeometric Mean
(Minutes)
SDSECI
1Prey–dogCrossing structure160217027.3–1060162–178155–186
2Prey–LeopardControl12934479.5–1490302–391266–444
Crossing structure7215639.1–625133–184113–216
3Prey–TigerControl253365120–1110340–391318–419
Crossing structure12920354.3–758181–228161–255
4Prey–Wild dogControl11025253.2–1190217–292188–337
Crossing structure18665.67.42–58055.9–76.947.8–89.9
Publisher’s Note: MDPI stays neutral with regard to jurisdictional claims in published maps and institutional affiliations.