Article

Four-Year Field Survey of Black Band Disease and Skeletal Growth Anomalies in Encrusting Montipora spp. Corals around Sesoko Island, Okinawa

1
Graduate School of Engineering and Science, University of the Ryukyus, Nishihara, Okinawa 903-0213, Japan
2
Physics and Biology Unit, Okinawa Institute of Science and Technology Graduate University (OIST), 1919-1 Tancha, Onna-son, Okinawa 904-0495, Japan
3
The Oceancy MTÜ, Männimäe/1, Pudisoo küla, Kuusalu vald, 74626 Harju maakond, Estonia
4
Sesoko Station, Tropical Biosphere Research Center (TBRC), University of the Ryukyus, 3422 Sesoko, Motobu, Okinawa 905-0227, Japan
5
Biodiversity Research Center (BRC), Academia Sinica, Taipei 11529, Taiwan
6
Tropical Biosphere Research Center (TBRC), University of the Ryukyus, 1 Senbaru, Nishihara, Okinawa 903-0213, Japan
*
Authors to whom correspondence should be addressed.
These authors contributed equally to this work.
Diversity 2022, 14(1), 32; https://doi.org/10.3390/d14010032
Submission received: 1 October 2021 / Revised: 21 December 2021 / Accepted: 25 December 2021 / Published: 4 January 2022
(This article belongs to the Special Issue Marginal Reef Systems: Resilience in A Rapidly Changing World)

Abstract

:
The Indo-Pacific zooxanthellate scleractinian coral genus Montipora is the host of many coral diseases. Among these are cyanobacterial Black Band Disease (BBD) and Skeletal Growth Anomalies (GAs), but in general data on both diseases are lacking from many regions of the Indo-Pacific, including from Okinawa, southern Japan. In this study, we collected annual prevalence data of Black Band Disease (BBD) and Skeletal Growth Anomalies (GAs) affecting the encrusting form of genus Montipora within the shallow reefs of the subtropical Sesoko Island (off the central west coast of Okinawajima Island) from summer to autumn for four years (2017 to 2020). In 2020 Montipora percent coverage and colony count were also assessed. Generalized Linear Models (GLM) were used to understand the spatial and temporal variation of both BBD and GAs in the nearshore (NE) and reef edge (RE) sites, which revealed higher probability of BBD occurrence in RE sites. BBD prevalence was significantly higher in 2017 in some sites than all other years with site S12 having significant higher probability during all four surveyed years. In terms of GAs, certain sites in 2020 had higher probability of occurrence than during the other years. While the general trend of GAs increased from 2017 to 2020, it was observed to be non-fatal to colonies. In both diseases, the interaction between sites and years was significant. We also observed certain BBD-infected colonies escaping complete mortality. BBD progression rates were monitored in 2020 at site S4, and progression was related to seawater temperatures and was suppressed during periods of heavy rain and large strong typhoons. Our results suggest that higher BBD progression rates are linked with high sea water temperatures (SST > bleaching threshold SST) and higher light levels (>1400 µmol m−2 s−1), indicating the need for further controlled laboratory experiments. The current research will help form the basis for continued future research into these diseases and their causes in Okinawa and the Indo-Pacific Ocean.

1. Introduction

Diseases in the marine ecosystem affect various organisms [1] among which diseases affecting the zooxanthellate scleractinian corals have received increased attention due to their link to the global decline of the coral reef ecosystems [2]. Although massive forms of reef-building corals like are among the most susceptible in terms of numbers of disease [2], several studies have highlighted the fragility of the genus Montipora to various diseases [3,4,5,6,7]. Montipora is a speciose genus of zooxanthellate scleractinian coral with a wide range of morphotypes including submassive, laminar, encrusting, and branching colonies, and is common on many Indo-Pacific coral reefs [8,9]. Widely distributed across the Indo-Pacific, in the Japanese Archipelago, Montipora has been reported from the southernmost Yaeyama Islands north to the Izu Peninsula, with species diversity decreasing northwards [10].
Montipora suffers from various coral diseases based on reports from across the Indo-Pacific. In Hawaii, Patchy Tissue Loss (PTL), Growth Anomalies (GAs), Tissue Loss Syndrome (TLS)/White Syndrome, Black Band Disease (BBD), and Skeletal Eroding Band (SEB) have been reported [11,12,13,14,15]. On the Great Barrier Reef (GBR), Montipora has been damaged by BBD and Atramentous Necrosis [4,16]. In Indonesia, a high prevalence of BBD has been reported [17], while a fungal syndrome has affected the genus on Kenyan reefs [18]. Around the Indian subcontinent colonies have been severely affected by Montipora White Syndrome [19,20], and Terpios sponge/Black Disease (BD) [21]. In the Japanese Archipelago, SEB, BBD, GAs, and Terpios sponge/BD on Montipora have been reported [3,5,7,22]. Among these diseases, BBD is known to be virulent in nature and observed to cause mortality at high rates in infected coral colonies [4,5,23], while GAs alter biological functions of their host by affecting skeletal properties [3]. In Okinawa, southern Japan, cases of BBD were reported initially from Sekisei Lagoon [24,25], and later from Akajima, Kerama and Sesoko reefs [5,22,26]. Similarly, GAs in Japan were first observed from Sesoko reefs [3], and subsequently reported from other nearby areas [27,28,29,30].
Research on BBD has rapidly progressed in recent years (e.g., [4,31]). BBD is a “polymicrobial disease” consisting of multiple bacterial flora interacting in a complex manner within a lesion [32], and includes members from the groups Cyanobacteria, Proteobacteria (Alpha, Delta and Gamma), Firmicutes, Cytophaga-Flavobacter-Bacteriodetes; as per previous reviews [33,34]. Cyanobacteria, which make up the majority of BBD microbial consortium, are divided into at least three different taxa and differ between the Caribbean Sea and the Indo-Pacific [35]. Within the Ryukyu Archipelago, the filamentous cyanobacteria Roseofilum reptotaenium has been recently reported [36]. BBD is not host-specific, but in Okinawan waters has been shown to be more common on genus Montipora than other corals (e.g., [5]).
Extensive long-term monitoring of BBD in the GBR has explored the initiation and microbial variation within the BBD bacterial community [4,31,37]. These studies have highlighted the presence of a non-black cyanobacterial patch (CP) that eventually leads to BBD [4,37]. Additional studies in the GBR and other regions have further associated BBD progression with environmental parameters such as seawater temperature and light [38,39,40]. Sato et al., 2011 [38], specifically targeted genus Montipora under three temperatures and two light intensities in tank conditions. In terms of GAs, much yet remains to be understood about their origin and etiology [41,42,43]. It has been confirmed that GAs are not fatal [44], but reduce overall coral colony fitness [3,43,44,45,46]. Like BBD, in-situ observations of GAs indicate incidence is related to seawater temperatures [47] and possibly affected by UV radiation [48]. Stimson, 2011 [44] tested this hypothesis in Hawaii but did not detect any correlation. As well, the roles of pathogens in GAs have not been fully explored [42]. A recent increase in GAs-related pathophysiological studies [49,50] has clearly highlighted such knowledge gaps.
Multi-year field assessments are an important factor to understand disease prevalence and occurrences at local scales [16], and as BBD and GAs are highly recognizable in-situ they can be easily assessed via field surveys [3,4,51]. However, long-term monitoring efforts of both BBD and GAs have been limited; however, see Irikawa et al., 2011 [52] and research from the Sekisei Lagoon [25,29]. Thus, there is clearly a need to better understand the dynamics of these diseases across years. A deeper understanding of both BBD and GAs are needed to aid in the conservation of coral reef ecosystems.
BBD and GAs are both found on the reefs of Sesoko Island, off the central-west coast of Okinawajima Island. This provided an opportunity to conduct multi-year monitoring, which we performed here, to address the following questions: (1) How does the prevalence of BBD and GAs change over time? (2) What is the mortality of coral colonies with BBD and GAs? (3) Can BBD and GAs occur in the same colony? and (4) Is the progression rate of BBD linked with environmental factors such as light and temperature? To answer these questions, we performed annual field surveys of BBD and GAs on encrusting Montipora colonies for four years (2017–2020) on the reefs off Sesoko Island, and report on our results here.

2. Materials and Methods
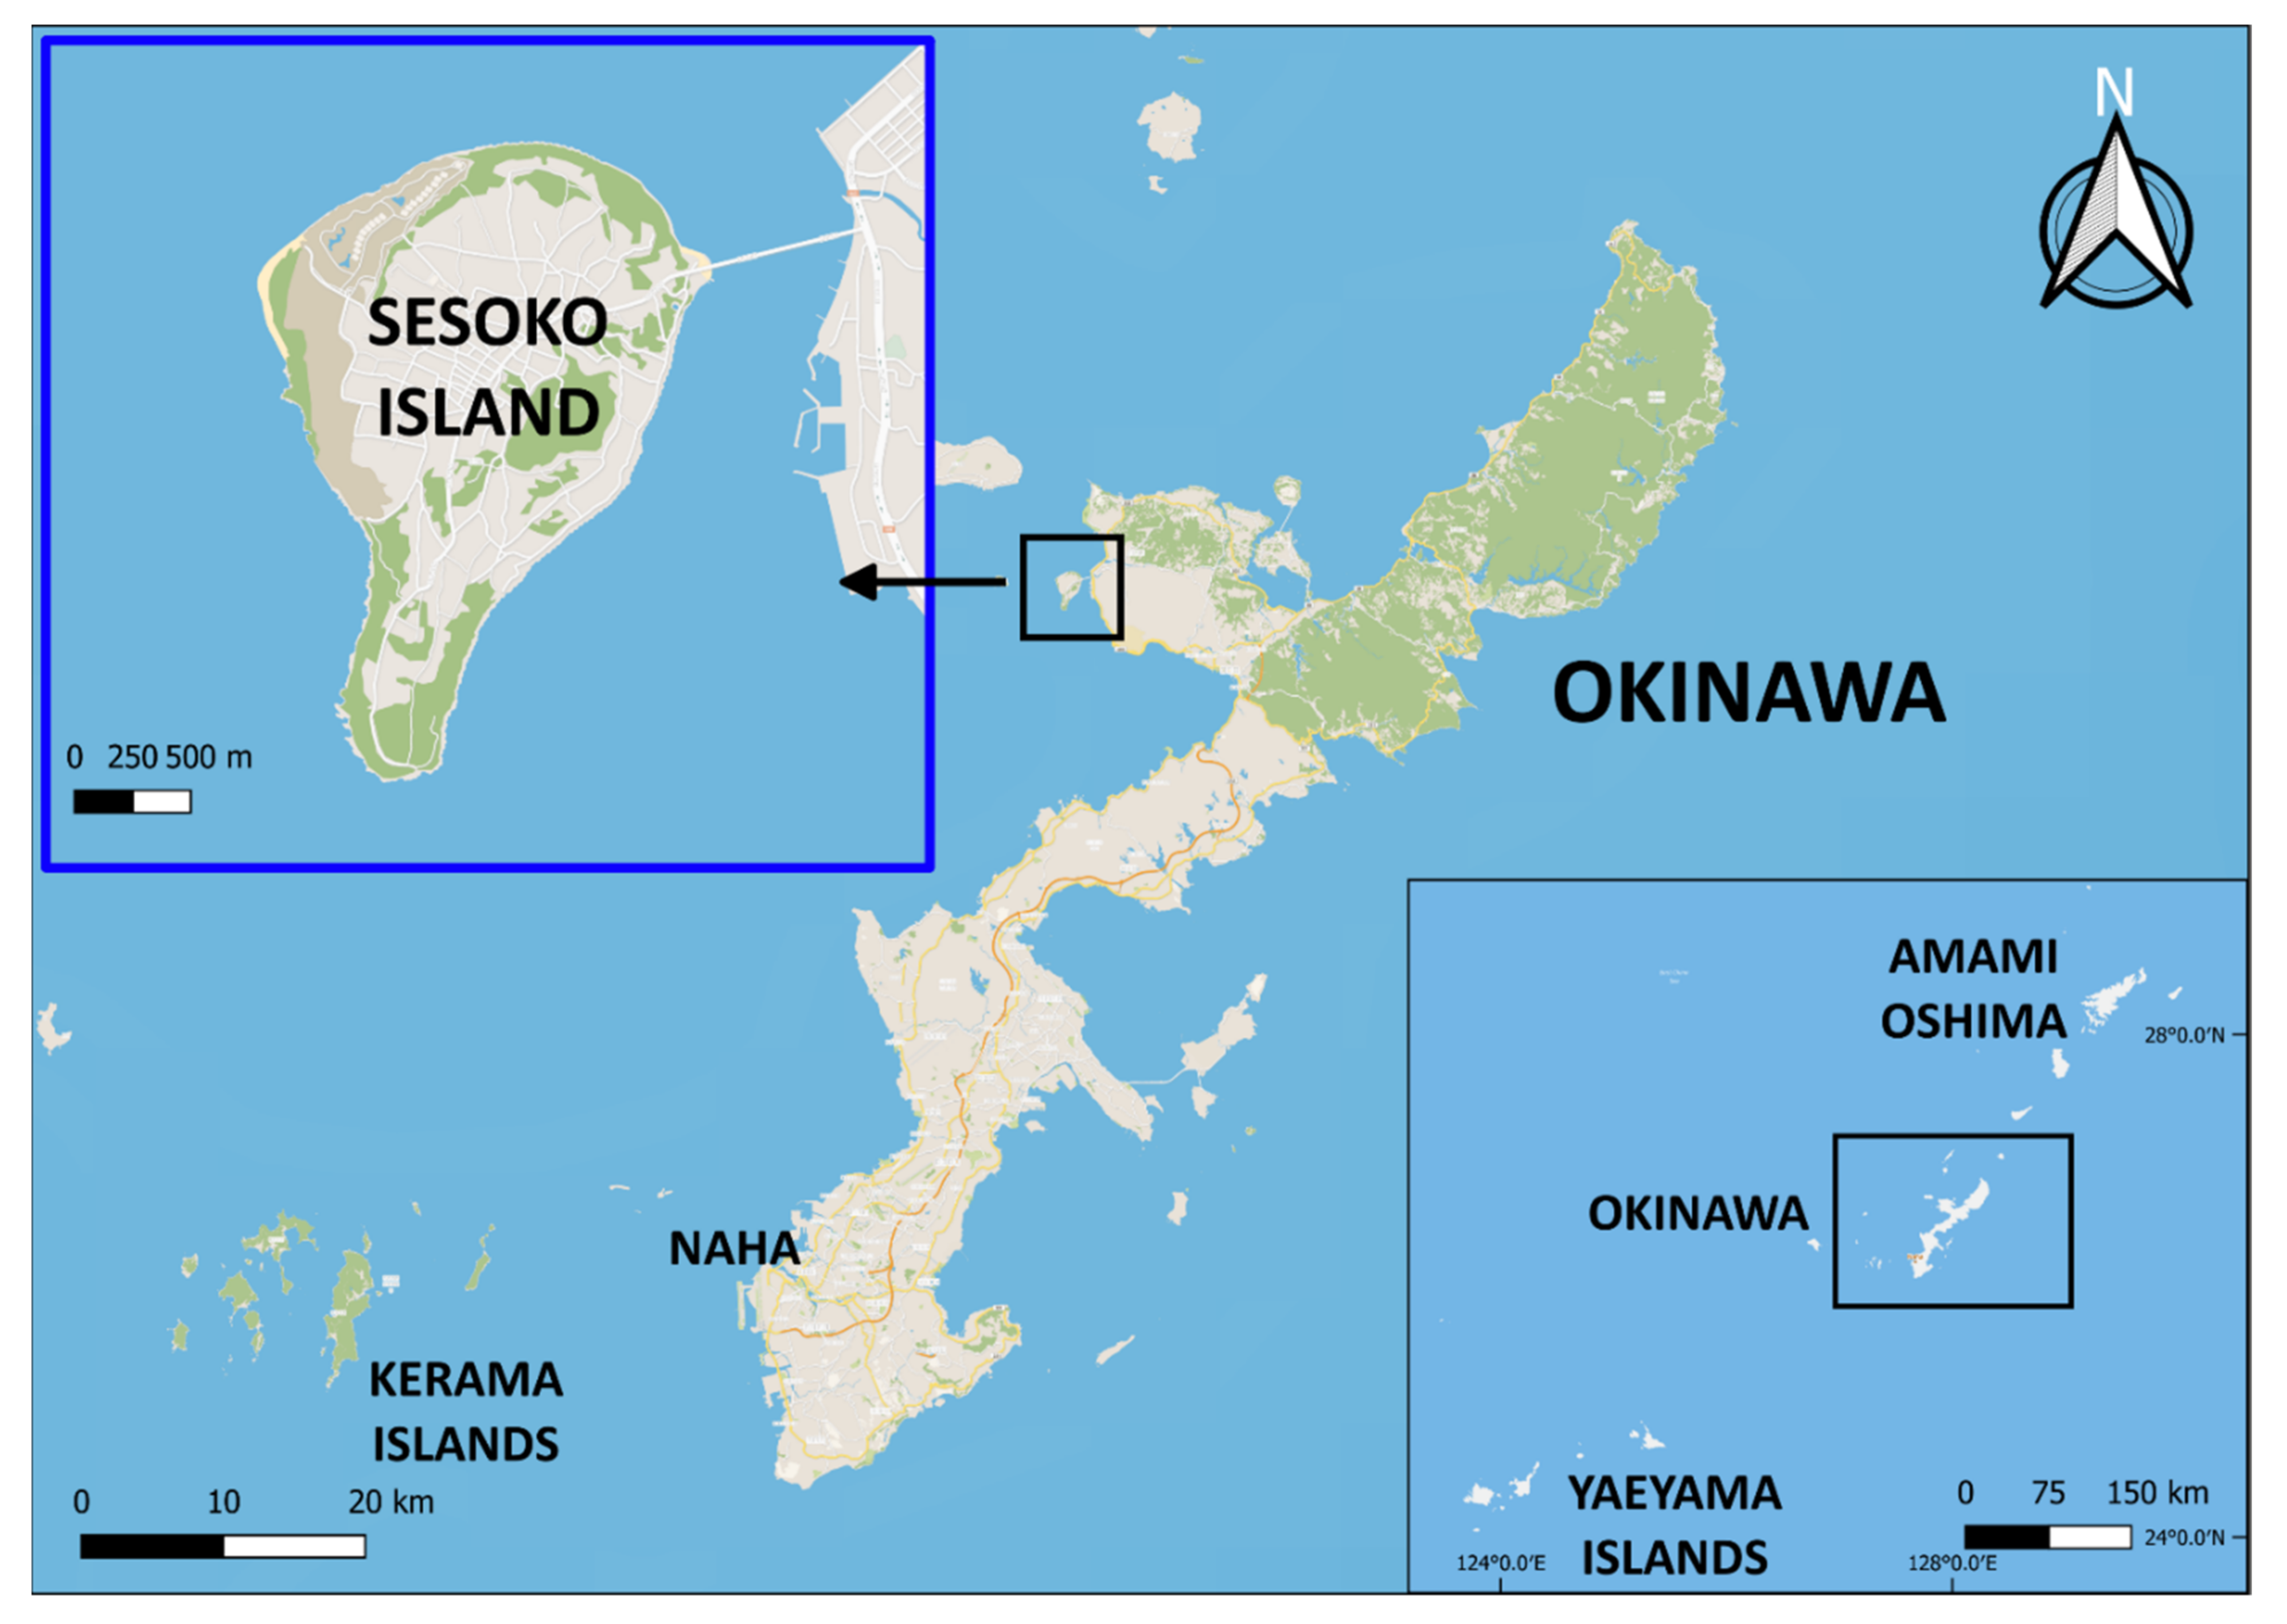
2.1. Study Area

The study area was on the southeastern reef around Sesoko Island (26°38′36.40″ N; 127°51′49.55″ E), located off the central western coast of Okinawajima Island (Figure 1). The reef is fringing and extends towards the southern tip of the island [53,54]. The reef edge generally extends out approximately 70–100 m from the coast but can reach up to 250–400 m in the south (Figure 1). Encrusting colonies of genus Montipora, the primary host of BBD and GAs in the Ryukyu Archipelago [3,5,55], are common on the reefs of Sesoko [3,22] as well as other corals, such as tabular Acropora [54], and massive/submassive Porites [56,57].

2.2. BBD and GAs Prevalence (2017–2020 Field Surveys) on Encrusting Montipora Colonies

To assess BBD and GAs prevalence, twelve stations were surveyed: eight nearshore (NS) and four at the reef edge (RE). The survey period was from June to October (summer to autumn) for four years, from 2017 to 2020. In 2017, only the NS sites were surveyed, while the four additional RE sites were surveyed from 2018 to 2020.
At each station for each survey, timed snorkeling surveys of approximately 30 min, or until the beginning of the next station, were conducted. The prevalence data were collected by the first author (R.R.D.) by using an underwater notebook, to remove observer bias throughout the study, and dive buddies took additional photographs. Our research focused on the encrusting form of genus Montipora, and during each annual study a total of >1500 colonies were surveyed.
Encrusting Montipora colonies were grouped into the following categories: (1) Healthy; (2) Dead; (3) Heavily bleached, or seriously damaged; (4) Pale and/or slightly damaged (5) with BBD; (6) with GAs; and (7) with both BBD and GAs (Table 1). Percentages of Montipora colonies with BBD and GAs were calculated as the total number of infected colonies/total colonies × 100 (see Table 1 and Table 2 for details).

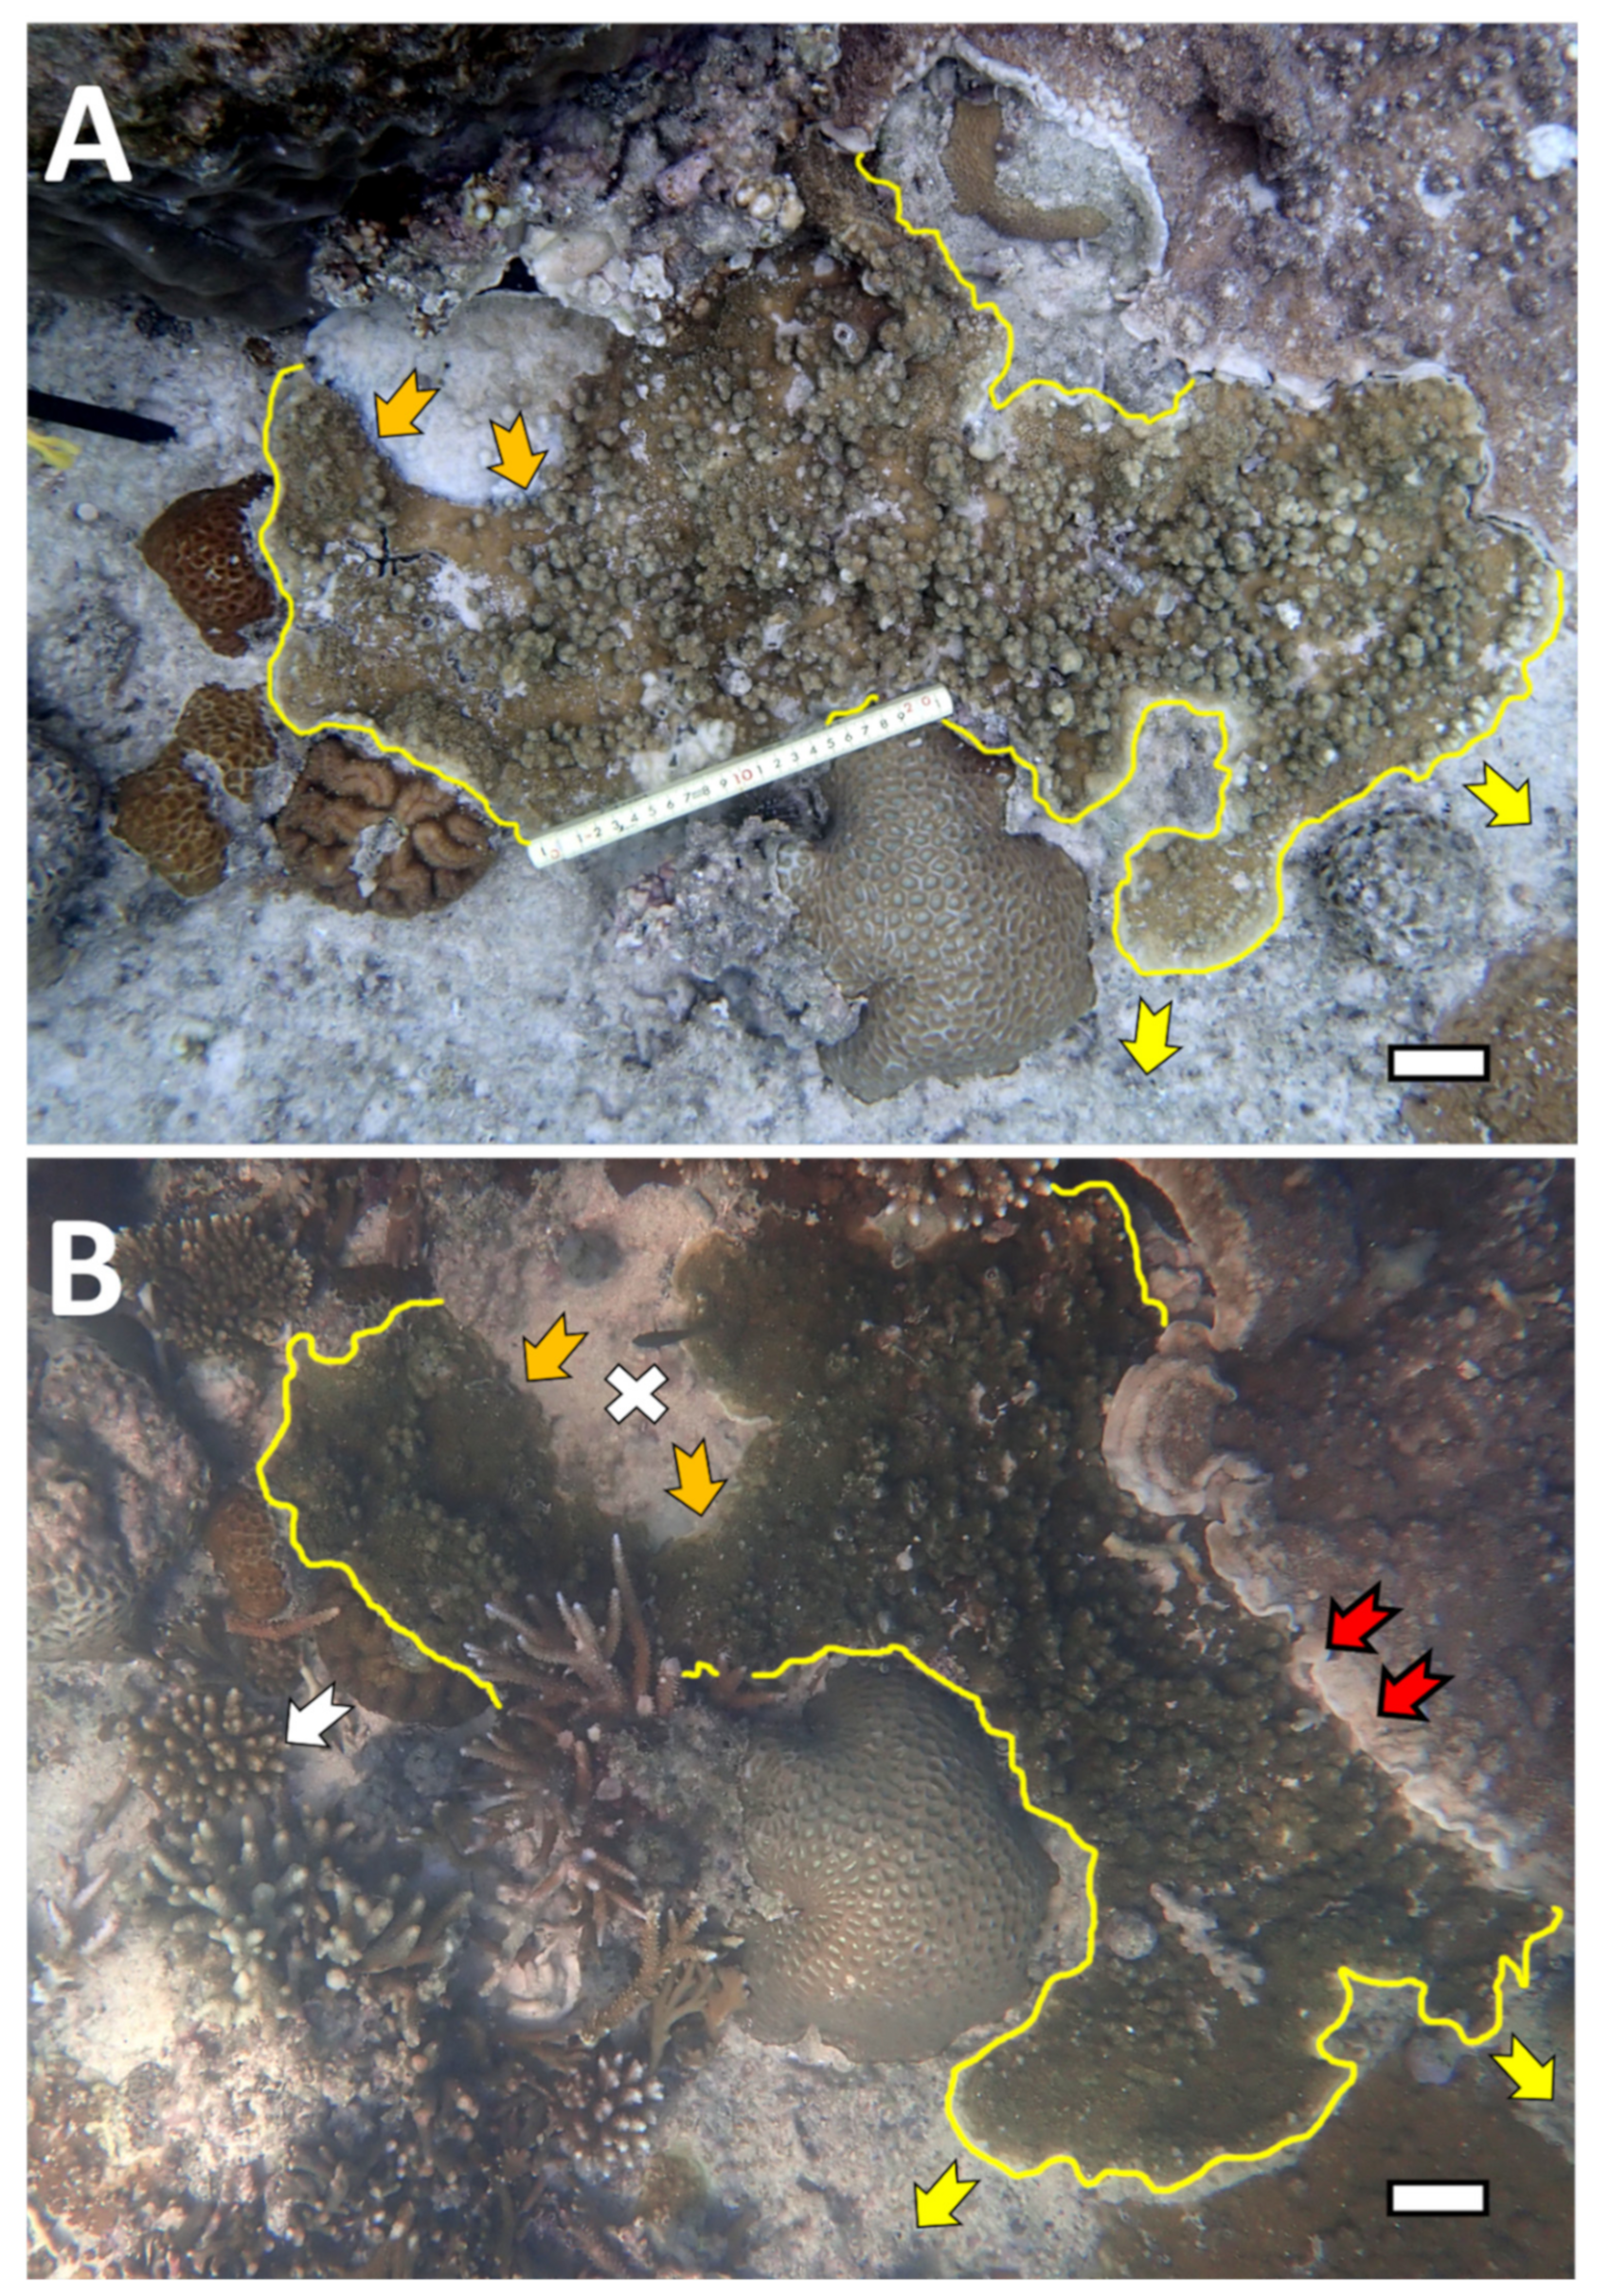
2.3. BBD Progression Rates

BBD data were collected from photographs of four permanent plots each of 3 × 3 m consisting of 9 × 1 m2 quadrats each (total = 36 m2) at Site S4 by co-first author H.W. (Figure 2) from 29 June to 27 December 2020, along with BBD-infected Montipora photographs from Site S6 (20–28 June; 29 June–27 July 2020) (Table 2). Infected colonies were tagged with numbers and nails for revisitation and the same location/plots were additionally marked using tags. Furthermore, an aerial image of the site was obtained with a drone (Figure 2). These plots contained a total of approximately 100 Montipora colonies. Montipora colonies infected with BBD were photographed with a 1-m folding scale. Observations were made every 3–15 days (avg. 6.6 days). Colonies were selected randomly based on BBD incidence. The colonies were then revisited, and photographs of each colony were then measured to understand BBD band progression via open-sourced Image-J software, Version 1 [14].

2.4. Montipora Colony Counts and Coverage

Surveys to examine densities of encrusting Montipora were conducted in summer 2020. Quadrats of 1 m2 (total = 341) were haphazardly placed and photographed at sites S6 + S11 (n = 92) (NS + RE), S12 (n = 94) (RE), and S4 (n = 155) (NS), and the colonies in each quadrat were counted. To assess the percent coverage, quadrat images were analyzed using Coral Net software (https://coralnet.ucsd.edu/, accessed 1 April 2021) by assigning 100 randomly generated points per quadrat [59].

2.5. Statistical Analyses

The alpha level was set at 0.05 for all tests. The non-parametric Pearson’s Chi-squared test was used to test independence between row variables (Sites) and column variables (BBD, GAs, healthy colonies). The effects of sites, years, and host colony abundance were tested on the differences in the probability of the BBD and GAs occurrence and were tested using a Generalized Linear Model (GLM) with the binomial family of distribution and a logit link function. Disease occurrence (BBD or GAs) was treated as the response variable, while “Site”, “Year” and the interaction between “Site” and “Year” and host colony count were treated as the explanatory variables. Disease occurrence was a binary variable, i.e., if a colony had the disease, it was assigned the value of 1 and if it did not have a disease, it was assigned as 0. Separate tests were done for NS sites (S1–S8) and RE sites (S9–S12). Further likelihood ratio tests were carried out on the GLM models to test for the significance of each variable (Electronic Supplementary Material Table S1). If any of the terms were not significant, they were removed from the final model. Post-hoc tests were performed to test for significant differences among groups by comparing least-square means with the Holm adjustment method.
Spearman’s rank correlation was conducted to assess the relationship between BBD progression along with sea water temperature (Figure S3). A Kruskal-Wallis (H) test, which does not require equal variances, was performed by grouping BBD progression against different levels of temperature low (L) (up to 26.9 °C); medium (M) (27.0 to 27.9 °C); high (H) (28.0 to 28.9 °C); very high (VH) (29.0 to 29.9 °C) and maximum (Max) (30.0 °C and higher) followed by a Mann-Whitney U test [60] to check which temperature group significantly affected BBD progression. Mean number of GAs per colony were compared with previously published literature from the same study area, [3]. All Statistical analyses and data were handled using R (version 4.0.3), Spatio-temporal variations in disease prevalence were analyzed in using the “stats” package [61], for the binomial GLM, the “car” package [62], for likelihood ratio tests and the “emmeans” package for the post-hoc tests [63]. Additional correlation analyses and handling of data were performed in IBM SPSS 23 (IBM Corp. Released 2015. IBM SPSS Statistics for Windows, Version 23.0. IBM Corp., Armonk, NY, USA) and Microsoft Excel (version. 16.48).

2.6. Environmental Parameters

2.6.1. In-Situ Data

In order to measure the water temperature and light levels at the survey site, three loggers (HOBO Water Temp Pro V2; HOBO Pendant temp/light, Onset Co., Cape Cod, Bourne, MA, USA) were installed within the survey area at NS (Site 6 n = 1, Site S4 n = 1 logger, 0 to 1 m depth) and RE (Site 11, n = 1, 1.5 to 2.5 m) (Figure 2) and were calibrated to take hourly measurements from 2017 to 2020 during survey periods, and all daily means were calculated for 2017 to 2020. In-situ light sensors in the loggers were cleaned weekly in 2017–2018. In addition, another logger (HOBO Pendant temp/light, Onset Co., Cape Cod, Bourne, MA, USA) was installed outdoors at the Sesoko Station (University of the Ryukyus) calibrated to take hourly light measurements (for 2020). The light data were converted into µmol m−2 s−1 (https://www.apogeeinstruments.com/conversion-ppfd-to-lux/, accessed 1 September 2021). As recent reports have suggested high thermal exposure in these sites [64], the maximum monthly mean and bleaching thresholds for in-situ data were calculated following protocols of Coral Reef Watch [65] (Figure 3).

2.6.2. Publicly Available Japanese Meteorological Association (JMA) Data

To understand the other environmental parameters in association with BBD and GAs, monthly total sunshine duration data (June to December) obtained from automated weather stations in Nago (~12 km from Sesoko Island), and monthly mean solar radiation data (June to December) obtained from the regional weather station in Naha (https://www.data.jma.go.jp/obd/stats/data/en/smp/index.html, accessed 1 September 2021). For the UV index assessment, a daily one-hour integrated value of maximum UV radiation (MJ/m2) from an area of 20 km2 was extrapolated and converted into monthly means for assessing the UV index over the examined reef area around Sesoko. Precipitation and typhoon data for analyses with BBD progression for 2020 was obtained from JMA (Figure 4).

2.7. Types of Data Collected

Please see the types of data collected via the Table 2.

3. Results

Overall, from 2017 to 2020, a total of 11,500 encrusting Montipora colony observations were conducted across 12 sites, of which 9722 colonies were healthy and 1778 were unhealthy (falling within any other group except healthy). Among the unhealthy colonies, we recorded the presence of 488 heavily damaged colonies (2017 = 0; 2018 = 180; 2019 = 289; 2020 = 19) and 237 slightly damaged colonies (2017 = 83; 2018 = 21; 2019 = 132; 2020 = 1). Approximately 6.2% (n = 714) of the colonies were infected with BBD (Table S2), 2.4% with GAs (n = 276) (Table S3), and 0.04% with both diseases (n = 5). The Pearson’s Chi-squared test highlighted how the relation between variables (sites and categories: BBD; GA; BBD + GA; Healthy) was significant, (χ2 = 485.8, df = 33, p < 0.001, Figure 5).

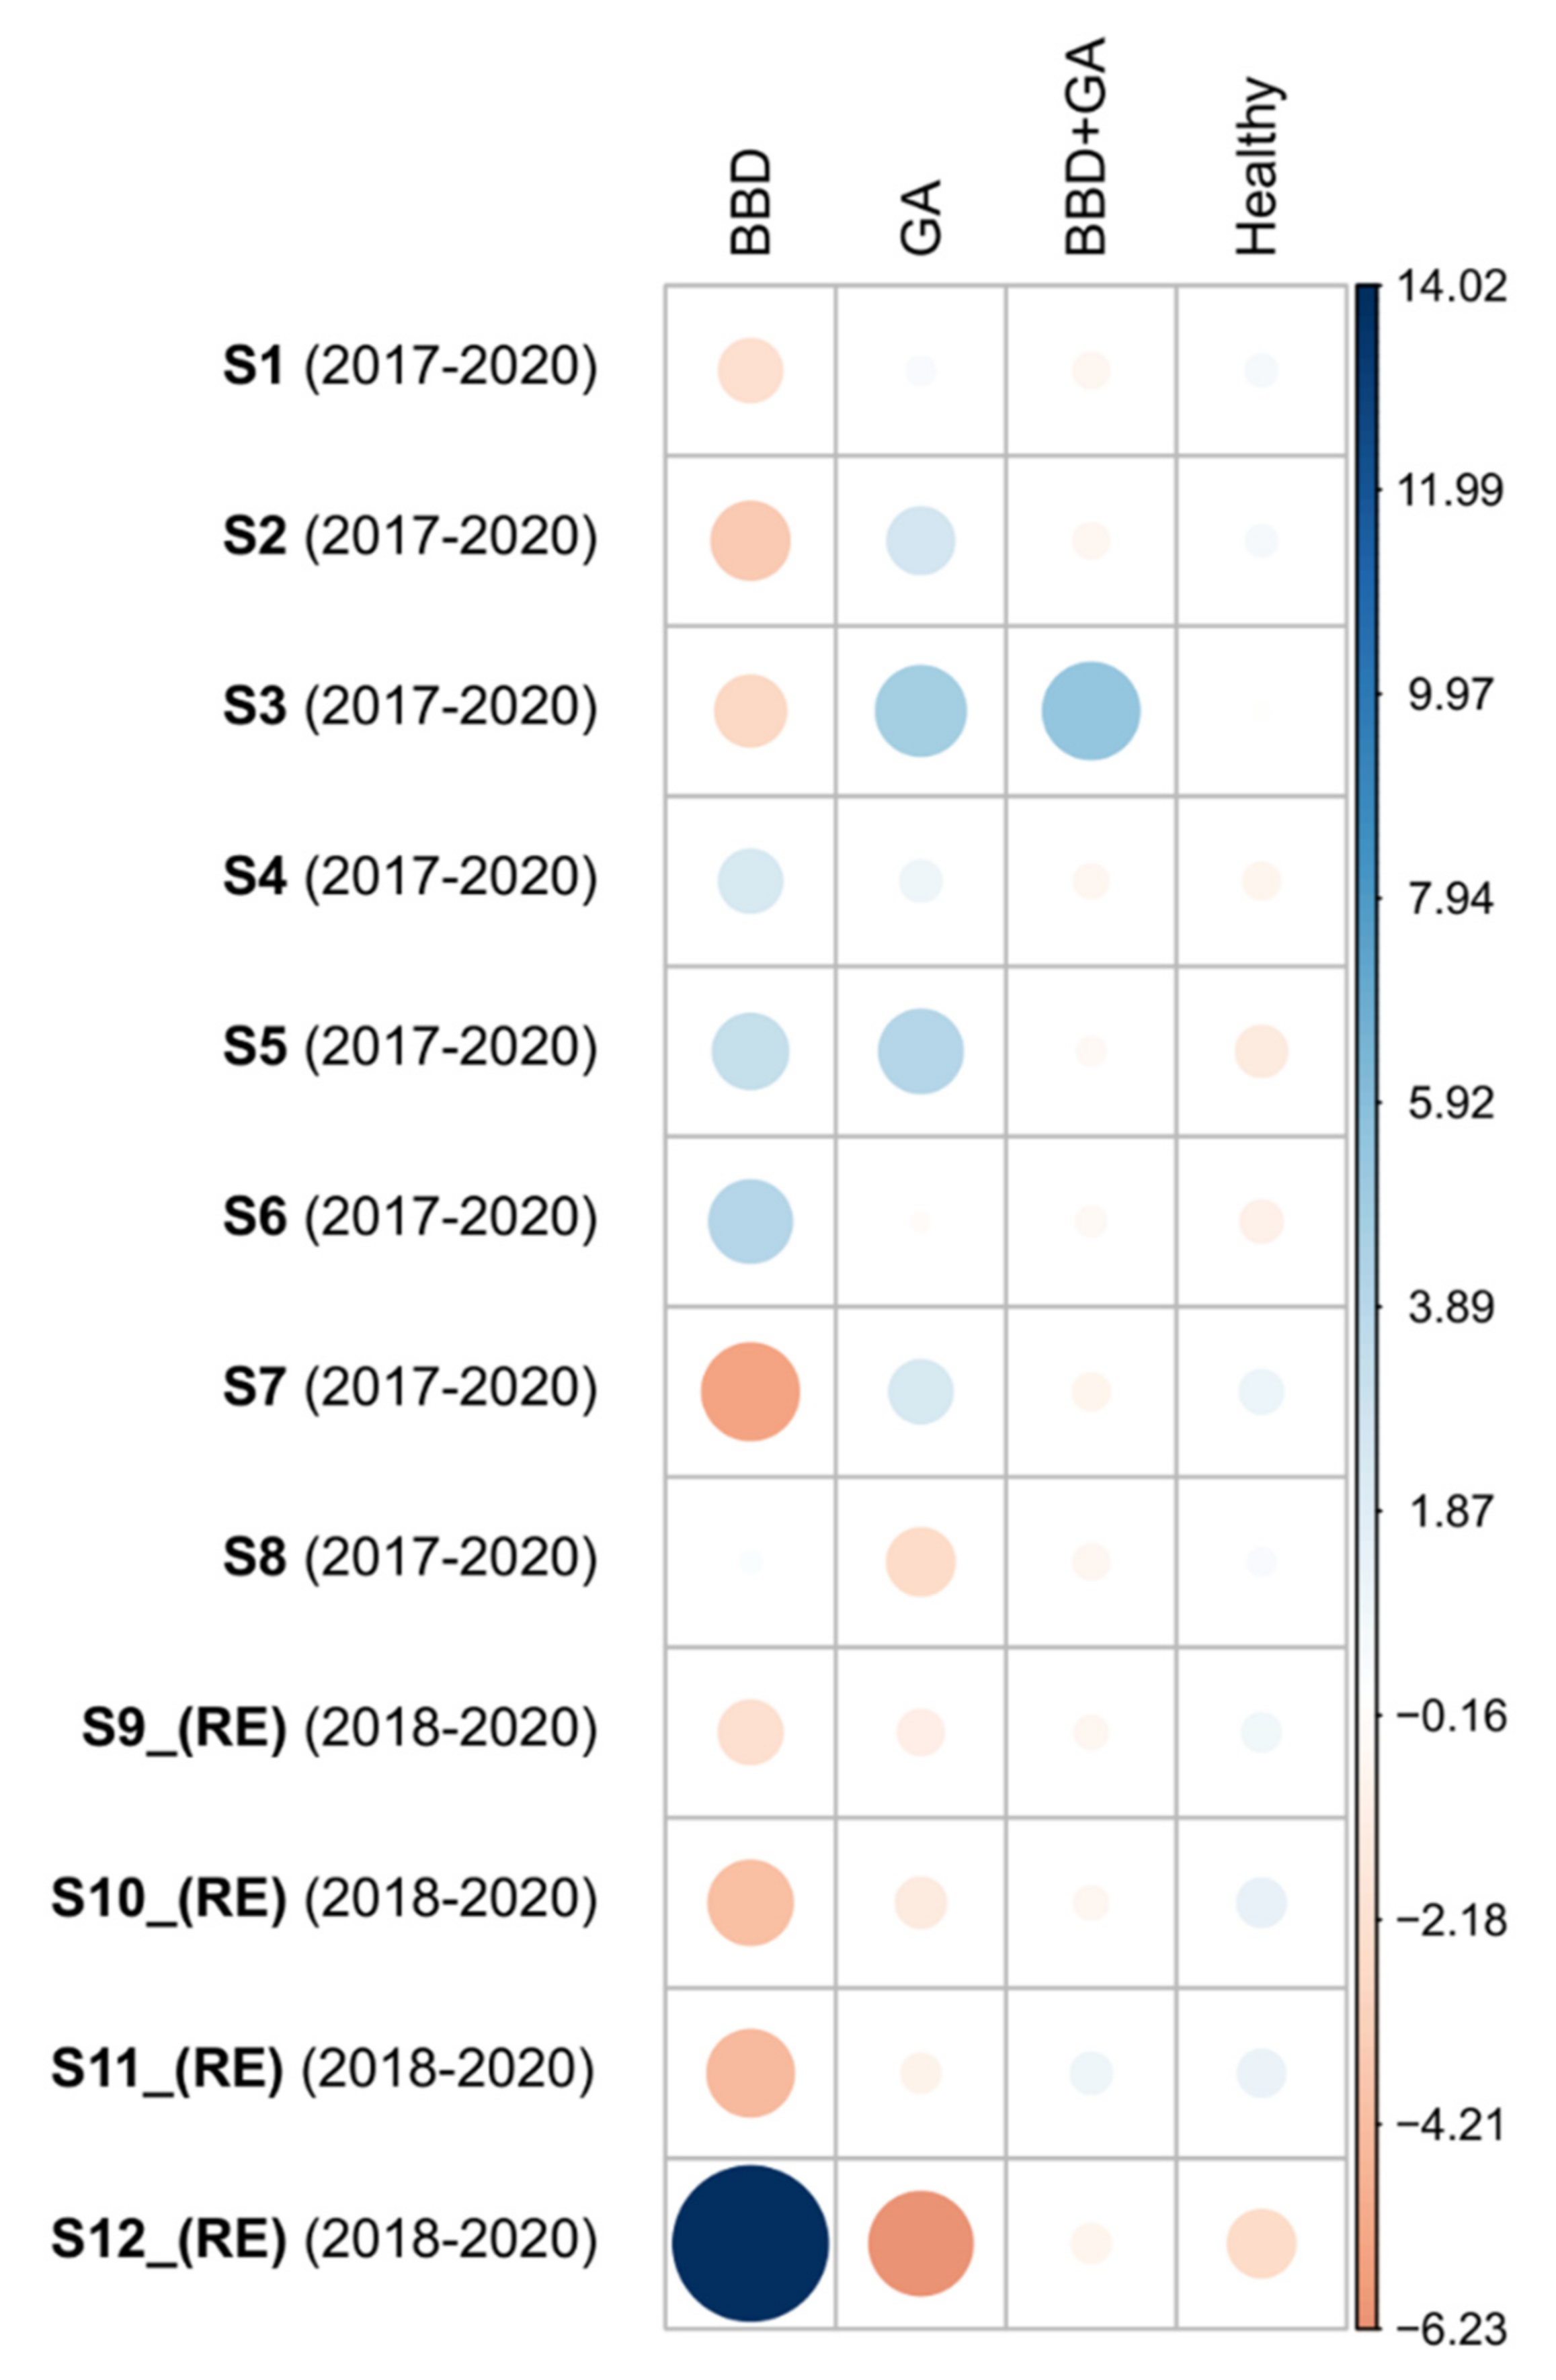
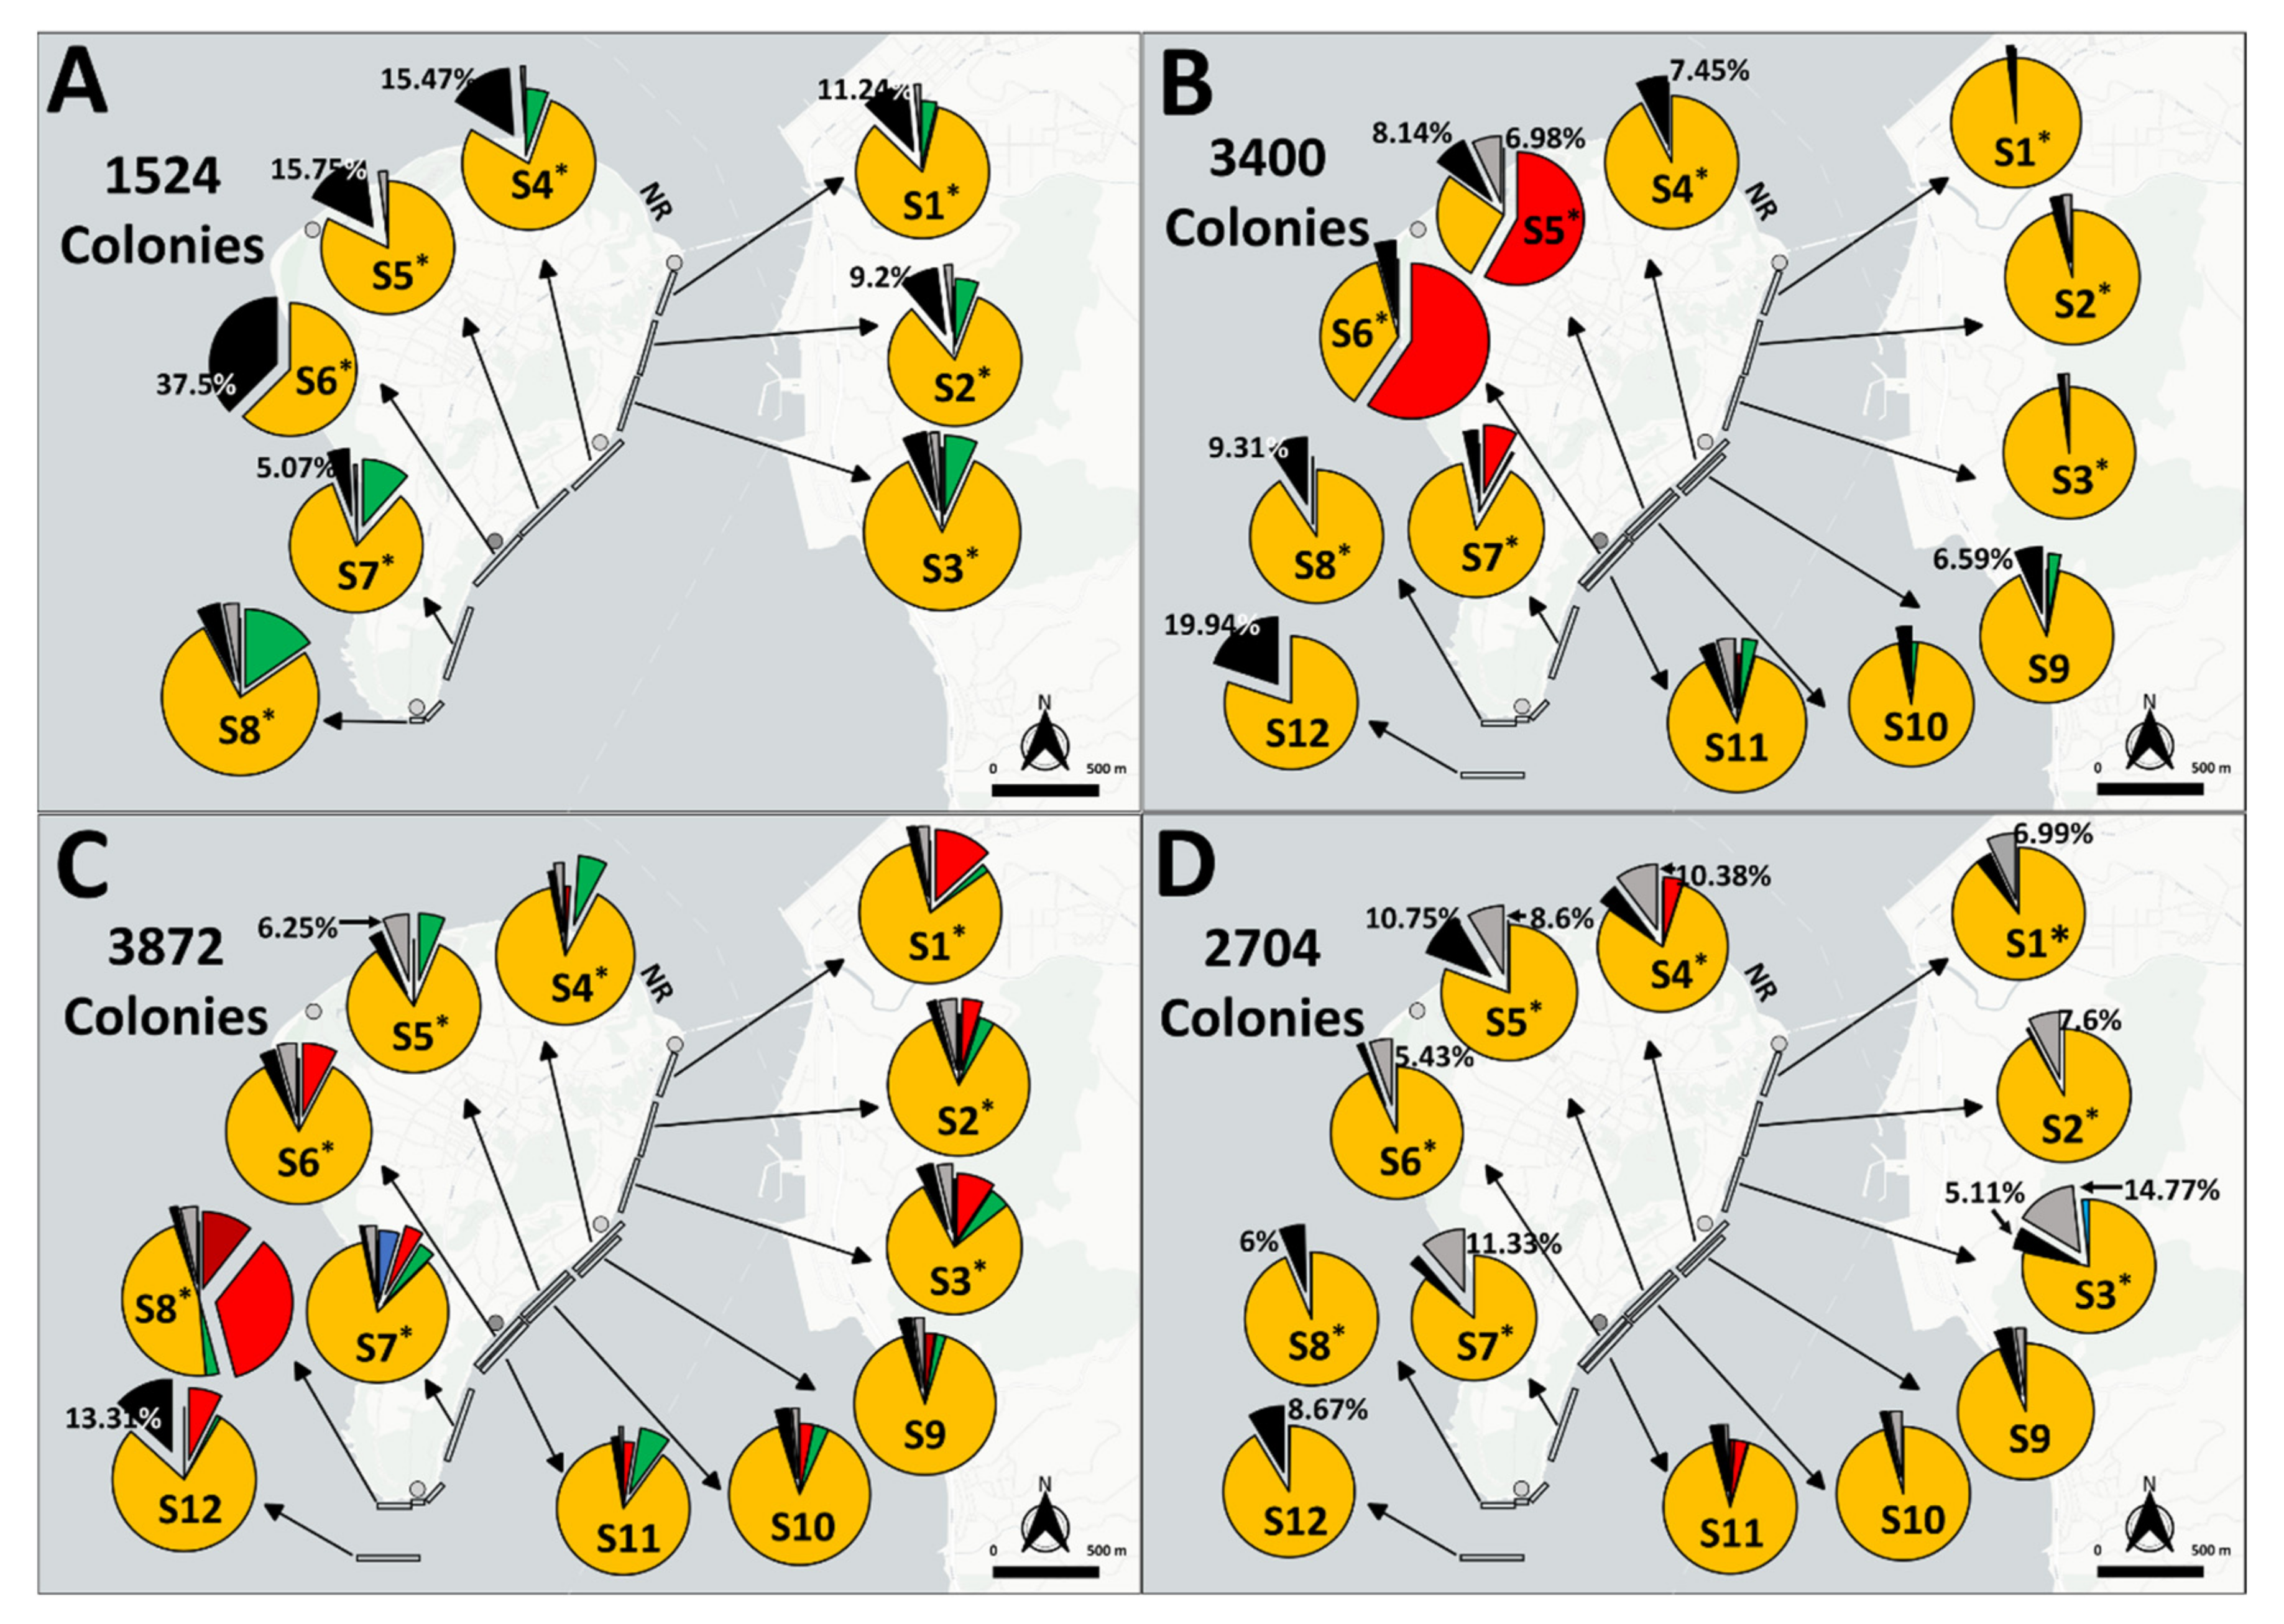
3.1. BBD Prevalences

Temporal and spatial variation of BBD in the NS sites: Temporal variations in the probability of BBD occurrence were site-specific for the near-shore sites, i.e., the interaction between the variables “Site” and “Year” was significant (χ2 = 88.4, df = 21, p < 0.0001) (Table S1). Several sites in 2017, showed an outbreak level prevalence of BBD (>5%), with 12.07% of colonies (184/1524 colonies; Figure 6) being infected with BBD in all sites. The probability of BBD occurrence was significantly higher in 2017 at sites S1 (S1 in 2017 = 11.24%; 30/267) (pairwise adjusted p from <0.0001 to 0.03), S2 (S2 in 2017 = 5.47%; 23/250) (pairwise adjusted p from 0.004 to 0.02), S4 (S4 in 2017 = 15.47%; 43/278) (pairwise adjusted p from 0.001 to 0.03), and S6 (S6 in 2017 = 37.50%; 42/112) (pairwise adjusted p from <0.0001) than those in other years (2018–2020) (Table S4). For the NS sites S7, differences were only seen between 2017 and 2019 (pairwise adjusted p = 0.01) and between 2018 and 2019 (pairwise adjusted p = 0.04) as well as for site S8 between 2018 and 2019 (pairwise adjusted p = 0.003) but not between 2019 and 2020 (pairwise adjusted p = 0.07) (Table S4). Temporal variation in the probability of BBD occurrence were not significant at site S3 for any year. Significant spatial variations in the probability of BBD occurrence were observed only in 2017 and 2018. In 2017, the probability of BBD occurrence was significantly higher at site S6 (S6 in 2017 = 37.50%) than at other sites (pairwise adjusted p from <0.0001 to 0.002) (Table S5). In 2018, the probability of BBD occurrence was significantly higher at site S8 (S8 in 2018 = 9.31%; 42/451) than at sites S1 (1.67%; 4/239), S2 (2.28%; 7/307), and S7 (3.34; 13/389) (pairwise adjusted p from 0.01 to 0.02) (Table S5).
Temporal and spatial variation of BBD in the RE sites: Significant temporal and spatial variation in probability of BBD occurrence were observed for the reef edge sites (χ2 = 26.2 and 173.3, df = 3 and 2, p < 0.0001) (Table S1). However, the interaction between the variables “Site” and “Year” was not significant for these sites (χ2 = 6.7, df = 6, p = 0.3). The probability of BBD occurrence was significantly higher in the year 2018 (7.59%; 258/3400; Figure 6) than in other years at all sites (pairwise adjusted p from <0.0001 to 0.0005) (Table S6). The probability of BBD occurrence was significantly higher at RE site S12 (S12 in 2018 = 19.94% Figure 7; S12 in 2019 = 13.31%; S12 in 2020 = 8.67%) than other sites for all years (pairwise adjusted p < 0.0001) (Table S6).
Over the course of our surveys, BBD was also observed on foliose and branching Montipora, Acropora hyacinthus sp. complex (Figure S1), Acropora cytherea, and Gardineroseris planulata (Figure S2). The observation of BBD on genus Gardineroseris represents the first report of BBD on this species from the Pacific Ocean and had been previously only reported from the Red Sea [67], and the Indian Ocean (Maldives) [68].

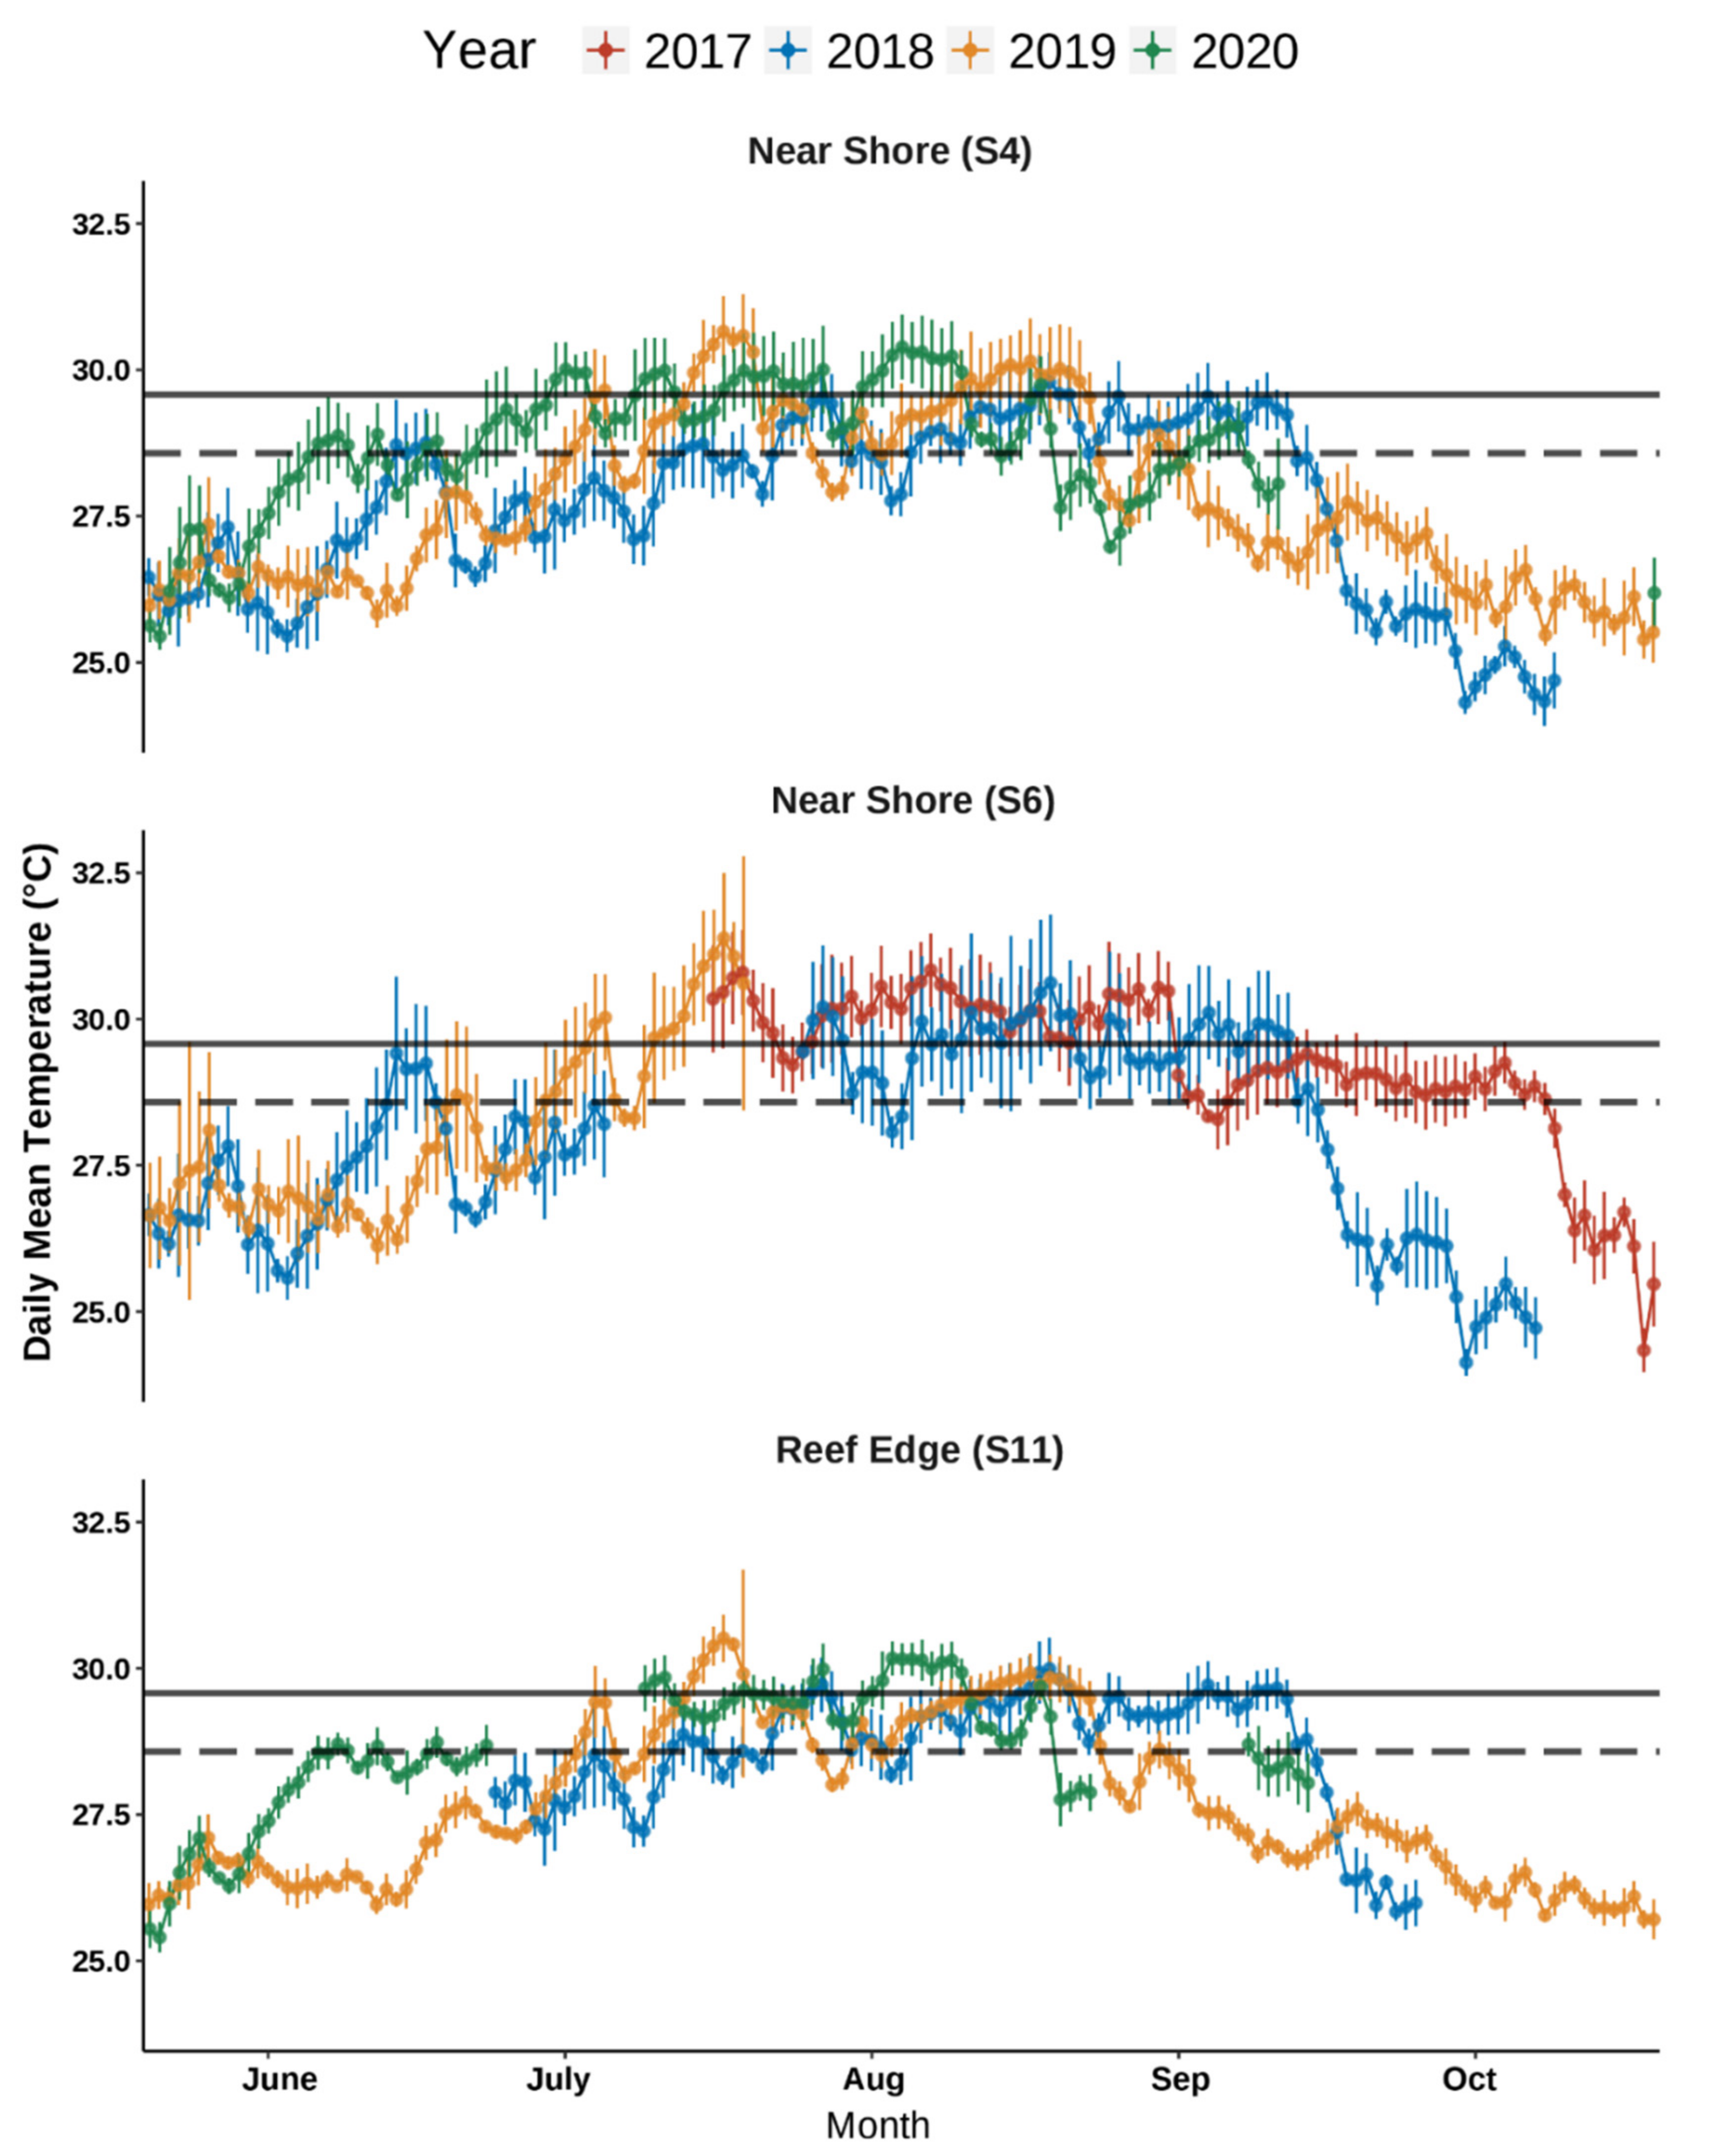
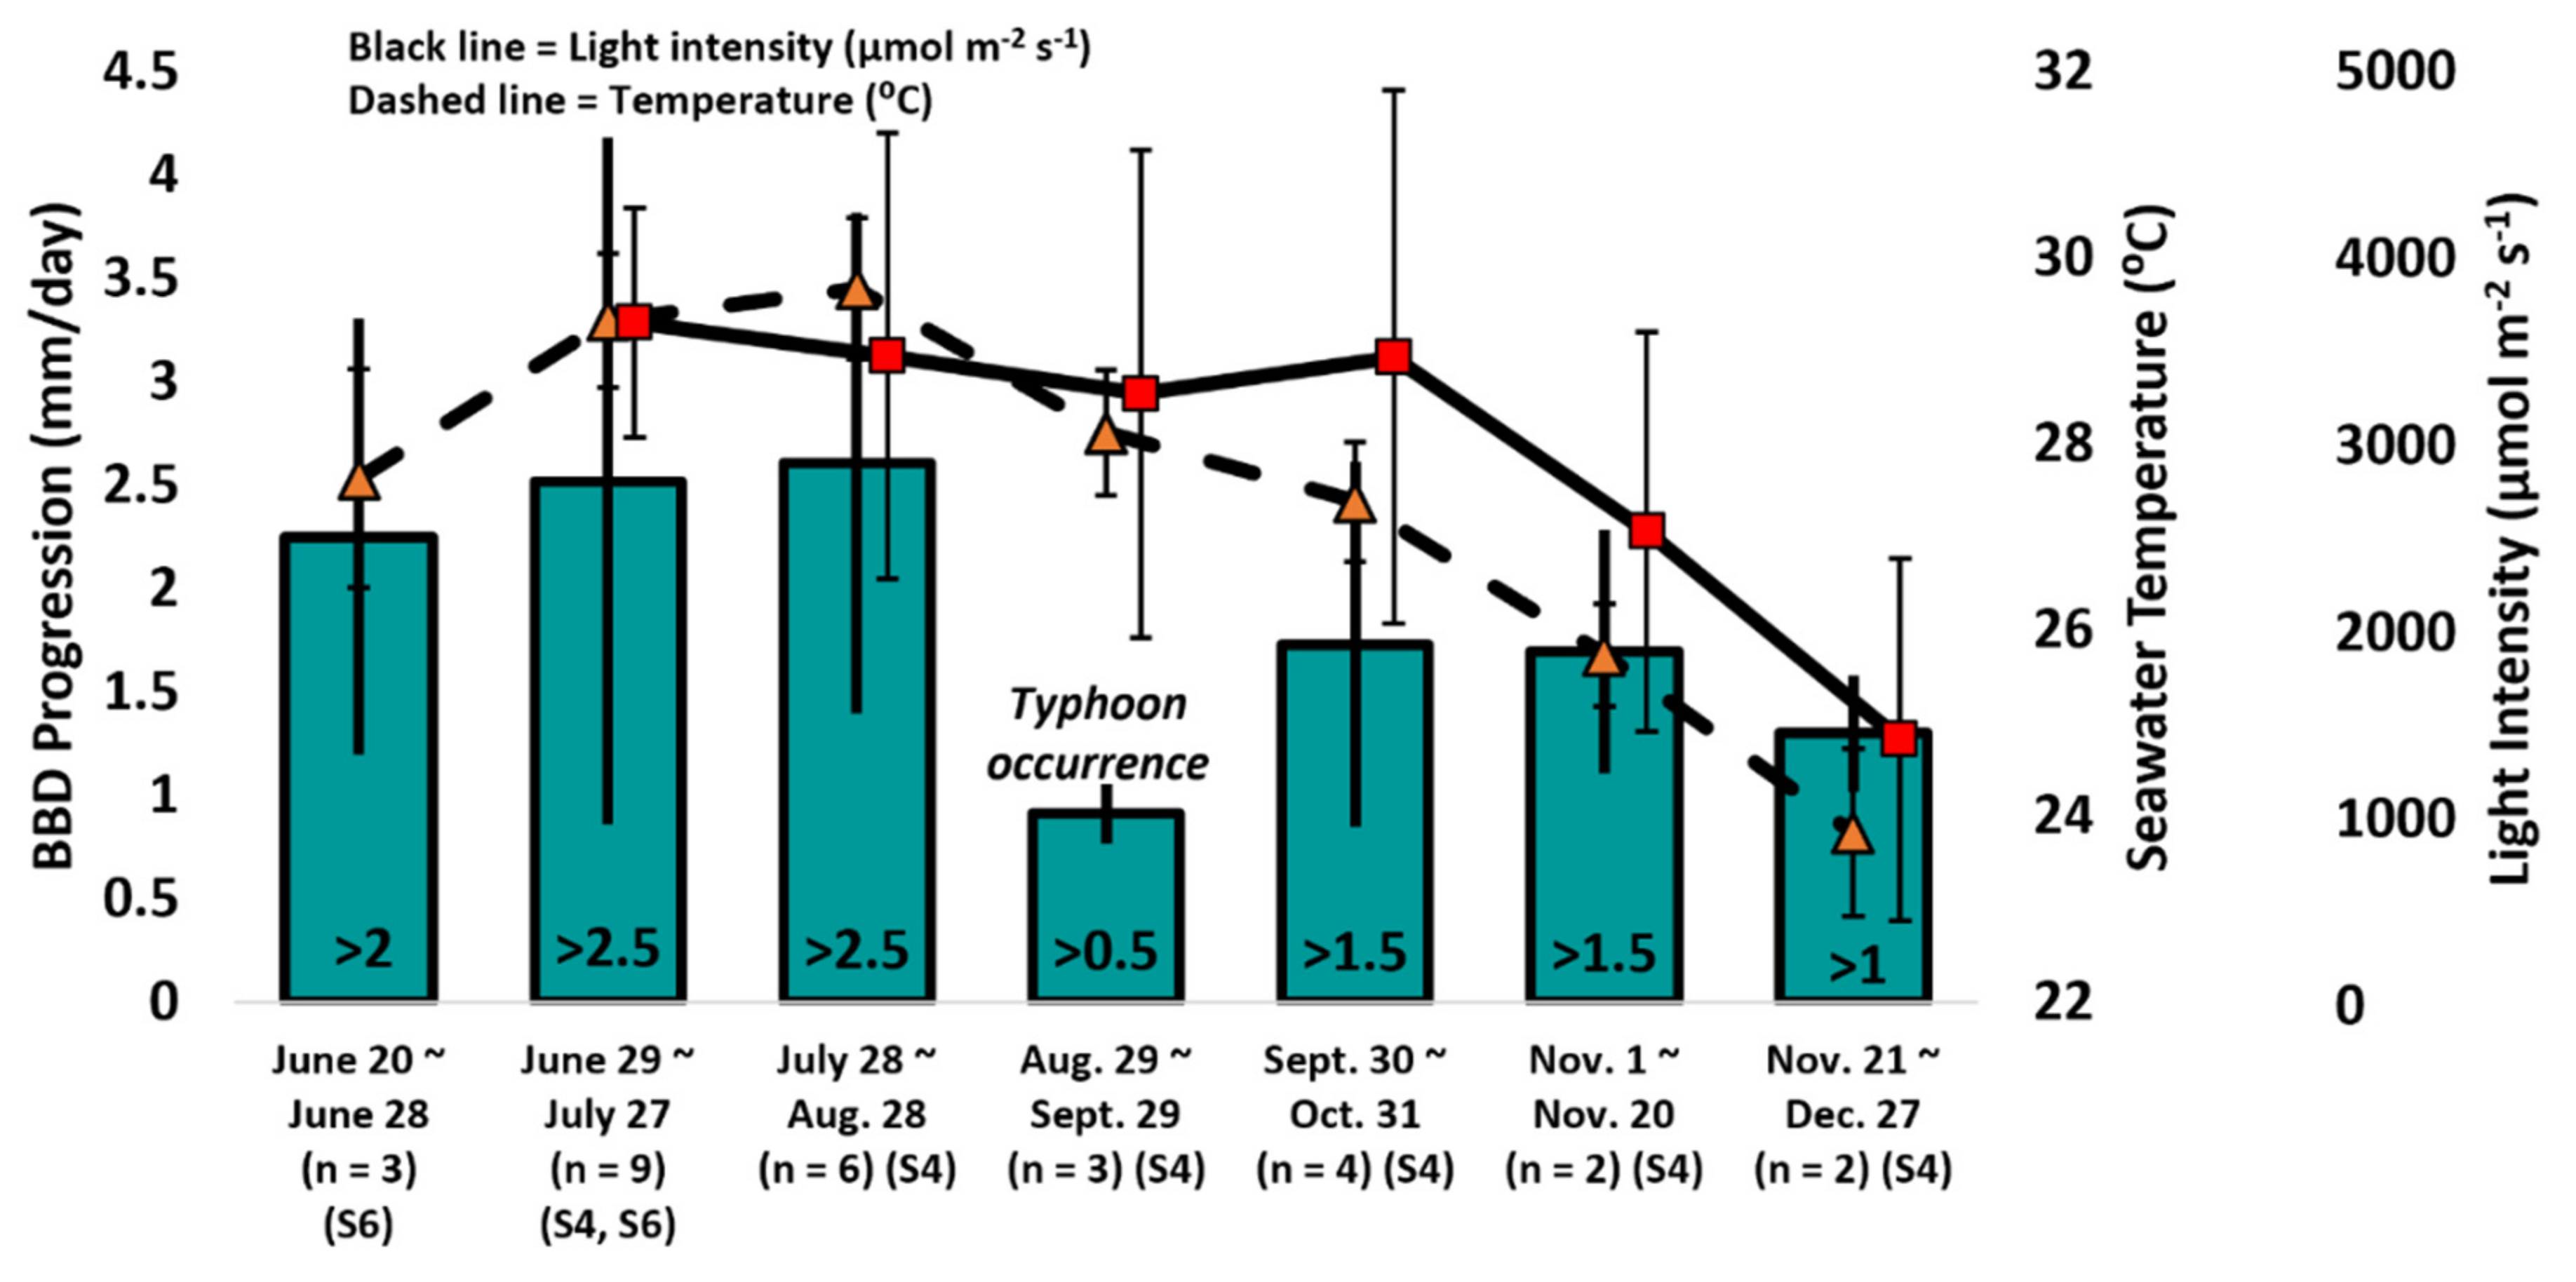
3.2. BBD Progression and Seawater Temperatures

Recurrent monitoring of progression rates at the same site during 2020 was performed during the period from 29 June until 27 December 2020, with an average difference between two observations being 6.6 days. The results showed BBD progression rates (mm/day) varying from June to December correlating with seawater temperatures (Figure 8). Kruskal Wallis test revealed the relationship between variables as significant (χ2 = 14.805, df = 4, p < 0.01). Mann-Whitney post-hoc tests further showed significance between H vs. VH (28 °C vs. 29 °C) (p < 0.01) and H vs. Max (28 °C vs. >30 °C) (p < 0.01). Further, BBD progression along with light intensity did not provide any significant correlation (Figure 8). A Montipora colony that was exclusively monitored for over two years at site S7 survived BBD infection and continued its growth (Figure 9). During the assessment of BBD progression, approximately one month before the appearance of BBD, BBD-like characters could be observed on some encrusting Montipora colonies.

3.3. GAs Prevalence

Temporal and spatial variation of GAs in NS sites: Temporal variations in probability of GA occurrence were site-specific for the near-shore sites, i.e., the interaction between the variables “Site” and “Year” was significant (χ2 = 66.2, df = 21, p < 0.0001) (Table S1). The probability of GA occurrence was significantly higher in the year 2020 than in all other years (2018–2020) but only at site S3 (S3 in 2020 = 14.77%; 26/176) (pairwise adjusted p from 0.0001 to 0.001). The probability of GAs occurrence was significantly higher in 2020 than those in 2017 and 2019 at sites S4 (S4 in 2020 = 10.38%; 19/183) (pairwise adjusted p from 0.001 to 0.02) and S7 (S7 in 2020 = 11.33%; 29/256) (pairwise adjusted p from 0.0004 to 0.04) (Table S7). The probability of GA occurrence was significantly higher in 2020 than those in 2017 (Overall in 2017 = 1.51%; 23/1524 colonies; S1 in 2017 = 1.5%; 4/267) and 2018 at site S1 (S1 in 2018 = 0.42%; 1/239) (pairwise adjusted p = 0.03). At sites S2, S5, S6, and S8 the probability of GA occurrence did not vary significantly among years (pairwise adjusted p from 0.05 to 1.00) (Table S7). Significant spatial variation in the probability of GA occurrence was observed only in 2020, where the probability of GA occurrence at site S8 (S8 in 2020 = 0.33%; 1/300) was significantly lower than those at sites S3 (S3 in 2020 = 14.77; 26/176), S4 (S4 in 2020 = 10.38%; 19/183), S5 (S5 in 2020 = 8.6%; 8/93) and S7 (S7 in 2020 = 11.33%; 29/256) (pairwise adjusted p from 0.004 to 0.02) (Table S8). GA occurred in 4.94% of colonies (133/2704 colonies, Figure 6) overall in 2020.
Temporal and spatial variation of GAs in RE sites: Temporal variations in probability of GA occurrence were site-specific for the reef-edge sites, i.e., the interaction between the variables “Site” and “Year” was significant (χ2 = 20.7, df = 6, p = 0.002) (Table S1). Significant temporal variations in the probability of GA occurrence were observed only at site S11, where the probability of GA occurrence was significantly higher in 2018 (S11 in 2018 = 4.17%; 12/288) compared to those in 2019 (S11 in 2019 = 0.89%; 3/337) (pairwise adjusted p = 0.046) (Table S7). The probability of GAs occurrence did not vary significantly among sites throughout the study period (pairwise adjusted p from 0.15 to 1.00) (Table S8). Site S12 where repeated outbreaks of BBD were observed (Figure 7), did not have any occurrence of GAs. Spatial variation was only observed in NS site S8 with S3, S4 and S7 in 2020 (Pairwise adjusted p from 0.004 to 0.02) (Table S8). RE sites were however not spatially significant in any of the years assessed (Table S8).
Comorbidity and GAs on other corals: Counts of GAs over the surface of encrusting Montipora colonies ranged from 0 to 32 GAs per colony (mean 6.5 ± 6.8 GAs/colony), with the GAs area ranging from a minimum of 0.81 to a maximum of 85.35 cm2 (mean 19.13 ± 19.54 cm2, n = 48). During surveys, GAs was also observed on foliose Montipora sp., Porites sp., Favites sp., and Cyphastrea sp. Comorbidity of BBD + GAs was a relatively rare occurrence (n = 5 for the entire study; Figure 10), with the highest prevalence at S3 in 2020 (n = 3/176); 1.71%; Figure 5 and Figure 6). Over the course of this study, no episode of mortality of encrusting Montipora colonies was observed due to GAs.

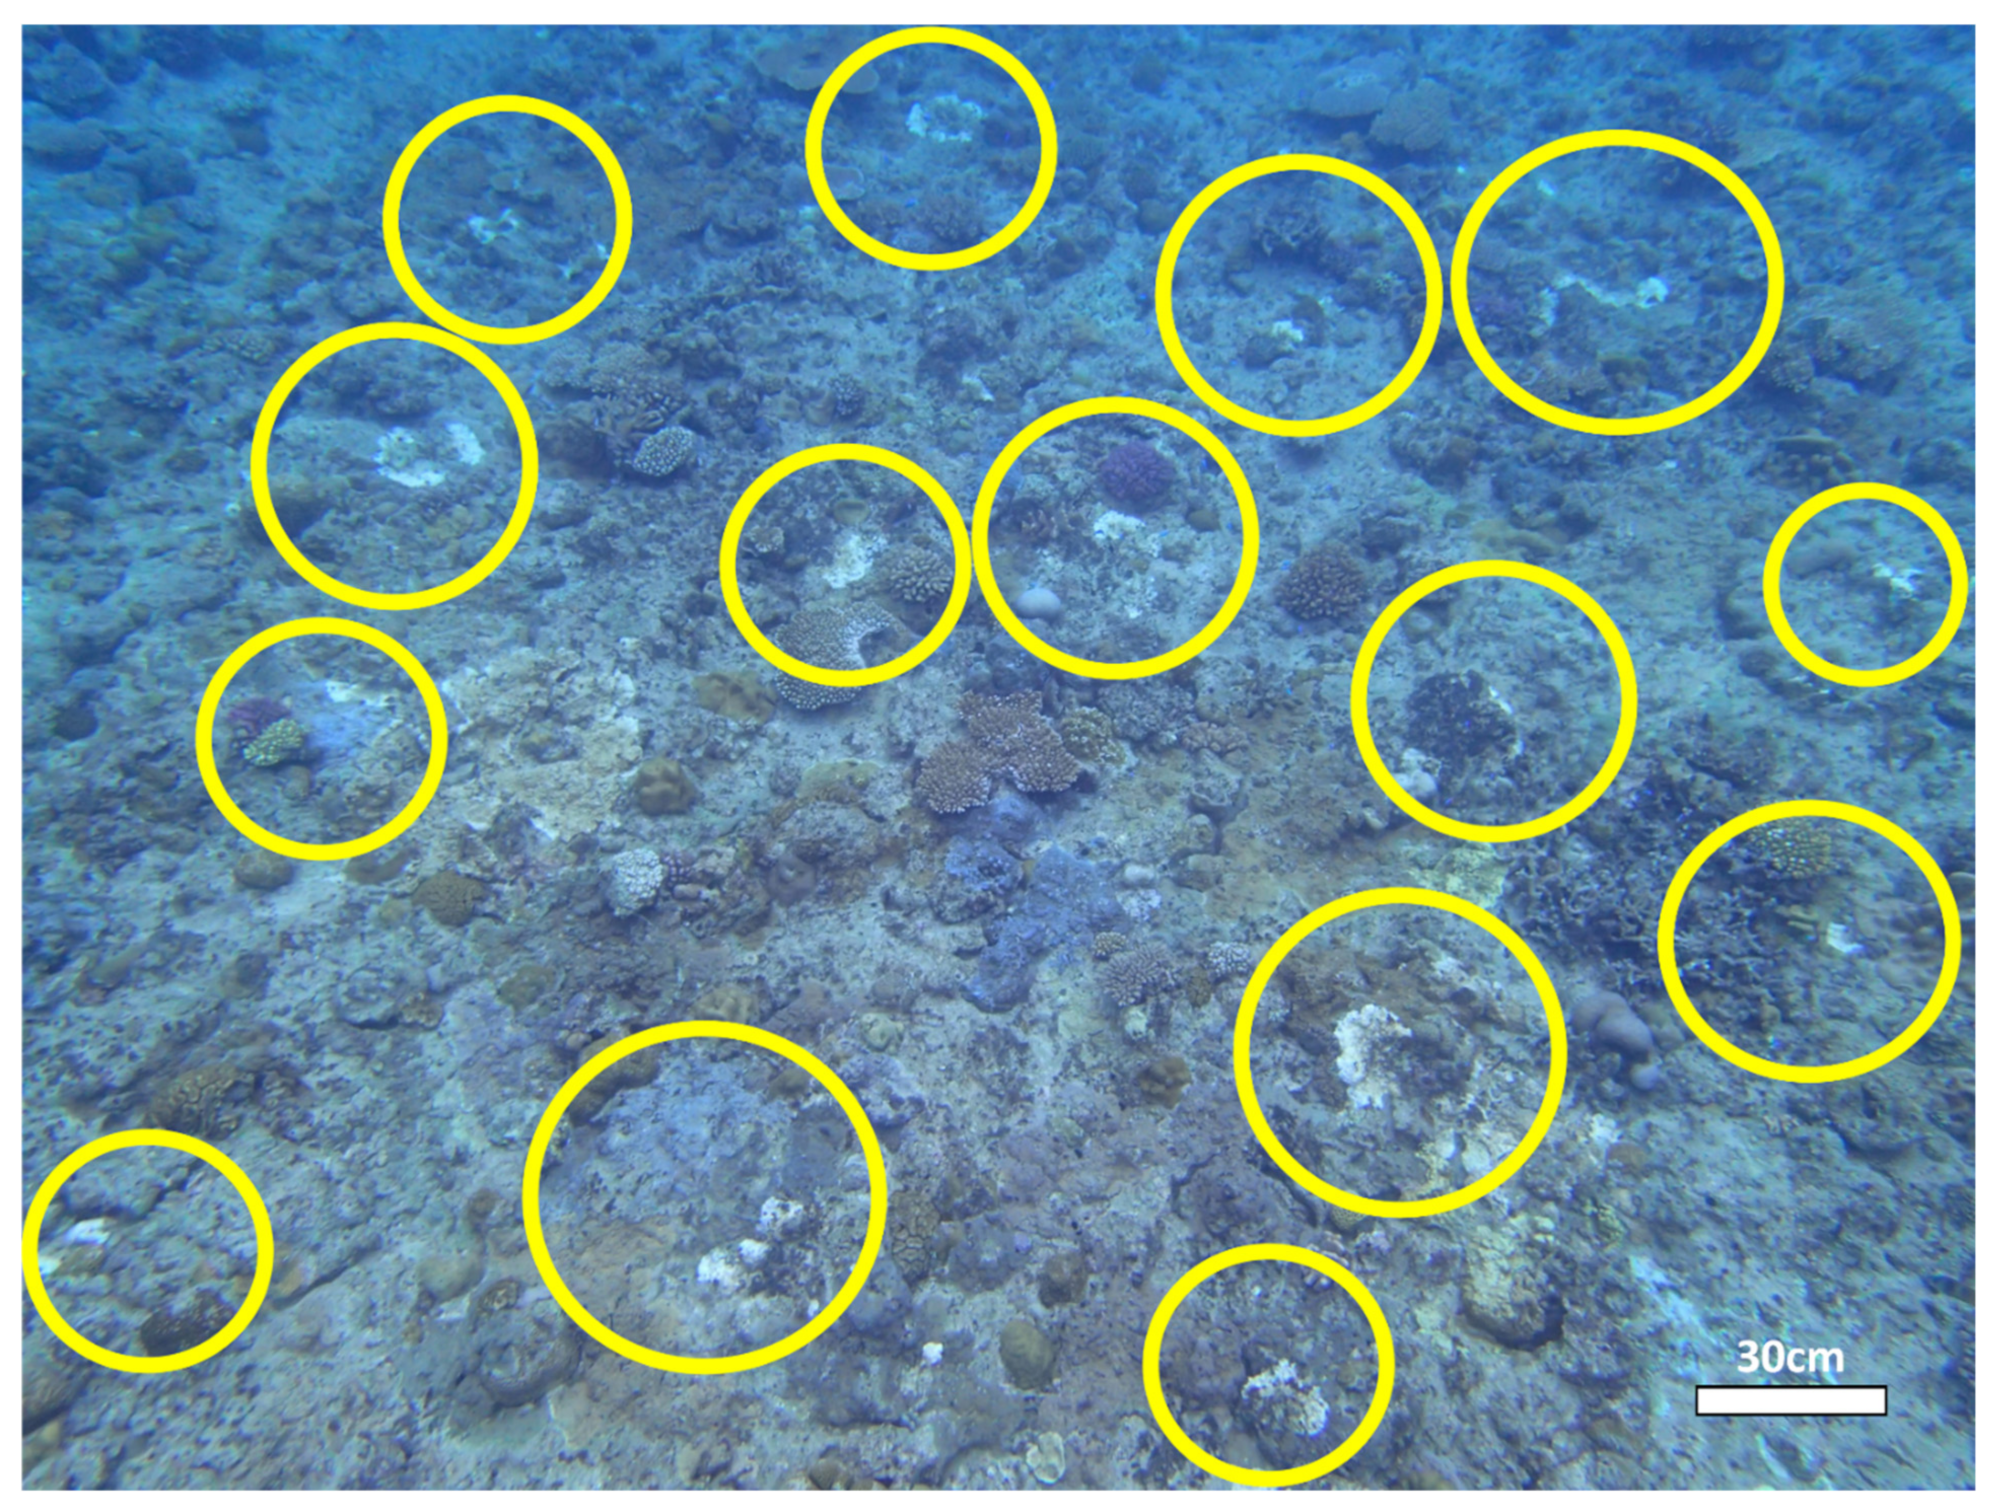
3.4. Abundance (Colony Count) and Percent Coverage

In 2020, encrusting Montipora had a mean abundance of 2.6 ± 1.7 colonies/m2 at site S4; 1.0 ± 1.2 colonies/m2 at sites S6 and S11; and 3.6 ± 1.5 colonies/m2 at site S12. The mean percent cover of encrusting Montipora was the highest at site S12 (30.0 ± 17.6%), followed by S4 (21.4 ± 21.4%) and S6 + S11 (9.1 ± 14.7%).

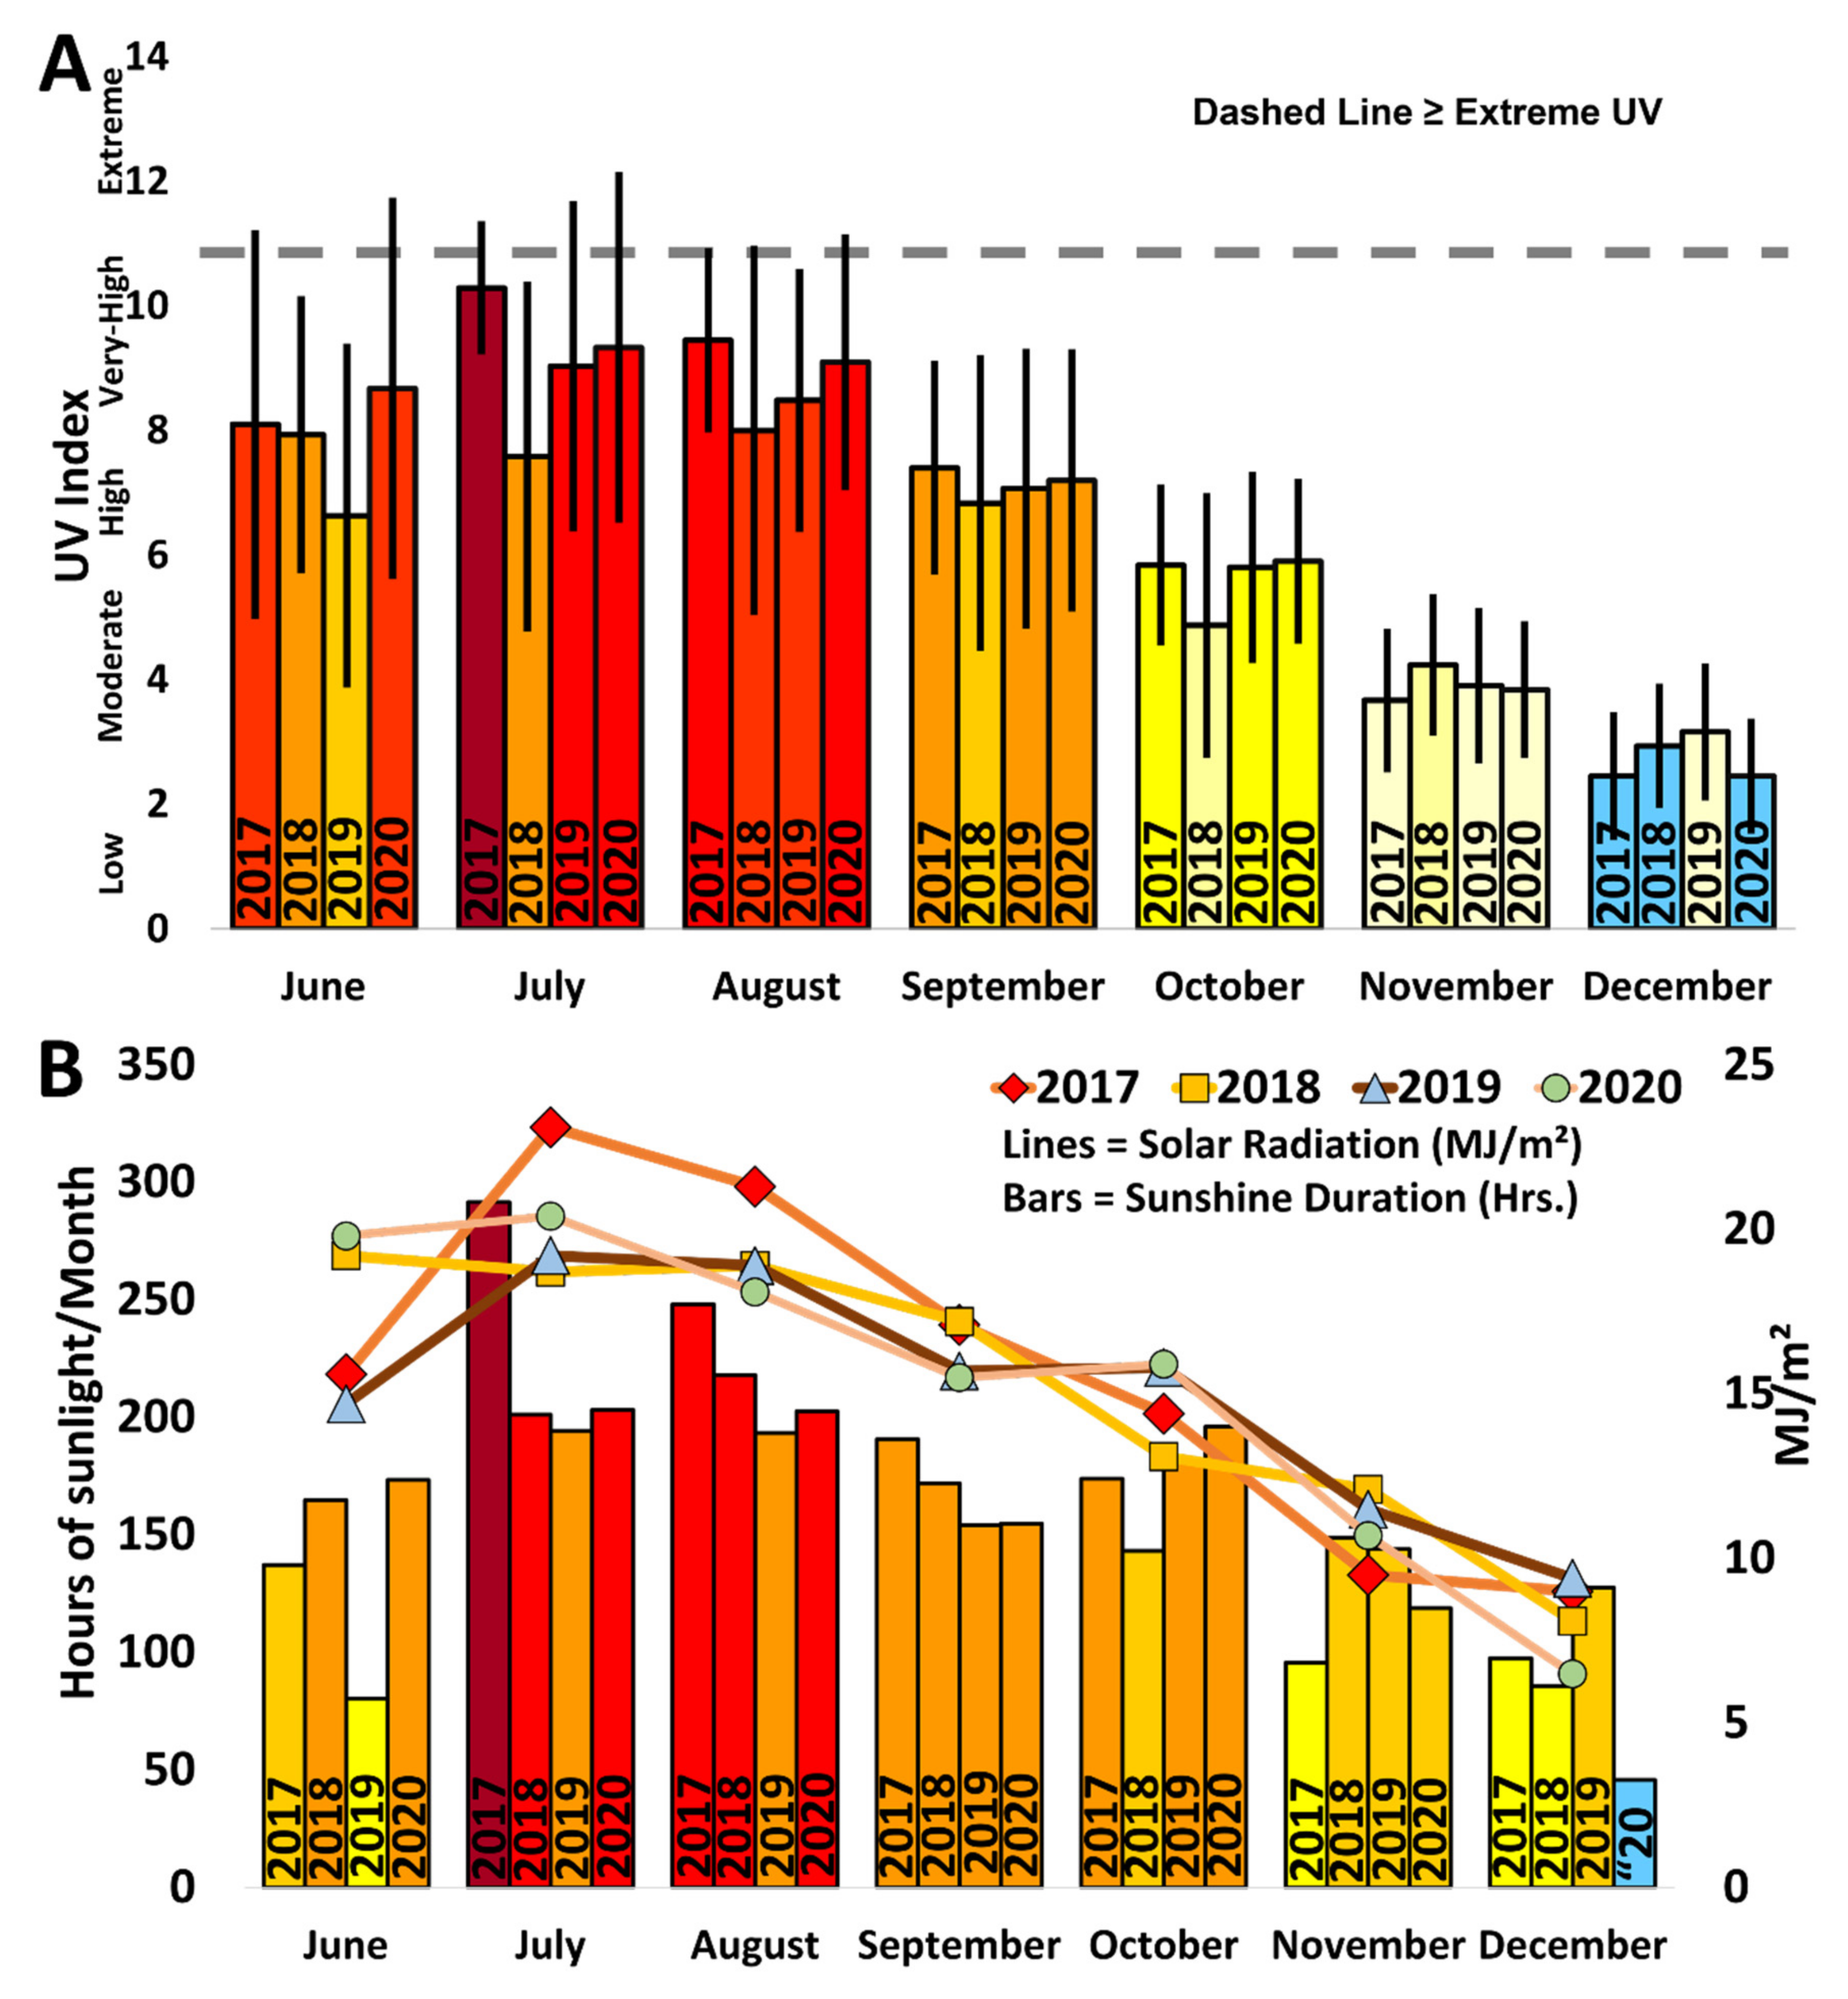
3.5. Environmental Parameters

The relationships between BBD progression rate along with water temperature, and light showed a positive trend (2020; Site S4) (Figure 8). The correlation between BBD progression rate and the water temperature was significant (see Section 3.2) without any significance with light (p = 0.7). Seawater temperatures in the years surveyed at both NS and RE sites exceeded the bleaching threshold (29.5 °C) for Okinawa [64,65] (Figure 3). Precipitation and typhoons decreased the in-situ temperatures. In 2020, high precipitation was observed on 17 July (22.5 mm rainfall/h, 55.0 mm rainfall/day) along with lowered seawater temperatures (below 29 °C for 10 h). Strong typhoons approached the site between 29 August and 3 September (avg: 28.7 °C; ± 0.91 °C; Min: 26.7 °C on 1 September; Site S4) and from 4 September to 13 September 2020 (avg: 27.8 °C; ± 0.56 °C; and below 27 °C for 17 h on 6 September and 11 h on 7 September; Site S4). Peak typhoon periods additionally prohibited sunlight penetration (31 August 2020: 253.023 µmol m−2 s−1, ±288.34 µmol m−2 s−1; 1 September 2020: 0.816 µmol m−2 s−1, ±0.921 µmol m−2 s−1; 4 September 2020: 1292.88 µmol m−2 s−1, ±1005.959 µmol m−2 s−1; 5 September 2020: 550.40 µmol m−2 s−1, ±397.00 µmol m−2 s−1). During these periods, a reduction in BBD progression was observed (Figure 8).
In terms of BBD prevalence, the highest BBD outbreak was seen in 2017 in certain sites that also had a peak solar radiation level observed during the survey period, during July 2017 (23.1 MJ/m2) (Figure 4B). Solar radiation was >20 MJ/m2 during August, May 2018, and July 2020). UV index, another property related to sunlight was also at its peak value >10 (10.29 ± 1.07) in July 2017 (Figure 4A). Maximum total sunshine duration exceeded 190 h during July and August every year for 2017 to 2020 (Figure 4B). Conversely, the GAs prevalence reached a peak in 2020.

4. Discussion

Over the course of four years, coral disease prevalence was monitored in encrusting Montipora, showing that RE sites had higher BBD prevalence, and possessed the highest percent cover of host colonies. GAs prevalence increased over the course of time from 2017 to 2020. Non-parametric tests highlighted a positive trend between BBD progression with light and temperature, while multi-year monitoring revealed colonies could escape, at least in some cases, complete BBD mortality. The uniqueness of this study lies in the large numbers of colony observations (≥11,000) when compared to the previous literature [3,4,14]. Such intensive surveys, encompassing the entire eastern and southern coasts of the Sesoko Island, provided insights into the disease recurrence and survival strategies of some of the host Montipora colonies from BBD and GAs. As some studies have suggested methodologies to assess the composition and benthic coverage might not be accurate in assessing coral disease [69] recommending that observations from more sites are more robust [70], we here attempted to cover as wide an area as possible around Sesoko Island.
The importance of disease prevalence data has been highlighted at the global scale [71], and regionally a high prevalence has been directly linked to various causative factors including light intensity, UV index, solar radiation, temperature, and coral cover [16,71,72,73,74,75]. These factors are interrelated; for example, solar radiation is positively correlated with UV index [75]. Long-term modeling studies from the GBR have indicated the role of light and seawater temperature in several phases of BBD and its hosts [31]. In our study, 2017 had the highest observed BBD prevalence at several NS sites (S1, S4, S5, S6,), and the highest UV index (July), solar radiation levels (July), and the total amount of sunshine duration (July/August) (Figure 4B). Consistently high prevalence of BBD at site S12 was exceptional (Figure 7) and could possibly be explained by the higher percent cover of host colonies compared to other sites as it has previously been shown that high coral cover can be a major driver of disease outbreaks [73].
Montipora corals on the east coast of Sesoko Island were additionally investigated during the summer and autumn of 2020 and indicated a positive and significant correlation between BBD progression and seawater temperature, affirming previous studies that have highlighted the importance of light and seawater temperatures in laboratory and field experiments [4,31,38,39,40]. A possibility is that different stages of BBD might be affected by different factors incorporating light and temperature, (e.g., [31,37,38]), calling for further studies. BBD progression during the period of heavy precipitation at site S4 was reduced, similarly to previous studies that have suggested the effect of precipitation on disease dynamics [76]. Additionally, when seawater temperatures dropped below 27 °C during typhoons, we also noted a decrease in disease progression. It is important to note that our mean light intensity was much higher than those reported on the GBR during Austral summer [40]. It can probably be explained by the exposed nature of the sensors to direct sunlight rather than placed in-situ or in an aquaria/or, a more-specialized sensor should be used in the future.
BBD is regarded as a disease of “deadly” and “virulent” severity [23,77], and its growth is thought to be mainly governed by biogeochemical aspects and environmental cues [16,78]. BBD has been occurring in the waters around Sesoko since at least 2013 [22]. Thus, it is possible that the continued BBD presence has heavily degraded the Montipora population. However, here we observed a high percentage of healthy Montipora colonies, and the density of Montipora colonies per m2 in 2020 only showed a minor reduction compared to previous literature [79] at a site ~150 m from ours. One possible explanation for this may be that BBD in certain Montipora colonies can disappear after one season, and thus these Montipora colonies survive and continue to grow (Figure 9). This observation is in line with Chen et al., 2017 [31], who observed 150 BBD infected colonies returning to a healthy state in the GBR. It is also necessary to highlight that colonies smaller in size have a higher chance of perishing, due to the high rate of BBD progression.
As we earlier speculated, BBD has the strategy to not completely decimate host populations to ensure its own long-term survival. BBD is also known to disappear during cold seasons as temperatures in Sesoko drop below 18 °C during winter. There is also a necessity to understand Montipora health during low temperature conditions as previous reports have suggested the genus is affected during winter seasons [53]. Year-round monitoring might provide further insights into the seasonal dynamics of BBD at specific NE or RE sites.
Even in the Ryukyu islands, while BBD is present in very low abundance in genus Montipora, there was no concrete evidence to suggest that BBD in these locations is as deadly as previously thought. However, the disease needs further monitoring [5] in these locations as these populations were thriving until mass bleaching in 2016, which caused a catastrophic decline in coral abundances in the Yaeyama Islands, although damage was not as severe in Sesoko Island [64,80,81]. A recent long-term study involving BBD in the Sekisei Lagoon has highlighted low specificity of the disease and thus limited effects on the reef [29]. Additionally, it is difficult to determine colonies killed by BBD due to the encrusting nature of the host, as once perished they can be rapidly overgrown by turf algae. Several such colonies were noted during our surveys in certain sites, but we cannot be certain we noted all of such colonies due to this.
Globally, BBD has been occurring since at least the 1970s [82], and recent reports suggests it may have existed since the 18th Century [83], and thus it can be considered a natural part of coral reef ecosystems [83,84].However, it is necessary to highlight that climate change and anthropogenic impacts may cause disturbances [73,74,84,85], because high levels of BBD outbreak have been noticed in specific locations (e.g., [86,87]), and for this reason we recommend continued monitoring of BBD in Okinawa and other islands within the Ryukyu Archipelago including the MPA’s.
GAs were observed throughout the current study period on the target encrusting Montipora (see Figure 6). Although known to be present in the area for four decades from now, GAs only begun to be studied in the late 90s [3]. Comparatively, our study indicated that the total number of GAs was slightly less than in earlier reports [3] but the number of GAs per colony was similar. Within the Japanese archipelago, our study can be regarded as one of the most intensive surveys informing about GAs prevalence on Montipora, similar to studies in the Sekisei Lagoon [25,29,55]. Results from Sekisei Lagoon indicate GAs are on the rise [25,55], in accordance with our findings.
GAs are non-fatal in nature [44]. Similarly, we were unable to confirm any direct mortality, providing support to a multi-decade old hypothesis in the same location [3]. McClanahan et al., 2009 [47] further confirmed a strong positive relationship between coral bleaching and GAs from the shallow reefs of Kenya, and severe bleaching events can also accelerate the occurrence of GAs in our study area [3,47]. The UV component of sunlight is considered to be an important parameter in causing GAs, and studies have hypothesized the relationship between UV-B and GAs [48]. Furthermore, Aeby et al., 2011 [72], indicated a negative correlation between increasing UV radiation and GAs in genus Porites. Although experimental studies have further supported the above findings [44], this relationship is still deemed controversial [42]. In our study, solar radiation and UV index were both at their highest during the summer of 2017, but the highest GAs prevalence was observed during 2020.
Knowledge of the prevalence of GAs in-situ is important to further understand its mechanisms of spread and growth [43]. Known to be strongly dependent on host density [72], in this study at a local scale, it was difficult for us to confirm this phenomenon as GAs were absent at some sites despite high Montipora densities (for example RE site S12) (Figure 5). One possibility might be that site S12 is further away from anthropogenic activities [72]. Interestingly, GAs were also noted to disappear from certain colonies during summer (H. Yamashiro, pers. obs.).

5. Conclusions

Our study highlights the prevalence of BBD and GAs in encrusting Montipora over a four-year period, and during several instances, outbreak-level prevalences [66] was noted at various sites. BBD progression was further significantly correlated with seawater temperature, indicating it as an important factor [31,38,39,40]. Extreme levels of UV in 2017 corresponded with significantly higher levels of BBD than in other years. The trend of GAs prevalence increased over time as seen elsewhere within the archipelago [25]. Our study also showed the possibility of host colonies surviving BBD and GAs conditions. We further put forth several future avenues of research which should provide more insights into these coral diseases. For example, in situ and ex situ controlled light and temperature experiments. Water quality assessments [84,88] linking coral disease remains necessary. Additionally, transmission mechanisms of BBD [51], and fishes as possible disease vectors [89] need to be further studied. Furthermore, morphological, and molecular studies of various BBD stages are necessary. A larger dataset with more colony numbers should allow a better understanding of BBD progression with the application of additional statistical analyses. Regarding GAs, their mode of spread requires investigation [43]. It is expected that the current BBD and GAs dataset will provide baseline information for future monitoring and comparative efforts of coral diseases around Okinawa.

Supplementary Materials

The following supporting information can be downloaded at: https://www.mdpi.com/article/10.3390/d14010032/s1, Table S1: Likelihood ratio tests carried out on the final GLM models explaining Spatio-temporal variation in disease occurrence. Significant p values are italicized and df is degree of freedom, Table S2: BBD prevalence – numbers of BBD-infected colonies in comparison to healthy Montipora colonies per site, 2017-2020. (*Near Shore Sites), Table S3: GA prevalence – numbers of GAs-infected colonies in comparison to healthy Montipora colonies per site, 2017–2020. (* Near Shore Sites), Table S4: Pairwise tests showing temporal variation in the probability of BBD occurrence on Montipora colonies at near-shore sites. p values are adjusted using the Holm method. The results are estimated marginal means on a logit scale. SE is standard error and df is degree of freedom. Significant p values are italicized and highlighted in blue color, Table S5: Pairwise tests showing spatial variation in the probability of BBD occurrence on Montipora colonies of near-shore sites at each year. p values are adjusted using the Holm method. The results are estimated mar-ginal means on a logit scale. SE is standard error and df is degree of freedom. Significant p values are italicized and highlighted in blue color, Table S6: Pairwise tests showing spatial and temporal variation in the probability of BBD occurrence on Montipora colonies at reef edge sites. p values are adjusted using the Holm method. The results are estimated marginal means on a logit scale. SE is standard error and df is degree of freedom. Significant p values are italicized and highlighted in blue color, Table S7: Pairwise tests showing temporal variation in the probability of GAs occur-rence on Montipora colonies at each site. p values are adjusted using the Holm method. The results are estimated marginal means on a logit scale. SE is standard error and df is degree of freedom. Significant p values are italicized and highlighted in blue color, Table S8: Pairwise tests showing spatial variation in the probability of GAs occurrence on Montipora colonies in each year. p values are adjusted using the Holm method. The results are estimated marginal means on a logit scale. SE is standard error and df is degree of freedom. Significant p values are italicized and highlighted in blue color, Figure S1: BBD in-situ on Acropora hyacinthus sp. complex at southern reef of Sesoko Island, Okinawa, Japan. September 2020. Photograph: Rocktim Ramen Das, Figure S2: First report of Gardineroseris planulata (A) affected by BBD in the Pacific Ocean. Red Sea [67]; Indian Ocean (Maldives) [68]. Photograph: Rocktim Ramen Das, Figure S3: Positive correlation between BBD progression on Montipora colonies and mean sea water temperature. Mean difference between two observations is 6.6 days (Spearman’s rho (57) = 0.3, p < 0.05).

Author Contributions

Conceptualization: R.R.D., H.Y. and H.W.; methodology, R.R.D., H.Y. and H.W.; software, R.R.D., T.S. and G.D.M.; validation, R.R.D., T.S. and G.D.M.; formal analysis, R.R.D., H.W., T.S. and G.D.M.; investigation, R.R.D., H.Y., H.W. and P.T.-K.; resources, R.R.D., H.Y. and J.D.R.; data curation, R.R.D. and H.W.; writing—original draft preparation, R.R.D. writing—review and editing, R.R.D., H.W., G.D.M., T.S., P.T.-K., N.W., S.-L.T., H.Y. and J.D.R.; visualization, R.R.D., G.D.M., T.S., H.Y. and J.D.R.; supervision, N.W., S.-L.T., H.Y. and J.D.R.; funding acquisition, R.R.D., H.Y. and J.D.R. All authors have read and agreed to the published version of the manuscript.

Funding

This research was partially funded by MEXT (no. 170021/2017~2021) provided by the Ministry of Education, Culture, Sports, Science & Technology (MEXT), Japan to R.R.D. and an internal University of the Ryukyus ORCHIDS project grant to J.D.R.

Institutional Review Board Statement

Not applicable.

Informed Consent Statement

Not applicable.

Data Availability Statement

The data presented in this study are available in article.

Acknowledgments

The authors thank C.A. Chen, Y. Nozawa, S. Keshavmurthy (Biodiversity Research Center, Academia Sinica, Taiwan), S.H. Yang (Institute of Fisheries Science, National Taiwan University, Taiwan), A. Iwasaki (Asamushi Research Center for Marine Biology, Tohoku University, Japan), T. Takagi (University of the Tokyo, Japan), T. Nakamura, M. Morita, K. Sakai (University of the Ryukyus, Japan), and H. Rouzé (Marine Laboratory, University of Guam, Micronesia) for discussions on coral diseases. The authors thank S. Toshino (Kuroshio Biological Research Institute, Japan), S.N. Aini, and Y. Hirose (Sesoko Station, University of the Ryukyus, Japan) for occasional help in field surveys. We also thank H.B. Wee (Universiti Kebangsann Malaysia, UKM, Malaysia) for comments and A.H. Baird (James Cook University, Australia) for insights on coral disease in Japan. R.R.D. is grateful to Y. Nakano (Okinawa Seaside Laboratory, OIST, Japan), and the other faculty and staff of Sesoko Station. The authors are further thankful for the comments and suggestions by five anonymous reviewers and the special issue editor Andrew Bauman (National University of Singapore) for further enhancing an earlier version of this manuscript.

Conflicts of Interest

The authors declare no conflict of interest. James Davis Reimer is on the editorial board of the journal Diversity.

References

  1. Sutherland, K.P.; Porter, J.W.; Torres, C. Disease and immunity in Caribbean and Indo-Pacific zooxanthellate corals. Mar. Ecol. Prog. Ser. 2004, 266, 273–302. [Google Scholar] [CrossRef] [Green Version]
  2. Lafferty, K.D.; Porter, J.W.; Ford, S.E. Are diseases increasing in the ocean? Annu. Rev. Ecol. Evol. Syst. 2004, 35, 31–54. [Google Scholar] [CrossRef] [Green Version]
  3. Yamashiro, H.; Yamamoto, M.; van Woesik, R. Tumor formation on the coral Montipora informis. Dis. Aquat. Org. 2000, 41, 211–217. [Google Scholar] [CrossRef] [Green Version]
  4. Sato, Y.; Bourne, D.G.; Willis, B.L. Dynamics of seasonal outbreaks of black band disease in an assemblage of Montipora species at Pelorus Island (Great Barrier Reef, Australia). Proc. Royal Soc. B. 2009, 276, 2795–2803. [Google Scholar] [CrossRef] [Green Version]
  5. Wada, N.; Mano, N.; Yanagisawa, Y.; Mori, T. Occurrence of coral diseases at Akajima, Okinawa, Japan in 2010 and 2011. Galaxea J. Coral Reef Stud. 2017, 19, 35–44. [Google Scholar] [CrossRef]
  6. Huang, C.Y.; Hwang, J.S.; Yamashiro, H.; Tang, S.-L. Spatial and cross-seasonal patterns of coral diseases in reefs of Taiwan: High prevalence and regional variation. Dis. Aquat. Org. 2021, 146, 145–156. [Google Scholar] [CrossRef]
  7. Aini, S.N.; Tang, S.-L.; Yamashiro, H. Monthly progression rates of the coral killing sponge Terpios hoshinota in Sesoko Island, Okinawa, Japan. Coral Reefs 2021, 40, 973–981. [Google Scholar] [CrossRef]
  8. Veron, J.E.N. Corals of The World. 3 Volumes; Australian Institute of Marine Science: Townsville, Australia, 2000; p. 1382. [Google Scholar]
  9. Nishihira, M. Hermatypic corals of Japan. In Coral Reefs of Japan; Tsuchiya, M., Nadaoka, K., Kayanne, H., Yamano, H., Eds.; Ministry of the Environment and Japanese Coral Reef Society: Tokyo, Japan, 2004; pp. 10–19. [Google Scholar]
  10. Veron, J.E.N. Conservation of biodiversity: A critical time for the hermatypic corals of Japan. Coral Reefs 1992, 11, 13–21. [Google Scholar] [CrossRef]
  11. Aeby, G.S. Baseline levels of coral disease in the Northwestern Hawaiian Islands. Atoll Res. Bull. 2006, 543, 471–488. [Google Scholar]
  12. Aeby, G.S.; Santavy, D.L. Factors affecting susceptibility of the coral Montastraea faveolata to black-band disease. Mar. Ecol. Prog. Ser. 2006, 318, 103–110. [Google Scholar] [CrossRef] [Green Version]
  13. Aeby, G.S.; Ross, M.; Williams, G.J.; Lewis, T.D.; Work, T.M. Disease dynamics of Montipora white syndrome within Kaneohe Bay, Oahu, Hawaii: Distribution, seasonality, virulence, and transmissibility. Dis. Aquat. Org. 2010, 91, 1–8. [Google Scholar] [CrossRef] [Green Version]
  14. Aeby, G.S.; Work, T.M.; Runyon, C.M.; Shore-Maggio, A.; Ushijima, B.; Videau, P.; Beurmann, S.; Callahan, S.M. First record of black band disease in the Hawaiian archipelago: Response, outbreak status, virulence, and a method of treatment. PLoS ONE 2015, 10, e0120853. [Google Scholar] [CrossRef] [Green Version]
  15. Palmer, C.V.; Gates, R.D. Skeletal eroding band in Hawaiian corals. Coral Reefs 2010, 29, 469. [Google Scholar] [CrossRef] [Green Version]
  16. Jones, R.J.; Bowyer, J.; Hoegh-Guldberg, O.; Blackall, L.L. Dynamics of a temperature-related coral disease outbreak. Mar. Ecol. Prog. Ser. 2004, 281, 63–77. [Google Scholar] [CrossRef]
  17. Johan, O.; Zamany, N.P.; Smith, D.; Sweet, M.J. Prevalence and incidence of black band disease of scleractinian corals in the Kepulauan Seribu Region of Indonesia. Diversity 2016, 8, 11. [Google Scholar] [CrossRef] [Green Version]
  18. McClanahan, T. Coral bleaching, diseases, and mortality in the western Indian Ocean. In Coral Health and Disease; Rosenberg, E., Loya, Y., Eds.; Springer: Berlin/Heidelberg, Germany, 2004; pp. 157–176. [Google Scholar]
  19. Thinesh, T.; Diraviya-Raj, K.; Mathews, G.; Patterson-Edward, J.K. Coral diseases are major contributors to coral mortality in Shingle Island, Gulf of Mannar, southeastern India. Dis. Aquat. Org. 2013, 106, 69–77. [Google Scholar] [CrossRef]
  20. Diraviya-Raj, K.; Aeby, G.S.; Mathews, G.; Bharath, M.S.; Rajesh, S.; Laju, R.L.; Arasamuthu, A.; Kumar, P.D.; Patterson-Edward, J.K. Patterns in the abundance of fish and snail corallivores associated with an outbreak of acute tissue loss disease on the reefs of Vaan Island in the Gulf of Mannar, India. In Proceedings of the 13th International Coral Reef Symposium at Honolulu, Honolulu, HI, USA, 19–24 June 2016. [Google Scholar]
  21. Diraviya-Raj, K.; Selva-Bharath, M.; Mathews, G.; Aeby, G.S.; Patterson-Edward, J.K. Coral-killing sponge Terpios hoshinota invades the corals of Gulf of Mannar, Southeast India. Curr. Sci. 2018, 114, 1117–1119. [Google Scholar] [CrossRef]
  22. Yamashiro, H. Corals of the Unknown World; Seizando-Shoten Publishing Co. Ltd.: Tokyo, Japan, 2016; p. 165. (In Japanese) [Google Scholar]
  23. Richardson, L.L. Black band disease. In Coral Health and Disease; Rosenberg, E., Loya, Y., Eds.; Springer: Berlin, Heidelberg, Germany, 2004; pp. 325–336. [Google Scholar]
  24. Biodiversity Centre of Japan. The Annual Report of the “Monitoring Sites 1000” in Japan: Coral Reefs. Biodiversity Center of Japan; Ministry of the Environment of Japan: Tokyo, Japan, 2003. (In Japanese) [Google Scholar]
  25. Sato, T. A report on coral disease prevalence at the Sekisei Lagoon, Okinawa, Japan. Lagoon 2006, 9, 13–14. (In Japanese) [Google Scholar]
  26. Casareto, B.E. Studies on water quality and bacteria composition in corals showing ‘white syndrome’ signs at Sekisei Lagoon, South Ishigaki Island, Okinawa, Japan. Lagoon 2008, 11, 2–5. [Google Scholar]
  27. Yasuda, N.; Hidaka, M. Cellular kinetics in growth anomalies of the scleractinian corals Porites australiensis and Montipora informis. Dis. Aquat. Org. 2012, 102, 1–11. [Google Scholar] [CrossRef] [Green Version]
  28. Yasuda, N.; Nakano, Y.; Yamashiro, H.; Hidaka, M. Skeletal structure, and progression of growth anomalies in Porites australiensis in Okinawa, Japan. Dis. Aquat. Org. 2012, 12, 237–247. [Google Scholar] [CrossRef] [Green Version]
  29. Muko, S.; Nadaoka, K. Ecological disturbances and their relative impacts on coral cover: Analysis of monitoring data in Sekisei lagoon (Okinawa, Japan). Bull. Mar. Sci. 2020, 96, 195–216. [Google Scholar] [CrossRef]
  30. Weil, E.; Irikawa; Casareto, B.; Suzuki, Y. Extended geographic distribution of several Indo-Pacific coral reef diseases. Dis. Aquat. Org. 2012, 98, 163–170. [Google Scholar] [CrossRef] [Green Version]
  31. Chen, C.C.M.; Bourne, D.G.; Drovandi, C.C.; Mengersen, K.; Willis, B.L.; Caley, M.J.; Sato, Y. Modelling environmental drivers of black band disease outbreaks in populations of foliose corals in the genus Montipora. PeerJ 2017, 5, e3438. [Google Scholar] [CrossRef] [Green Version]
  32. Frias-Lopez, J.; Klaus, J.S.; Bonheyo, G.T.; Fourke, B.W. Bacterial community associated with Black band disease in Corals. Appl. Environ. Microbiol. 2004, 70, 5955–5962. [Google Scholar] [CrossRef] [Green Version]
  33. Miller, A.W.; Richardson, L.L. A meta-analysis of 16S rRNA gene clone libraries from the polymicrobial black band disease of corals. FEMS Microb. Ecol. 2011, 75, 231–241. [Google Scholar] [CrossRef] [Green Version]
  34. Sato, Y.; Civiello, M.; Bell, S.C.; Willis, B.L.; Bourne, D.G. Integrated approach to understanding the onset and pathogenesis of black band disease in corals. Environ. Microbiol. 2016, 18, 752–765. [Google Scholar] [CrossRef]
  35. Frias-Lopez, J.; Bonheyo, G.T.; Jin, Q.; Fourke, B.W. Cyanobacteria associated with coral black band disease in Caribbean and Indo-Pacific reefs. Appl. Environ. Microbiol. 2003, 69, 2409–2413. [Google Scholar] [CrossRef] [Green Version]
  36. Hutabarat, P.U.B.; Nguyen, X.H.; Suda, S. Black Band disease-related (BBD) cyanobacterium from Okinawan corals. J. Appl. Phycol. 2018, 30, 3197–3203. [Google Scholar] [CrossRef]
  37. Sato, Y.; Willis, B.L.; Bourne, D.G. Successional changes in bacterial communities during the development of black band disease on the reef coral, Montipora hispida. ISME J. 2010, 4, 207–214. [Google Scholar] [CrossRef] [Green Version]
  38. Sato, Y.; Bourne, D.G.; Willis, B.L. Effects of temperature and light on the progression of black band disease on the reef coral, Montipora hispida. Coral Reefs 2011, 30, 753–761. [Google Scholar] [CrossRef]
  39. Kuehl, K.; Jones, R.; Gibbs, D.; Richardson, L. The roles of temperature and light in black band disease (BBD) progression on corals of the genus Diploria in Bermuda. J. Invertebr. Pathol. 2011, 106, 366–370. [Google Scholar] [CrossRef]
  40. Boyett, H.V.; Bourne, D.G.; Willis, B.L. Elevated temperature and light enhance progression and spread of black band disease on staghorn corals of the Great Barrier Reef. Mar. Biol. 2007, 151, 1711–1720. [Google Scholar] [CrossRef]
  41. Peters, E.C.; Halas, J.C.; McCarty, H.B. Calicoblastic neoplasms in Acropora palmata, with a review of reports on anomalies of growth and form in corals. J. Natl. Cancer Inst. 1986, 76, 895–912. [Google Scholar]
  42. Domart-Coulon, I.J.; Traylor-Knowles, N.; Peters, E.; Elbert, D.; Downs, C.A.; Price, K.; Stubbs, J.; McLaughlin, S.; Cox, E.; Aeby, G.; et al. Comprehensive characterization of skeletal tissue growth anomalies of the finger coral Porites compressa. Coral Reefs 2006, 25, 531–543. [Google Scholar] [CrossRef]
  43. Preston, S.; Richards, Z. Biological consequences of an outbreak of growth anomalies on Isopora palifera at the Cocos (Keeling) Islands. Coral Reefs 2020, 40, 97–109. [Google Scholar] [CrossRef]
  44. Stimson, J. Ecological characterization of coral growth anomalies on Porites compressa in Hawai ‘i. Coral Reefs 2011, 30, 133–142. [Google Scholar] [CrossRef]
  45. Burns, J.H.R.; Takabayashi, M. Histopathology of growth anomaly affecting the coral, Montipora capitata: Implications on biological functions and population viability. PLoS ONE 2011, 6, e28854. [Google Scholar]
  46. Palmer, C.V.; Baird, A.H. Coral tumor-like growth anomalies induce an immune response and reduce fecundity. Dis. Aquat. Org. 2018, 130, 77–81. [Google Scholar] [CrossRef] [Green Version]
  47. McClanahan, T.R.; Weil, E.; Maina, J. Strong relationship between coral bleaching and growth anomalies in massive Porites. Glob. Chang. Biol. 2009, 15, 1804–1816. [Google Scholar] [CrossRef]
  48. Coles, S.L.; Seapy, D.G. Ultra-violet absorbing compounds and tumorous growths on acroporid corals from Bandar Khayran, Gulf of Oman, Indian Ocean. Coral Reefs 1998, 17, 195–198. [Google Scholar] [CrossRef]
  49. Andersson, E.R.; Stewart, J.A.; Work, T.M.; Woodley, C.M.; Schock, T.B.; Day, R.D. Morphological, elemental, and boron isotopic insights into pathophysiology of diseased coral growth anomalies. Sci. Rep. 2020, 10, 8252. [Google Scholar] [CrossRef]
  50. Andersson, E.R.; Day, R.D.; Work, T.M.; Anderson, P.E.; Woodley, C.M.; Schock, T.B. Identifying metabolic alterations associated with coral growth anomalies using 1H NMR metabolomics. Coral Reefs 2021, 1–15. [Google Scholar] [CrossRef]
  51. Zvuloni, A.; Artzy-Randrup, Y.; Stone, L.; Kramarsky-Winter, E.; Barkan, R.; Loya, Y. Spatio-temporal transmission patterns of Black-Band disease in a coral community. PLoS ONE 2009, 4, e4993. [Google Scholar] [CrossRef]
  52. Irikawa, A.; Casareto, B.E.; Suzuki, Y.; Agostini, S.; Hidaka, M.; van Woesik, R. Growth anomalies on Acropora cytherea corals. Mar. Pollut. Bull. 2011, 62, 1702–1707. [Google Scholar] [CrossRef]
  53. Yamashiro, H.; Mikame, Y.; Suzuki, H. Localized outbreak of attached diatoms on the coral Montipora due to low-temperature stress. Sci. Rep. 2012, 2, 1–4. [Google Scholar] [CrossRef] [Green Version]
  54. Das, R.R.; Yamashiro, H. Corals dominate monofilament lines in Sesoko Island, Japan. Curr. Sci. 2018, 114, 730–731. [Google Scholar]
  55. Wada, N.; Ohdera, A.; Mano, N. Coral disease in Japan. In Coral Reef Studies of Japan; Iguchi, A., Hongo, C., Eds.; Springer: Singapore, 2018; pp. 41–62. [Google Scholar]
  56. Takeuchi, I.; Yamashiro, H. Large Porites microatoll found by aerial survey at Sesoko Island, Okinawa, Japan. Coral Reefs 2017, 36, 1317. [Google Scholar] [CrossRef] [Green Version]
  57. Kubomura, T.; Boo, W.H.; Reimer, J.D. Investigation incidence and possible cause of pink and purple pigmentation response in hard coral genus Porites around Okinawajima Island, Japan. Reg. Stud. Mar. Sci. 2020, 41, 101569. [Google Scholar] [CrossRef]
  58. Takeuchi, I.; Yamashiro, H. Bird-view of the reef flat off Sesoko Station on the east coast of Sesoko Island, Okinawa, Japan obtained by aerial survey. Galaxea J. Coral Reef Stud. 2021. [Google Scholar] [CrossRef]
  59. Beijbom, O.; Edmunds, P.J.; Kline, D.I.; Mitchell, B.G.; Kriegman, D. Automated annotation of coral reef survey images. In Proceedings of the 2012 IEEE Conference on Computer Vision and Pattern Recognition (IEEE), Providence, RI, USA, 16–21 June 2012; pp. 1170–1177. [Google Scholar]
  60. Perneger, T.V. What’s wrong with Bonferroni adjustments. BMJ 1998, 316, 1236. [Google Scholar] [CrossRef]
  61. R Core Team. R: A Language and Environment for statistical COMPUTING. 2020. R Foundation for Statistical Computing: Vienna, Austria. Available online: https://www.R-project.org/ (accessed on 1 October 2021).
  62. Fox, J.; Weisberg, S. An {R} Companion to Applied Regression, 3rd ed.; Sage: Thousand Oaks, CA, USA, 2019; Available online: https://socialsciences.mcmaster.ca/jfox/Books/Companion/ (accessed on 1 October 2021).
  63. Length, R.V. Emmeans: Estimated Marginal Means, Aka Least-Squares Means. The R Package Version 1.5.3. 2020. Available online: https://CRAN.R-project.org/packages=emmeans (accessed on 1 October 2021).
  64. Singh, T.; Ijima, M.; Yasumoto, K.; Sakai, K. Effects of moderate thermal anomalies on Acropora corals around Sesoko Island, Okinawa. PLoS ONE 2019, 14, e0210795. [Google Scholar]
  65. NOAA Coral Reef Watch. 2019. NOAA Coral Reef Watch Version 3.1 Daily 5km Satellite Regional Virtual Station Time Series Data for Southeast Florida, Mar. 12, 2013-Mar. 11, 2014. College Park, Maryland, USA: NOAA Coral Reef Watch. Available online: https://coralreefwatch.noaa.gov/product/vs/data.php. (accessed on 5 February 2020).
  66. Willis, B.L.; Page, C.A.; Dinsdale, E.A. Coral disease on the Great Barrier Reef. In Coral Health and Disease; Rosenberg, E., Loya, Y., Eds.; Springer: Berlin/Heidelberg, Germany, 2004; pp. 69–104. [Google Scholar]
  67. Hadaidi, G.; Ziegler, M.; Shore-Maggio, A.; Jensen, T.; Aeby, G.; Voolstra, C.R. Ecological and molecular characterization of a coral black band disease outbreak in the Red Sea during a bleaching event. PeerJ 2018, 6, e5169. [Google Scholar] [CrossRef]
  68. Montano, S.; Strona, G.; Seveso, D.; Galli, P. Prevalence, host range, and spatial distribution of black band disease in the Maldivian Archipelago. Dis. Aquat. Org. 2013, 105, 65–74. [Google Scholar] [CrossRef] [Green Version]
  69. Jordán-Dahlgren, E.; Jordán-Garza, A.G.; Rodríguez-Martínez, R.E. Coral disease prevalence estimation and sampling design. PeerJ 2018, 6, e6006. [Google Scholar] [CrossRef]
  70. Smith, S.G.; Swanson, D.W.; Chiappone, M.; Miller, S.L.; Ault, J.S. Probability sampling of stony coral populations in the Florida Keys. Environ. Monit. Assess. 2011, 183, 121–138. [Google Scholar] [CrossRef]
  71. Ruiz-Moreno, D.; Willis, B.L.; Page, A.C.; Weil, E.; Cróquer, A.; Vargas-Angel, B.; Jordan-Garza, A.G.; Jordán-Dahlgren, E.; Raymundo, L.; Harvell, C.D. Global coral disease prevalence associated with sea temperature anomalies and local factors. Dis. Aquat. Org. 2012, 100, 249–261. [Google Scholar] [CrossRef] [Green Version]
  72. Aeby, G.S.; Williams, G.J.; Franklin, E.C.; Haapkyla, J.; Harvell, C.D.; Neale, S.; Page, C.A.; Raymundo, L.; Vargas-Ángel, B.; Willis, B.L.; et al. Growth anomalies on the coral genera Acropora and Porites are strongly associated with host density and human population size across the Indo-Pacific. PLoS ONE 2011, 6, e16887. [Google Scholar]
  73. Bruno, J.F.; Selig, E.R.; Casey, K.S.; Page, C.A.; Willis, B.L.; Harvell, C.D.; Sweatmen, H.; Meleny, A.M. Thermal stress and coral cover as drivers of coral disease outbreaks. PLoS Biol. 2007, 5, e124. [Google Scholar] [CrossRef]
  74. Hazraty-Kari, S.; Tavakoli-Kolour, P.; Das, R.R.; Farhadi, M.; Barkhordari-Ahmadi, A.; Yahyavi, M.; Rezai, H. Baseline assessment of coral diseases in an environmentally extreme environment of the northern Persian Gulf. Mar. Pollut. Bull. 2021, 171, 112707. [Google Scholar] [CrossRef]
  75. Downs, N.; Parisi, A.V.; Galligan, L.; Turner, J.; Amar, A.; King, R.; Ultra, F.; Butler, H. Solar radiation and the UV index: An application of numerical integration, trigonometric functions, online education, and the modelling process. IJRES 2016, 2, 179–189. [Google Scholar] [CrossRef] [Green Version]
  76. Haapkylä, J.; Unsworth, R.K.F.; Flavell, M.; Bourne, D.G.; Schaffelke, B.; Willis, B.L. Seasonal rainfall and runoff promote coral disease on an inshore reef. PLoS ONE 2011, 6, e16893. [Google Scholar] [CrossRef]
  77. Muller, E.M.; Leporacci, N.M.; Macartney, K.J.; Shea, A.G.; Crane, R.E.; Hall, E.R.; Ritchie, K.B. Low pH reduces the virulence of black band disease on Orbicella faveolata. PLoS ONE 2017, 12, e0178869. [Google Scholar] [CrossRef] [Green Version]
  78. Glas, M.S.; Sato, Y.; Ulstrup, K.E.; Bourne, D.G. Biogeochemical conditions determine virulence of black band disease in corals. ISME J. 2012, 6, 1526–1534. [Google Scholar] [CrossRef] [Green Version]
  79. Cabaitan, P.C.; Yamamoto, H.; Sakai, K. Recovery of corals a decade after thermal stress event at Motobu, Okinawa, Japan: Spatial variability in winners and losers. Galaxea J. Coral Reef Stud. 2012, 14, 27–40. [Google Scholar] [CrossRef] [Green Version]
  80. Nakamura, T. Mass coral bleaching event in Sekisei lagoon observed in the summer of 2016. Galaxea J. Coral Reef Stud. 2017, 19, 29–40. [Google Scholar] [CrossRef] [Green Version]
  81. Sakai, K.; Singh, T.; Iguchi, A. Bleaching, and post-bleaching mortality of Acropora corals on a heat-susceptible reef in 2016. PeerJ 2019, 7, e8138. [Google Scholar] [CrossRef] [Green Version]
  82. Antonius, A. New observations on coral destruction in reefs. In Tenth Meeting of the Association of Island Marine Laboratories of the Caribbean; University of Puerto Rico: Mayaguez, PR, USA, 1973; p. 3. [Google Scholar]
  83. Roff, G. Earliest record of a coral disease from the Indo-Pacific? Coral Reefs 2016, 35, 457. [Google Scholar] [CrossRef]
  84. Page, C.; Willis, B. Distribution, host range and large-scale spatial variability in black band disease prevalence on the Great Barrier Reef, Australia. Dis. Aquat. Org. 2006, 69, 41–51. [Google Scholar] [CrossRef]
  85. Harvell, C.D.; Kim, K.; Burkholder, J.M.; Colwell, R.R.; Epstein, P.R.; Grimes, D.J.; Hofmann, E.E.; Lipp, E.K.; Osterhaus, A.D.M.E.; Overstreet, R.M.; et al. Emerging marine diseases-climate links and anthropogenic factors. Science 1999, 285, 1505–1510. [Google Scholar] [CrossRef] [Green Version]
  86. Aeby, G.S.; Shore, A.; Jensen, T.; Ziegler, M.; Work, T.; Voolstra, C.R. A comparative baseline of coral disease in three regions along the Saudi Arabian coast of the central Red Sea. PLoS ONE 2021, 16, e0246854. [Google Scholar] [CrossRef]
  87. Al-Moghrabi, S.M. Unusual black band disease (BBD) outbreak in the northern tip of the Gulf of Aqaba (Jordan). Coral Reefs 2001, 19, 330–331. [Google Scholar] [CrossRef]
  88. Vega-Thurber, R.L.; Burkepile, D.E.; Fuchs, C.; Shantz, A.A.; Mcminds, R.; Zaneveld, J.R. Chronic nutrient enrichment increases prevalence and severity of coral disease and bleaching. Glob. Chang. Biol. 2014, 20, 544–554. [Google Scholar] [CrossRef]
  89. Chong-Seng, K.M.; Cole, A.J.; Pratchett, M.S.; Willis, B.L. Selective feeding by coral reef fishes on coral lesions associated with brown band and black band disease. Coral Reefs 2011, 30, 473–481. [Google Scholar] [CrossRef]
Figure 1. Study area depicting Sesoko Island (Top-Left) located in central western Okinawa Island. Source: HCMGIS plugin, F4 Map-2D (QGis 3.16 long-term release).
Diversity 14 00032 g001
Figure 2. Aerial imagery to highlight the distribution of the host encrusting Montipora and other forms of corals including massive and submassive Porites and tabular Acropora. Aerial photograph: Hideyuki Yamashiro. For information on site S6 and S11 refer to [58].
Diversity 14 00032 g002
Figure 3. Daily means with +/− SD (Standard deviation) for NS (S4, S6) and RE (S11) sites. The dashed black line represents the Maximum Monthly Mean (MMM), which is 28.5 °C for the northern Ryukyu Islands [65]. The solid black line is the bleaching threshold, which is usually 1 °C higher than the MMM [64], here set as 29.57 °C.
Diversity 14 00032 g003
Figure 4. (A) UV index during the period of assessment (summer to early autumn), each bar represents the monthly mean of maximum UV index over the Nakijin/Motobu area for the month. Each bar represents year 2017–2020 under each month (left to right) (Central Western Okinawa). The left axis indicates the severity of UV radiation index. The colors in (A) represents the monthly UV index value and as per the Standard JMA color scale. The dashed line indicates the threshold for extreme UV radiation index; (B) Total sunshine duration and mean solar radiation. Each bar represents the total amount of hours of sunlight for every month (at Nago), and each marker represents the monthly mean global solar radiation (at Naha). The bars go from left to right under each month (2017 to 2020). The data and figures are adapted and modified from JMA.
Diversity 14 00032 g004
Figure 5. Associations between the sites surveyed in this study (2017–2020) and the occurrence of BBD, GAs, and BBD + GAs (i.e., both diseases occurring at the same time/comorbidity) on encrusting Montipora colonies, as well with the presence of healthy Montipora colonies (unaffected by BBD or GAs). Circle sizes and color intensity represent the strength of the association. Blue color = positive associations (i.e., higher occurrence), Red color = negative associations (i.e., lower occurrence).
Diversity 14 00032 g005
Figure 6. Prevalence of BBD (black) and GAs (grey) on encrusting Montipora spp. around Sesoko Island. Yellow: healthy Montipora colonies, red: heavily bleached or seriously damaged colonies, maroon: dead colonies; green: pale and/or slightly damaged; * NS sites (A) 2017 (B) 2018 (C) 2019 (D) 2020. Only >5% outbreak prevalence [66] for BBD and GAs are shown.
Diversity 14 00032 g006
Figure 7. BBD occurrence on encrusting Montipora colonies within RE site S12 (south of Sesoko Island) during summer 2018 (yellow circles indicate BBD infected colonies). Scale: approximately 30 cm. Photograph: Rocktim Ramen Das.
Diversity 14 00032 g007
Figure 8. Bars represent mean BBD progression rates on encrusting Montipora colonies from June to December 2020 with associated seawater temperatures (black dashed line and triangle markers). (Spearman’s r (57) = 0.3, p = 0.02) and light intensity (black line with red square markers). Typhoons Maysak and Haishen occurred in September 2020. Seawater temperatures were obtained from loggers at sites S4 and S11. Light intensities were calculated by obtaining maximum light for each day and then calculating their monthly averages. Numbers inside the bar represent the mean BBD progression greater than the mentioned value (Supplementary file Figure S3).
Diversity 14 00032 g008
Figure 9. Encrusting Montipora survives BBD (A) 20 July 2018, orange arrows show BBD, yellow arrows show colony growth direction. (B) 7 September 2020, white X shows no tissue, BBD absent (orange arrows), yellow arrows indicate growth direction, white arrow indicates Montipora outcompetes nearby corals, red arrows indicate nearby healthy Montipora competing for growth. Scale bars: 5 cm. Photograph: Rocktim Ramen Das.
Diversity 14 00032 g009
Figure 10. Observations of BBD (yellow arrow) and GA (white arrow) on the same colony of encrusting Montipora in site S1 in October 2017. Photograph: Rocktim Ramen Das.
Diversity 14 00032 g010
Table 1. Encrusting Montipora assigned categories.
Coral ConditionDescriptionAdditional References
HealthyColony with normal coloration; no signs of disease.Sakai et al., 2019; Kubomura et al., 2020
Dead/turf algaeEntire colony dead and/or with turf algae
Colony dead.
Yamashiro et al., 2000; Kubomura et al., 2020
Heavily bleached or seriously damagedColonies alive, but almost completely bleached, or dead tissue constituting 50% or more of colony surface.Nakamura, 2017; Sakai et al., 2019; Kubomura et al., 2020
Pale and/or slightly damagedColonies showing signs of stress with faded colony color or dead areas below 50% of total colony surface, including presence of fish bites.Sakai et al., 2019; Kubomura et al., 2020
Black Band Disease (BBD)Active signs of black cyanobacterial mat present on colony.Weil et al., 2012; Yamashiro, 2016; Wada et al., 2017
Growth Anomalies (GAs)Abnormal growth of coral tissue; tissue with GAs may have abnormal coloration.Yamashiro et al., 2000; Weil et al., 2012; Wada et al., 2017
BBD + GAsColony consisting of both GAs and BBD either separately or BBD lesion growing over GAs.
Table 2. Summary of different types of data collected in this study with respective locations and time.
Data CollectedMethodologyPeriodLocation(s)/Site(s)
BBD and GA prevalenceFree swimming2017–2020 (June to October)S1–S8 (2017); S1–S12 (2018–2020)
BBD progressionPhotograph of permanent plots and tagged colonies 2020 (June to December)S4, S6
Colony count and host coverage1 m2 quadrats haphazardly placed and photographed 2020 (July) S5; S6; S11; S12
Environmental parametersIn-situ and ex-situ HOBO data logger; JMA2017–2020 (June to October/December)S4; S6; S11 (Water Temp Pro V2, Pendant temp/light); Sesoko Station (Pendant temp/light; 2020); UV Index (Nakijin/Motobu area); Solar Radiation (Nago/Naha area)
Publisher’s Note: MDPI stays neutral with regard to jurisdictional claims in published maps and institutional affiliations.

