Article

Trade-Off Relationships of Leaf Functional Traits of Lycium ruthenicum in Response to Soil Properties in the Lower Reaches of Heihe River, Northwest China

1
School of Life Science and Engineering, Lanzhou University of Technology, Lanzhou 730050, China
2
Key Laboratory of Land Surface Process and Climate Change in Cold and Arid Regions, Northwest Institute of Eco-Environment and Resources, Chinese Academy of Sciences, Lanzhou 730000, China
3
Department of Plant Biology, Rutgers University, New Brunswick, NJ 08901, USA
*
Author to whom correspondence should be addressed.
Diversity 2021, 13(9), 453; https://doi.org/10.3390/d13090453
Submission received: 15 August 2021 / Revised: 17 September 2021 / Accepted: 18 September 2021 / Published: 21 September 2021
(This article belongs to the Section Plant Diversity)

Abstract

:
Soil properties affect plant growth and cause variation in leaf functional traits. Lycium ruthenicum Murray is one of the desert dominant shrubs and halophytes in the lower reaches of Heihe River, Northwest China. We analyzed the trade-off relationships of 14 leaf functional traits of eight L. ruthenicum populations growing at varying distances from the river and discussed the effects that soil properties have on leaf functional traits. The results showed that: Lower leaf nitrogen (N) content indicated that L. ruthenicum was located at the slow investment–return axis of the species resource utilization graph. Compared with non-saline and very slightly saline habitats, populations of slightly saline habitats showed a higher carbon to nitrogen ratio (C:N). Redundancy analysis (RDA) revealed a relatively strong relationship between leaf functional traits and soil properties, the first RDA axis accounted for 70.99 and 71.09% of the variation in 0–40 and 40–80 cm of soil properties. Relative importance analysis found that in the 0–40 cm soil layer, leaf traits variations were mainly influenced by soil moisture (SWC), HCO3 and CO32− ions content, while leaf traits variations in the 40–80 cm soil layer were mainly influenced by HCO3 and SO42−. L. ruthenicum has a foliar resource acquisition method and a resource conservation trade-off with a flexible life history strategy in habitats with drought and salinity stress. In the shallow soil layers, water affects leaf traits variation greater than salt, and in both shallow and deep soil layers, HCO3 plays a dominant role on leaf traits. This study provides insights into the adversity adaptation strategies of desert plants and the conservation and restoration of arid-saline ecosystems.

1. Introduction

Plant functional traits are defined as measurable morphological, physiological and phenological features that are related to individual adaptations [1], to the environment and plant communities in which they grow [2]. In addition, they have become the research focus in current ecological studies, which aim to clearly link the phenotype [3] and chemiotype [4] differences of individual plants to ecosystem processes and services [5,6]. Leaves are the main organs of plant photosynthesis and biomass production and are the energy converters of primary producers in the ecosystem [7]. Leaf traits are often considered to be parameters of prime importance in response of plant species to their environments [8]. The well-known “leaf economics spectrum” reveals a trade-off between the quick and slow return of investments of nutrients and dry mass that operates independently of biome, growth form or plant functional types. By analyzing six leaf traits, including leaf mass per unit area (LMA), photo-assimilation rate (Amass), leaf N content, leaf P content, leaf dark respiration rate (Rmass) and leaf life span (LLS), they described the trade-off strategy between leaf investment and return [9].
Among many soil properties, moisture and salinity are important factors that can affect plant growth and cause variations in leaf functional traits [10]. In arid environments, drought exerts a strong selective pressure on morphological-chemical traits and plant life history strategies [1,11,12]. Salinity is one of the major limiting environmental factors for plant growth, development, productivity and distribution patterns [13,14,15]. Excessive accumulation of salt in the soil imposes physiological limitations on plants, including osmotic stress, ion imbalance, oxidative stress and photosynthesis damage, hence affecting plant growth [16,17,18]. Salt stress is exacerbated by the impact of human over-exploitation and initial lack of water in the desert-oasis eco-interlaced zone in arid and semi-arid regions [19]. Plant growth rate, leaf area and biomass accumulation are decreased by severe moisture and salinity stress [20]. However, previous studies suggest that appropriate saline conditions can enhance the biological carbon fixation of halophytes [21]. In summary, possibly due to ecosystem degradation over past decades, plant responses to stress have received much attention, but the adaptive strategies of halophytes and their tolerance towards drought and salinity stresses remain less understood.
In this study, we investigated an approximately 17 km long north–south transect of the lower reaches of the Heihe River in Northwest China. The leaf water physiological and ecological stoichiometry traits of eight L. ruthenicum populations, as well as the soil moisture and salinity where they were growing, were measured. The objective of the study was to explore: (1) the trade-off strategies between leaf functional traits under drought and salinity stress conditions; (2) the relationship between leaf functional traits and soil factors; and (3) identify the major environmental factors that affecting plant functional traits.

2. Materials and Methods

2.1. Study Area

The Heihe River is an inland river located in an extremely arid and fragile ecological environment in northwestern China, lying at 98°00′–101°30′ E, 38°00′–42°30′ N, covering an area of 13 × 104 km2 and length of 821 km. This area has extreme arid climate, wind erosion, overgrazing and sand burial, which extends from the upstream area to the downstream area and forms unique desert ecosystem and species composition [22]. The Ejina desert area is located in the lower reaches of the Heihe River Basin. According to the data of the Ejina Weather Station from 1957 to 2019, the annual average temperature is 8.77 °C, the relative humidity is 33.9%, annual precipitation is only 37.40 mm and the annual evaporation is 3390.26 mm. The plant communities are characterized by low species diversity, being mainly composed of drought- and salt-tolerant desert plants that are distributed throughout the lower reaches of Heihe River. The main shrub species are: Lycium ruthenicum Murray, Tamarix chinensis, Nitraria tangutorum Bobrov and Alhagi sparsifolia [23]. Among them, the coverage of L. ruthenicum reaches about 20% and is the dominant species here. The soil of the entire Heihe River series contains brown calcium, desert calcium, salt and sand [22]. The content of soil organic carbon (SOC) is 0.18 ± 0.02%, soil total nitrogen (TN) is 0.26 ± 0.03 g kg−1 and soil total phosphorus (TP) is 0.30 ± 0.05 g kg−1 [24].

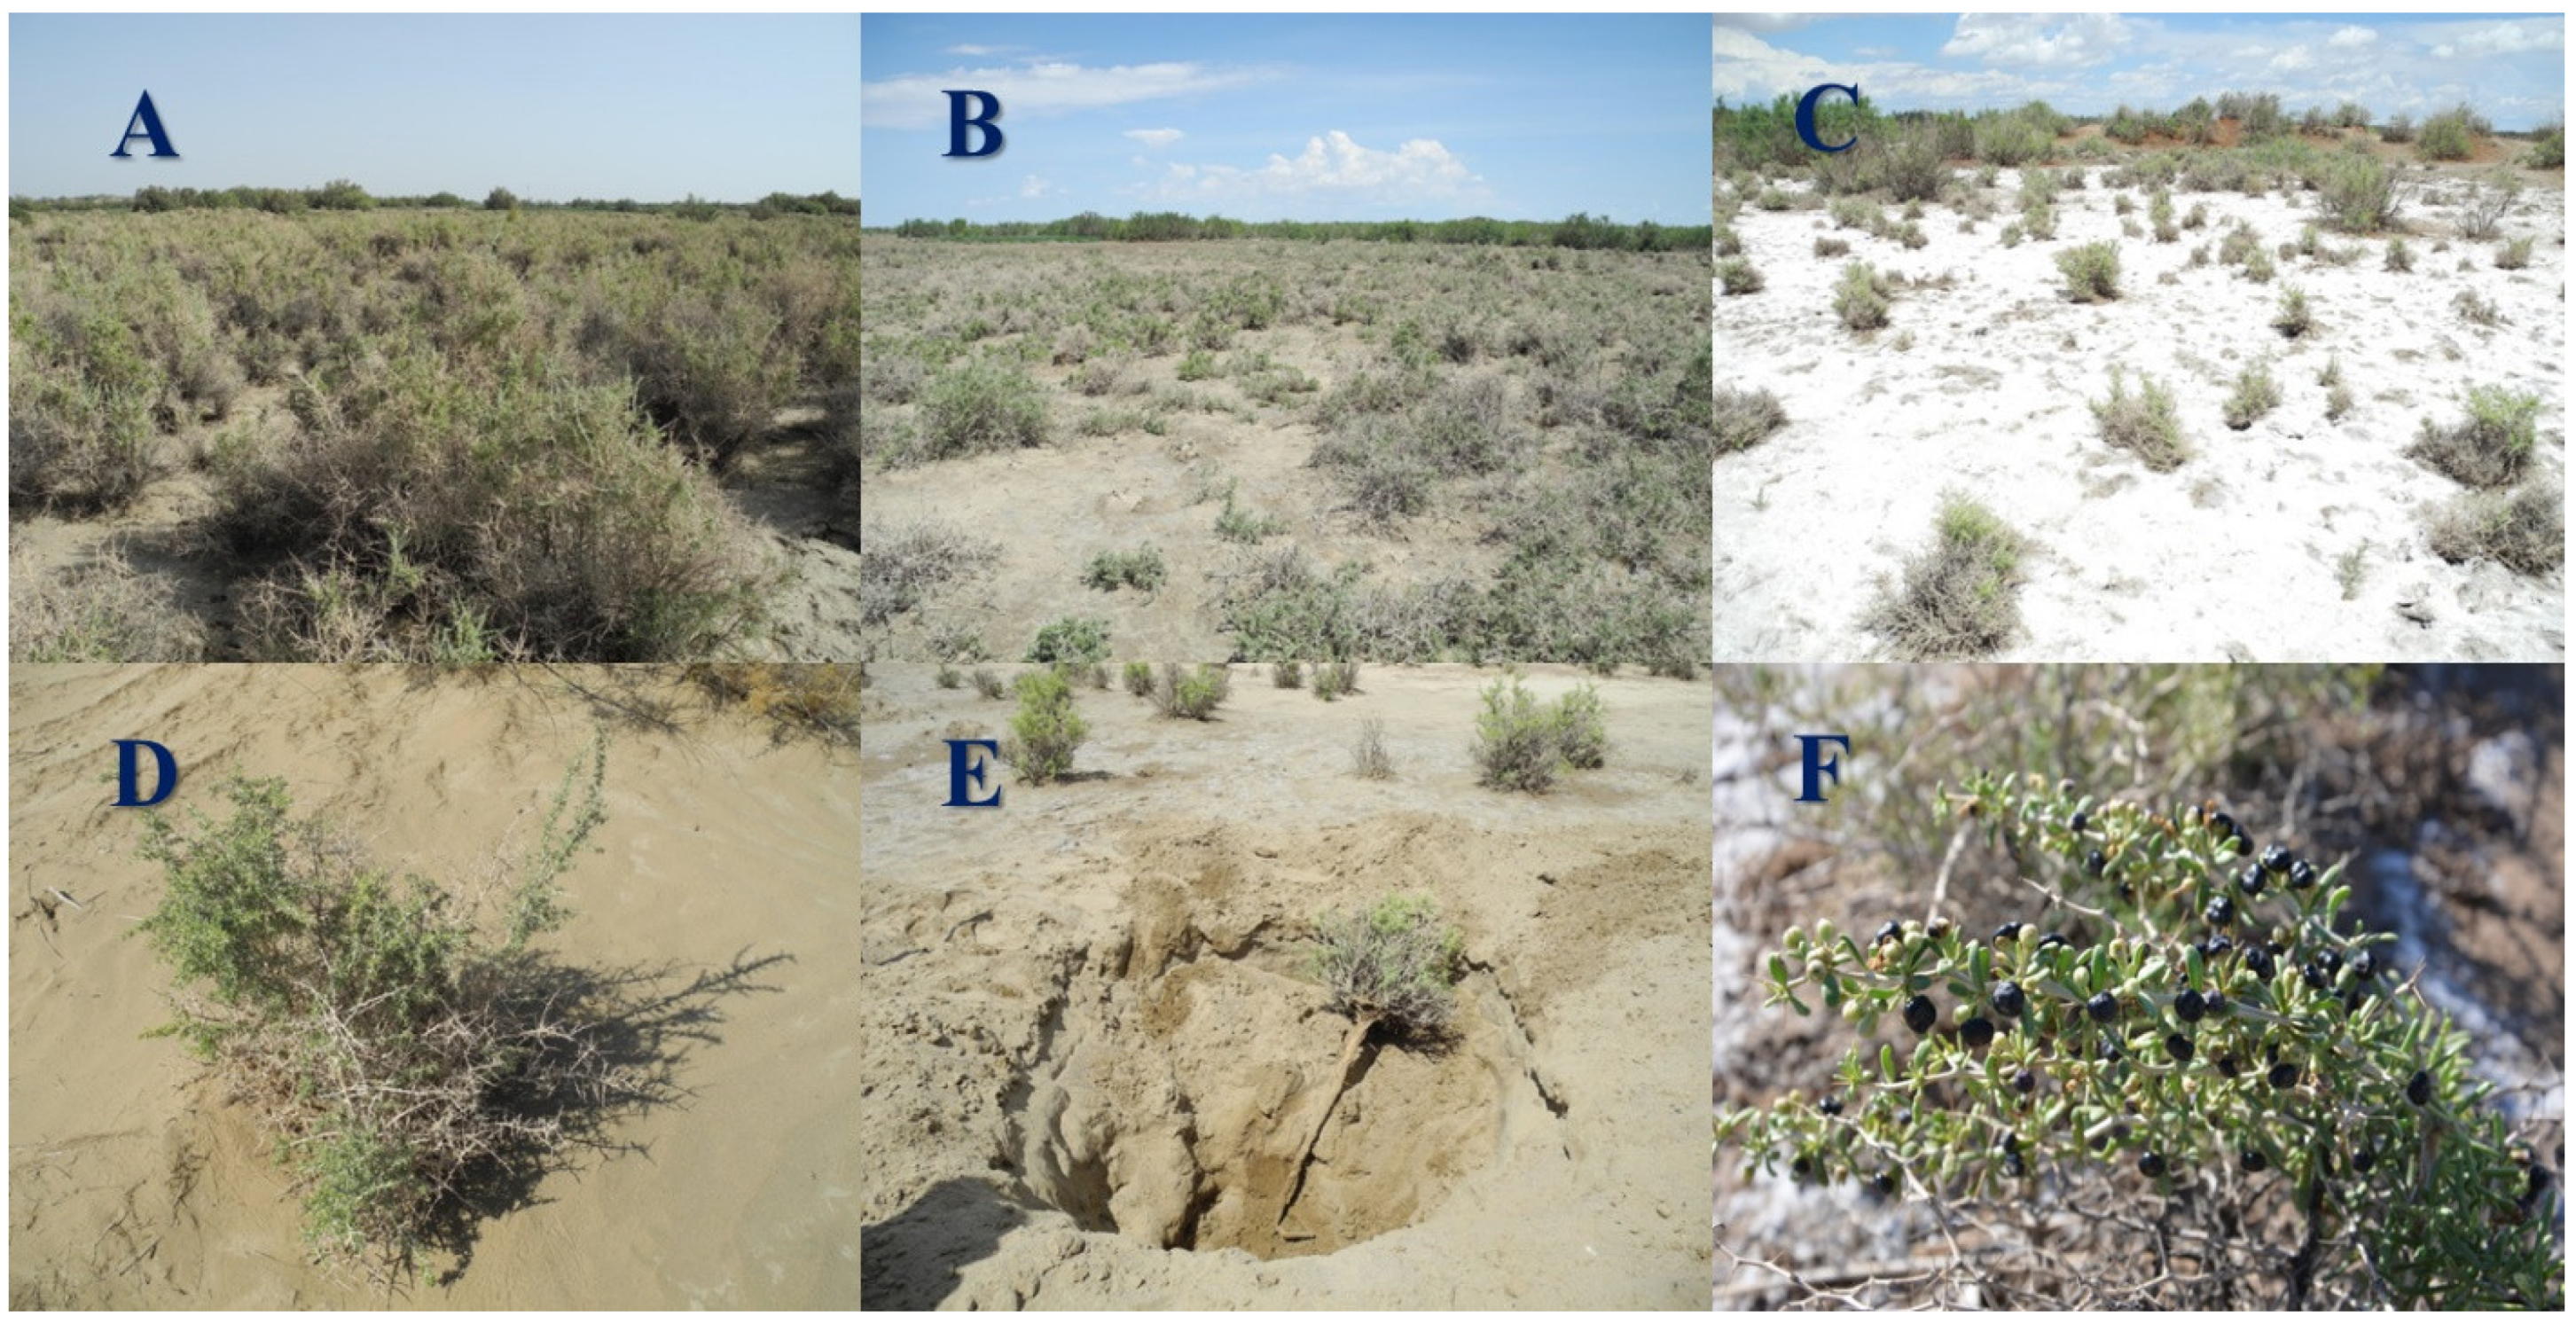
2.2. Sampling Protocol and Community Characteristics

This study was conducted in early August 2018 within a 17 km long north to south transect in the lower reaches of the Heihe River Basin. The nearest two of the eight habitats were 0.5 km apart and the farthest straight-line distance was 10 km. All collected plant materials were in a unified development stage, which is in August when the biomass reaches the maximum, and the community survey in this period can represent the characteristics of the desert plants. The study area was flat and far from any villages. We selected eight habitats of L. ruthenicum growing in different moisture and salinity conditions from near to far and vertical with the main river channel (see Figure 1). The main distribution areas and plant habitat types are shown in Table 1 and Figure 1. Three plots (5 × 5 m) were established within each selected habitat and their geographic information (latitude, longitude) was recorded with the eXplorist 510GPS device (Magellan, CA, USA). Fully expanded mature leaves (n > 30) at sunny side were randomly collected from 15 individuals for each L. ruthenicum sampling plot, and all foliage sampled from each plot was mixed as one independent sample for further analysis. There were not any signs of herbivory or pathogen infestation on the leaves.

2.3. Determination of Leaf Water Physiological and Stoichiometric Traits

Water is the key factor affecting the growth of desert plants in arid areas, so we chose physiological traits related to water to interpret the change pattern of leaf functional traits in 8 habitats. Calipers with an accuracy of 0.02 mm were used to measure leaf thickness (LT, mm). Leaf area was determined via a combination of an EPSON DS-1610 scanner and the ImageJ software [25]. Specific leaf area (SLA) was calculated as leaf area per unit dry mass, specific leaf volume (SLV, leaf volume per unit dry mass) was determined by a drainage method using a 10 mL cylinder; the specific operation was to inject an appropriate volume of purified water, put in the chopped leaves and observe the volume of the liquid level rising. Leaf dry matter content (LDMC) calculated by leaf dry mass per unit fresh mass. The degree of leaf succulence was measured by subtracting the dry weight from the 6 h saturated fresh weight, then dividing the resulting number by the surface area (Suc, g cm−2). Leaf tissue density (the ratio of leaf dry weight to volume, LD, g cm−3), relative water content (RWC, %) and total water content (TWC, %) were determined by drying [26].
Except for the LT measurement performed in the field, the other leaves were divided into two groups. One group was used to measure SLA and SLV, and the other group was used to measure moisture and other properties. Leaf samples were then brought back to the laboratory and dried at 80 °C for 48 h to reach a constant weight in order to measure the other characteristics. Dried leaves were ground to a 0.15 mm powder using a pulverizer in order to measure the leaf carbon (C), nitrogen (N) and phosphorus (P) contents and calculate the stoichiometric ratio. C content was determined using the K2Cr2O7-H2SO4 external heating method in oil bath. N content was determined by the semi-automatic Kjeldahl procedure, which involves digestion with concentrated H2SO4 followed by measurement of NH3 on an auto analyzer (Hanon K9840, Jinan, China). P content was determined by digestion with H2SO4-H2O2 followed by measurement with the molybdenum antimony method.

2.4. Measurement of Soil Moisture, Salinity and Ion Contents

Three soil plots were taken next to the plant individuals of each L. ruthenicum habitats and then two layers of soil samples, 0–40 and 40–80 cm, respectively, were collected. The underground biomass of L. ruthenicum is mainly concentrated in the range of 0–80 cm of the soil, so we chose these two soil layers to reflect their growth characteristics (Figure 1). No rainfall within one week before sampling. The samples were first passed through a 2 mm screen to remove roots and other impurities and then dried at 80 °C for soil moisture content (SWC) analysis. Electrical conductivity (EC) was measured using a DDS-307a portable conductivity meter (Leici Instrument, Shanghai, China). We had previously established the standard curve between the soil salinity and electrical conductivity of saline-alkali soil in the study area as y = 217.73x−22.723 (R2 = 0.994), which was used to calculate soil salinity. The unit of soil salinity was g kg−1. Soil samples were analyzed within 20 days of collection for carbonate (CO32−), bicarbonate (HCO3), chloride (Cl), sulfate (SO42−), sodium (Na+), potassium (K+), calcium (Ca2+) and magnesium (Mg2+) content following the methods described by the US Salinity Laboratory Staff [27].

2.5. Statistical Analysis

One-way analyses of variance were conducted using the SPSS 19.0 Software to compare site characteristics between sites as well as leaf functional traits between populations, post hoc Tukey HSD tests and Levene statistic were used to check for variance homoscedasticity, sig > 0.05. The Shapiro–Wilk test was performed to check for data normality. R3.5.2 was used for RDA to check the distribution pattern of plant functional traits in the environmental gradients of different soil layers. Trait data was processed by Hollinger method and soil data was logarithmic transformed before computing the RDA. Pearson correlations between plant functional traits were performed using the Performance Analytics package of the R statistical software [28]. “Relative importance analysis” refers to the quantification of an individual regression’s contribution to a multiple regression model [29].

3. Results

3.1. Leaf Functional Traits in Different Populations of L. ruthenicum

The difference and variation between L. ruthenicum functional traits at eight moisture and salinity sites are listed in Table 2. Greater leaf thickness appeared in slightly saline silt desert site VII which was significantly different from non-saline gravel desert and sand desert sites I and VI. In addition, larger SLV, Suc, TWC and RWC traits were also found to appear at saline sites. Conversely, LDMC, LD and N contents exhibited were lower in saline sites. The leaf N concentration was the least variable between regions, which still showed the effects of obvious saline stress on L. ruthenicum. Statistical analysis showed that the adaptability of L. ruthenicum N:P to drought and salt stress was more stable among eight habitats than C:N and C:P. Moreover, no significant difference in SLA values between the eight habitats can be found, indicating that intra-specific variation in SLA at finer ecological scale was minimal or non-existent.

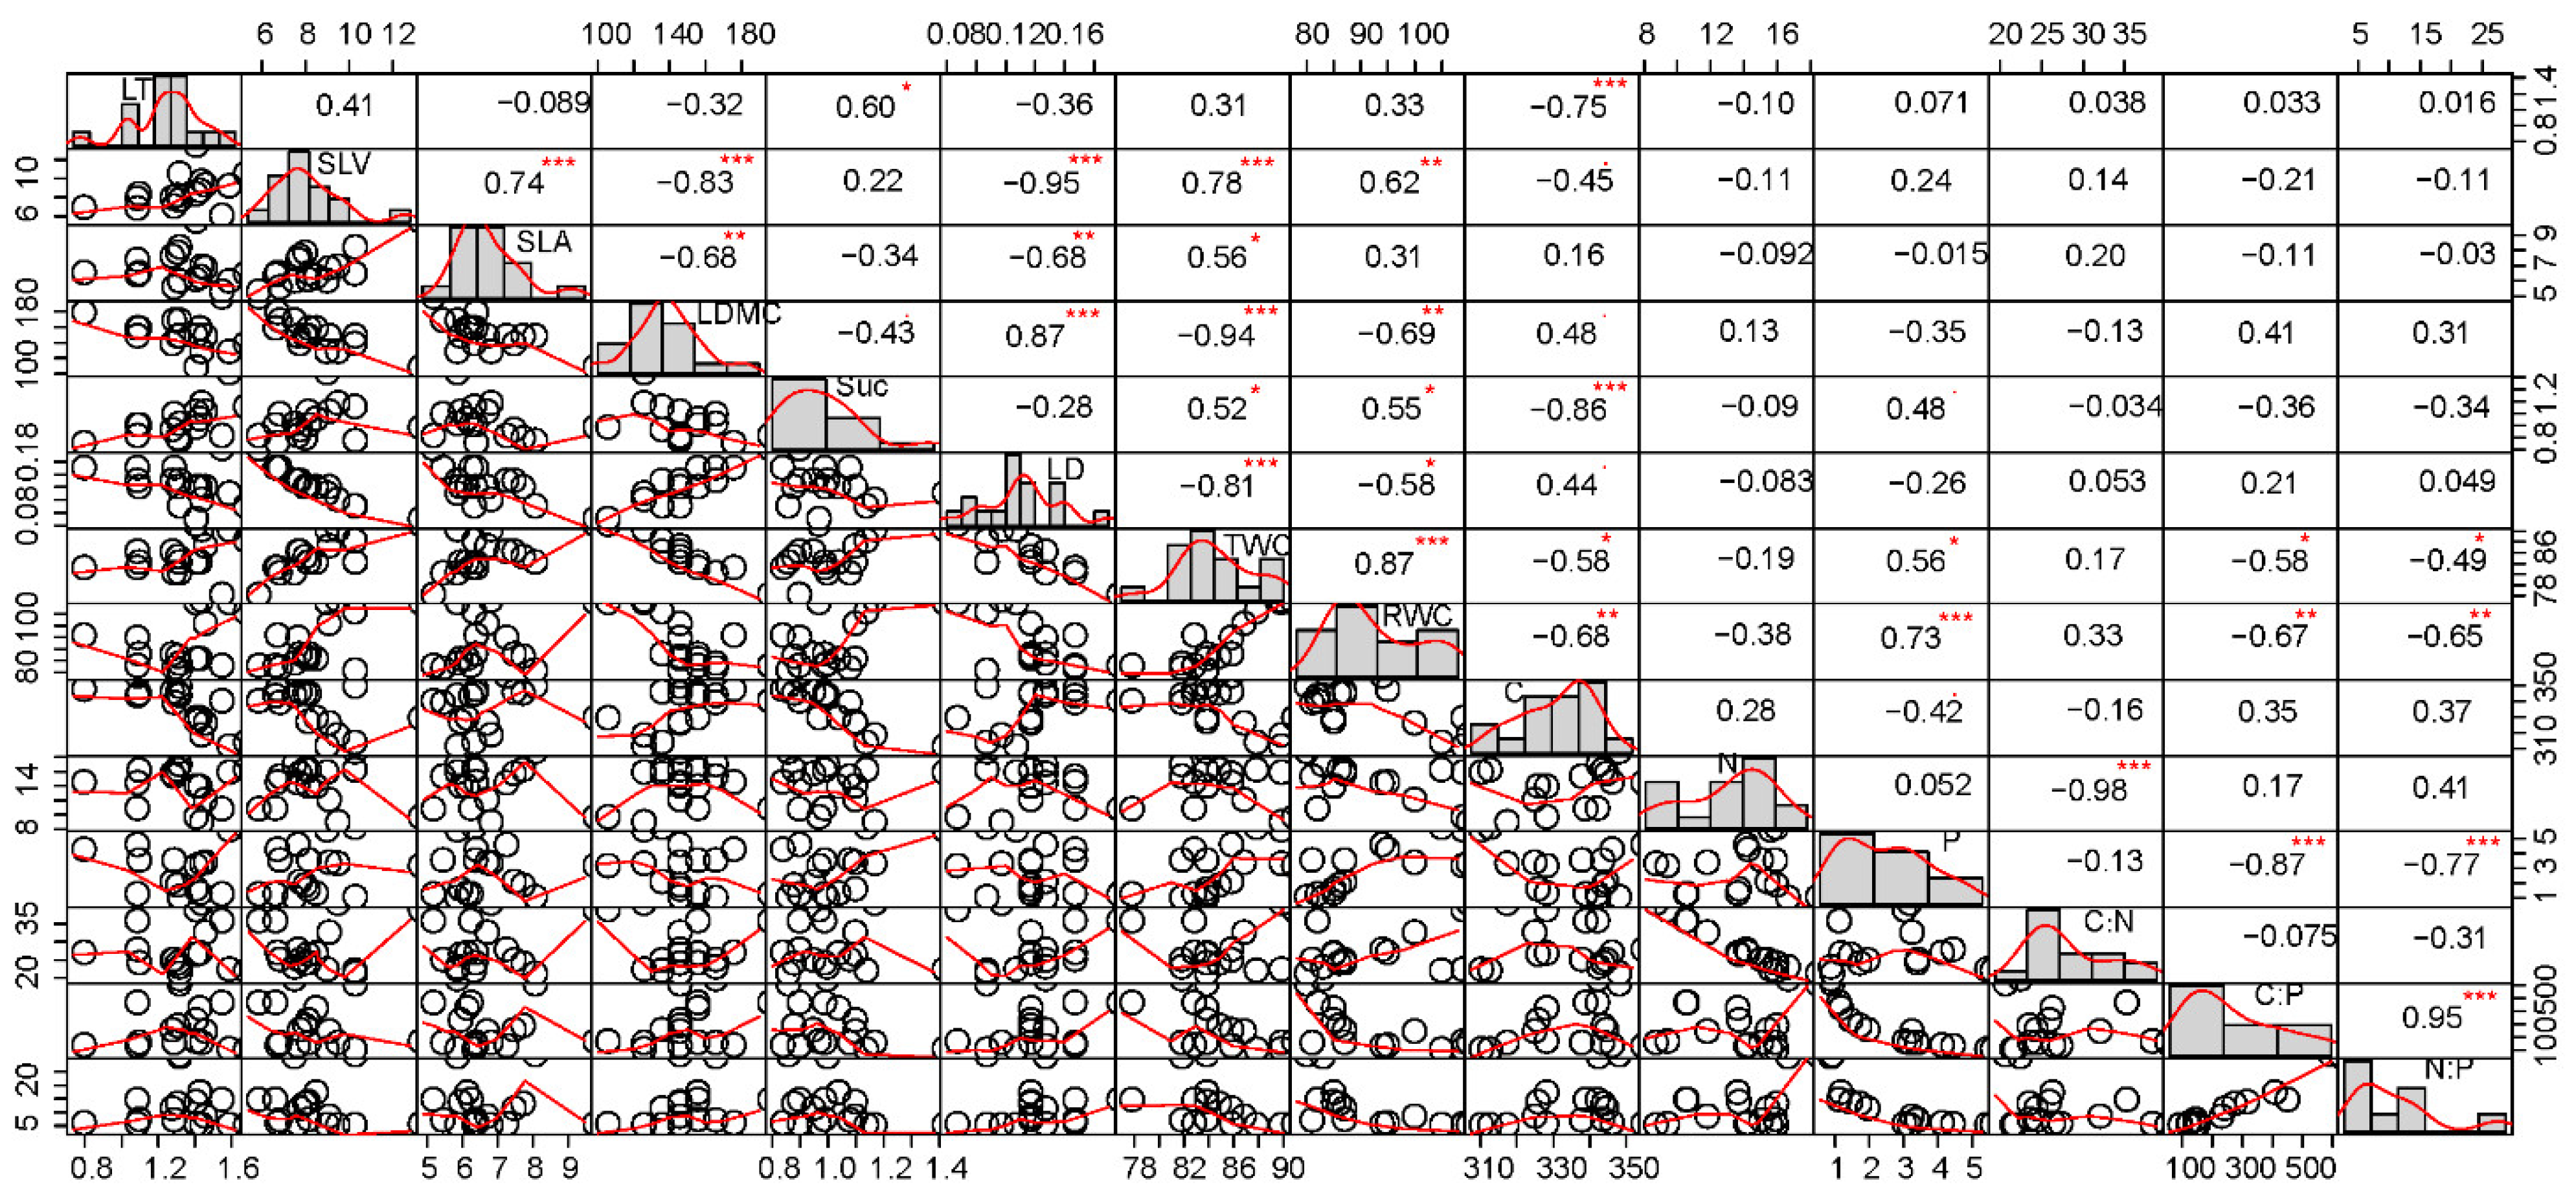
3.2. Correlation between Leaf Functional Traits of L. ruthenicum in Eight Habitats

As is shown in Figure 2, correlation coefficients between 14 leaf functional traits of L. ruthenicum can be concluded from our study. The LT and Suc are both negatively correlated with the C content (p < 0.001 for both) and the SLA is also negatively correlated with LDMC and LD (p < 0.01). Besides, we have found that the SLV is positively correlated with SLA, TWC and RWC (p < 0.01) significantly, yet negatively correlated with LDMC and LD (p < 0.001), of which the LDMC is positively correlated with LD, yet negatively correlated with TWC and RWC (p < 0.01). TWC, as a leaf total water content, was found to be negatively correlated with LD, yet positively correlated with RWC (p < 0.001), which proved to be positively correlated with the P content but negatively correlated with the C content, N:P and C:P ratios, respectively (p < 0.01).

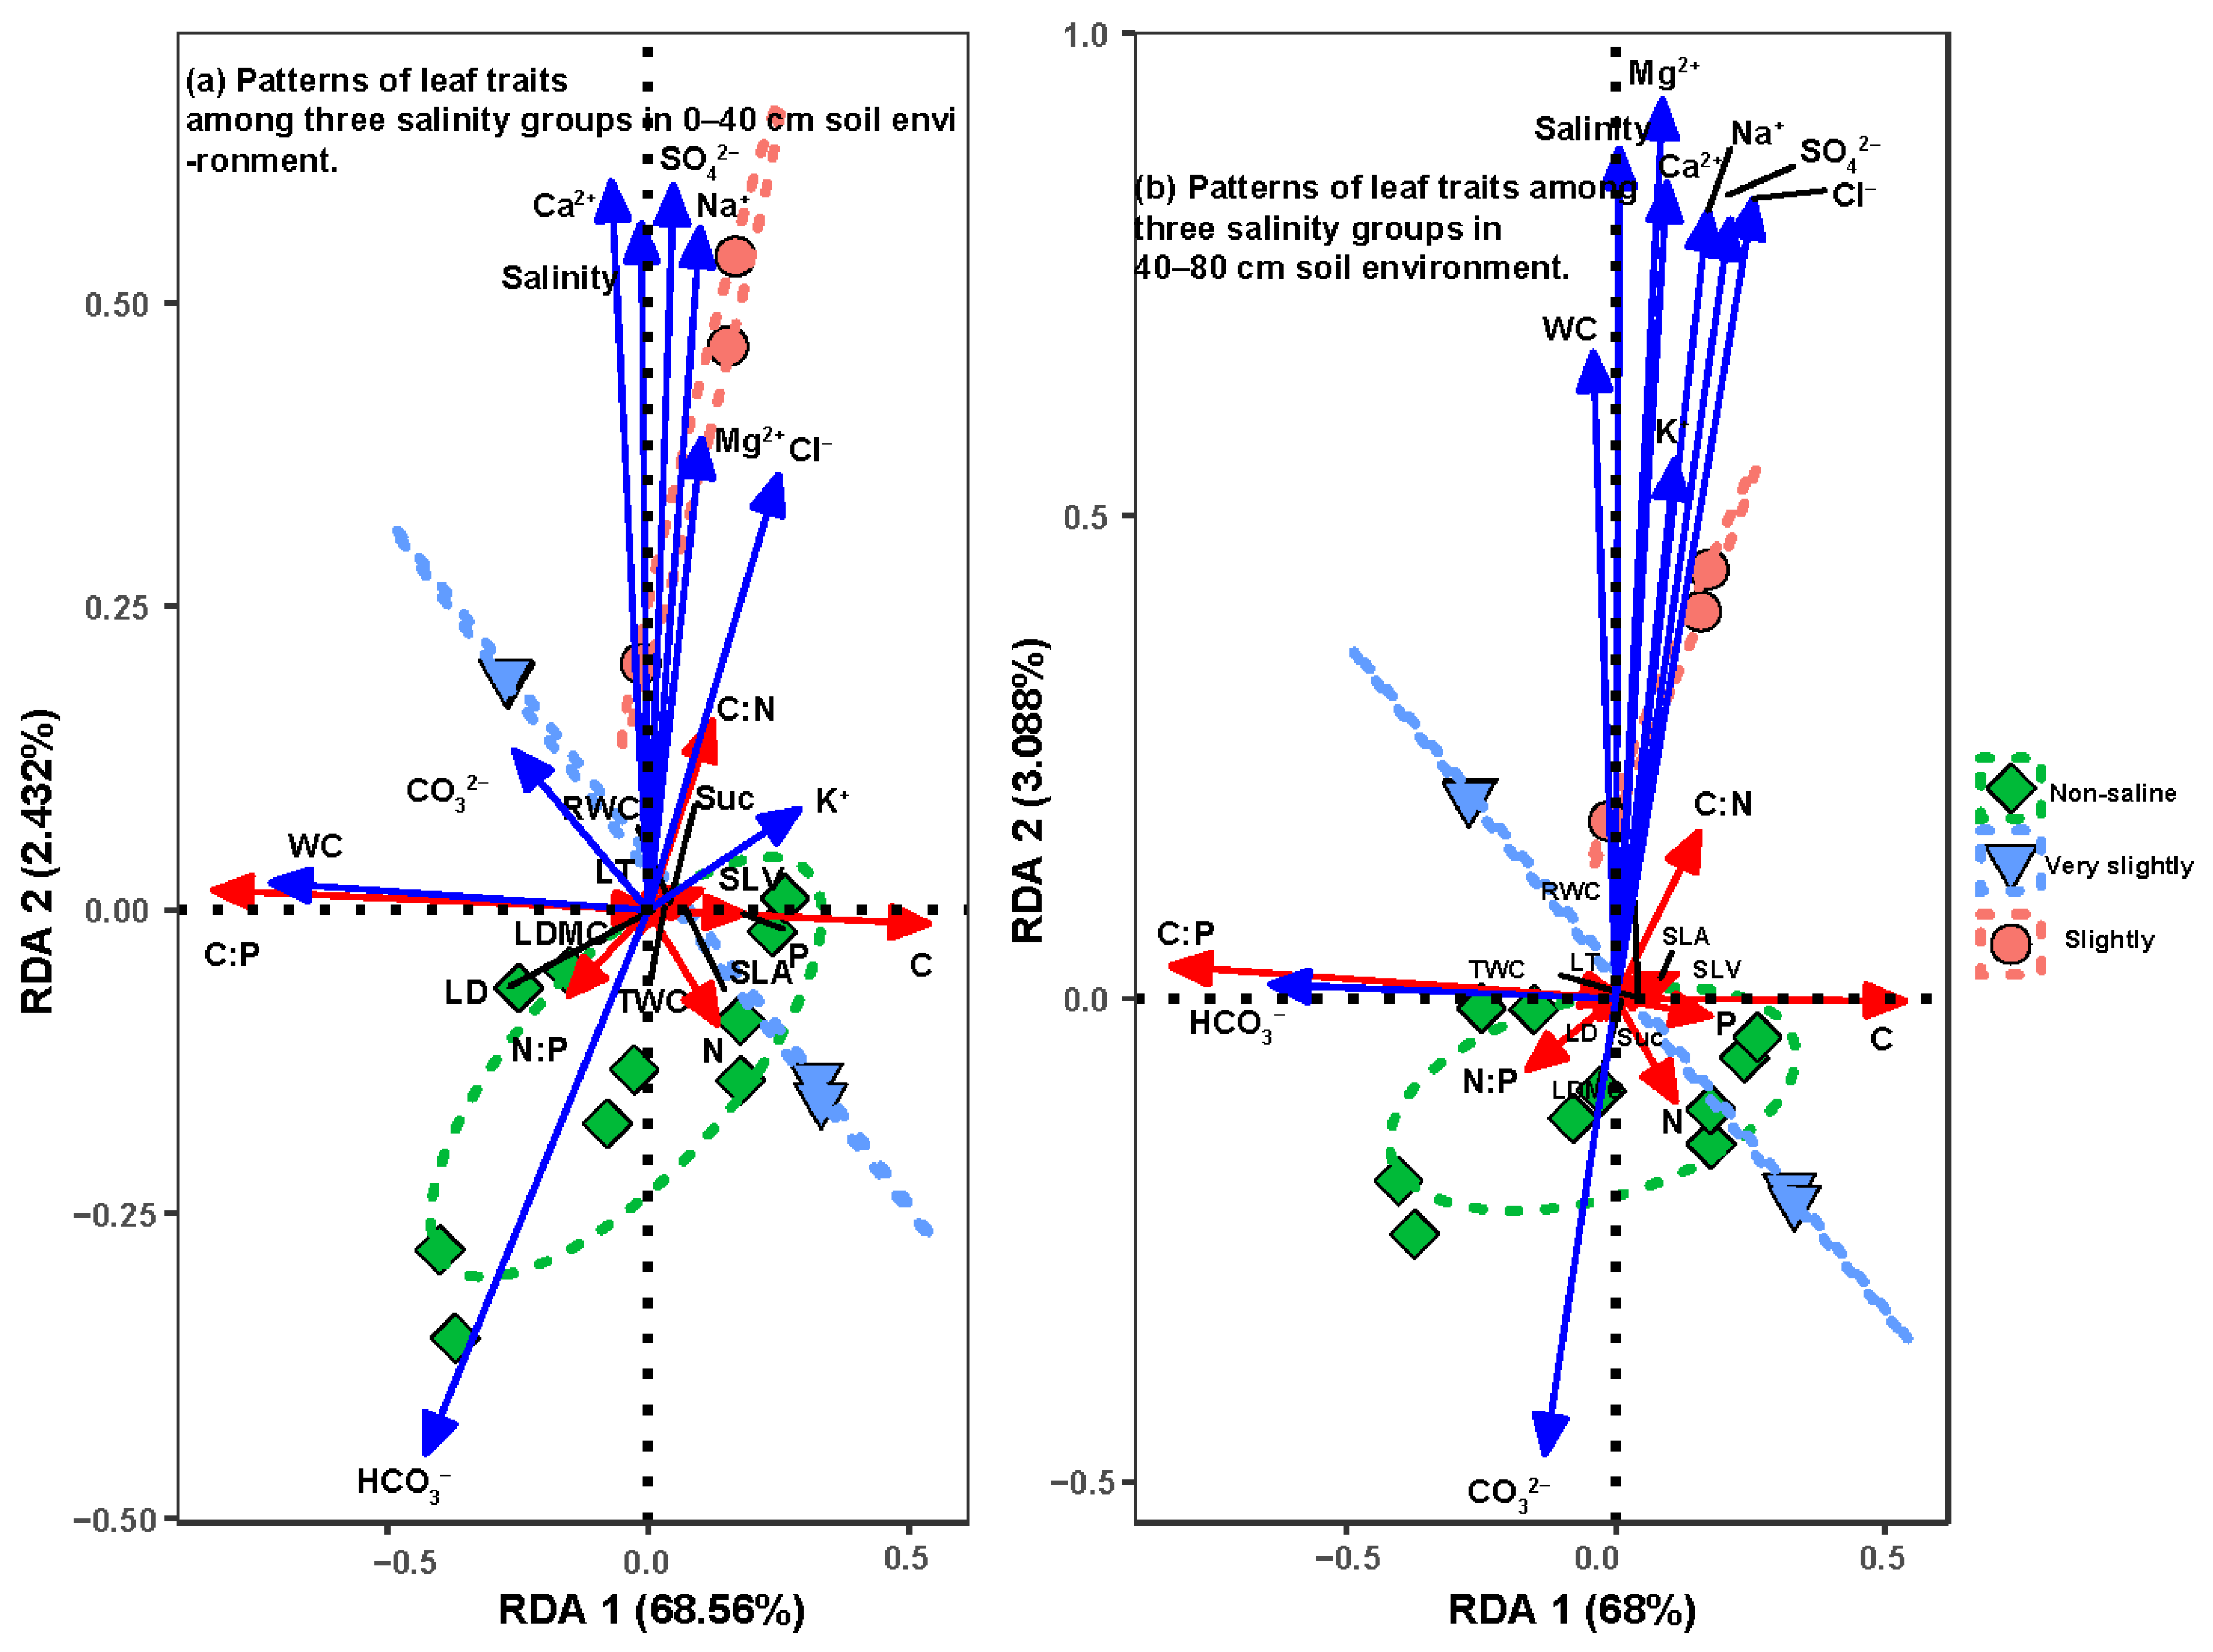
3.3. RDA of Leaf Functional Traits in Soil Moisture and Salinity Properties

RDA maps of two soil layers showed the distribution pattern of traits along the moisture and salinity properties (Figure 3). From non-saline to slightly saline habitats, populations had higher C:N ratios, lower N content and N:P ratios (see RDA vertical axis direction), but the vertical axis (RDA 2) only explained very low proportions of the data. In the horizontal axis, populations growing in higher salinity soils had lower C:P than growing in lower salinity soils (Figure 3, Table 2), while the distribution of other leaf traits did not change much with environmental variables. The 0–40 and 40–80 cm soil properties respectively explained 70.99 and 71.09% of leaf traits variation (the sum of the first two axes explained). Permutation tests for all canonical axes were not significant (0–40 cm RDA, Df = 10, F = 1.53, Pr (>F) = 0.31; 40–80 cm RDA, Df = 10, F = 1.56, Pr (>F) = 0.29 (Figure 2). In general, the spatial distribution of the eight habitats might be caused by variation of soil chemical characteristics. Populations I, II, III, IV and VI (see Table 1 and Table 2) were quite close to each other which may be due to their similarities in soil chemistry; the same was found in populations V and VII. However, population VIII was located away from the other populations, so its soil properties were likely to differe from the soil in other locations.

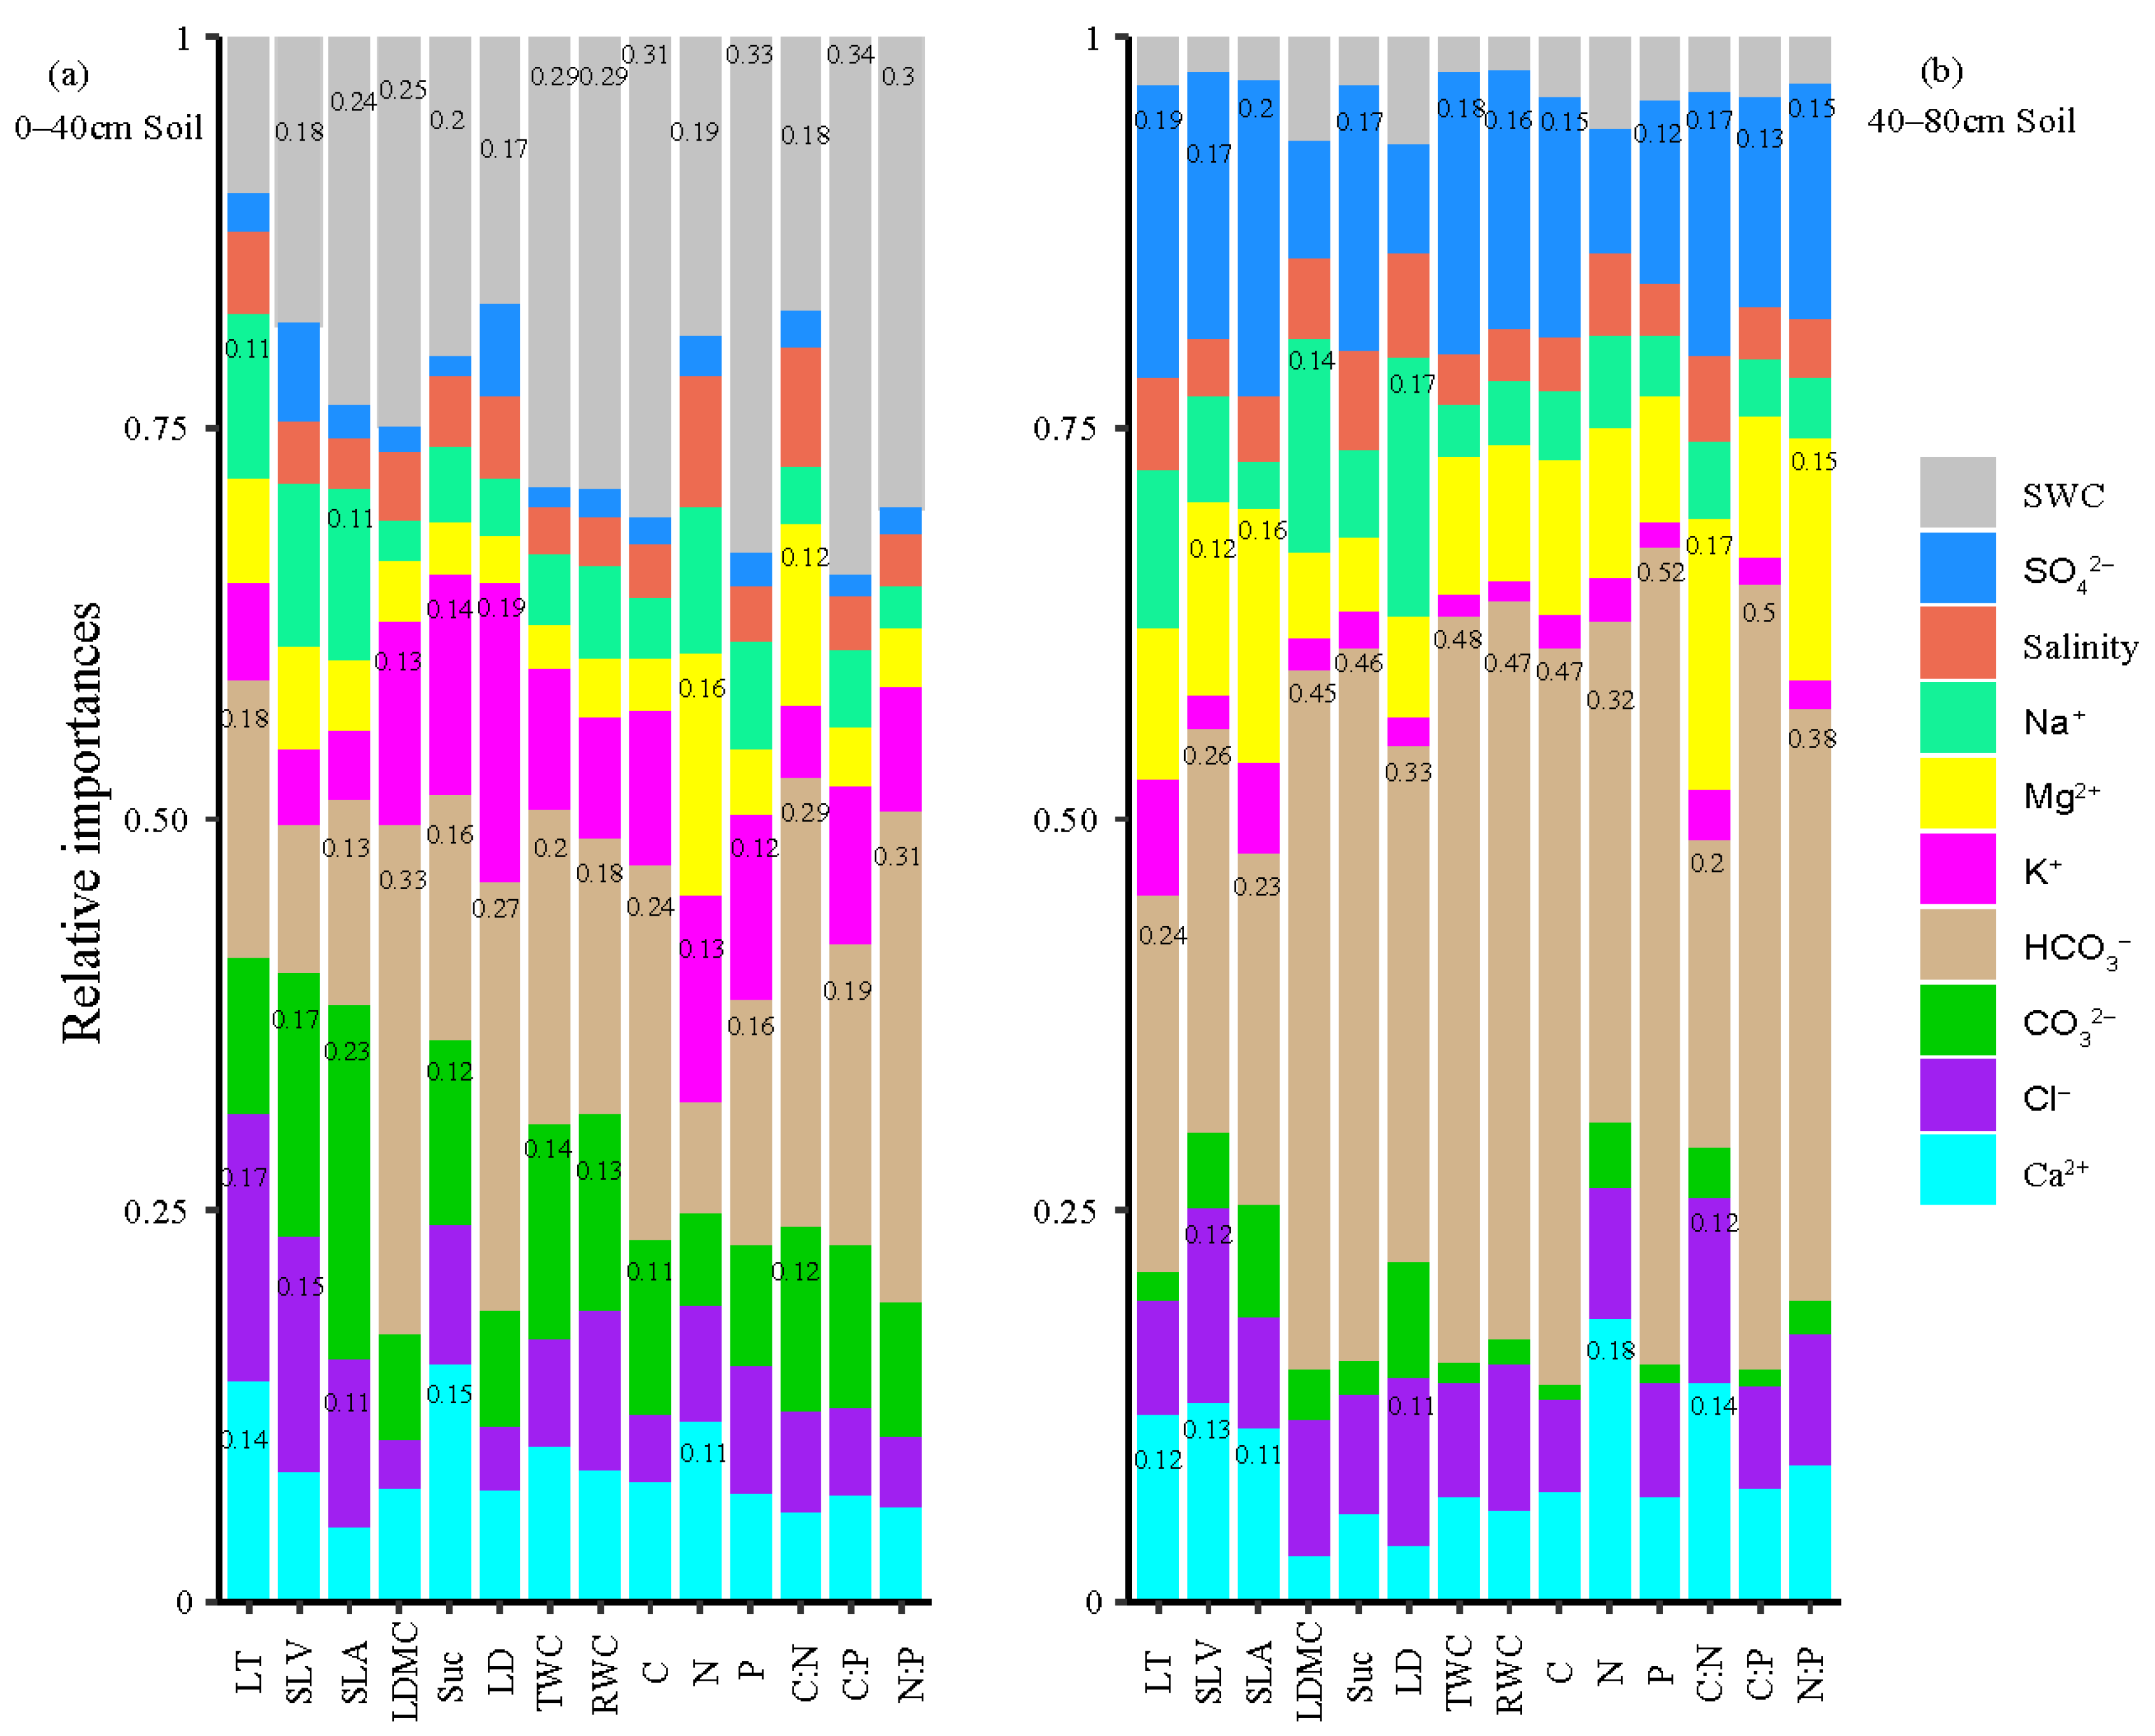
3.4. Relative Importance of Soil Factors to Leaf Functional Traits Variation

We were not only interested in the effects of total soil salinity on leaf functional traits, but also the exploration of how salt ions mostly affect plant functional trait formation and variation. In general, moisture, salinity and eight major ions corresponded to leaf traits variation in different amplitudes. In the 0–40 cm soil layer, leaf traits patterns were mainly influenced by SWC, HCO3 and CO32−, and their relative importance values for the 14 leaf traits are shown in Figure 4. The relative contribution of the 0–40 cm layer SWC to all but the LT trait was more than 17%. SWC affects the C:P ratios, with an importance of 34%. HCO3 was more than 13% important for all traits except SLV and N content. CO32− was less important for traits in comparison with SWC and HCO3. Soil salinity and other ions contributed relatively less to leaf traits. In the 40–80 cm layer, HCO3 and SO42− were the two main drivers for trait differentiation (Figure 4). The relative importance of HCO3 for all trait patterns was higher than 20% and its influence on P content was up to 52%. The influence of SO42− on traits was above 12%, except for LDMC, LD and N content, which were under 10%.

4. Discussion

4.1. Variations of L. ruthenicum Leaf Functional Traits in the Lower Reaches of Heihe River

This study has showed that the desert halophyte L. ruthenicum is characterized by low leaf SLA, LDMC, C content, N content and N:P ratios, as well as high LT, Suc, P content and C:N ratios. SLA is one of the key leaf traits related to plant carbon uptake strategy [30]; it could reflect the distribution of plants and their adaptation to different habitats [31]. LDMC mainly reflects the ability of plants to retain nutrients [32]. In addition, SLA and LDMC are proved to be the best variables for classifying plant species on the plant resource utilization classification axis [9]. This paper showed that L. ruthenicum is a resource reservation species due to its lower SLA and N content and higher C:N ratio, which also indicates that L. ruthenicum is in the “slow-return” end of the spectrum. Plants that invest in high LMA (leaf mass per area) have a slower photosynthetic rate, but a longer leaf life. Therefore, their slower income (carbon absorption) rate can be compensated by a longer income stream [9,33]. Furthermore, SLA and LDMC are two important soil-fertility predictors in addition to leaf N and P contents and N:P ratios [34,35,36,37]. The combination of these predictors indicates that soil fertility is lower in the lower reaches of the Heihe River and that the growth of L. ruthenicum is mainly restricted by N content. The P content of all eight L. ruthenicum populations was higher than that of the 753 terrestrial plant species in China [13,38], showing a fast decomposition of local minerals to ensure sufficient production of young leaves to thus reduce toxic salt ions accumulation of each leaf.
In stoichiometry, the contents and meanings of C, N, P with C:N, C:P, N:P ratios are different and independent. The former reflects the element content of plants, while the latter mainly reflects growth characteristics of plants. Prior studies have demonstrated the importance of C:N and C:P ratios, which play an important role in effectively reflecting the balance between competitive and defensive strategies [39]. When N and P contents are higher, C:N and C:P ratios are comparatively lower. Plants will be subject to competitive strategies at high photosynthetic rates. Conversely, high C content leads to high C:N and C:P ratios, showing how plants adopt a strong defensive strategy under low photosynthetic rates [40,41]. Results of this study indicate that L. ruthenicum has flexible adaption strategies in desert saline habitats: when soil salinity is higher, foliar N is lower and the C:N ratio is large, a defensive strategy is adopted; when N contents are higher and the C:N ratio is lower, a competitive survival strategy is adopted.
Leaf thickness (LT) is generally considered to be a very important leaf functional trait, which may connect with leaf life span, stress tolerance and litter decomposition rate [42,43]. Osmond et al. found that plant leaves are generally thicker in nutrient-poor environments; the LT trait pattern presented by Osmond et al. is consistent with previous research [44]. In order to adapt to harsh environments, succulent plants produce a large number of parenchyma cells in organs such as the leaves and stems. In eight habitats, L. ruthenicum shows a significant amount of succulence (Suc) used to store moisture in the arid and low-rainfall environments of the lower reaches of Heihe River. Leaves of L. ruthenicum belong to the succulent foliage group, which shows enhanced drought-tolerance when the water content (TWC) of a succulent becomes higher [45]. SLV is an important leaf trait according to the leaf characteristics of desert plants. RWC reflects the resistance of plants towards dehydration: higher RWC leads to stronger resistance to dehydration since the leaves have higher osmotic adjustment functions.

4.2. Trade-off Relationships between Leaf Functional Traits of L. ruthenicum

The existence of a fundamental trade-off between the rapid acquisition and the efficient conservation of resources has been discussed in the ecological literature for over forty years. However, it was only over the course of the last two decades that the availability of large data sets has allowed for the precise quantification and identification of the trait syndromes that can be used to characterize trade-offs for a wide variety of plants. For example, species with small SLA have thicker leaves or denser tissues, which allows for the maintenance of leaf function or delaying leaf death under very dry conditions.
Some fundamental relationships found in leaf economics spectrum research include a significantly positive correlation between LT and Suc, which confirms that succulent plants employ a water conservation strategy [42]. While a significantly negative correlation has been found between LT and C content, this can be related to the fact that thicker leaves cause a decrease in the SLA which affects carbon acquisition [46]. Some literature reports that SLA is actually a combination of leaf tissue density (LD) and leaf thickness (LT), since leaf tissue density is significantly positively correlated with leaf dry matter content (LDMC), leading to an equation: SLA = 1/(LD × LT) ≈ 1/(LDMC × LT) [46]. This paper did not show a significant relationship between SLA and LT, but demonstrated that SLA had a strongly negative correlation with LDMC and LD. The significantly negative correlation between LT and C content, as well as between SLA (SLV) and LD (LDMC), indicates a trade-off relationship between resource acquisition and resource conservation under drought and saline conditions.
LDMC and LD are positively correlated, with both being significantly negative correlated with TWC. Negative correlation of TWC, RWC and LDMC expresses another trade-off between the intracellular water content and nutrient accumulation due to photosynthetic CO2 assimilation, showing that leaf water content is a useful indicator of plant water balance. Suc is significantly positively correlated with TWC, RWC and P content, but strongly negatively correlated with C content. This confirms that leaf succulence can improve the energy returns from leaf investment by replacing expensive carbon structures with water [47].

4.3. To What Extent Does Soil Moisture and Salinity Affect Leaf Functional Traits?

In contrast to significant trait correlation patterns, there are only a few significant differences in the leaf traits of desert halophytes with different moisture and salinity habitats. In this paper, we found that SWC and HCO3 in the shallow soil layer is a good predictor of leaf traits. Between them, SWC has larger contributions to leaf P content, N:P ratio and C:P ratio while HCO3 has the greatest impact on LDMC; these can be inferred from previous research: in desert ecosystems, lower SWC coupled with higher soil alkalinity acts to decrease both soil N and P availability [48]. Due to this, SWC has a great impact on the levels of leaf P and N:P, and HCO3 affects the production of LDMC. The result was supported by other observations [49]. The changing C:P pattern along environmental gradients suggested that L. ruthenicum had a flexible life strategy under different environments.
In the deeper soil layer, HCO3, followed by SO42−, mainly influences leaf functional traits. In the RDA diagram, deep soil SWC has a negative effect on leaf N content and N:P but has a positive effect on leaf C:N. SWC does not obviously influence other functional traits. At the same time, the effects of soil salinity also converged with SWC. It can be concluded the hydraulic properties required for plant safety at higher salinity are at the expense of lower growth rates [50]. People already know a lot about the effects of salt stress on plants. The common sense is that salt stress reduces some transaminase activities, reduces plant N content and damages plant growth [51]. Therefore, the carbon fixation ability of the blade will also be reduced significantly, which is consistent with the low leaf C content phenomenon shown in this paper. Many studies have confirmed that salt stress, especially chloride salt stress, will inhibit a plant’s NO3 absorption, so the NO3 content in a plant’s leaves will decrease during salt stress [52,53]. However, some other studies have shown that the N content of succulent plants becomes larger as the salinity increases [13]. This discrepancy will require additional research in the future to resolve.
Salt stress limits the growth of halophytes through adverse effects on various physiological and biochemical processes. Conversely, halophytes respond to increased salinity by expanding in diversity [17]. Salinization consists of an accumulation of water-soluble salts in the soil, including the ions of K+, Mg2+, Ca2+, Cl, SO42−, CO32−, HCO3 and Na+. We tried to analyze this process using salt ions at different depths of soil. The RDA results show that SWC, HCO3, CO32−, SO42− and Cl can explain the variation of leaf functional traits well. Surprisingly, Na+ content could not explain the variation significantly, despite the importance of Cl and Na+ as mentioned in many salt stress studies [54,55,56]. According to our current knowledge, the soluble salts in the lower reaches of the Heihe River Basin are mainly Na+, HCO3, SO42− and Ca2+ [51]. However, there are few studies showing how these ions affect leaf functional traits and trade-off strategies, which may become our future research focus.

5. Conclusions

L. ruthenicum has a foliar resource acquisition and resource conservation trade-off with a flexible life history strategy in habitats with drought and salinity gradients. In shallow soil in saline-stressed arid environments, water has a greater effect than salt for leaf trait variation. In both shallow and deep soil layers, HCO3 ions have a relatively large effect on leaf properties. However, other larger scale studies are needed to determine the drivers of functional characteristics.
We concluded from our findings that: (1) the patterns of leaf functional traits in the desert halophyte L. ruthenicum in arid and saline environments have a tendency to display lower leaf SLA, LDMC, C, N content and N:P ratios, but higher LT, Suc, P content and C:N ratios, with leaf average N:P ratios <14, thus showing that soil fertility in the Ejina Desert is limited by nitrogen; (2) leaf traits of L. ruthenicum populations vary significantly according to soil environments in the habitats; and (3) L. ruthenicum has a foliar resource utilization trade-off with a flexible life history strategy in order to survive in environments with drought and salinity gradients. We believe that these findings will provide some baseline information to facilitate the management and restoration of arid-saline desert ecosystems.

Author Contributions

S.L. conceived and designed the experiments and revised the first draft; W.G. analyzed the data and wrote the draft; H.W. and W.G. performed experiments; J.F.W., G.W. and P.S. guided writing and participated in the survey. All authors have read and agreed to the published version of the manuscript.

Funding

This research was funded by National Natural Science Foundation of China, grant number 41961007; Science and Technology Department of Gansu Province, grant number 18YF1FA066; Lanzhou Science and Technology Bureau, grant number 2017-4-94.

Institutional Review Board Statement

Not applicable.

Informed Consent Statement

Not applicable.

Data Availability Statement

Not applicable.

Acknowledgments

We gratefully acknowledge the help from the Heihe River Research Station (CAS, China) for the field investigations. We would also like to thank Qiuwei Zhang for the modification of the manuscript language.

Conflicts of Interest

The authors declare that they have no conflict of interest.

References

  1. Violle, C.; Navas, M.L.; Vile, D.; Kazakou, E.; Fortunel, C.; Hummel, I.; Garnier, E. Let the concept of trait be functional. Oikos 2007, 116, 882–892. [Google Scholar] [CrossRef]
  2. Perrino, E.V.; Brunetti, G.; Farrag, K. Plant communities of multi-metal contaminated soils: A case study in National Park of Alta Murgia (Apulia Region-Southern Italy). Int. J. Phytoremediation 2014, 16, 871–888. [Google Scholar] [CrossRef] [PubMed]
  3. Harder, L.D.; Strelin, M.M.; Clocher, I.C.; Kulbaba, M.W.; Aizen, M.A. The dynamic mosaic phenotypes of flowering plants. New Phytol. 2019, 224, 1021–1034. [Google Scholar] [CrossRef] [Green Version]
  4. Perrino, E.V.; Valerio, F.; Gannouchi, A.; Trani, A.; Mezzapesa, G. Ecological and plant community implication on essential oils composition in useful wild officinal species: A pilot case study in Apulia (Italy). Plants 2021, 10, 574. [Google Scholar] [CrossRef] [PubMed]
  5. Bernhardt-Römermann, M.; Römermann, C.; Nuske, R.; Parth, A.; Klotz, S.; Schmidt, W.; Stadler, J. On the identification of the most suitable traits for plant functional trait analyses. Oikos 2008, 117, 1533–1541. [Google Scholar] [CrossRef]
  6. Westoby, M.; Wright, I.J. Land-plant ecology on the basis of functional traits. Trends Ecol. Evol. 2006, 21, 261–268. [Google Scholar] [CrossRef]
  7. Reich, P.B. The world-wide ‘fast-slow’ plant economics spectrum: A traits manifesto. J. Ecol. 2014, 102, 275–301. [Google Scholar] [CrossRef]
  8. Ivanova, L.A.; Zolotareva, N.V.; Ronzhina, D.A.; Podgaevskaya, E.N.; Migalina, S.V.; Ivanov, L.A. Leaf functional traits of abundant species predict productivity in three temperate herbaceous communities along an environmental gradient. Flora 2018, 239, 11–19. [Google Scholar] [CrossRef]
  9. Wright, I.J.; Reich, P.B.; Westoby, M.; Ackerly, D.D.; Baruch, Z.; Bongers, F.; Cavender-Bares, J.; Chapin, T.; Cornelissen, J.H.C.; Diemer, M. World-wide leaf economics spectrum. Nature 2004, 428, 821–827. [Google Scholar] [CrossRef]
  10. Niu, K.; Zhang, S.; Zhao, B.; Du, G. Linking grazing response of species abundance to functional traits in the Tibetan alpine meadow. Plant Soil 2010, 330, 215–223. [Google Scholar] [CrossRef]
  11. Díaz, S.; Hodgson, J.G.; Thompson, K.; Cabido, M. The plant traits that drive ecosystems: Evidence from three continents. J. Veg. Sci. 2004, 15, 295–304. [Google Scholar] [CrossRef] [Green Version]
  12. Wang, L.L.; Zhao, G.X.; Li, M.; Zhang, M.T.; Zhang, L.F.; Zhang, X.F.; An, L.Z.; Xu, S.J. C:N:P stoichiometry and leaf traits of halophytes in an arid saline environment, Northwest China. PLoS ONE 2015, 10, e0119935. [Google Scholar] [CrossRef] [Green Version]
  13. Li, J.Y.; Zhao, C.Y.; Li, J.; Yan, Y.Y.; Yu, B.; Han, M. Growth and leaf gas exchange in Populus euphratica across soil water and salinity gradients. Photosynthetica 2013, 51, 321–329. [Google Scholar] [CrossRef]
  14. Lu, Y.W.; Miao, X.L.; Song, Q.Y.; Peng, S.M.; Duan, B.L. Morphological and ecophysiological plasticity in dioecious plant Populus tomentosa under drought and alkaline stresses. Photosynthetica 2018, 56, 1353–1364. [Google Scholar] [CrossRef]
  15. Shabala, S.; Munns, R. Salinity stress: Physiological constraints and adaptive mechanisms. Plant Stress Physiol. 2012, 1, 59–93. [Google Scholar]
  16. Flowers, T.J.; Colmer, T.D. Salinity tolerance in halophytes. New Phytol. 2008, 179, 945–963. [Google Scholar] [CrossRef]
  17. Munns, R.; Tester, M. Mechanisms of salinity tolerance. Annu. Rev. Plant Biol. 2008, 59, 651–681. [Google Scholar] [CrossRef] [Green Version]
  18. Wang, Y.; Li, Y. Land exploitation resulting in soil salinization in a desert-oasis ecotone. Catena 2013, 100, 50–56. [Google Scholar] [CrossRef]
  19. Rodríguez, P.; Torrecillas, A.; Morales, M.A.; Ortuno, M.F.; Sánchez-Blancoa, M.J. Effects of NaCl salinity and water stress on growth and leaf water relations of Asteriscus maritimus plants. Environ. Exp. Bot. 2005, 53, 113–123. [Google Scholar] [CrossRef]
  20. Sun, X.; Gao, Y.; Wang, D.; Chen, J.; Zhang, F.; Zhou, J.; Yan, X.; Li, Y. Stoichiometric variation of halophytes in response to changes in soil salinity. Plant Biol. 2017, 19, 360–367. [Google Scholar] [CrossRef]
  21. Rong, Q.Q.; Liu, J.T.; Cai, Y.P.; Lu, Z.H.; Zhao, Z.Z.; Yue, W.C.; Xia, J.X. Leaf carbon, nitrogen and phosphorus stoichiometry of Tamarix Chinensis (Lour) in the Laizhou Bay coastal wetland, China. Ecol. Eng. 2015, 76, 57–65. [Google Scholar] [CrossRef]
  22. Fu, A.H.; Chen, Y.N.; Li, W.H. Water use strategies of the desert riparian forest plant community in the lower reaches of Heihe River Basin, China. Sci. China Earth Sci. 2014, 57, 1293–1305. [Google Scholar] [CrossRef]
  23. Rasband, W.S.; Image, J. National Institutes of Health, Bethesda. 1997–2016. Available online: https://imagej.nih.gov/ij/ (accessed on 1 September 2018).
  24. Li, S.J.; Su, P.X.; Zhang, H.N.; Zhou, Z.J.; Xie, T.T.; Shi, R.; Gou, W. Distribution patterns of desert plant diversity and relationship to soil properties in the Heihe River Basin, China. Ecosphere 2018, 9, e02355. [Google Scholar] [CrossRef]
  25. Regional Salinity Laboratory (US). Diagnosis and improvement of saline and alkali soils. In USDA Handbook No. 60.; United States Department of Agriculture: Washington, DC, USA, 1954. [Google Scholar]
  26. Cornelissen, J.H.C.; Lavorel, S.; Garnier, E.; Díaz, S.; Buchmann, N.; Gurvich., D.E.; Reich, P.B.; ter Steege, H.; Morgan, H.D.; van der Heijden, M.G.A.; et al. A handbook of protocols for standardized and easy measurement of plant functional traits worldwide. Aust. J. Bot. 2003, 51, 335–380. [Google Scholar] [CrossRef] [Green Version]
  27. Brian, G.; Peterson, P.C. Performance Analytics: Econometric Tools for Performance and Risk Analysis. R package version 1.5.2. 2018. Available online: https://CRAN.R-project.org/package=PerformanceAnalytics (accessed on 1 September 2018).
  28. Grömping, U. Relative importance for linear regression in R: The package relaimpo. J. Stat. Softw. 2006, 17, 1–27. [Google Scholar] [CrossRef] [Green Version]
  29. Wright, I.J.; Westoby, M.; Reich, P.B. Convergence towards higher leaf mass per area in dry and nutrient-poor habitats has different consequences for leaf life span. J. Ecol. 2002, 90, 534–543. [Google Scholar] [CrossRef] [Green Version]
  30. Burns, K.C. Patterns in specific leaf area and the structure of a temperate heath community. Divers. Distrib. 2004, 10, 105–112. [Google Scholar] [CrossRef]
  31. Saura-Mas, S.; Lloret, F. Leaf and shoot water content and leaf dry matter content of Mediterranean woody species with different post-fire regenerative strategies. Ann. Bot. 2007, 99, 545–554. [Google Scholar] [CrossRef] [Green Version]
  32. Westoby, M.; Falster, D.S.; Moles, A.T.; Vesk, P.A.; Wright, I.J. Plant ecological strategies: Some leading dimensions of variation between species. Annu. Rev. Ecol. Syst. 2002, 33, 125–159. [Google Scholar] [CrossRef] [Green Version]
  33. Wilson, P.J.; Thompson, K.; Hodgson, J.G. Specific leaf area and leaf dry matter content as alternative predictors of plant strategies. New Phytol. 1999, 143, 155–162. [Google Scholar] [CrossRef]
  34. Koerselman, W.; Meuleman, A.F.M. The vegetation N:P Ratio: A new tool to detect the nature of nutrient limitation. J. Appl. Ecol. 1996, 33, 1441–1450. [Google Scholar] [CrossRef]
  35. Kleyer, M.; Bekker, R.M.; Knevel, I.C.; Bakker, J.P.; Thompson, K.; Sonnenschein, M.; Poschlod, P.; van Groenendael, J.M.; Klimeš, L.; Klimešová, J.; et al. The LEDA Traitbase: A database of life-history traits of the Northwest European flora. J. Ecol. 2008, 96, 1266–1274. [Google Scholar] [CrossRef]
  36. Hodgson, J.G.; Montserrat-Martí, G.; Charles, M.; Jones, G.; Wilson, P.; Shipley, B.; Sharafi, M.; Cerabolini, B.E.L.; Cornelissen, J.H.C.; Band, S.R. Is leaf dry matter content a better predictor of soil fertility than specific leaf area? Ann. Bot. 2011, 108, 1337–1345. [Google Scholar] [CrossRef] [Green Version]
  37. Poorter, L.; Bongers, F. Leaf traits are good predictors of plant performance across 53 rain forest species. Ecology 2006, 87, 1733–1743. [Google Scholar] [CrossRef]
  38. Han, W.X.; Fang, J.Y.; Guo, D.L.; Zhang, Y. Leaf nitrogen and phosphorus stoichiometry across 753 terrestrial plant species in China. New Phytol. 2005, 168, 377–385. [Google Scholar] [CrossRef]
  39. Zhao, J.; Xu, F.; Ji, T.; Li, J. A New Spermidine from the Fruits of Lycium ruthenicum. Chem. Nat. Compd. 2014, 50, 880–883. [Google Scholar] [CrossRef]
  40. Shipley, B.; Lechowicz, M.J.; Wright, I.; Reich, P.B. Fundamental trade-offs generating the worldwide leaf economics spectrum. Ecology 2006, 87, 535–541. [Google Scholar] [CrossRef] [PubMed]
  41. Morandeira, N.S.; Kandus, P. Plant functional types and trait values in the Paraná River floodplain: Modeling their association with environmental features. Flora-Morphol. Distrib. Funct. Ecol. Plants 2016, 220, 63–73. [Google Scholar] [CrossRef]
  42. Reich, P.B.; Walters, M.B.; Ellsworth, D.S. From tropics to tundra: Global convergence in plant functioning. Proc. Natl. Acad. Sci. USA 1997, 94, 13730–13734. [Google Scholar] [CrossRef] [Green Version]
  43. Osmond, C.B.; Austin, M.P.; Berry, J.A.; Billings, W.D.; Boyer, J.S.; Dacey, J.W.H.; Nobel, P.S.; Smith, S.D.; Winner, W.E. Stress physiology and the distribution of plants. Bioscience 1987, 37, 38–48. [Google Scholar] [CrossRef]
  44. Marenco, R.; Antezana-Vera, S.A.; Nascimento, H. Relationship between specific leaf area, leaf thickness, leaf water content and SPAD-502 readings in six Amazonian tree species. Photosynthetica 2009, 47, 184–190. [Google Scholar] [CrossRef]
  45. Shipley, B.; Vu, T. Dry matter content as a measure of dry matter concentration in plants and their parts. New Phytol. 2002, 153, 359–364. [Google Scholar] [CrossRef]
  46. Shipley, B. Structured Interspecific Determinants of Specific Leaf Area in 34 Species of Herbaceous Angiosperms. Funct. Ecol. 1995, 9, 312. [Google Scholar] [CrossRef]
  47. He, M.; Dijkstra, F.A.; Zhang, K.; Li, X.; Tan, H.; Gao, Y.; Li, G. Leaf nitrogen and phosphorus of temperate desert plants in response to climate and soil nutrient availability. Sci. Rep. 2014, 4, 6932–6939. [Google Scholar] [CrossRef] [Green Version]
  48. Zhang, B.; Gao, X.; Li, L.; Lu, Y.; Shareef, M.; Huang, C.; Liu, G.; Gui, D.; Zeng, F. Groundwater Depth Affects Phosphorus but Not Carbon and Nitrogen Concentrations of a Desert Phreatophyte in Northwest China. Front. Plant Sci. 2018, 9, 338. [Google Scholar] [CrossRef] [PubMed]
  49. Nguyen, H.T.; Stanton, D.; Schmitz, N.; Farquhar, G.; Ball, M. Growth responses of the mangrove Avicennia marina to salinity: Development and function of shoot hydraulic systems require saline conditions. Ann. Bot. 2015, 115, 397–407. [Google Scholar] [CrossRef]
  50. Chakrabarti, N.; Mukherji, S. Effect of phytohormone pretreatment on nitrogen metabolism in Vigna radiate under salt stress. Bio. Plantarum 2003, 46, 63–66. [Google Scholar] [CrossRef]
  51. Baki, G.K.A.; Siefritz, F.; Man, H.; Weiner, H.; Kaldenhoff, R.; Kaiser, W.M. Nitrate reductase in Zea mays L. under salinity. Plant Cell Environ. 2000, 23, 515–521. [Google Scholar] [CrossRef]
  52. Ding, X.; Tian, C.; Zhang, S.; Song, J.; Zhang, F.; Mi, G.; Feng, G. Effects of NO3-N on the growth and salinity tolerance of Tamarix laxa Willd. Plant Soil 2009, 331, 57–67. [Google Scholar] [CrossRef]
  53. Hameed, M.; Ashraf, M.; Ahmad, M.S.A.; Naz, N. Structural and Functional Adaptations in Plants for Salinity Tolerance. In Plant Adaptation and Phytoremediation; Springer Netherlands: Dordrecht, The Netherlands, 2010; pp. 151–170. [Google Scholar]
  54. Iqbal, N.; Umar, S.; Khan, N. Nitrogen availability regulates proline and ethylene production and alleviates salinity stress in mustard (Brassica juncea). J. Plant Physiol. 2015, 178, 84–91. [Google Scholar] [CrossRef]
  55. Ahanger, M.A.; Agarwal, R.M. Salinity stress induced alterations in antioxidant metabolism and nitrogen assimilation in wheat (Triticum aestivum L.) as influenced by potassium supplementation. Plant Physiol. Bioch. 2017, 115, 449–460. [Google Scholar] [CrossRef] [PubMed]
  56. Yu, T.F.; Feng, Q.; Liu, W.; Si, J.H.; Xi, H.Y.; Chen, L.J. Soil water and salinity in response to water deliveries and the relationship with plant growth at the lower reaches of Heihe River, Northwestern China. Acta Ecol. Sin. 2012, 32, 7009–7701. [Google Scholar]
Figure 1. Photos of Lycium ruthenicum community and individual characteristics. Note: A, non-saline desert habitat; B, very slightly saline desert habitat; C, slightly saline desert habitat; D, photo of individual of L. ruthenicum; E, the underground biomass of L. ruthenicum is mainly distributed in the area of 0–80 cm; F, morphological characteristics of leaves of L. ruthenicum.
Diversity 13 00453 g001
Figure 2. Correlation analysis among leaf functional traits and water-salt response. Drawing using R “Performance Analytics” package. The numbers in the upper triangular region of the graph indicate correlation coefficients and the asterisks indicate significance. The lower triangle is a linear regression between the two traits. LT: leaf thickness (mm), SLA: specific leaf area (mm2 mg−1), SLV: specific leaf volume (cm3 g−1), LDMC: leaf dry matter content (mg g−1); Suc: succulence (g cm−2); LD: leaf dry matter concentration (g cm−3), TWC: total water content (%), RWC: relative water content (%), C: organic matter content (g kg−1), N: nitrogen content (g kg−1), P: phosphorus content (g kg−1), C:N: the ratio of C and N, C:P: the ratio of C and P, N:P: the ratio of N and P.
Diversity 13 00453 g002
Figure 3. RDA of leaf functional traits and environmental variables of Lycium ruthenicum populations in the lower reaches of the Heihe River. The red arrows are the leaf functional traits data; the blue arrows represent the soil traits that were included in the models as the underlying environmental factors. The direction of the arrow indicating a positive or negative correlation among the environmental factors with the ordination axes. The angle of the arrow reflects the strength of correlation between the environmental factors and leaf functional traits, with small angles indicating strong correlations. Environmental variables include water (WC, 0–40 and 40–80 cm soil), salinity (0–40 and 40–80 cm soil) and soil ions (Na+, K+, Ca2+, Mg2+, CO32−, HCO3, SO42−, Cl). The dotted green circle represents the non-salt group, the blue circle represents the very slightly salt group and the red circle represents the slightly salt group.
Diversity 13 00453 g003
Figure 4. The relative importance of soil factors at two soil depths on leaf functional traits. The horizontal axis is leaf functional traits and the vertical axis is the relative importance of soil factors. SWC: soil water content. The soil factors from top to bottom on the histogram are SWC, SO42−, Salinity, Na+, Mg2+, K+, HCO3, CO32−, Cl, Ca2+. Values below 10% are not shown in Figure 4.
Diversity 13 00453 g004
Table 1. Site characteristics for eight Lycium ruthenicum populations in the lower reaches of Heihe River (Mean ± SD, n = 3).
No.Types Description of HabitatsLongitude (E)Latitude (N)Dominance IndexEvenness IndexPlant Coverage (%)
Non-saline gravel desert101°01′0.6″42°02′9.4″0.70 ± 0.18 bc0.54 ± 0.28 ab22.42 ± 4.70 abc
Non-saline gravel desert101°01′42.4″42°02′7.8″0.66 ± 0.24 bcd0.55 ± 0.36 ab46.46 ± 8.45 c
Non-saline silt desert101°03′13.9″42°01′28.3″0.51 ± 0.13 d0.66 ± 0.13 ab48.01 ± 7.89 d
Non-saline silt desert101°02′42.0″42°03′11.8″0.86 ± 0.21 a0.27 ± 0.37 cd91.02 ± 12.38 c
Very slightly saline silt desert101°02′27.5″42°03′8.0″0.66 ± 0.14 bcd0.69 ± 0.20 ab37.40 ± 8.79 bc
Non-saline sand desert101°16′59.3″42°02′17.8″0.80 ± 0.09 ab0.51 ± 0.17 bc1.80 ± 0.62 a
Slightly saline silt desert101°00′52.5″42°06′56.8″0.94 ± 0.11 a0.16 ± 0.26 d37.08 ± 6.16 bc
Slightly saline silt desert101°00′3.7″42°06′52.0″0.63 ± 0.09 cd0.80 ± 0.15 a10.15 ± 1.78 ab
Note: Multiple comparisons of community characteristics between different habitats using one-way analyses of variance followed by Tukey-HSD tests. Different letters represent significant differences (p < 0.05). Simpson dominance index was calculated as c = ( Pi ) 2 , Pielou evenness index was calculated as Jsw =   H / ln S ,   where Pi is the relative importance value of species i and S is the total number of species in each plot, C is Simpson dominance index, H is Shannon–Wiener diversity index, Jsw is Pielou evenness index.
Table 2. Leaf functional traits of eight Lycium ruthenicum populations (Mean ±SD, n = 3).
No.LTSLVSLALDMCSucLDTWCRWCCNPC:NC:PN:P
1.03 ± 0.01 c6.69 ± 0.47 bc0.007 ± 0.43 a141.5 ± 13.4 ab0.83 ± 0.03 b0.15 ± 0.01 ab83.15 ± 0.01 cd81.32 ± 0.01 b347.5 ± 0.42 a13.57 ± 0.06 c3.98 ± 0.16 b25.79 ± 0.42 c85.0 ± 4.05 c3.42 ± 0.16 b
1.14 ± 0.10 bc7.00 ± 0.67 bc0.006 ± 0.47 a147.5 ± 5.1 ab0.99 ± 0.04 ab0.14 ± 0.01 ab82.0 ± 0.01 cd78.85 ± 0.03 c337.8 ± 0.29 a14.84 ± 0.43 b3.09 ± 0.00 b23.34 ± 0.89 d107.5 ± 2.5 c4.80 ± 0.14 ab
1.26 ± 0.00 abc8.40 ± 1.40 abc0.006 ± 1.11 a144.7 ± 11.3 ab0.89 ± 0.07 b0.12 ± 0.02 bc82.26 ± 0.01 cd78.46 ± 0.02 c342.4 ± 0.29 a16.92 ± 0.89 a1.53 ± 0.91 c20.28 ± 0.74 e435.8 ± 25.5 a17.70 ± 11.13 a
1.36 ± 0.01 ab7.81 ± 0.19 abc0.005 ± 0.10 a125.0 ± 1.7 abc1.03 ± 0.03 ab0.13 ± 0.00 bc83.13 ± 0.00 cd70.41 ± 0.00 c324.1 ± 0.12 b13.04 ± 0.04 c1.01 ± 0.14 c26.16 ± 1.85 c335.3 ± 11.2 ab13.16 ± 1.76 ab
1.26 ± 0.23 abc5.74 ± 0.38 c0.005 ± 0.54 a197.9 ± 21.0 a0.90 ± 0.04 b0.17 ± 0.01 a79.35 ± 0.02 d94.81 ± 0.00 c337.6 ± 0.16 a9.93 ± 0.04 d0.81 ± 0.00 c34.34 ± 0.48 b414.1 ± 1.8 a12.22 ± 0.00 ab
1.24 ± 0.02 bc7.38 ± 0.13 bc0.007 ± 0.12 a137.9 ± 2.2 abc0.87 ± 0.03 b0.14 ± 0.00 abc84.91 ± 0.00 bc90.0 ± 0.00 c341.3 ± 0.04 a15.07 ± 0.27 b1.54 ± 0.11 c22.66 ± 0.35 d223.3 ± 13.1 bc9.87 ± 0.90 ab
1.58 ± 0.05 a9.14 ± 0.64 ab0.006 ± 0.24 a153.1 ± 7.5 bc1.24 ± 0.14 a0.11 ± 0.01 bc88.37 ± 0.01 ab137.35 ± 0.02 a308.6 ± 0.12 c15.15 ± 0.17 b5.45 ± 0.32 a20.56 ± 0.30 e58.1 ± 1.1 c2.79 ±0.20 b
1.37 ± 0.01 ab10.90 ± 1.90 a0.008 ± 1.48 a151.5 ± 8.5 c1.03 ± 0.10 ab0.09 ± 0.02 c87.95 ± 0.01 a130.36 ± 0.01 b319.9 ± 0.54 b8.43 ± 0.34 e2.87 ± 0.00 b38.54 ± 1.07 a112.3 ± 0.7 c2.94 ±0.12 b
Note: Multiple comparisons of traits between different populations using one-way analyses of variance followed by Tukey-HSD tests. Different letters represent significant differences (p < 0.05). LT: leaf thickness (mm), SLA: specific leaf area (cm2 g−1), SLV: specific leaf volume (cm3 g−1), LDMC: leaf dry matter content (mg g−1); Suc: succulence (g cm−2), LD: leaf tissue density (g cm−3), TWC: total water content (%), RWC: relative water content (%), C: leaf carbon content (g kg−1), N: leaf nitrogen content (g kg−1), P: leaf phosphorus content (g kg−1).
Publisher’s Note: MDPI stays neutral with regard to jurisdictional claims in published maps and institutional affiliations.

