Article

Comparative Phylogeography of Southern African Bird Species Suggests an Ephemeral Speciation Model

by
Gary Voelker
1,*,
Guinevere O. U. Wogan
2,3,
Jerry W. Huntley
1 and
Rauri C. K. Bowie
3,4,5
1
Department of Ecology and Conservation Biology, Texas A&M University, College Station, TX 77843, USA
2
Department of Integrative Biology, Oklahoma State University, Stillwater, OK 74078, USA
3
Museum of Vertebrate Zoology, 3101 Valley Life Science Building, University of California, Berkeley, CA 94720-3160, USA
4
Department of Integrative Biology, 3060 Valley Life Science Building, University of California, Berkeley, CA 94720-3160, USA
5
DST/NRF Centre of Excellence, Percy FitzPatrick Institute, University of Cape Town, Rondebosch 7701, South Africa
*
Author to whom correspondence should be addressed.
Diversity 2021, 13(9), 434; https://doi.org/10.3390/d13090434
Submission received: 28 July 2021 / Revised: 2 September 2021 / Accepted: 4 September 2021 / Published: 9 September 2021
(This article belongs to the Collection Feature Papers in Animal Diversity)

Abstract

:
Southern Africa is remarkably rich in avian species diversity; however, the evolutionary and biogeographic mechanisms responsible for that diversity are, in general, poorly understood, and this is particularly true with respect to the many species that are endemic or near-endemic to the region. Here, we used mtDNA to assess genetic structure in three southern African bird species to determine whether each was genetically panmictic, or whether there was standing genetic variation upon which abiotic factors (e.g., climate, biome boundaries, geographic features) could have acted to drive lineage diversification. Haplotype diversity was partitioned into two (two species) or three (one species) distinct haplotype clusters that did not reflect biogeographic or biome partitioning; instead, haplotype clusters overlapped in central South Africa. Population and demographic analyses, along with ecological niche modeling and Bayesian Skyline Plots, indicated that each of the three species were likely isolated in refugia during Pleistocene climatic perturbations, with subsequent expansions from refugia resulting in present-day overlapping distributions. Collectively, our analyses suggest that an ephemeral speciation model is operating in southern Africa, driven by the dynamic climatic oscillations that characterize the region. At least some of the regional endemic bird species (e.g., White-eyes, Zosterops spp.) may be the result of sufficiently long periods in refugia as opposed to the distinct but ephemeral clusters recovered within our three focal species.

1. Introduction

Avian diversity in southern Africa (Namibia, Botswana, Zimbabwe, southern Mozambique, South Africa, Lesotho, and Eswatini) is remarkably rich, both numerically and in phylogenetic diversity. Over 700 bird species occupy the region; many are endemic, and many are habitat or biome-restricted [1]. Despite the high species diversity and complex floral biome structures characteristic of southern Africa, we know surprisingly little about the underlying mechanisms that have contributed to generating this rich and diverse avifaunal assemblage.
From a broad biogeographic perspective, it is evident that at least some of this diversity is the result of frequent colonization of southern Africa by lineages whose ancestral ranges are found in non-adjacent regions of northern Africa or Eurasia. This “species pump” paradigm—whereby periods of increased aridity, especially during global-scale Pliocene climate variations, facilitated long-distance colonization of xeric-adapted lineages (e.g., pipits, larks) into southern Africa, with subsequent in situ diversification—has been described as an important mechanism that has led to elevated species diversity (e.g., [2,3,4,5]). From an inter-regional perspective, there is evidence that deep divergences exist between populations or lineages of southern African bird species, relative to populations of those same species in adjacent areas such as Malawi and Tanzania to the north (e.g., [6,7]). To date, this opening and closing of habitat corridors with biomes to the north of southern Africa, together with the considerable diversity of biome types across southern Africa, are thought to be the primary explanations for the high number of bird species in southern Africa [7,8,9,10].
However, intra-regional drivers must certainly have been or are helping to generate avian biodiversity; we can think of no well-studied region where this has not been shown to be the case. In southern Africa, both reptiles (e.g., [11,12,13]) and mammals (e.g., [14,15,16,17]) have responded to geographic breaks or barriers within southern Africa, implicating allopatric speciation as a driver of lineage diversification [18]. However, the barriers identified in these studies are unlikely to be sufficient to fragment bird populations, and indeed, there is no evidence yet to support such isolation. Overall, the southern African region generally lacks the substantial barriers (long and wide rivers, tall and extensive mountain ranges) that are predominantly identified in studies of avian diversification as it relates to vicariance or dispersal-based modes of allopatric speciation [19].
It is also possible that climate perturbations acted to fragment ancestral populations into refugia; this pattern is clear in other parts of Africa (e.g., [20,21]). A study of southern African puff adders [12] revealed a complex pattern of refugial isolation and secondary expansion, in response to glacial maxima. The primary effect on this species was that as interior regions of South Africa became uninhabitable, puff adder populations were pushed to more northerly or coastal habitats, and mitochondrial clades subsequently expanded to occupy a variety of habitats, with some introgression between clades at contact zones. More recently, a study of the Cape Robin-chat [22] recovered a similar pattern wherein arid land biomes were shown to play a major role in structuring populations across southern Africa. As aridity increased in the central Nama Karoo biome, Cape Robin-chat populations became isolated in different biome refugia, which in turn led to three lineages. These populations have since begun to merge, as the Nama Karoo biome has for several reasons (e.g., homestead gardens as “new” Karoo habitat) become permeable to re-colonization.
From an intra-regional biogeographic perspective, it is apparent that differences in species turnover across southern African habitats or ecoregions are important factors in delimiting mammalian [23,24], reptile [25] and avian species distributions [8,26,27,28]. This suggests either that, like puff adders, refugial isolation during glacial maxima may have driven speciation, with incipient lineages subsequently expanding to habitat-defined contact zones, or that differentiation across habitats or biomes (ecological speciation) is playing a role in generating southern African avian diversity. For birds, there is no support for a refugial pattern other than that evidenced by the Cape Robin-chat [22], and just a few studies exist [2,9,10,29,30] that might support ecological speciation.
Still another possibility is that more frequent climate perturbations have been acting to generate species in southern Africa. Recent work based on multi-proxy alluvial records has shown that ecotone changes have occurred in South Africa over the past 14 kyr [31], and several studies have used climate circulation models encompassing the past 140 kyr to determine that low climatic variability, of a degree enabling biome persistence, is strongly associated with avian species richness in the region [18,22,32]. Further, biome persistence is probably linked to reduced extinction risk [20]. Thus, while existing species are less likely to become extinct, we are still left with the question of whether climate perturbations are sufficient to drive speciation. This would require that biomes become fragmented (i.e., into refugia) during perturbations, and that perturbations are of sufficient duration to facilitate lineage divergence where pre- or post-zygotic barriers develop to maintain species boundaries. This latter requirement relates to the “ephemeral species” model [33], where genetic diversity is produced in response to barriers (here, fragmented biomes) that vary in temporal duration. This model suggests that genetic divergence of lineages via fragmentation is common and rapid, but further suggests that divergent taxa that are produced rarely persist due to insufficient duration of perturbations to reinforce reproductive isolation mechanisms upon secondary contact when climate conditions favor lineage expansion, over time leading to genomic homogenization [22,33].
We hypothesize that evidence of response to climatic perturbations could manifest itself in several ways. First, there might be standing phylogeographic structure upon which perturbations could be rapidly expected to act upon. In other words, geographically structured populations comprising unique haplotypes or haplotype groups could be expected to sort faster into lineages (and perhaps then eventually into distinct species) than would a panmictic population. Second, there might be genetic evidence suggesting perturbations have occurred, but that they have been of insufficient duration to drive speciation. Such evidence might consist of the distributional overlap of distinctly different haplotypes, where monophyletic lineages were generated, but collapsed on secondary contact due to the speed of climate perturbation shifts—the ephemeral species phenomenon. Third, there might be evidence that current habitat has been historically fragmented, as assessed via the use of ecological niche modeling. To explore these potential patterns, the application of mitochondrial DNA is particularly useful for two reasons. First, as large populations become fragmented, the resulting smaller allopatric populations sizes and faster mutation rates lead to rapid fixation of mtDNA haplotypes, as compared to nuclear DNA. Second, upon secondary contact, when the nuclear genome may homogenize due to hybridization of lineages and through backcrossing in subsequent generations, divergent mtDNA lineages are retained for longer periods of time, thereby providing the only signal of once divergent allopatric lineages (e.g., [22,34,35,36]).
Here, we seek to address these hypotheses by using mitochondrial DNA data and ecological niche modeling in three common bird species which have overlapping distributions across several biomes in South Africa and Namibia. All three of these species (Acacia Pied Barbet Tricholaema leucomelas, Crimson-breasted Shrike Laniarius atrococcineus, and Chestnut-vented Warbler Curruca subcoerulea) are effectively southern African endemics [1].

2. Materials and Methods

2.1. Focal Taxa

We selected our focal taxa because their ranges overlap across central South African arid biomes. To the extent possible, we tried to capture variations in taxonomy and life-history traits across species. In this context, the barbet (Lybiidae) is a species of Piciformes, whereas the two songbirds are Oscine Passeriformes. The warbler (Sylviidae) and shrike (Malaconotidae) are primarily restricted to arid biomes, and the former tends to be more abundant and widespread; conversely, the barbet is found across both arid and mesic biomes, but like the warbler, is generally abundant and widespread [1]. For each species, most of the samples represent material collected by us on expeditions undertaken between 2000–2013 in order to collect tissues for molecular analyses. On these expeditions, we attempted to sample the avian communities across and within different biomes, primarily using mist-nets. We thank the many private landowners who generously allowed us access to their land. To increase our sampling, we requested loans from other institutions (see acknowledgements) (Supplementary Table S1).

2.2. Genetic Data

Whole genomic DNA was extracted from tissue samples (Supplementary Table S1) using the DNeasy tissue extraction kit (Qiagen). We used the polymerase chain reaction (PCR) to amplify the mitochondrial NADH dehydrogenase subunit 2 (ND2) gene following the procedures outlined in Outlaw et al. [37]. Capillary Sanger sequencing was performed using BigDye chemistry (Applied Biosystems, Waltham, Massachusetts, USA) and products were run out on an AB 377 or 3730 sequencer. Forward and reverse sequence strands were combined, verified to be protein coding, and consensus sequences were aligned using Sequencer 4.9 (Gene Codes Corporation, Ann Arbor, MI, USA).

2.3. Haplotype Network Estimation

To assess phylogeographic patterns within each species, haplotype networks based on the ND2 dataset were created using statistical parsimony as implemented in TCS v1.21 [38]. Networks were color coded to reflect the habitat where each haplotype was found; some haplotypes were found in just one habitat, whereas others were found across multiple habitats (see below).

2.4. Population and Demographic Analyses

For each species, we tested for population structure and differentiation using the TCS network as a guide. For Curruca subcoerulea, Laniarius atrococcineus, and Tricholaema leucomelas, we tested three, two, and three scenarios, respectively. For species where multiple potential haplotype clusters were identified within our sampling, we calculated between population FST values and then used a bootstrapping procedure to test statistical significance. Since we are specifically interested in assessing how biome structure influences genetic structure across southern Africa, we used an AMOVA [39] to partition the total genetic variance, with groups defined by each biome type and “populations” defined by unique localities. AMOVA were performed using pairwise differences with 1000 permutations in Arlequin v.3.5 [40].
We calculated several summary statistics (e.g., π and θ(S)) as well as Tajima’s D and Fu’s F to evaluate signatures of population expansion for each population, and we generated mismatch distributions to distinguish between signatures of demographic or spatial expansion. Mismatch distributions are expected to be unimodal when populations have undergone either a demographic or spatial population expansion or multimodal when populations have been stable and/or have genetic structure within them. For each mismatch distribution, we also calculated the SSD and Harpending’s R statistics, in which non-significant results indicate a failure to reject a model of population expansion. The analyses were carried out using Arlequin v.3.5. We then estimated Bayesian Skyline plots (BSP) using BEAST v1.7.5 [41] to further investigate the demography of each species. BSP provide an estimate of effective population size over time [42]. We used the HKY + I + G nucleotide substitution model and enforced a strict molecular clock using the rates of evolution inferred for the ND2 marker in Hawaiian Honeycreepers (ND2 0.029 s/s/l/myr, 95% HPD: 0.024–0.033 s/s/l/myr) [43]. We used the inferred population structure recovered from our Arlequin analyses as the basic units of analyses and performed three independent runs of 30 million generations for each population sampling every 3000 generations. We assessed MCMC convergence using effective sample size (ESS) estimates in Tracer [44] and discarded 10% of the runs as burn-in. We compared results from three independent BEAST runs assuming that convergence across replicates provided support for the underlying demographic patterns inferred.

2.5. Environmental Niche Models

To infer the climatic suitability and predicted range dynamics for each species, we used MaxEnt v. 3.3.3 [45,46] to estimate the current predicted species distribution and then projected this model onto past climates. We built these models using occurrence data from our fieldwork in combination with vouchered museum occurrences from GBIF (The Global Biodiversity Information Facility [47,48,49]) (Supplementary Figure S1). We followed the modelling scheme outlined in Fuchs et al. [50]. In brief, we used downscaled HadCM3 climate data at a resolution of c. 4 km grid cells, from which we generated 62 time slices dating from 120 ka to the present for eight bioclimatic variables: annual mean temperature; temperature seasonality; mean temperature of the warmest quarter; mean temperature of the coldest quarter; annual precipitation; precipitation seasonality; precipitation of the wettest quarter; and precipitation of the driest quarter. The 62 time slices are at 1 ka intervals from the present back to the last glacial maximum (LGM: 22 ka); 2 ka intervals over 22–88 ka; and every 4000 years back to 120 ka [50]. For the present day model, we used jack-knifing to evaluate variable contributions of the different bioclimatic variables, and the area under the receiver operating curve (AUC) to assess model performance [51]. We have provided the projected models for each species for each time slice as short GIFs (https://sites.google.com/site/gavoelkersite/gifs). We estimated stability through time by applying a presence–absence threshold to each grid-cell for each time slice, and then summed across the 62 time slices to identify grid-cells in which climate was predicted to have been consistently suitable [52].

3. Results

3.1. Genetic Data

For each of our three focal taxa, we sequenced up to 1041 base pairs of the ND2 gene. For Curruca subcoerulea, we sequenced 50 individuals from 15 unique localities (Figure 1). For Laniarius atrococcineus, we obtained genetic samples of 30 individuals from 10 unique localities (Figure 2) and for Tricholaema leucomelas, we sampled 87 individuals from 28 unique localities (Figure 3). Information on samples, to include GenBank accessions and collection sites, are included in Supplementary Table S1.

3.2. Haplotype Networks

The Curruca subcoerulea network analysis recovered 30 unique haplotypes in two population clusters separated by six changes (Figure 1). Both populations are distributed in both the Savanna and Nama Karoo biomes, and there is considerable overlap of individuals from each population having been collected at the same locality (6/15 sites; Figure 1). The Laniarius atrococcineus haplotype network recovered 18 unique haplotypes in two population clusters separated by five steps that were distributed exclusively within the Savanna biome in South Africa but extended into drier biomes in Namibia (Figure 2). There is substantial overlap of individuals from each population having been collected at the same locality (7/10 sites; Figure 2). The haplotype network for Tricholaema leucomelas recovered 20 unique haplotypes in three primary population clusters: one small population restricted to the Nama Karoo and Succulent Karoo biomes, one spread across Savanna, Grasslands, Nama Karoo, and Fynbos biomes, and the third from the Succulent and Nama Karoo, Grasslands, and Savanna biomes (Figure 3). Overlap of individuals from populations having been collected at the same locality is evident at a large number of sites for Tricholaema leucomelas (12/28 sites; Figure 3).

3.3. Population and Demographic Analyses

For Curruca subcoerulea, the two population clusters recovered in the network analyses do not appear to reflect biome boundaries (Figure 1), as both populations are comprised of individuals from the Nama Karoo and Savanna biomes. The two population scenarios for this species that we tested differed, in that in the first scenario, we treated all samples as a single population, and in the second, we treated the two populations recovered in our network analyses as being distinct. Under the one population scenario, the mismatch distributions recovered a bimodal distribution (not shown), suggesting strong population structure within Curruca subcoerulea (see network analyses, above). The FST value estimated between populations in the two population scenario was 0.750 (p < 0.0001), reflecting high differentiation between them. Genetic diversity was similar within both populations. Tajima’s D was slightly negative for both populations, and was statistically significant for both populations (Table 1).
This result could suggest an expansion for both populations, although the values were <2 which indicates that the signature of expansion is not strong. We recovered statistically significant values for Fu’s Fs (Table 1), providing evidence for a recent demographic or spatial expansion for both populations. The mismatch distribution for one population (symbolized with a circle) was multimodal, suggesting a stable population, while that for the other population (symbolized with a triangle) was unimodal, suggesting a population expansion (Figure 1). The demographic SSD and Harpending’s R statistics were significant for both populations (Table 1) while the spatial SSD and Harpending’s R statistics were non-significant. In combination, these results support a range expansion. In agreement with the mismatch analyses, the BSP for one population (circle symbol) depicts a relatively constant population size through time, while for the other (triangle symbol), there is evidence of a rather gradual population expansion (Figure 4A,B). We also performed two biome-based AMOVAs for this species. The first AMOVA did not take into account population membership, i.e., individuals from a locality were grouped together regardless of population membership and localities were then grouped by biome type. The second AMOVA did take population membership into consideration, as well as biome type. When individuals were clustered by locality-biome type alone, we found no evidence of population differentiation (FST = −0.02142), and biome alone did not explain any of the variance in the AMOVA. However, when we accounted for both population membership and biome, the variance explained among the four groups (savanna-cluster1, savanna-cluster2, NamaKaroo-cluster1, NamaKaroo-cluster2) was 67.71%, indicating a genetic–biome relationship.
Based on the haplotype network results, we tested a single population scenario for Laniarius atrococcineus where we included all individuals, and a two-population scenario where we partitioned the individuals by haplotype cluster. The FST value estimated between the two populations was 0.776 (p < 0.0001). Genetic diversity was higher in one population (symbolized with a circle) than the other population (symbolized with a triangle). Tajima’s D was slightly negative for both populations, but the p-values were not statistically significant (Table 1). Fu’s Fs values for both populations were negative and statistically significant, thereby consistent with a demographic signal of population expansion (Table 1). The mismatch distribution for one population (circle symbol) was multimodal supporting population stability, while that for the other population (triangle symbol) was unimodal supporting an expansion (Figure 2). For both populations SSD and Harpending’s R support demographic and spatial expansions (Table 1). The BSP for the circle symbol population depicts an extremely gradual population increase, while the BSP for the triangle symbol population depicts a recent population expansion commencing about 3 kyr before present (Figure 4C,D). We were not able to test for the role of biomes in structuring genetic data in this species since all of the samples were effectively from a single biome (Figure 2).
While a clear biome–haplotype cluster association is not immediately apparent for Tricholaema leucomelas, the structure among clusters suggests that biome restricted gene flow may play a role in shaping genetic diversity within this species. Individuals are unevenly distributed among the clusters, with only four individuals identified to belong to cluster 1 (indicated by a circle on Figure 3), while the other two clusters had 25 (triangle) and 58 individuals (square) (Table 1). However, based on the haplotype network, we treated each of the three haplotype clusters for this species (Figure 3) as an evolutionary unit (population), and evaluated genetic structure as it relates to biome type. Treating each haplotype cluster as a population resulted in high FST values between populations, with FST values of 0.943 and 0.930 between the circle haplogroup population versus the triangle and square populations, respectively, and a value of 0.812 between the triangle and square populations (all p < 0.0001). Tajima’s D was negative in all three populations, and for the circle population, the value was not statistically significant and was very close to zero, indicating that the population is stable (Table 1). For the remaining two populations, Tajima’s D was statistically significant, supporting population expansion (Table 1). Fu’s Fs was negative in all three populations and statistically significant (Table 1). Fu’s Fs was extremely large for two of the populations, providing strong evidence for population expansions in these populations. Mismatch distributions for all three populations were unimodal, suggesting population expansions (Figure 3). The SSD and Harpending’s R statistics provide conflicting support for demographic expansion in population 1 (circle), with Harpending’s R statistic supporting it, and the SSD statistic favoring stability. For population 2 (triangle), both statistics support demographic and spatial expansion, and for population 3 (square), there is support for a stable demography.
The BSP for all three Tricholaema leucomelas populations indicate a relatively stable demography through time (Figure 4E–G). In sum, different tests return conflicting signals with regard to the demography of these populations, although most of the tests support expansions for the population symbolized by the triangle. When sorted by biome alone, we found strong genetic differentiation with significant FST values between the Succulent Karoo biome and both the Savanna and Nama Karoo biomes (FST 0.320 and 0.176, respectively); however, the biomes collectively explained only 0.81% of the variation (p = 0.0059), and with a substantial contribution of variance among populations within each biome (20.95%, p = 0.0029), although much of the variation is explained by within population genetic variance (78.24%, p = 0.1837).

3.4. Environmental Niche Models

For Curruca subcoerulea, Laniarius atrococcineus, and Tricholaema leucomelas, we used 124, 101, and 199 unique localities, respectively, as the basis for our models. Species records were distributed from throughout the range of each species (Supplementary Figure S1). The AUC scores for the contemporary models were high (above 0.9), indicating good model performance. The variable that had the highest contribution to the model for all three species was bioclim11, which is the mean temperature of the coldest quarter. Projections onto past climate depict dynamic predicted ranges for each species; however, there are regions of stability predicted for all three species over the last glacial-interglacial transition. For the summed (all time slices combined) predicted range for Curruca subcoerulea, a large stable area is predicted in what is now primarily the Savanna biome, with inclusion of small portions of the Nama Karoo and Grassland biomes. A second smaller and highly disjunct stable area is predicted in the Fynbos biome (Figure 1). When viewing time slices in series (i.e., not summed together), an additional highly disjunct stable area is repeatedly predicted in Namibia (and on occasion this is the single most suitable area), another is predicted in Botswana but less frequently, and on occasion, there is a largely continuous suitable area predicted across north-central South Africa, Botswana, and Namibia (https://sites.google.com/site/gavoelkersite/gifs).
For Laniarius atrococcineus, two large stable areas are predicted in what is now the Savanna biome (Figure 2). When viewing time slices in series, these two areas at times become highly disjunct, with one area centered on Namibia, and the other centered on north-central South Africa; a third disjunct area of suitability also appears on occasion in Botswana (https://sites.google.com/site/gavoelkersite/gifs). At other times, a single and large suitability area is predicted, and this single area variably spans Namibia, Botswana, and north-central or northeastern South Africa, or is restricted primarily to Botswana.
For Tricholaema leucomelas, a large stable area is predicted across the Grassland and Savanna biomes. As with Curruca subcoerulea, a second smaller and highly disjunct stable area is predicted for Tricholaema leucomelas in the southwestern-most part of the Fynbos biome (Figure 3). When viewing time slices in series, the southwestern Fynbos is on occasion the only stable area predicted for this species (https://sites.google.com/site/gavoelkersite/gifs). Further, there are several additional disjunct areas that approach highest suitability levels at various times over 120 ka: one corresponding to the Fynbos-Forest Biome interface along the southern coast, and one further east along the southern coast which corresponds to the large area of Thicket Biome.

4. Discussion

Our results suggest that an ephemeral speciation model has been operating in southern Africa. In particular, the haplotype networks and geographic distribution of samples for each of the three taxonomically disparate species that we analyzed are indicative of isolation in refugia during climatic perturbations, with subsequent expansions resulting in present day overlapping distributions. Within each of the three species, distinct haplotype clusters (populations) overlap geographically near the ecotone between the Savanna, Grassland, and Nama Karoo biomes in central South Africa (Figure 1, Figure 2 and Figure 3). Distinct populations within each species also overlap within other parts of the Savanna biome (Figure 1, Figure 2 and Figure 3). For Curruca subcoerulea and Laniarius atrococcineus, analyses suggest that the two identified populations (in each species) were expanding, and that populations symbolized by a triangle were expanding more recently and rapidly in each species (Figure 2, Figure 3 and Figure 4). For Tricholaema leucomelas, analyses are indicative of three stable populations through time (Figure 4).
The observed differences in population responses across taxa are likely explained by biome associations. Tricholaema leucomelas can be found across a wider variety of biomes than the other two species, and this habitat generalism may explain its largely stable, slow population growth (Figure 4): there were a wider variety of suitable biome habitats available as refugia—Grassland, Fynbos, Thicket, and various arid biomes (see above). In contrast, Laniarius atrococcineus is strictly an arid biome specialist and based on our ENM results, fragmentation of arid biomes into two or three areas over the past 120 ka would logically result in at least one population showing a history of expansion as these distinct refugia merged back into one continuous biome (Figure 4). While Curruca subcoerulea can be found in both arid and less arid biomes, it is not a Fynbos or Grassland biome species per se (despite being shown as such in field guides, e.g., [53]). While it does occur in those biomes, individual density tends to be highest in arid biomes ([1]; RCKB and GV, pers. obs.), and as such, its response to re-connection of refugial areas through expansion of favorable habitat should, and does, largely mirror the response shown by Laniarius atrococcineus (Figure 4). The results for Laniarius atrococcineus and Curruca subcoerulea are consistent with other GIS-based studies [18,32,54] which have hypothesized that arid land refugia played a crucial role in shaping macro-ecological diversity patterns in southern African birds, both within and among biomes. A key consideration from our results is that while arid land biomes have persisted through time, those biomes have become geographically fragmented into one or more isolated refugia, and as such should not necessarily be viewed as “stable”. In other words, arid land refugia should not necessarily be viewed as a single area that has persisted during climate perturbations; multiple refugial areas may have been present wherein local genetic adaption could take place. This possibility is central to the Ephemeral Speciation Model [33], particularly if it is to function with respect to biome-restricted species such as Laniarius atrococcineus.
Given the distribution of mitochondrial haplotype clusters across geography and biomes, there is no clear pattern of population structure across southern Africa or within South Africa for any of our three focal taxa. This result is consistent with the mitochondrial pattern recovered for the Cape Robin-chat (Cossypha caffra), a widespread bird species that occupies most biomes in South Africa [22]. However, using microsatellite loci, three historical populations were identified for the Cape Robin-chat with admixture occurring across biome boundaries, and several of these populations are geographically concordant with population structure observed in other vertebrates, Smith’s Red Rock Rabbit (Pronolagus rupestris) and the Rock Agama (Agama atra) [11,55]. In particular, each of these three studies identified a distinct population in northwestern South Africa, and each identified Plio-Pleistocene climate fluctuations in the formation of refugia. While the population of Tricholaema leucomelas demarcated by a circle in Figure 3 is similarly distributed in northwestern South Africa (and southwestern Namibia), our sample size for this population is too small to allow us to confidently say that it is indeed restricted to that area. It is, however, clear that the Orange River, which is the boundary between South Africa and Namibia and is a barrier to gene flow for some terrestrial vertebrates [11], has not impacted the distribution of the Tricholaema leucomelas haplotypes, given the same haplotype group is distributed on both sides of this large river.
An additional contrast between the results for our three focal taxa and the Cape Robin-chat is that the distribution of genetic diversity in the latter species corresponded to biome boundaries, with higher genetic diversity associated with those biomes historically deemed stable. Specifically, several arid land biomes were predicted as historically stable for the Cape Robin-chat, and genetic boundaries matched those predictions, implicating biome history as a driving force. Some ecotones between biomes occupied by this species are marked by elevational changes—for example, the escarpment separating most of the Succulent and Nama Karoo biomes. Such elevational changes, combined with climate perturbations acting on highly localized distributions of specialized flora, may explain the extremely restricted distributions of a number of biome-restricted bird species in South Africa, e.g., Orange-breasted Sunbird (Anthobaphes violacea), Cape Sugarbird (Promerops cafer), Protea Canary (Serinus leucopterus), and Victorin’s Scrub-warbler (Cryptillas victorini) in the Fynbos biome, Cape and Drakensberg Rock-Jumpers (Chaetops frenatus and C. aurantius) on high elevation rocky slopes, and the Buff-streaked Chat (Campicoloides bifasciatus) in rocky grassland. Similarly, for widespread avian species complexes that demonstrate in situ diversification in southern Africa (e.g., white-eyes (Zosterops spp. [29]), bulbuls (Pycnonotus spp. [56]) and chats (Emarginata spp. [37]) species tend to occupy discrete biomes or micro-habitats with narrow zones of hybridization where ranges overlap at ecotone boundaries (e.g., Zosterops [57] and Pycnonotus [56]); it is not known if the three species of Emarginata hybridize. These species, and other range and habitat restricted bird taxa that can be found throughout southern Africa, might all be examples of species that successfully avoided becoming “ephemeral species”, where instead parental populations were isolated in unique habitats or biomes and genetically diverged rapidly enough to not merge following habitat expansion with the amelioration of climatic perturbation. This suggests two mechanisms that could result in the same contemporary pattern among the South African avifauna: ephemeral species, as seen in Cossypha caffra, Laniarius atrococcineus and Curruca subcoerulea, or alternatively, those that likely persisted within only a single southern Africa refugia, as has been suggested for the Southern Fiscal Shrike (Lanius collaris [6]) and Southern Ant-eating Chat (Myrmecocichla formicivora [5]). We expect that future studies will find extensive nuclear introgression across the entire species range of Laniarius atrococcineus, Curruca subcoerulea, and Tricholaema leucomelas, in much the same manner as recovered for the Karoo Scrub-robin (Cercotrichas coryphoeus [30]), with mtDNA leaving the only footprint of ingression of previously isolated lineages due to its high mutation rate relative to the nuclear genome and its maternal inheritance. It will also be interesting to determine the extent to which nuclear alleles are able to cross species boundaries along ecotones in avian species complexes that have diverged in situ in southern Africa.

5. Conclusions

Our analyses of three taxonomically disparate bird species revealed a similar phylogeographic pattern, where different haplotypes within each species overlap in South Africa. Ecological niche models suggest that the most suitable habitats for each species underwent repeated fragmentation during climate perturbations. Taken together, these results suggest that an Ephemeral Speciation Model may be operating in southern Africa, where climate perturbations push sub-populations into refugia where genetic differentiation begins. Each of our three study taxa appear to have been isolated for long enough to have begun differentiation (as reflected in distinct haplotype clusters), but not long enough to have fully diverged from one another. We interpret geographically overlapping haplotypes as being the result of geographic re-expansion as climate perturbations ameliorated. While increased sampling may improve ecological niche modeling or population estimates through time, additional genetic samples would not change patterns of overlapping distinct haplotype clusters. While we were able to support two of our initial hypotheses (evidence of both overlapping haplotype clusters and past habitat fragmentation), we did not find evidence of regional standing genetic variation upon which climate perturbations could act, despite having sampled numerous geographically distant localities in the distributional ranges of each species. A lingering question from our study, then, is whether any bird species are “young” enough to suggest that they have successfully passed through the Ephemeral Speciation process. Answering this question will require extensive species-level analysis across southern African bird taxa.

Supplementary Materials

The following is available online at https://www.mdpi.com/article/10.3390/d13090434/s1, Figure S1: Species range maps from Birdlife International (datazone.birdlife.org\species) overlaid with the occurrence points that we used to estimate the environmental niche models in MaxEnt: A. Curruca subcoerulea B. Laniarius attrococineas C. Tricholaema leucomelas. Table S1: Table of voucher numbers, sample numbers, GenBank numbers and sampling localities.

Author Contributions

R.C.K.B. and G.V. conceived of and obtained funding for the study. G.V., R.C.K.B. and G.O.U.W. designed the study. G.V., R.C.K.B. and J.W.H. collected field samples. J.W.H. performed most of the molecular work. G.O.U.W., J.W.H. and G.V. performed data analysis. G.V., R.C.K.B. and G.O.U.W. prepared the manuscript. All authors have read and agreed to the published version of the manuscript.

Funding

This work was supported by NSF DEB-0613668, by collaborative grants NSF DEB-1120356 and 1119931 (all to G.V. and R.C.K.B.), and by the DST/NRF Centre of Excellence at the FitzPatrick Institute, University of Cape Town (to R.C.K.B.).

Institutional Review Board Statement

This study was approved by the Texas A&M University Institutional Animal Care and Use Committee (AUP 2009-28 and AUP 2012-6) and the University of California, Berkeley Institutional Animal Care and Use Committee (AUP 317 and AUP 2016-04-8665).

Informed Consent Statement

Not applicable.

Data Availability Statement

Sequences are available on GenBank (see Supplementary Table S1).

Acknowledgments

We thank all the property owners who allowed us to collect birds on their property, and in particular, the Ivy family (Ivy Safaris) and De Beers for multi-year access to their land. Andre de Kock and Anka Bedetti provided much appreciated help and victualing during their tenure at Venetia Farm, and the Gruebel family is thanked for repeated stays and access to property in Mopane. Arend de Waal is thanked for hosting us at Nova Vita. C. Anderson, J. Fuchs, T. Gnoske, T. Hibbitts, J. Klicka, P. Lloyd, T. Mandiwana-Neudani, G. Oatley, H. Prestridge, A. Ribeiro, H. Smit, and D. de Swardt all participated in fieldwork, and we thank them for their help. R.C.K.B. thanks CapeNature (Western Cape) and the provincial administrations of the Northern Cape, Eastern Cape, Free State and Limpopo Provinces for permits. G.V. thanks B. Wilson and C. Anderson for including him on McGregor Museum collecting permits over many years. We also thank the museums that contributed samples to the project, and especially the USNM for the important material from Namibia. This is publication number 1652 of the Biodiversity Research and Teaching Collections at Texas A&M University.

Conflicts of Interest

The authors declare no conflict of interest.

References

  1. Hockey, P.A.R.; Dean, W.R.J.; Ryan, P.C. (Eds.) Roberts—Birds of Southern Africa, VIIth ed.; The Trustees of the John Voelcker Bird Book Fund: Cape Town, South Africa, 2005. [Google Scholar]
  2. Outlaw, R.K.; Voelker, G.; Outlaw, D.C. Molecular systematics and historical biogeography of the Rock-Thrushes (Muscicapidae: Monticola). Auk 2007, 124, 561–577. [Google Scholar] [CrossRef]
  3. Voelker, G. Dispersal, vicariance and clocks: Historical biogeography and speciation in a cosmopolitan passerine genus (Anthus: Motacillidae). Evolution 1999, 53, 1536–1552. [Google Scholar]
  4. Voelker, G. Systematics and historical biogeography of wagtails (Aves: Motacilla): Dispersal versus vicariance revisited. Condor 2002, 104, 725–739. [Google Scholar] [CrossRef]
  5. Voelker, G.; Bowie, R.C.K.; Wilson, B.; Anderson, C. Phylogenetic relationships and speciation patterns in an African savanna dwelling bird genus (Myrmecocichla). Biol. J. Linn. Soc. 2012, 106, 180–190. [Google Scholar] [CrossRef]
  6. Fuchs, J.; Crowe, T.M.; Bowie, R.C.K. Phylogeography of the fiscal shrike (Lanius collaris): A novel pattern of genetic structure across the arid zones and savannas of Africa. J. Biogeogr. 2011, 38, 2210–2222. [Google Scholar] [CrossRef]
  7. Fuchs, J.; Fjeldså, J.; Bowie, R.C.K. Diversification across major biogeographic breaks in the African Shining/Square-tailed Drongos complex (Passeriformes: Dicruridae). Zool. Scripta. 2017, 46, 27–41. [Google Scholar] [CrossRef]
  8. Colville, J.F.; Potts, A.J.; Bradshaw, P.L.; Measey, G.J.; Snijam, D.; Picker, M.D.; Proches, S.; Bowie, R.C.K.; Manning, J.C. Floristic and Faunal Cape biochoria: Do they exist? In Ecology, Evolution, and Conservation of A Megadiverse Region; Allsopp, N., Colville, J.F., Verboom, G.A., Eds.; Oxford University Press: Oxford, UK, 2014; pp. 73–93. [Google Scholar]
  9. Voelker, G.; Peñalba, J.V.; Huntley, J.W.; Bowie, R.C.K. Diversification in an Afro-Asian songbird clade (ErythropygiaCopsychus) reveals founder-event speciation via trans-oceanic dispersals and a southern to northern colonization pattern in Africa. Mol. Phylogenet. Evol. 2014, 73, 97–105. [Google Scholar] [CrossRef]
  10. Voelker, G.; Huntley, J.W.; Peñalba, J.V.; Bowie, R.C.K. Resolving taxonomic uncertainty and historical biogeographic patterns in Muscicapa flycatchers and their allies. Mol. Phylogenet. Evol. 2016, 94, 618–625. [Google Scholar] [CrossRef]
  11. Matthee, C.A.; Fleming, A.F. Population fragmentation in the southern rock agama, Agama atra: More evidence for vicariance in Southern Africa. Mol. Ecol. 2002, 11, 465–471. [Google Scholar] [CrossRef] [PubMed]
  12. Barlow, A.; Baker, K.; Hendry, C.R.; Peppin, L.; Phelps, T.; Tolley, K.A.; Wüster, C.E.; Wüster, W. Phylogeography of the widespread African puff adder (Bitis arietans) reveals multiple Pleistocene refugia in southern Africa. Mol. Ecol. 2013, 22, 1134–1157. [Google Scholar] [CrossRef]
  13. Heinicke, M.P.; Turk, D.; Bauer, A.M. Molecular phylogeny reveals strong biogeographic signal and two new species in a Cape Biodiversity Hotspot endemic mini-radiation, the pygmy geckos (Gekkonidae: Goggia). Zootaxa 2017, 4312, 449–470. [Google Scholar] [CrossRef]
  14. Lorenzen, E.D.; Heller, R.; Siegismund, H.R. Comparative phylogeography of African savannah ungulates. Mol. Ecol. 2012, 21, 3656–3670. [Google Scholar] [CrossRef]
  15. Smit, H.A.; Robinson, T.J.; van Vuuren, B.J. Coalescence methods reveal the impact of vicariance on the spatial genetic structure of Elephantulus edwardii (Afrotheria, Macroscelidea). Mol. Ecol. 2007, 16, 2680–2692. [Google Scholar] [CrossRef]
  16. Smit, H.A.; Watson, J.; van Vuuren, B.J. Relative importance of habitat connectivity in shaping the genetic profiles of two southern African elephant-shrews. J. Biogeogr. 2010, 37, 857–864. [Google Scholar] [CrossRef]
  17. Willows-Munro, S.; Matthee, C.A. Linking lineage diversification to climate and habitat heterogeneity: Phylogeography of the southern African shrew Myosorex Varius. J. Biogeogr. 2011, 38, 1976–1991. [Google Scholar] [CrossRef]
  18. Tolley, K.A.; Bowie, R.C.K.; Measey, G.J.; Price, B.W.; Forest, F. The shifting landscape of genes since the Pliocene: Terrestrial phylogeography in the Greater Cape Florisitic Region. In Ecology, Evolution, and Conservation of a Megadiverse Region; Allsopp, N., Colville, J.F., Verboom, G.A., Eds.; Oxford University Press: New York, NY, USA, 2014; pp. 142–163. [Google Scholar]
  19. Fjeldså, J.; Alström, P.; Bowie, R.C.K. Chapter 16: How new species evolve. In The Largest Avian Radiation: The Evolution of Perching Birds, or the Order Passeriformes; Fjeldså, J., Christidis, L., Ericson, P.G.P., Eds.; Lynx Edicions: Barcelona, Spain, 2020; pp. 327–337. [Google Scholar]
  20. Fjeldså, J.; Bowie, R.C.K. New perspectives on the origin and diversification of Africa’s forest avifauna. Afr. J. Ecol. 2008, 46, 235–247. [Google Scholar] [CrossRef]
  21. Huntley, J.W.; Keith, K.D.; Castellanos, A.A.; Musher, L.J.; Voelker, G. Underestimated and cryptic diversification patterns across Afro-tropical lowland forests. J. Biogeogr. 2019, 46, 381–391. [Google Scholar] [CrossRef]
  22. Wogan, G.O.U.; Voelker, G.; Oatley, G.; Bowie, R.C.K. Biome stability predicts population structure of a southern African aridland bird species. Ecol. Evol. 2020, 10, 4066–4081. [Google Scholar] [CrossRef] [PubMed] [Green Version]
  23. du Toit, N.; van Vuuren, B.J.; Matthee, S.; Matthee, C.A. Biome specificity of distinct genetic lineages within the four-striped mouse Rhabdomys pumilio (Rodentia: Muridae) from southern Africa with implications for taxonomy. Mol. Phylogenet. Evol. 2012, 65, 75–86. [Google Scholar] [CrossRef] [PubMed]
  24. Russo, I.-R.M.; Chimimba, C.T.; Bloomer, P. Bioregion heterogeneity correlates with extensive mitochondrial DNA diversity in the Namaqua rock mouse, Micaelamys namaquensis (Rodentia: Muridae) from southern Africa–evidence for a species complex. BMC Evol. Biol. 2012, 10, 307. [Google Scholar] [CrossRef] [PubMed] [Green Version]
  25. da Silva, J.M.; Tolley, K.A. Diversification through ecological opportunity in dwarf chameleons. J. Biogeogr. 2017, 44, 834–847. [Google Scholar] [CrossRef]
  26. Evans, K.L.; Rodrigues, A.S.L.; Chown, S.L.; Gaston, K.J. Protected areas and regional avian species richness in South Africa. Biol. Lett. 2006, 2, 184–188. [Google Scholar] [CrossRef] [PubMed] [Green Version]
  27. Van Rensburg, B.J.; Koleff, P.; Gaston, K.J.; Chown, S.L. Spatial congruence of ecological transition at the regional scale in South Africa. J. Biogeogr. 2004, 31, 843–854. [Google Scholar] [CrossRef]
  28. Van Rensburg, B.J.; Levin, N.; Kark, S. Spatial congruence between ecotones and range-restricted species: Implications for conservation biogeography at the subcontinental scale. Divers. Distrib. 2009, 15, 379–389. [Google Scholar] [CrossRef]
  29. Oatley, G.; Voelker, G.; Crowe, T.M.; Bowie, R.C.K. A multi-locus phylogeny reveals a complex pattern of diversification related to climate and habitat heterogeneity in southern African white-eyes. Mol. Phylogenet. Evol. 2012, 64, 633–644. [Google Scholar] [CrossRef] [PubMed]
  30. Ribeiro, A.M.; Lloyd, P.; Dean, W.R.J.; Brown, M.; Bowie, R.C.K. The Ecological and Geographic Context of Morphological and Genetic Divergence in an Understorey-Dwelling Bird. PLoS ONE 2014, 9, e85903. [Google Scholar] [CrossRef] [Green Version]
  31. Scott, L.; Manzano, S.; Carr, A.S.; Cordova, C.; Ochando, J.; Bateman, M.D.; Carrión, J.S. A 14,000 year multi-proxy alluvial record of ecotone changes in a Fynbos-Succulent Karoo transition in South Africa. Palaeogeogr. Palaeoclimatol. Palaeoecol. 2021, 569, 110331. [Google Scholar] [CrossRef]
  32. Huntley, B.; Collingham, Y.; Singarayer, J.S.; Valdes, P.J.; Barnard, P.; Midgely, G.F.; Altwegg, R.; Ohlemüller, R. Explaining patterns of avian diversity and endemicity: Climate and biomes of southern Africa over the last 140,000 years. J. Biogeogr. 2016, 43, 874–886. [Google Scholar] [CrossRef] [Green Version]
  33. Rosenblum, E.B.; Sarver, B.A.J.; Brown, J.W.; Des Roches, S.; Hardwick, K.M.; Hether, T.D.; Eastman, J.M.; Pennell, M.W.; Harmon, L.J. Goldilocks meets Santa Rosalia: An Ephemeral Speciation Model explains patterns of diversification across time scales. Evol. Biol. 2012, 39, 255–261. [Google Scholar] [CrossRef] [Green Version]
  34. Quinn, T.W. The genetic legacy of Mother Goose—Phylogeographic patterns of lesser snow goose Chen caerulescens caerulescens maternal lineages. Mol. Ecol. 1992, 1, 105–117. [Google Scholar] [CrossRef]
  35. Hogner, S.; Laskemoen, T.; Lifjeld, J.T.; Porkert, J.; Kleven, O.; Albayrak, T.; Kabasakal, B.; Johnsen, A. Deep sympatric mitochondrial divergence without reproductive isolation in the common redstart Phoenicurus phoenicurus. Ecol. Evol. 2012, 2, 2974–2988. [Google Scholar] [CrossRef] [PubMed]
  36. Lin, D.; Lacey, E.A.; Bach, B.H.; Bi, K.; Conroy, C.J.; Suvorov, A.; Bowie, R.C.K. Gut microbial diversity across a contact zone for California voles: Implications for lineage divergence of hosts and mito-nuclear mismatch in the assembly of the mammalian gut microbiome. Mol. Ecol. 2020, 29, 1873–1889. [Google Scholar] [CrossRef]
  37. Outlaw, R.K.; Voelker, G.; Bowie, R.C.K. Shall we chat? Evolutionary relationships in the genus Cercomela (Muscicapidae) and its relation to Oenanthe reveals extensive polyphyly among chats distributed in Africa, India and the Palearctic. Mol. Phylogenet. Evol. 2010, 55, 284–292. [Google Scholar] [CrossRef] [PubMed]
  38. Clement, M.; Posada, D.; Crandall, K.A. TCS: A computer program to estimate gene genealogies. Mol. Ecol. 2000, 9, 1657–1659. [Google Scholar] [CrossRef] [PubMed] [Green Version]
  39. Excoffier, L.; Smouse, P.; Quattro, J. Analysis of molecular variance inferred from metric distances among DNA haplotypes: Application to human mitochondrial DNA restriction data. Genetics 1992, 131, 479–491. [Google Scholar] [CrossRef]
  40. Excoffier, L.; Lischer, H.E.L. Arlequin suite ver 3.5: A new series of programs to perform population genetics analyses under Linux and Windows. Mol. Ecol. 2010, 10, 564–567. [Google Scholar] [CrossRef]
  41. Drummond, A.; Rambaut, A. BEAST: Bayesian evolutionary analysis by sampling trees. BMC Evol. Biol. 2007, 7, 214. [Google Scholar] [CrossRef] [Green Version]
  42. Drummond, A.; Rambaut, A.; Shapiro, B.; Pybus, O. Bayesian coalescent inference of past population dynamics from molecular sequences. Mol. Biol. Evol. 2005, 22, 1185–1192. [Google Scholar] [CrossRef] [Green Version]
  43. Lerner, H.R.L.; Meyer, M.; James, H.F.; Hofreiter, M.; Fleischer, R.J. Multilocus resolution of phylogeny and timescale in the extant adapative radiation of Hawaiian Honeycreepers. Curr. Biol. 2011, 21, 1838–1844. [Google Scholar] [CrossRef] [Green Version]
  44. Rambaut, A.; Drummond, A.J. Tracer v1.5. 2007. Available online: http:/beast.bio.ed.ac.uk/Tracer (accessed on 9 September 2021).
  45. Phillips, S.J.; Anderson, R.; Schapire, R. Maximum entropy modeling of species geographic distributions. Ecol. Model. 2006, 190, 231–259. [Google Scholar] [CrossRef] [Green Version]
  46. Phillips, S.J.; Dudik, M. Modeling of species distributions with Maxent: New extensions and a comprehensive evaluation. Ecography 2008, 31, 161–175. [Google Scholar] [CrossRef]
  47. GBIF.org. Available online: http://doi.org/10.15468/dl.tplewp (accessed on 9 September 2015).
  48. GBIF.org. Available online: http://doi.org/10.15468/dl.mvegpj (accessed on 16 September 2015).
  49. GBIF.org. Available online: http://doi.org/10.15468/dl.nabqnh (accessed on 21 September 2016).
  50. Fuchs, J.; Parra, J.L.; Goodman, S.M.; Raherilalao, M.J.; VanDerWal, J.; Bowie, R.C.K. Extending ecological niche models to the past 120, 000 years corroborates the lack of strong phylogeographic structure in the Crested Drongo (Dicrurus forficatus forficatus) on Madagascar. Biol. J. Linn. Soc. 2013, 108, 658–676. [Google Scholar] [CrossRef] [Green Version]
  51. Fielding, A.; Bell, J.A. review of methods for the assessment of prediction errors in conservation presence/absence models. Environ. Conserv. 1997, 24, 38–49. [Google Scholar] [CrossRef]
  52. VanDerWal, J.; Shoo, L.P.; Williams, S.E. New approaches to understanding late Quaternary climate fluctuations and refugial dynamics in Australian wet tropical rain forests. J. Biogeogr. 2009, 36, 291–301. [Google Scholar] [CrossRef]
  53. Sinclair, I.; Ryan, P. Birds of Africa, South of the Sahara; Struik Nature: Cape Town, South Africa, 2010. [Google Scholar]
  54. Huntley, B.; Midgley, G.F.; Barnard, P.; Valdes, P.J. Suborbital climatic variability and centres of biological diversity in the Cape region of southern Africa. J. Biogeogr. 2014, 41, 1338–1351. [Google Scholar] [CrossRef] [Green Version]
  55. Matthee, C.; Robinson, T.J. Mitochondrial DNA differentiation among geographical populations of Pronolagus rupestris, Smith’s red rock rabbit (Mammalia: Lagomorpha). Heredity 1996, 76, 514–523. [Google Scholar] [CrossRef] [PubMed] [Green Version]
  56. Lloyd, P.; Craig, A.J.F.K.; Hulley, P.E.; Essop, M.F.; Crowe, T.M. Ecology and genetics of hybrid zones in the southern African Pycnonotus bulbul species complex. Ostrich 1997, 68, 90–96. [Google Scholar] [CrossRef] [Green Version]
  57. Oatley, G.; de Swardt, D.H.; Nuttall, R.J.; Crowe, T.M.; Bowie, R.C.K. Phenotypic and genotypic variation across a stable white-eye (Zosterops sp.) hybrid zone in central South Africa. Biol. J. Linn. Soc. 2017, 121, 670–684. [Google Scholar] [CrossRef]
Figure 1. Maps and results from analyses of Curruca subcoerulea. The haplotype analysis (middle bottom) recovered two clusters, represented by O and ▲, within southern Africa that are separated by six mutational steps; circle sizes in the networks correspond to the number of individuals with that haplotype (larger circles reflect more individuals with that haplotype), and black circles represent unsampled haplotypes. Other colors represent the biome(s) in which a haplotype was collected (top left); however, circle size has no relationship to the number of individuals from a given biome (if a haplotype is found in more than one biome)—in other words, just one individual from a specific biome would contribute that biome color to the circle. The geographic distributions of individuals in each haplotype cluster are depicted with respect to biome type (top left) and to the estimated species stability map (bottom left) is summed across all time slices, with darker shades of green indicating areas of higher stability. Mismatch distributions for each haplotype cluster depict demographic trends within each haplotype cluster (right, top, and bottom), where solid lines depict expected (black) and observed (black bold) pairwise differences, and dotted lines depict confidence intervals at 99% (blue), 95% (red), and 90% (green). Photo by Ron Knight (under prior taxonomic nomenclature: https://search.creativecommons.org/photos/a44e3d13-f50e-4558-8552-d45801a1dfca, accessed 10 January 2021).
Diversity 13 00434 g001
Figure 2. Maps and results from analyses of Laniarius atrococcineus. The haplotype analysis (middle bottom) recovered two clusters, represented by O and ▲, within southern Africa that are separated by five mutational steps; circle sizes in the networks correspond to the number of individuals with that haplotype (larger circles reflect more individuals with that haplotype), and black circles represent unsampled haplotypes. Other colors represent the biome(s) in which a haplotype was collected (top left); however, circle size has no relationship to the number of individuals from a given biome (if a haplotype is found in more than one biome)—in other words, just one individual from a specific biome would contribute that biome color to the circle. The geographic distribution of individuals in each haplotype cluster are depicted with respect to biome type (top left) and to the estimated species stability map (bottom left) is summed across all time slices, with darker shades of green indicating areas of higher stability. Mismatch distributions for each haplotype cluster depict demographic trends within each haplotype cluster (right, top, and bottom), where solid lines depict expected (black) and observed (black bold) pairwise differences, and dotted lines depict confidence intervals at 99% (blue), 95% (red), and 90% (green). Photo by Ron Knight (https://search.creativecommons.org/photos/cb5f39e3-f4a7-4467-b2b0-a6064bd53bef, accessed 10 January 2021).
Diversity 13 00434 g002
Figure 3. Maps and results from analyses Tricholaema leucomelas. The haplotype analysis (middle bottom) recovered three clusters, represented by O, Diversity 13 00434 i001 
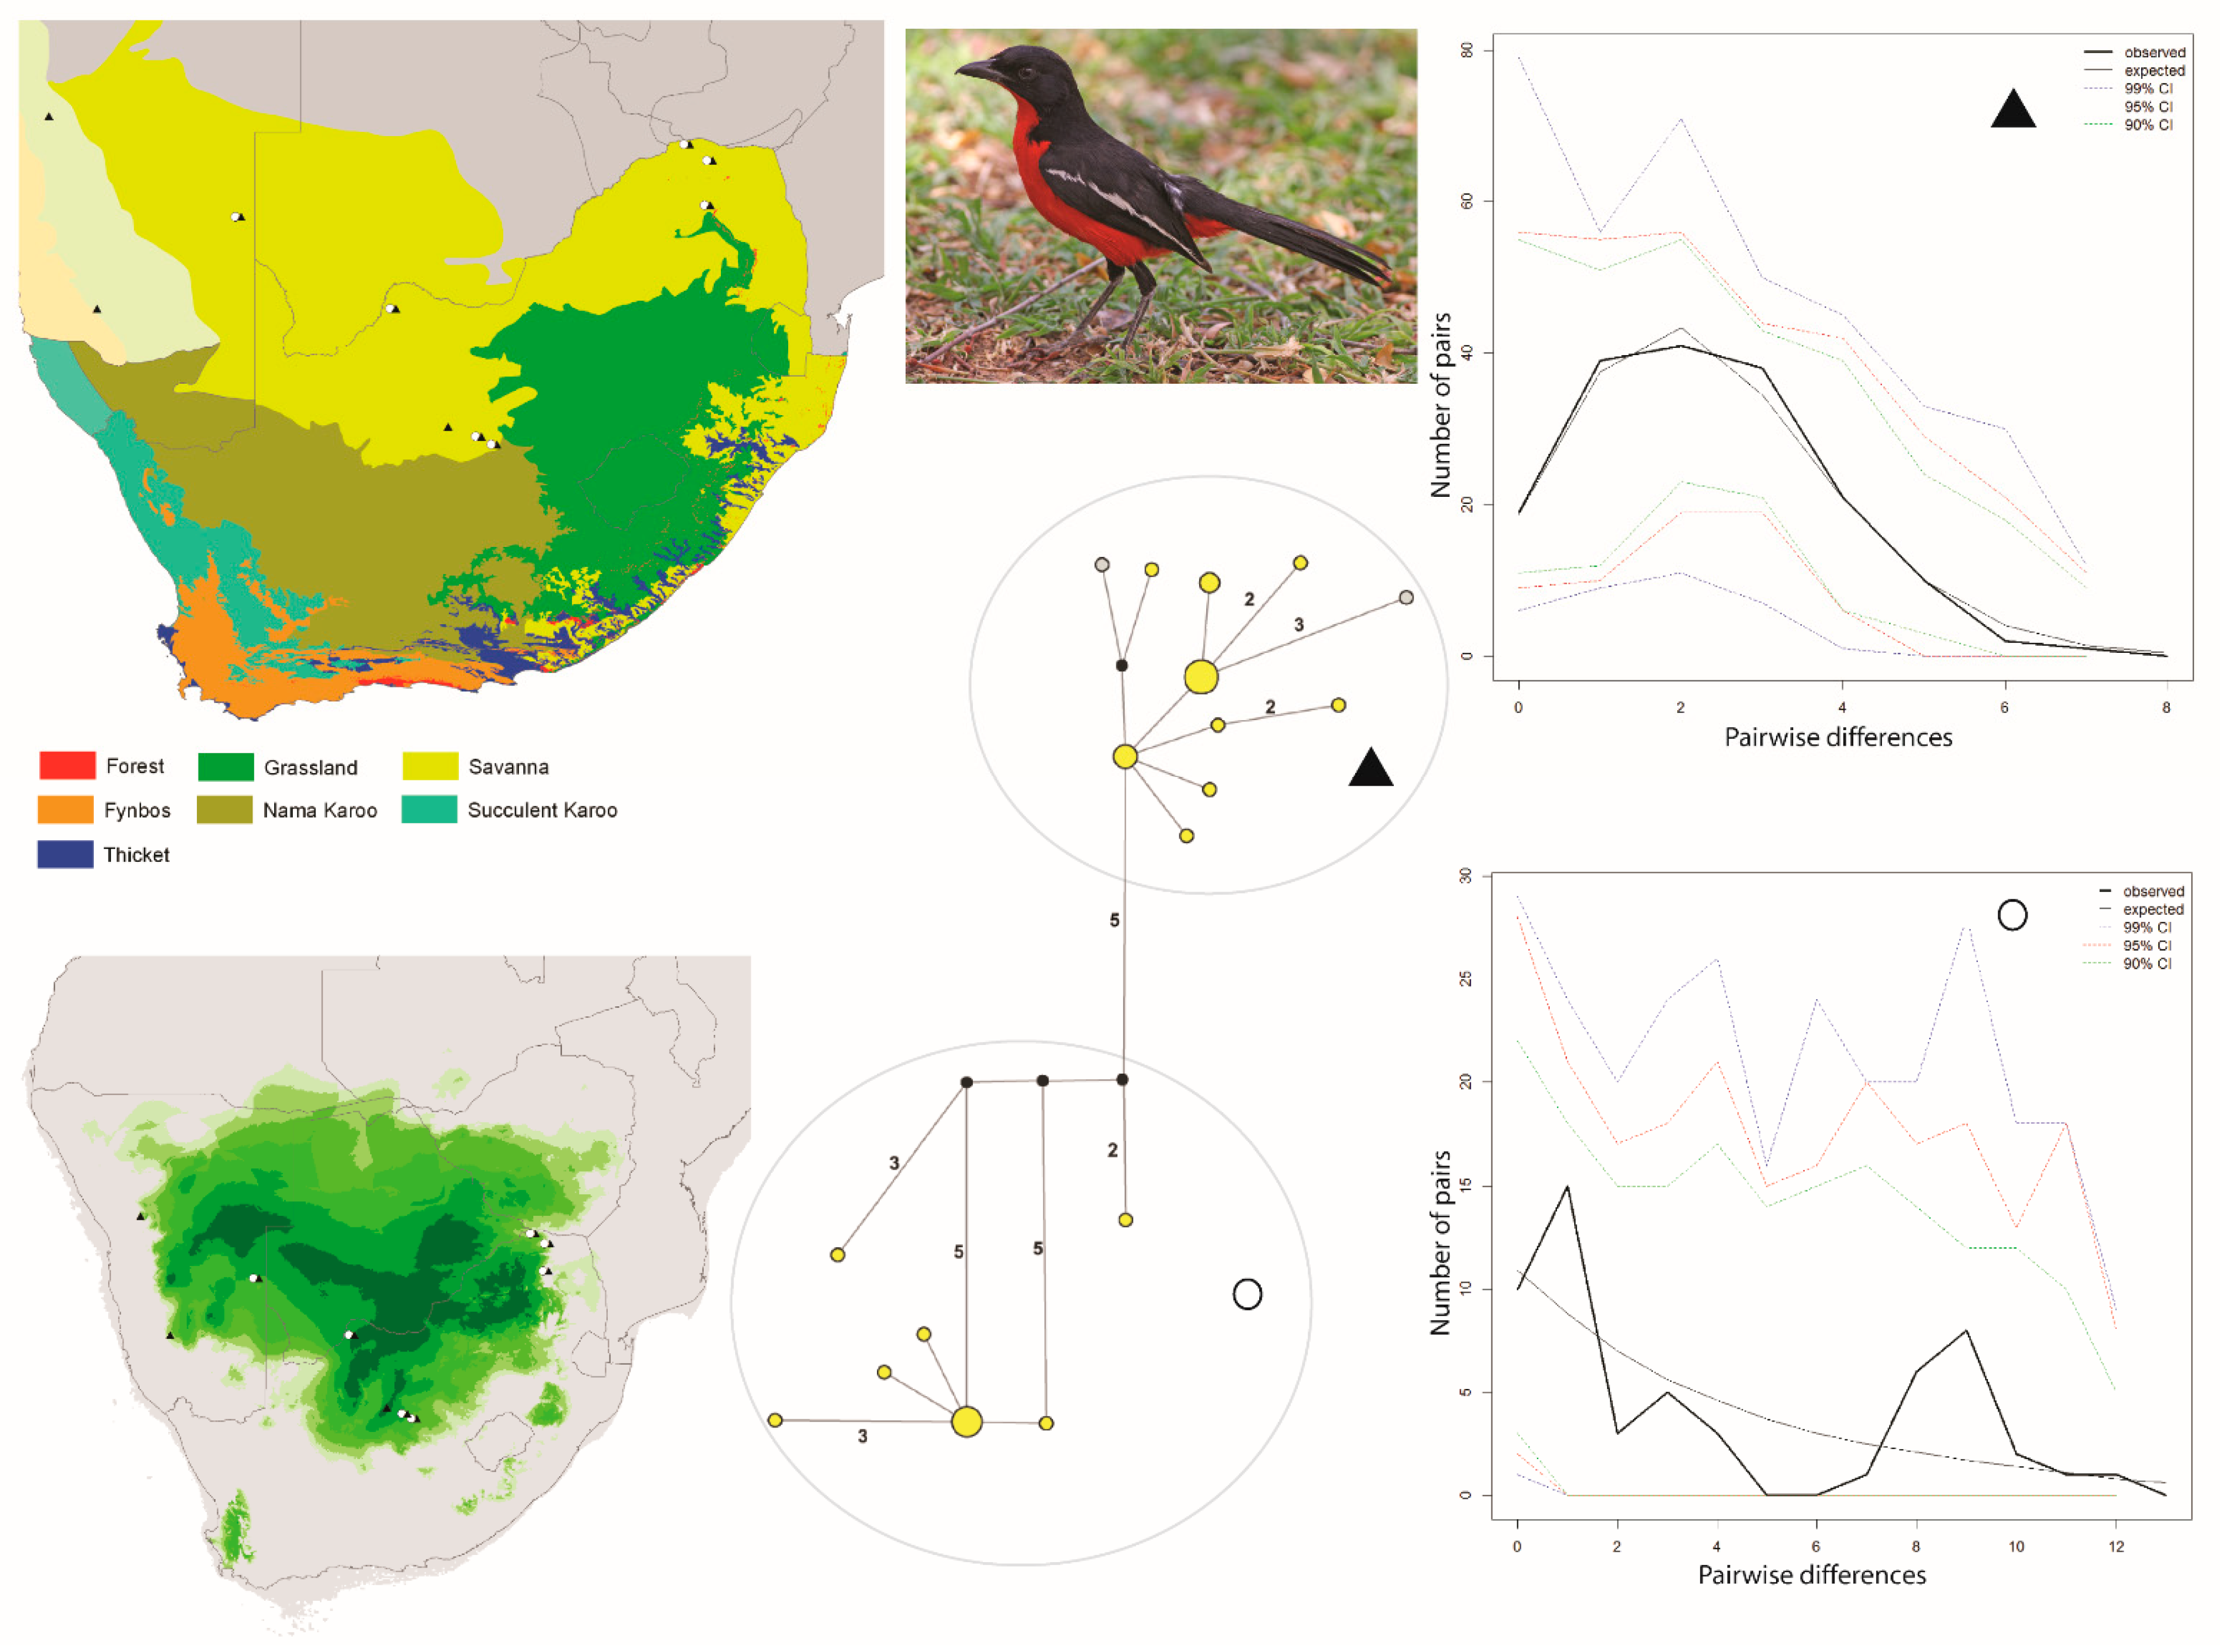
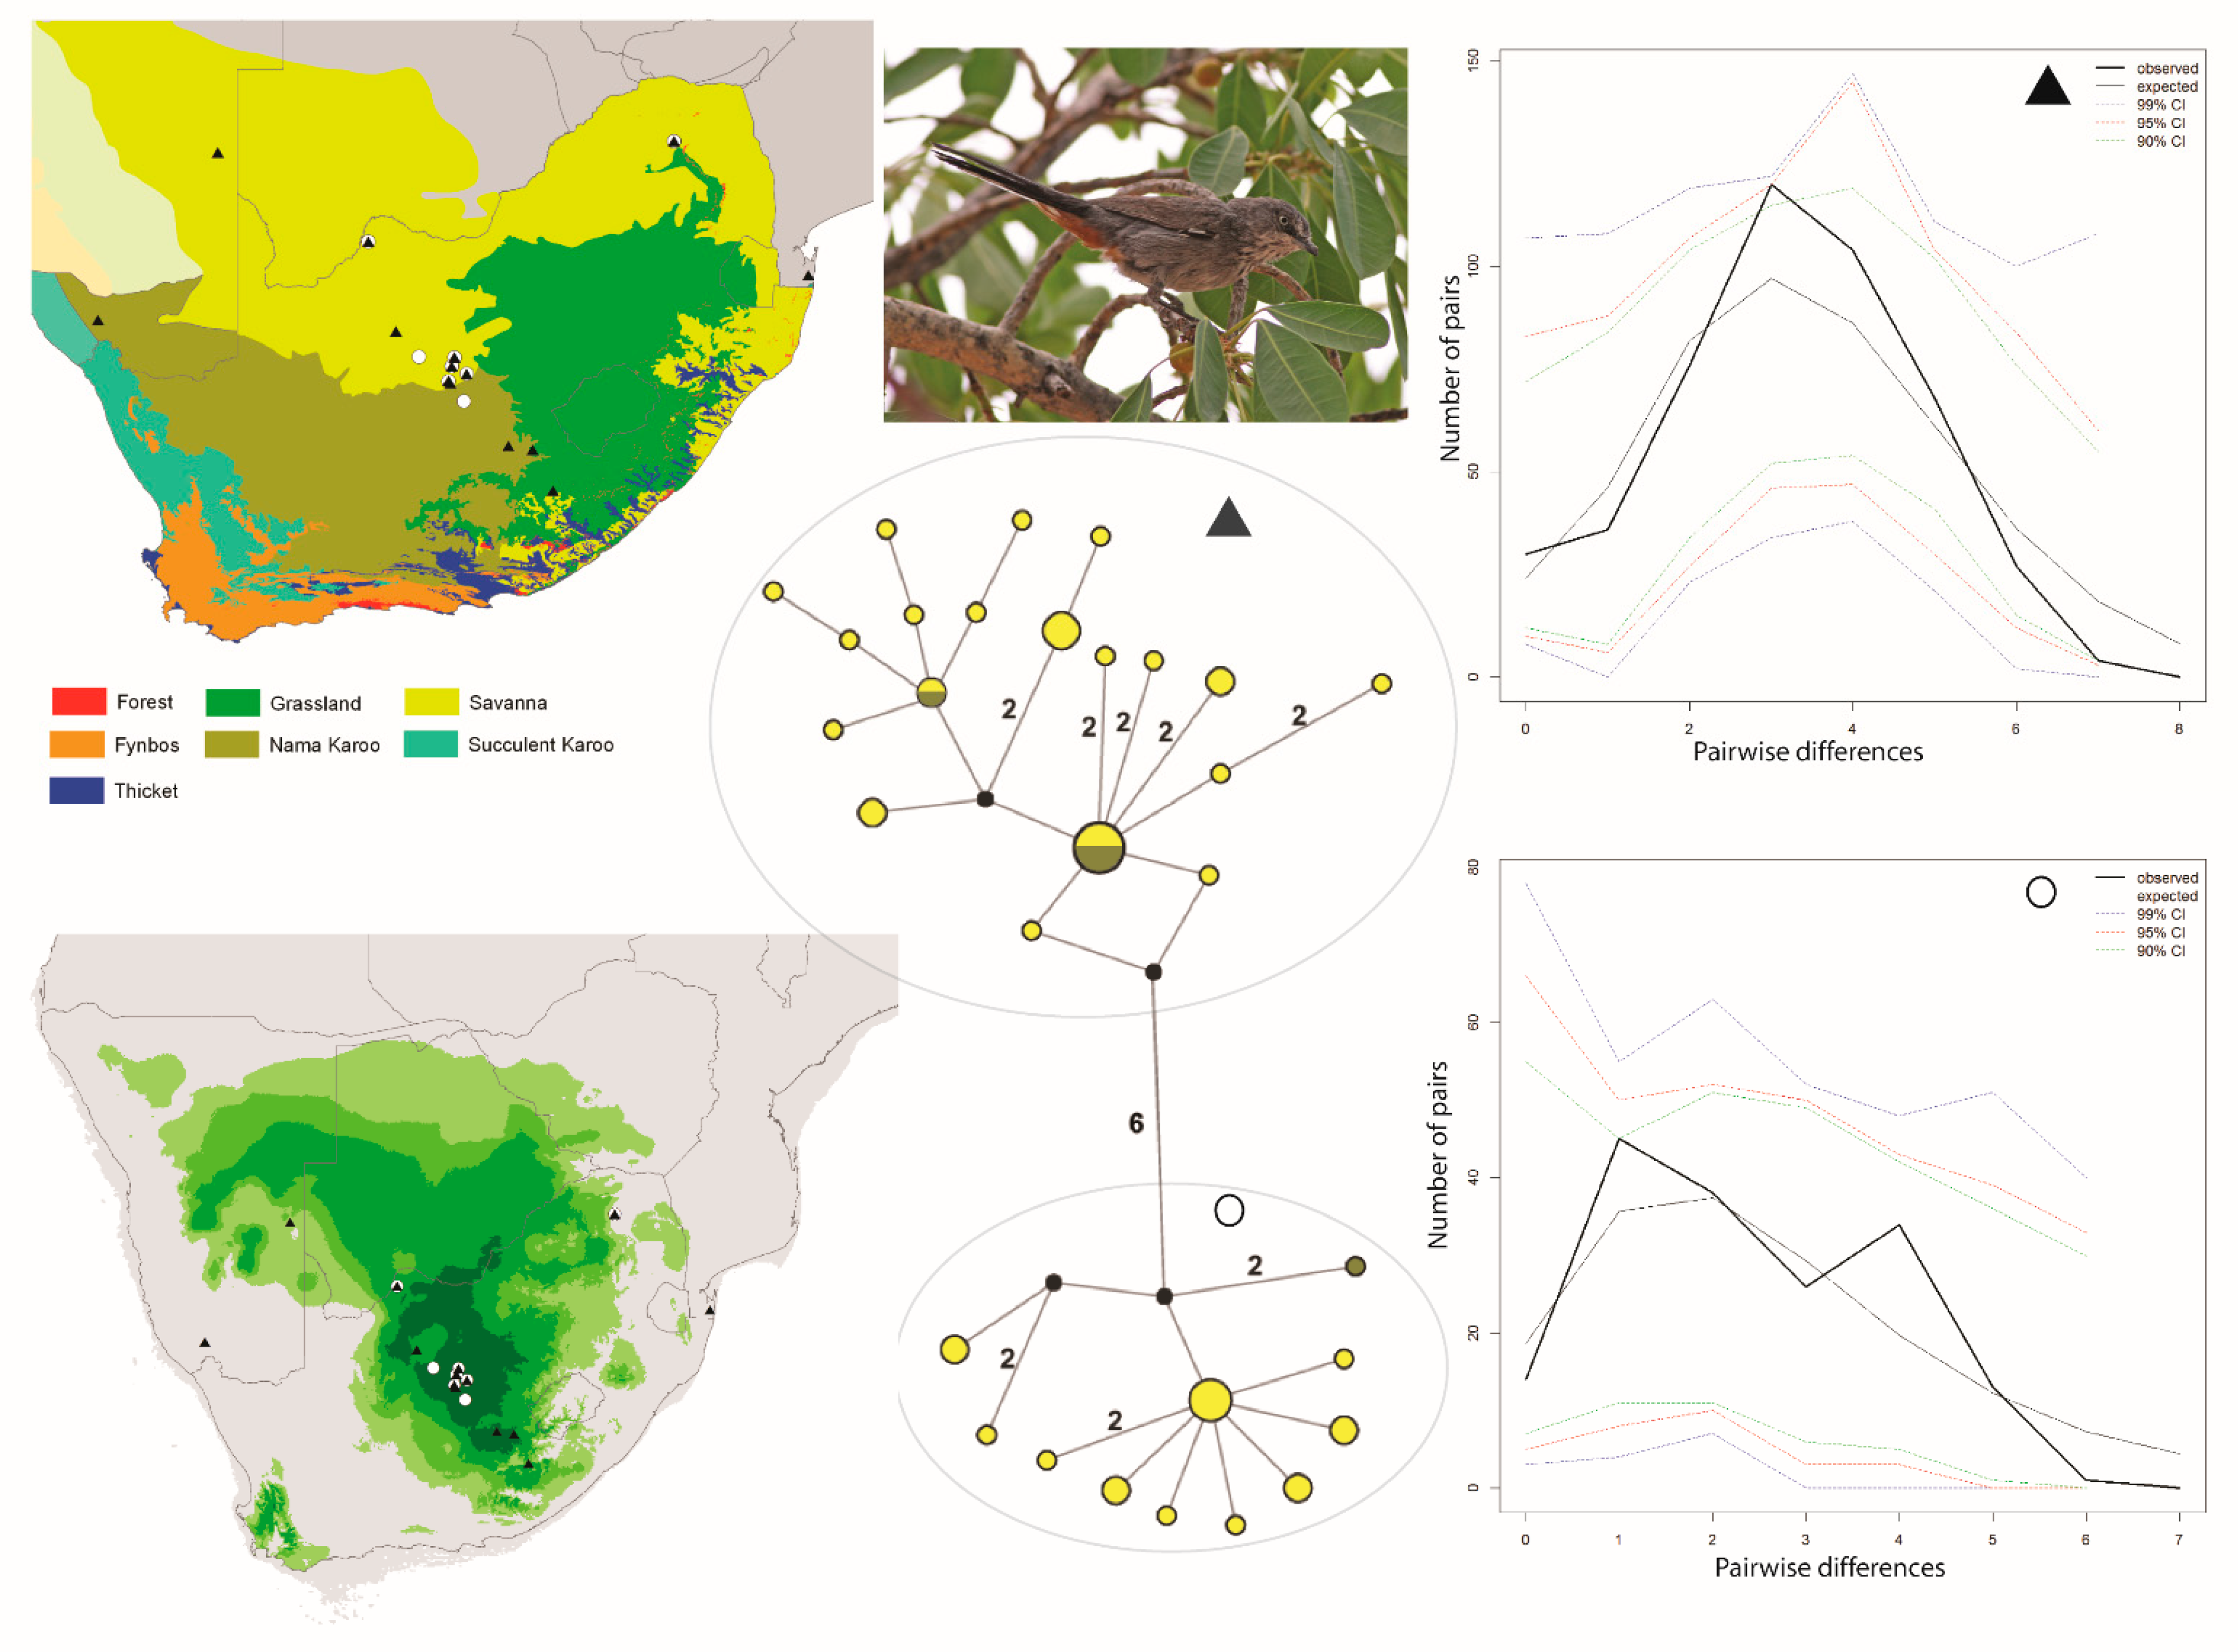
and ▲, within southern Africa that are separated by up to 10 mutational steps; circle sizes in the networks correspond to the number of individuals with that haplotype (larger circles reflect more individuals with that haplotype), and black circles represent unsampled haplotypes. Other colors represent the biome (s) in which a haplotype was collected (top left); however, circle size has no relationship to the number of individuals from a given biome (if a haplotype is found in more than one biome)—in other words, just one individual from a specific biome would contribute that biome color to the circle. The geographic distribution of individuals in each haplotype cluster are depicted with respect to biome type (top left) and to the estimated species stability map (bottom left) is summed across all time slices, with darker shades of green indicating areas of higher stability. Mismatch distributions for each haplotype cluster depict demographic trends within each haplotype cluster (right, top, and bottom, and middle, bottom), where solid lines depict expected (black) and observed (black bold) pairwise differences, and dotted lines depict confidence intervals at 99% (blue), 95% (red), and 90% (green). Photo by Francesco Veronesi (https://www.flickr.com/photos/francesco_veronesi/4465034002/, accessed 10 January 2021).
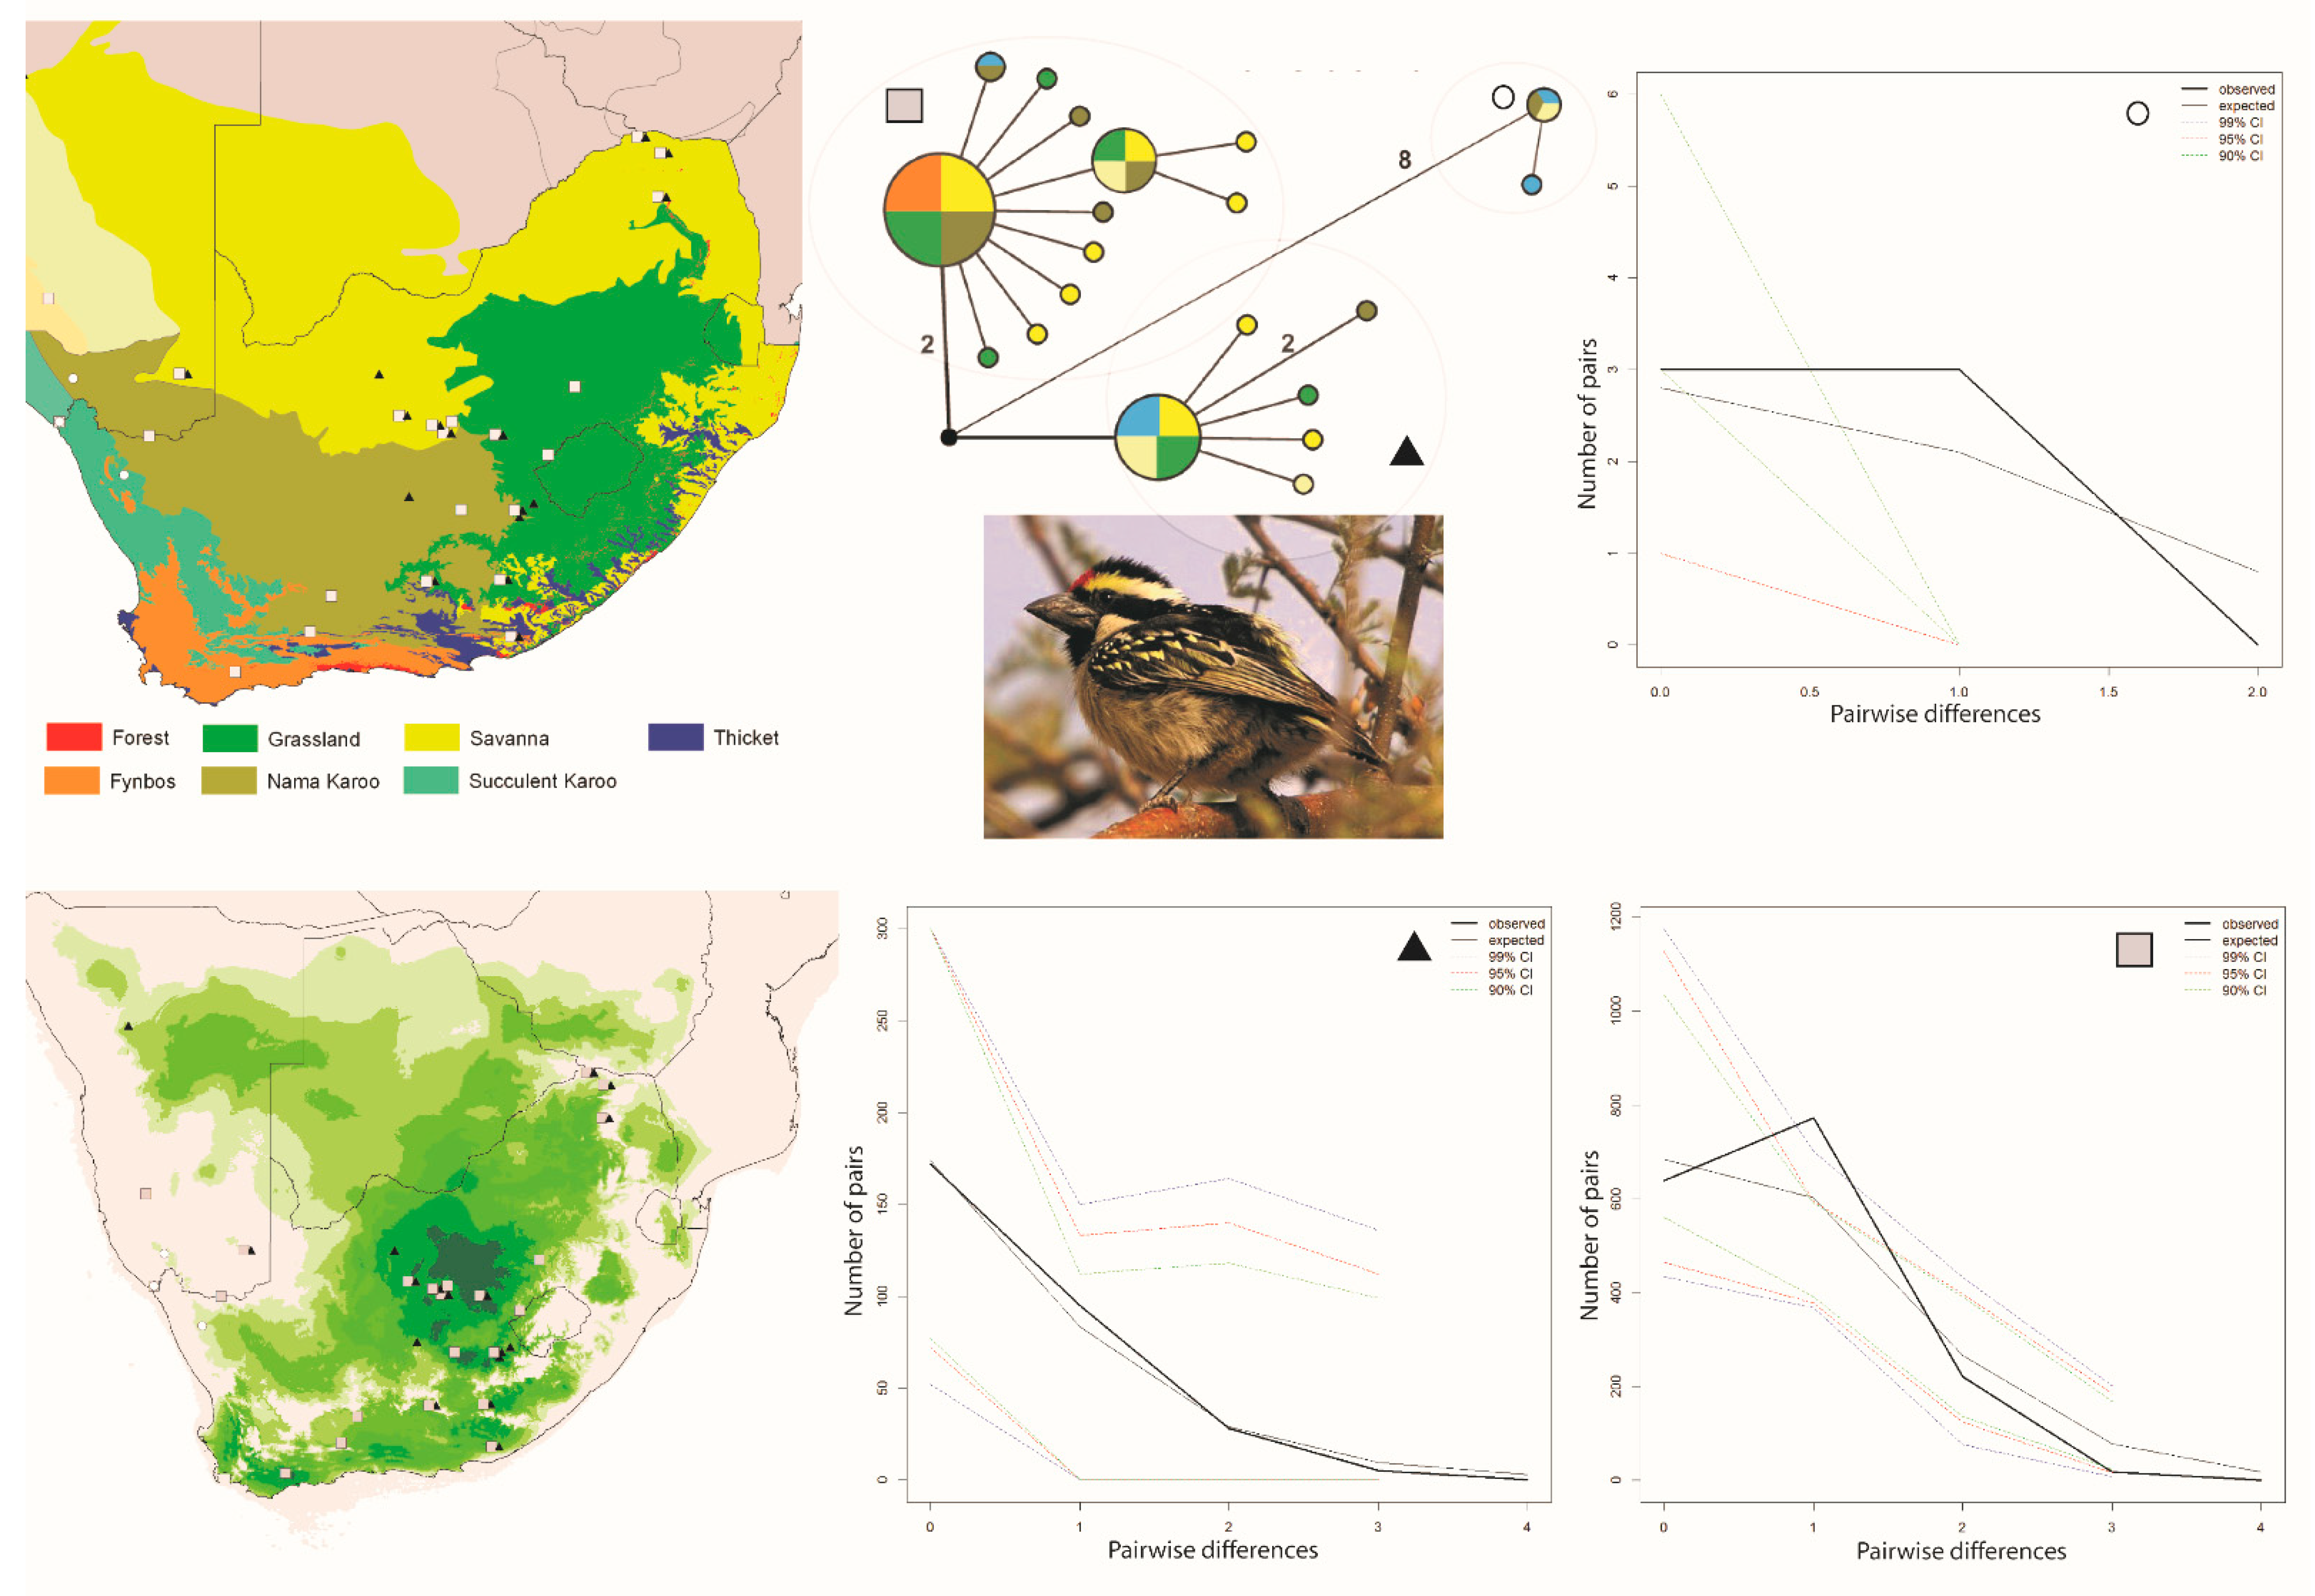
Diversity 13 00434 g003
Figure 4. Bayesian Skyline Plots for each population recovered in the haplotype analyses presented in Figure 1, Figure 2 and Figure 3, where the x axis is time in thousands of years (before present, thus a negative value relative to time 0 which equals present), and the y axis is the estimate of population size (positive or negative, relative to 0 population change). Panel (A,B) are for the two Curruca subcoerulea populations; panels (C,D) are for the two Laniarius atrococcineus populations; panels (EG) are for the three Trichomaela leucomelas populations.
Diversity 13 00434 g004
Table 1. Population genetic estimates for each of the three species evaluated, and for which we have provided the statistics for each of the population scenarios tested (explained in detail in text). π and θ(S) are diversity estimators for each population, while Tajima’s D and Fu’s Fs are used to assess demographic neutrality, where a statistically significant p-value for a negative value suggests population expansion. Both SSD and Harpending’s R statistic are measures relating to mismatch distributions. We evaluated both demographic and spatial scenarios (D, S); a statistically non-significant p-value provides support for an expansion scenario, while a statistically significant p-value supports population stability. p-values are in parentheses, and statistical significance (a ≤ 0.05) is indicated by an *.
Population nπθ(S)Tajima’s DFu’s FsSSD (D)Harpending’s R (D)SSD (S)Harpending’s R (S)
Curruca subcoerulea
O192.3744.292−1.670 (0.031) *−26.159 (0.000) *0.012 (0.050) *0.062 (0.050) *0.012 (0.250)0.062 (0.210)
313.2136.008−1.640 (0.027) *−26.192 (0.000) *0.008 (0.010) *0.034 (0.020) *0.006 (0.180)0.034 (0.210)
Laniarius atrococcineus
O113.9645.804−1.420 (0.069)−8.199 (0.000) *0.046 (0.610)0.084 (0.720)0.040 (0.620)0.084 (0.780)
192.2694.006−1.608 (0.052) *−26.476 (0.000) *0.001 (0.940)0.030 (0.580)0.001 (0.870)0.030 (0.590)
Tricholaema leucomelas
O45.0000.545−0.612 (0.391)−4.644 (0.000) *0.0220 (0.000) *0.250 (1.000)0.022 (0.200)0.250 (1.000)
250.5531.589−1.949 (0.009) *−3.402 × 1038 (0.000) *<0.000 (1.000)0.122 (0.970)0.002 (0.450)0.122 (0.810)
Diversity 13 00434 i001580.7682.376−9.204 (0.010) *−3.402 × 1038 (0.000) *0.078 (0.020) *0.277 (0.030) *0.013 (0.000) *0.134 (0.110)
Publisher’s Note: MDPI stays neutral with regard to jurisdictional claims in published maps and institutional affiliations.

