Article

An Assessment of Applicability of SNP Chip Developed for Domestic Goats in Genetic Studies of Caucasian Tur (Capra caucasica) †

1
L.K. Ernst Federal Science Center for Animal Husbandry, 142132 Podolsk, Moscow Region, Russia
2
Department of Game Management and Bioecology, Irkutsk State University of Agriculture, 664038 Molodezhny, Irkutsk Region, Russia
3
Institut für Tierzucht und Genetik, University of Veterinary Medicine (VMU), A-1210 Vienna, Austria
*
Authors to whom correspondence should be addressed.
This paper is an extended version of the paper published in the 1st International Electronic Conference on Biological Diversity, Ecology, and Evolution (BDEE 2021), Online, 15–31 March 2021.
Diversity 2021, 13(7), 312; https://doi.org/10.3390/d13070312
Submission received: 23 June 2021 / Revised: 6 July 2021 / Accepted: 6 July 2021 / Published: 8 July 2021

Abstract

:
Caucasian tur (Capra caucasica) is native to Greater Caucasus Mountain Chain from Azerbaijan and Georgia in the East to Krasnodar region of Russia in the West. This species is divided into two subspecies (by some authors into species)—East-Caucasian tur and West-Caucasian tur and a subpopulation referred to as Mid-Caucasian tur. Up to date most of the genetic studies of Caucasian tur are based on mitochondrial DNA sequences and comprehensive investigation based on nuclear DNA is required for clarification of its genetic diversity and population structure. In our work, we assessed the applicability of Illumina Goat SNP50 BeadChip for genetic studies of Caucasian tur. Total of 15 specimens of Capra caucasica including East-Caucasian tur from Dagestan (E_TUR, n = 5), West-Caucasian tur from Karachay-Cherkessia (W_TUR, n = 5), and Mid-Caucasian tur from Kabardino-Balkaria (M_TUR, n = 5) were genotyped. After quality control, 5544 polymorphic loci, which were distributed all over 29 autosomes, were detected. The lowest number of SNPs was found on the 25th chromosome—68, and the highest on the 1st chromosome—348. It was shown that all the three groups of Caucasian tur clustered separately. A total of 2061 SNPs were common for all the populations, 594 were found only in W_TUR, 689 in E_TUR, and 530 in M_TUR. Individual heterozygosity ranged from 0.273 to 0.282 in W_TUR, from 0.217 to 0.253 in E_TUR, and from 0.255 to 0.283 in M_TUR. A clinal pattern of genetic variation was revealed. It was suggested to consider Caucasian tur a single species with several ecotypes. Thus, in our study we demonstrated that the Illumina Goat SNP50 BeadChip developed for domestic goats can be used as a useful tool for genetic studies of Caucasian tur.

1. Introduction

Caucasian tur (Capra caucasica) is an ungulate species from the subfamily Caprinae (Figure 1). Its habitat is limited to Greater Caucasus Mountain Chain from Azerbaijan and Georgia in the East to Krasnodar region of Russia in the West (Figure 2). Its range is one of the smallest habitats of all ungulates—around 770 km in length and 80 km in width [1]. Taxonomically, the species is divided into two subspecies: West-Caucasian tur (C. c. severtzovi) and East-Caucasian tur (C. c. cylindricornis). Some authors even considered these populations as different species [2,3,4,5]. The areas of these subspecies are united, and in the territory between them a hybrid form, which is referred to as a Mid-Caucasian tur, is distinguished [6].
The International Union for Conservation of Nature (IUCN) has listed East-Caucasian tur with the total numbers of about 31,000–32,000 animals as near threatened [7] and West-Caucasian tur with census size only around 5000 animals as endangered [8]. Of particular concern is an increasing anthropogenic pressure (poaching, habitat destruction, grazing competition with livestock, etc.,), resulting in migrations to higher mountains and adaptation to nocturnal behavior in some populations.
Little is known about the genetic diversity and evolutionary history of this animal. Only several studies based on Y-chromosome SRY gene and mitochondrial cytochrome b and control region were conducted [9,10,11,12]. To clarify the taxonomy of Caucasian tur and investigate the diversity of its populations molecular genetic studies based on nuclear DNA are needed.
Currently, one of the most effective technologies for molecular genetic research is the genome-wide analysis of single-nucleotide polymorphisms (SNPs). Recent advances in the development of high-throughput genotyping platforms (SNP chips) have turned SNPs into a powerful tool for genetic studies of domestic animals [13,14]. Although such chips are not available for most of the wild animals, the use of the SNP chips developed for their domestic relatives were found to be suitable.
Tokarska et al. [15] used the BovineSNP50 BeadChip created for cattle (Bos taurus) to infer the population structure of European bison (Bos bonasus). Kasarda et al. [16] have demonstrated suitability of the above-mentioned SNP microarray for the evaluation of the Cervidae family diversity. Kharzinova et al. [17,18] have shown the applicability of the BovineSNP50 BeadChip and BovineHD BeadChip for genome-wide studies of reindeer (Rangifer tarandus). The OvineSNP50 BeadChip, created for domestic sheep, was successfully used to study wild Ovis species: bighorn (Ovis canadensis), thinhorn (Ovis dalli) [19,20] and snow sheep (Ovis nivicola) [21].
The first SNP chip for domestic goats—Goat SNP50 BeadChip, containing more than 50,000 markers was developed by the International Goat Genome Consortium in 2011 [22]. In terms of wild species, Goat SNP50 BeadChip, so far was only used for genotyping of Bezoar goat (Capra aegagrus) which is considered the ancestor of domestic goats [23].
It should be noted that for non-model species the genotyping call-rate decreases approximately 1.5% per each million years of divergence time between species and the number of polymorphic sites decline exponentially leveling off after about 5 million years of divergence [20]. Therefore, this approach is not suitable for some analyses, i.e., based on linkage disequilibrium (LD), but meanwhile could be successfully used for investigation of phylogenetic relationships, genetic diversity, admixture, and introgression.
According to the web resource TimeTree (http://www.timetree.org, accessed on 15 May 2021) [24] the estimated median time of Caucasian tur and domestic goat divergence is 1.36 million years ago, which is much less than for the majority of other non-model animals. It gives a great opportunity to investigate phylogeny and genetic characteristics of Capra caucasica.
In this regard, the aim of our study was to assess the applicability of Illumina Goat SNP50 Bead-Chip, developed for domestic goats, for genetic studies of Caucasian tur (Capra caucasica).

2. Materials and Methods
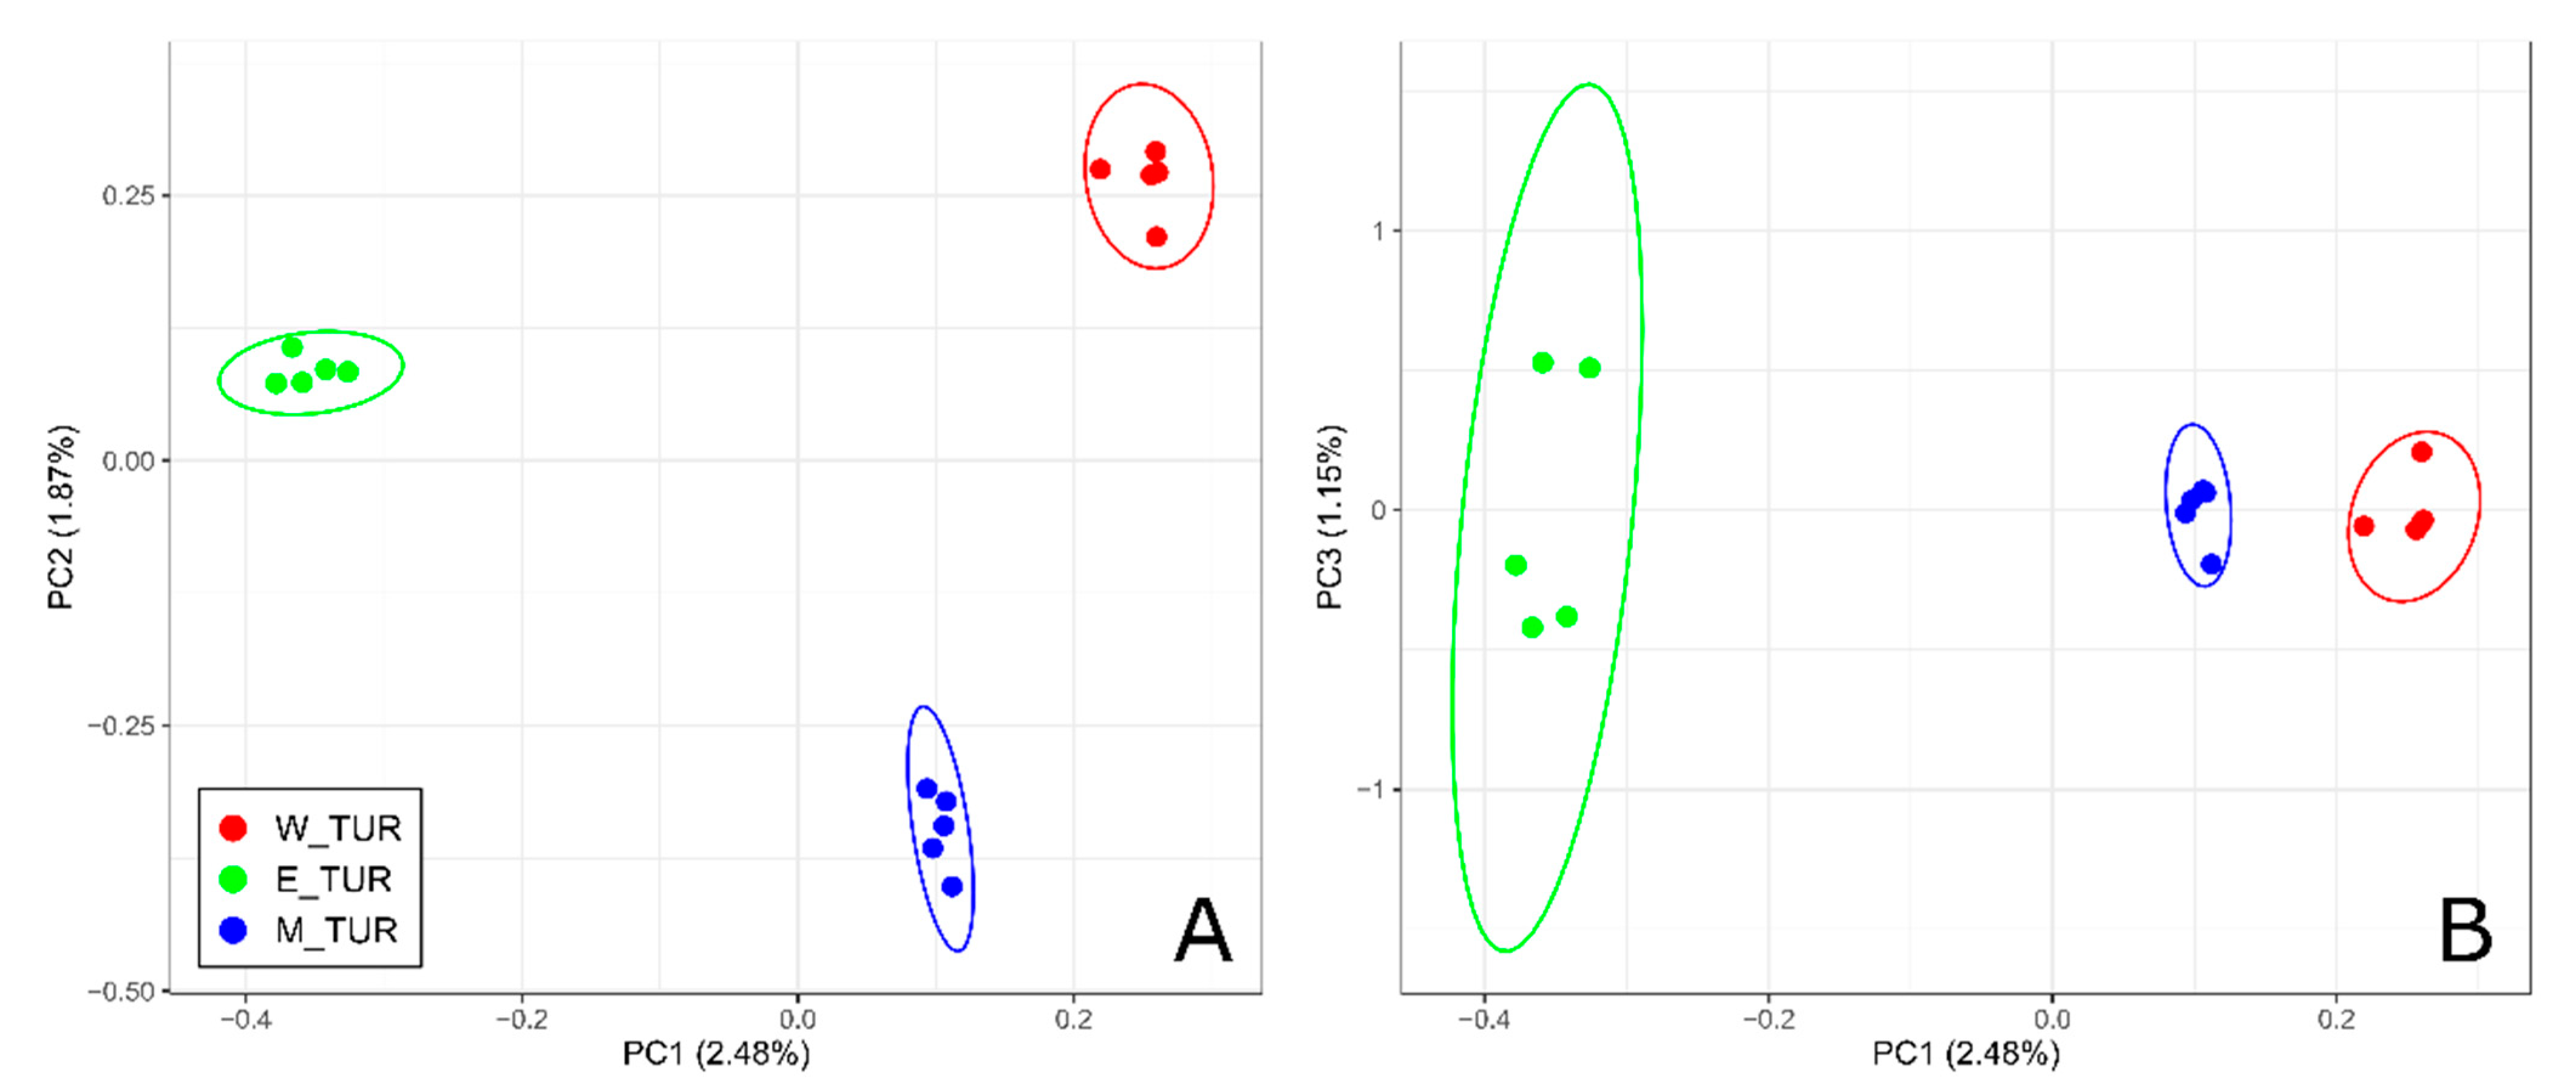
A total of 15 specimens of Capra caucasica, including East-Caucasian tur from Dagestan (E_TUR, n = 5), West-Caucasian tur from Karachay-Cherkessia (W_TUR, n = 5), and Mid-Caucasian tur from Kabardino-Balkaria (M_TUR, n = 5) were selected for this study. The sampling sites are presented in Figure 2. All the samples were taken from trophy hunters of the Mountain Hunters Club (www.kgo-club.ru), who were licensed to hunt Caucasian tur. DNA extraction was carried out using Nexttec columns (Nexttec Biotechnology GmbH, Leverkusen, Germany) in accordance with the manufacturer’s recommendations. SNP genotyping was performed using the Illumina Goat SNP50 BeadChip containing 53,347 SNPs.
SNP quality filtering was performed in PLINK 1.9 [25]. SNPs with unknown positions, located on sex chromosomes as well as those that were genotyped in less than 90% of individuals (− −geno 0.1), with a minor allele frequency (MAF) < 1% (− −maf 0.01) and with deviations from Hardy–Weinberg equilibrium (− −hwe 1e−6) were removed.
For the population genetic analyses (PCA, Admixture, f3 statistics, etc.,) SNPs in linkage disequilibrium (− −indep-pairwise 50 5 0.5) were pruned. The observed (HO) and unbiased expected (HE) heterozygosity [26], inbreeding coefficient (FIS), and rarified allelic richness (AR) were calculated in the R package “diveRsity” [27]. Pairwise FST genetic distances [28] were calculated in the R package “StAMPP” [29]. Principle component analysis was performed with PLINK 1.9 (− −pca 4) and visualized in the R package “ggplot2” [30]. An individual tree based on the pairwise identity-by-state (IBS) distance matrix (− −distance 1-ibs) was constructed using the Neighbor-Net algorithm implemented in SplitsTree 4.14.6 [31]. To estimate and visualize the distribution of heterozygosity at the individual level, multilocus heterozygosity (MLH) was calculated in the R package “inbreedR” [32]. Venn diagram was constructed in the R package “VennDiagram” [33]. Cluster analysis was performed in Admixture 1.3 software [34], and visualized in the R package “pophelper” [35]. f3 statistics [36] was computed using ADMIXTOOLS [37], as implemented in the R package “admixr” [38]. The map with sampling sites was created using R packages “maps” [39] and “ggplot2”. As long as the Illumina Goat SNP50 BeadChip was developed for domestic goats (Capra hircus), the positions on chromosomes in this paper correspond to the reference genome of a domestic goat.

3. Results

From the initial set of 53,347 SNPs available in the Illumina Goat SNP50 BeadChip after quality control procedures (− −geno 0.1, − −maf 0.01) 5544 variants (10.4%) passed all the filters while 7002 variants were removed due to missing genotype data and 37,407 variants were removed due to minor allele threshold. No SNPs were removed due to Hardy–Weinberg exact test (Table S2). Total genotyping rate for the 15 samples of Caucasian tur was 94.8%. The selected polymorphic loci were distributed all over 29 autosomes. The lowest number of SNPs was found on the 25th chromosome—68, and the highest on the 1st chromosome—348 (Figure 3A). A similar pattern was observed for the three populations examined separately (Figure 3B–D), (Figure S1).
Mean minor allele frequency (MAF) computed for all the populations was 0.214 ± 0.002. About 2474 SNPs were highly informative with MAF > 0.3 and 1895 SNPs had minor allele frequency less than 0.1 (Figure S2).
While 2061 polymorphic SNPs were common for all the Caucasian tur groups, the number of unique SNPs for W_TUR, E_TUR and M_TUR was 594, 689, and 530, respectively. The most shared SNPs between two groups was found in W_TUR—M_TUR pair—869, and the least number of shared loci was observed in W_TUR—E_TUR pair—420 (Figure 4).
For all the next analyses LD pruning was performed, after which 3885 SNPs were selected.
The results of the principal component analysis (PCA) revealed that all the studied groups of Caucasian tur clustered separately (Figure 5).
The first component (PC1), which explained 2.48% of genetic variability, divided Caucasian tur into two groups. The first group consisted of E_TUR (PC1 < 0) and the second one included W_TUR and M_TUR (PC1 > 0).
The level of genetic differentiation was estimated with pairwise FST distances (Table 1).
We observed the highest FST value between W_TUR and E_TUR—0.161. M_TUR was genetically closer to W_TUR than to E_TUR, but in both cases the differentiation was moderate—0.099 and 0.135, respectively.
The above-mentioned results were also supported with Neighbor-Net dendrogram (Figure 6).
All the studied individuals were placed in clades according to their geographical origin. This analysis also revealed that there were no close relatives among the 15 genotyped animals.
Expected heterozygosity (HE) and allelic richness (AR) in W_TUR were significantly higher than in E_TUR (for both indicators t-test p-values were less than 0.0001) (Table 2). Slightly higher genetic diversity parameters were observed in M_TUR. The within population inbreeding coefficient (FIS) was close to zero in W_TUR and M_TUR which showed that these groups were in a fairly stable state, and slightly higher than zero in E_TUR, which indicated weak heterozygote deficit.
Individual heterozygosity values, which were represented by multilocus heterozygosity (MLH) showed that all the E_TUR individuals had lower heterozygosity (from 0.217 to 0.253) than both W_TUR (from 0.273 to 0.282) and M_TUR (from 0.255 to 0.283) (Figure 7).
Although mean values of multilocus heterozygosity were almost equal in W_TUR—0.277 ± 0.002 and in M_TUR—0.269 ± 0.005, the range of values was wider in M_TUR than in W_TUR. In E_TUR mean MLH was significantly lower—0.233 ± 0.006.

4. Discussion

In our study we assessed the applicability of Illumina Goat SNP50 BeadChip, developed for domestic goats (Capra hircus), for genetic studies of Caucasian tur (Capra caucasica). About 15 individuals that belong to three groups of Caucasian tur (West-Caucasian tur, East-Caucasian tur, and Mid-Caucasian tur) were genotyped with 5544 polymorphic loci (3885 SNPs after LD pruning) distributed all over 29 autosomes. This number of polymorphic sites is sufficient for carrying out phylogenetic studies and assessing the genetic diversity. For instance, in the work on European bison only 960 SNPs were used [15], 1121 polymorphic loci were detected for snow sheep (Ovis nivicola) [21], and based on 7303 SNPs, population structure and genetic diversity of reindeer were investigated [18].
Regarding intraspecific taxonomy of Caucasian tur, there are two main questions to which there is still no answer: (1) Whether the West-Caucasian tur and the East-Caucasian tur are one species or should they be considered different species; (2) is the Mid- Caucasian tur a separate subspecies or a hybrid form. The works of 19th and 20th centuries, based on the morphological characteristics could not resolve these problems. The majority of authors such as Lydekker [2], Tsalkin [3], Geptner [4], Damm [5] suggested division into two species—C. cylindricornis and C. caucasica. Unlike the above-mentioned authors, Sokolov [42] and Tembotov [43] proposed to recognize one species—Capra caucasica with several subspecies C. c. severtzovi, C. c. cylindricornis, C. c. caucasica, and C. c. dinniki. Couturier [44] in 1962 suggested the presence of East West morphological cline in Caucasian tur and indicated that there is only one taxon in the Caucasus (C. aegagrus caucasica). Thirty years later Ayunts [45] showed a smooth transition in the variability of horns in tur, the main distinguishing feature of these populations and noted that Caucasian tur was represented by a number of slightly different groups and that the division into subspecies was not justified.
Currently in the era of molecular genetic studies, many taxonomic riddles were resolved. Clarification of the phylogeny in the subfamily Caprinae made it possible to determine the status of three subspecies of tahr, which are now considered different genera—Hemitragus, Nilgiritragus, and Arabitragus [46]. New subspecies of blue sheep (Pseudois nayar) [47] and snow sheep (Ovis nivicola) [21,48] were identified.
To date molecular genetic studies of Caucasian tur were based on the investigation of mitochondrial DNA and Y-chromosome. Manceau et al. [9] examined concatenated fragments of cytochrome b and control region (500 bp in length) of three samples of East-Caucasian tur and nine samples of West-Caucasian tur. Kazanskaya et al. [10] examined fragments of cytochrome b and control region of eight samples of East-Caucasian tur and nine samples of West-Caucasian tur. In the research of Zvychaynaya [11] the cytochrome b fragment (1128 bp) and Y-chromosome intron of gene SRY (1832 bp) of West-Caucasian tur (n = 6) and East-Caucasian (n =6) tur were analyzed. Kashinina and Kholodova [12] examined a 715 bp fragment of cytochrome b gene in six samples of East-Caucasian tur, 11 samples of West-Caucasian tur and eight samples of Mid-Caucasian tur. In all the above-mentioned studies strong East–West differentiation in the Caucasian tur was demonstrated and therefore all the authors supported evidence for the existence of two species—C. caucasica and C. cylindricornis. In the work of Zvychaynaya [11], some mtDNA and Y-chromosome haplotype mixture was observed in the Central Caucasus that was explained as the evidence of C. caucasica and C. cylindricornis hybridization. In all the mtDNA studies the authors emphasized that further research on nuclear markers should be performed.
Our preliminary analysis of nuclear DNA markers confirmed clear genetic differentiation between all the three studied populations. PCA analysis showed a clear division into clusters, however the percent of genetic variation was very low—2.48. Pairwise FST genetic distance between the most distant populations was only 0.161, which is too low for dividing them into species and even subspecies (e.g., in Yakut snow sheep (Ovis nivicola lydekkeri) pairwise FST values ranged from 0.044 to 0.144 within the subspecies, and from 0.112 to 0.205 with the proposed new subspecies [21]). Moreover, this was also confirmed by cross-validation (CV) error calculated for the cluster analysis (Figure S3), which suggested that K (optimum number of populations in our dataset) was 1 (Figure 8).
Mid-Caucasian tur was genetically a little closer to West-Caucasian tur (FST 0.99) than to East-Caucasian tur (FST 0.135) but we did not find any evidence that this population arose as a result of hybridization. Heterozygosity in Mid-Caucasian tur was a little lower than in West-Caucasian tur. The number of unique SNPs was even lower than in both West-Caucasian and East-Caucasian tur. The values of f3 statistics, that is a test revealing if the population of interest is the result of admixture between two other populations, were not significant and therefore also rejected the hypothesis of hybrid origin of Mid-Caucasian tur (Table S1). Based on the above we suggest that Caucasian tur genetic variation follows a clinal pattern [49] and therefore it should be considered a single species—Capra caucasica, which includes several ecotypes. The division into subspecies does not seem to be justified. Thus, the results of our investigation based on nuclear molecular genetic markers agree with Ayunts’s study [45] on variability of horns and confirming the hypothesis proposed by Couturier [44]. Further research with the collection of more samples will help to give a final answer regarding the intraspecific taxonomy of the Caucasian tur, reconstruct the natural history of the species formation, and assess the genetic diversity.

5. Conclusions

Here we demonstrated that the Illumina Goat SNP50 BeadChip developed for domestic goats could be used as a useful tool for genetic studies of Caucasian tur. It was shown that West-Caucasian tur, East-Caucasian tur, and Mid-Caucasian tur clustered separately from each other. Genetic diversity parameters in East-Caucasian tur were lower than in the other groups. A clinal pattern of genetic variation was revealed. It was suggested to consider Caucasian tur a single species with several ecotypes. To obtain more accurate information about population structure and genetic diversity of Caucasian tur, further studies based on Illumina Goat SNP50 Bead-Chip with larger number of samples are needed.

Supplementary Materials

The following are available online at https://www.mdpi.com/article/10.3390/d13070312/s1. Figure S1: Proportion of polymorphic sites per chromosome in Caucasian tur (Capra caucasica). Figure S2: Minor allele frequency (MAF) in Caucasian tur (Capra caucasica). Figure S3: Admixture clustering results at K = 2 and K = 3 for the three populations of Caucasian tur. Table S1: The results of f3 statistics computed for the three populations of Caucasian tur. Table S2: Hardy–Weinberg equilibrium p-values and minor allele frequency in SNPs selected for the study of Caucasian tur (Capra caucasica).

Author Contributions

Conceptualization, A.V.D. and N.A.Z.; methodology, A.V.D., A.N.R., V.R.K., G.B.; software, A.N.R.; validation, A.V.D. and V.R.K.; formal analysis, A.V.D. and V.R.K.; investigation, A.V.D., A.N.R., and S.N.P.; resources, D.G.M. and V.A.B.; data curation, A.V.D., G.B., and N.A.Z.; writing—original draft preparation, A.V.D.; writing—review and editing, V.R.K. and N.A.Z.; visualization, A.V.D. and S.N.P.; supervision, N.A.Z.; project administration, A.V.D.; funding acquisition, A.V.D. All authors have read and agreed to the published version of the manuscript.

Funding

This study was supported by the Russian Scientific Foundation within Project No. 21-66-00007 (genome-wide SNP genotyping and data analysis) and the Russian Ministry of Science and Higher Education within theme No. 0445-2019-0024 (sample collecting and creation of DNA Bank).

Institutional Review Board Statement

Not applicable.

Informed Consent Statement

Not applicable.

Data Availability Statement

SNP genotypes of Caucasian tur are available on reasonable request after signing research (MTA) agreement.

Acknowledgments

We are grateful to Bendersky E.V. and the Mountain Hunters Club (www.kgo-club.ru) for providing the samples of Caucasian tur. We thank Mitya Andreev and Anya Andreeva (http://mountaindreams.ru accessed on 17 June 2021) for providing the photo of Caucasian tur.

Conflicts of Interest

The authors declare no conflict of interest.

References

  1. Weinberg, P.J.; Akkiev, M.I.; Buchukuri, R.G. Tur of the Caucasus: Morphology, taxonomy and conservation strategy. Status and Protecyion of Globally Threatened Species in the Caucasus. In CEPF Biodiversity Investments in the Caucasus Hotspot 2004–2009; Zazanashvili, N., Mallon, D., Eds.; Contour Ltd.: Tbilisi, Georgia, 2009; pp. 83–91. [Google Scholar]
  2. Lydekker, R. Wild Oxen, Sheep, and Goats of All Lands; Rowland Ward: London, UK, 1898; p. 318. [Google Scholar]
  3. Tsalkin, V.I. Variability and systematics of tur of the West Caucasus (Caprinae, Artiodactyla). Byulleten Mosk. Obs. Ispyt. Prir. Otd. Biol. 1955, 60, 17–33. (In Russian) [Google Scholar]
  4. Geptner, V.G.; Nasimovich, A.A.; Bannikov, A.G. Mammals of the Soviet Union. Ungulates and Not Ungulates; Higher School: Moscow, Russia, 1961; Volume 1, p. 776. (In Russia) [Google Scholar]
  5. Damm, G.R.; Franco, N. CIC Caprinae Atlas of the World; CIC International Council for Game and Wildlife Conservation: Budakeszi, Hungary; Rowland Ward Publications: Johannesburg, South Africa, 2014. [Google Scholar]
  6. Gromov, I.M.; Gureev, A.A.; Novikov, G.A.; Sokolov, I.I.; Strelkov, P.P.; Chapskii, K.K. Mammal. Fauna of the USSR V.2.; Academy of Sciences of the USSR: Moscow-Leningrad, Russia, 1963; pp. 1047–1050. (In Russian) [Google Scholar]
  7. Lortkipanidze, B.; Weinberg, P. Capra cylindricornis. The IUCN Red List of Threatened Species 2020: E.T3795A91287260. [CrossRef]
  8. Weinberg, P. Capra caucasica. The IUCN Red List of Threatened Species 2020: E.T3794A22143809. [CrossRef]
  9. Manceau, V.; Després, L.; Bouvet, J.; Taberlet, P. Systematics of the genus Capra inferred from mitochondrial DNA sequence data. Mol. Phylogenetics Evol. 1999, 13, 504–510. [Google Scholar] [CrossRef] [PubMed]
  10. Kazanskaya, E.Y.; Kuznetsova, M.V.; Danilkin, A.A. Phylogenetic reconstructions in the genus Capra (Bovidae, Artiodactyla) based on the mitochondrial DNA analysis. Russ. J. Genet. 2009, 43, 245–253. (In Russian) [Google Scholar] [CrossRef]
  11. Zvychaynaya, E.Y. Genetic differentiation of the wild goats (genus Capra) based on the analysis of mitochondrial gene cytochrome b and fragment of nuclear gene SRY. Galemys 2010, 22, 255–276. [Google Scholar]
  12. Kashinina, N.V.; Kholodova, M.V. Currunt genetic structure of Caucasian turs Capra caucasica and C. cylindricornis. In Conference Proceedings: Topical Issues of Modern Zoology and Ecology of Animals; Penza, Russia, 2016; p. 46. [Google Scholar]
  13. Coates, B.S.; Sumerford, D.V.; Miller, N.J.; Kim, K.S.; Sappington, T.W.; Siegfried, B.D.; Lewis, L.C. Comparative performance of single nucleotide polymorphism and microsatellite markers for population genetic analysis. J. Hered. 2009, 100, 556–564. [Google Scholar] [CrossRef] [Green Version]
  14. Kijas, J.W.; Townley, D.; Dalrymple, B.P.; Heaton, M.P.; Maddox, J.F.; McGrath, A. The International Sheep Genomics Consortium. A genome wide survey of SNP variation reveals the genetic structure of sheep breeds. PLoS ONE 2009, 4, e4668. [Google Scholar] [CrossRef] [PubMed] [Green Version]
  15. Tokarska, M.; Marshall, T.; Kowalczyk, R.; Wójcik, J.M.; Pertoldi, C.; Kristensen, T.N.; Loeschcke, V.; Gregersen, V.R.; Bendixen, C. Effectiveness of microsatellite and SNP markers for parentage and identity analysis in species with low genetic diversity: The case of European bison. Heredity 2009, 103, 326–332. [Google Scholar] [CrossRef] [Green Version]
  16. Kasarda, R.; Moravcikova, N.; Sidlova, V.; Trakovicka, A.; Kadlecik, O.; Pokoradi, J.; Zidek, R. Suitability of BovineSNP50 BeadChip for the evaluation of the Cervidae family diversity. Czech. J. Anim. Sci. 2015, 60, 391–399. [Google Scholar] [CrossRef] [Green Version]
  17. Kharzinova, V.R.; Sermyagin, A.A.; Gladyr, E.A.; Okhlopkov, I.M.; Brem, G.; Zinovieva, N.A. A study of applicability of SNP chips developed for Bovine and Ovine species to whole-genome analysis of Reindeer Rangifer tarandus. J. Hered. 2015, 106, 758–761. [Google Scholar] [CrossRef]
  18. Kharzinova, V.; Dotsev, A.; Solovieva, A.; Sergeeva, O.; Bryzgalov, G.; Reyer, H.; Wimmers, K.; Brem, G.; Zinovieva, N. Insight into the current genetic diversity and population structure of domestic reindeer (Rangifer tarandus) in Russia. Animals 2020, 10, 1309. [Google Scholar] [CrossRef]
  19. Miller, J.M.; Poissant, J.; Kijas, J.W.; Coltman, D.W. The International Sheep Genomics Consortium. A genome-wide set of SNPs detects population substructure and long range linkage disequilibrium in wild sheep. Mol. Ecol. Resour. 2011, 11, 314–322. [Google Scholar] [CrossRef]
  20. Miller, J.M.; Kijas, J.W.; Heaton, M.P.; McEwan, J.C.; Coltman, D.W. Consistent divergence times and allele sharing measured from cross-species application of SNP chips developed for three domestic species. Mol. Ecol. Resour. 2012, 12, 1145–1150. [Google Scholar] [CrossRef] [PubMed] [Green Version]
  21. Dotsev, A.V.; Deniskova, T.E.; Okhlopkov, I.M.; Mészáros, G.; Sölkner, J.; Reyer, H.; Wimmers, K.; Brem, G.; Zinovieva, N.A. Genome-wide SNP analysis unveils genetic structure and phylogeographic history of snow sheep (Ovis nivicola) populations inhabiting the Verkhoyansk Mountains and Momsky Ridge (Northeastern Siberia). Ecol. Evol. 2018, 8, 8000–8010. [Google Scholar] [CrossRef] [PubMed]
  22. Tosser-Klopp, G.; Bardou, P.; Bouchez, O.; Cabau, C.; Crooijmans, R.; Dong, Y.; Donnadieu-Tonon, C.; Eggen, A.; Heuven, H.C.; Jamli, S.; et al. Design and characterization of a 52 K SNP chip for goats. PLoS ONE 2014, 9, e86227. [Google Scholar] [CrossRef] [PubMed]
  23. Bertolini, F.; Servin, B.; Talenti, A.; Rochat, E.; Kim, E.S.; Oget, C.; Palhière, I.; Crisà, A.; Catillo, G.; Steri, R.; et al. Signatures of selection and environmental adaptation across the goat genome post-domestication. Genet. Sel. Evol. 2018, 50, 57. [Google Scholar] [CrossRef]
  24. Kumar, S.; Stecher, G.; Suleski, M.; Hedges, S.B. TimeTree: A Resource for Timelines, Timetrees, and Divergence Times. Mol. Biol. Evol. 2017, 34, 1812–1819. [Google Scholar] [CrossRef]
  25. Purcell, S.; Neale, B.; Todd-Brown, K.; Thomas, L.; Ferreira, M.A.; Bender, D.; Maller, J.; Sklar, P.; de Bakker, P.I.W.; Daly, M.J.; et al. PLINK: A tool set for whole-genome association and population-based linkage analyses. Am. J. Hum. Genet. 2007, 81, 559–575. [Google Scholar] [CrossRef] [Green Version]
  26. Nei, M. Estimation of average heterozygosity and genetic distance from a small number of individuals. Genetics 1978, 83, 583–590. [Google Scholar] [CrossRef]
  27. Keenan, K.; McGinnity, P.; Cross, T.F.; Crozier, W.W.; Prodöhl, P.A. diveRsity: An R package for the estimation and exploration of population genetics parameters and their associated errors. Methods Ecol. Evol. 2013, 4, 782–788. [Google Scholar] [CrossRef] [Green Version]
  28. Weir, B.S.; Cockerham, C.C. Estimating F-Statistics for the analysis of population structure. Evolution 1984, 38, 1358–1370. [Google Scholar]
  29. Pembleton, L.W.; Cogan, N.O.; Forster, J.W. StAMPP: An R package for calculation of genetic differentiation and structure of mixed-ploidy level populations. Mol. Ecol. Resour. 2013, 13, 946–952. [Google Scholar] [CrossRef]
  30. Wickham, H. Ggplot2: Elegant Graphics for Data Analysis; Springer: New York, NY, USA, 2009. [Google Scholar] [CrossRef]
  31. Huson, D.H.; Bryant, D. Application of phylogenetic networks in evolutionary studies. Mol. Biol. Evol. 2006, 23, 254–267. [Google Scholar] [CrossRef] [PubMed]
  32. Stoffel, M.A.; Esser, M.; Kardos, M.; Humble, E.; Nichols, H.; David, P.; Hoffman, J.I. inbreedR: An R package for the analysis of inbreeding based on genetic markers. Methods Ecol. Evol. 2016, 7, 1331–1339. [Google Scholar] [CrossRef]
  33. Chen, H.; VennDiagram: Generate High-Resolution Venn and Euler Plots. R Package Version 1.6.20. 2018. Available online: https://CRAN.R-project.org/package=VennDiagram (accessed on 22 December 2020).
  34. Alexander, D.H.; Novembre, J.; Lange, K. Fast model-based estimation of ancestry in unrelated individuals. Genome Res. 2009, 19, 1655–1664. [Google Scholar] [CrossRef] [PubMed] [Green Version]
  35. Francis, R.M. pophelper: An R package and web app to analyze and visualize population structure. Mol. Ecol. Resour. 2017, 17, 27–32. [Google Scholar] [CrossRef] [PubMed] [Green Version]
  36. Reich, D.; Thangaraj, K.; Patterson, N.; Price, A.L.; Singh, L. Reconstructing Indian population history. Nature 2009, 461, 489–494. [Google Scholar] [CrossRef] [Green Version]
  37. Patterson, N.; Moorjani, P.; Luo, Y.; Mallick, S.; Rohland, N.; Zhan, Y.; Genschoreck, T.; Webster, T.; Reich, D. Ancient admixture in human history. Genetics 2012, 192, 1065–1093. [Google Scholar] [CrossRef] [Green Version]
  38. Petr, M.; Vernot, B.; Kelso, J. admixr—R package for reproducible analyses using ADMIXTOOLS. Bioinformatics 2019, 35, 3194–3195. [Google Scholar] [CrossRef] [Green Version]
  39. Becker, R.A.; Wilks, A.R.; Brownrigg, R.; Minka, T.P.; Deckmyn, A.; Maps: Draw Geographical Maps. R Package Version 3.3.0. 2018. Available online: https://CRAN.R-project.org/package=maps (accessed on 22 December 2020).
  40. Wright, S. Evolution and the Genetics of Population, Variability Within and Among Natural Populations; The University of Chicago Press: Chicago, IL, USA, 1978. [Google Scholar]
  41. Hartl, D.L.; Clark, A.G. Principles of Population Genetics, 3rd ed.; Sinauer Associates, Inc.: Sunderland, MA, USA, 1997. [Google Scholar]
  42. Sokolov, I.I. Fauna of the USSR: Mammals: Ungulates (Orders Perissodactyla and Artiodactyla); Publishing house of the Academy of Sciences of the USSR: Leningrad, Moscow, Russia, 1959; p. 265. [Google Scholar]
  43. Tembotov, A.K. Geography of North. Caucasian Mammals; Nalchik: Elbrus, Russia, 1972; p. 151. [Google Scholar]
  44. Couturier, M.A.J. Le Bouquetin des Alpes; Allier: Grenoble, France, 1962. [Google Scholar]
  45. Ayunts, K.R. On the systematics of Caucasian tur. Bulletin of the Moscow Society of Naturalists. Biol. Dep. 1992, 97, 19–25. [Google Scholar]
  46. Ropiquet, A.; Hassanin, A. Molecular evidence for the polyphyly of the genus Hemitragus (Mammalia, Bovidae). Mol. Phylogenetics Evol. 2005, 36, 154–168. [Google Scholar] [CrossRef]
  47. Tan, S.; Wang, Z.; Jiang, L.; Peng, R.; Zhang, T.; Peng, Q.; Zou, F. Molecular phylogeny and phylogeography of genus Pseudois (Bovidae, Cetartiodactyla): New insights into the contrasting phylogeographic structure. Ecol. Evol. 2017, 7, 7047–7057. [Google Scholar] [CrossRef] [PubMed] [Green Version]
  48. Dotsev, A.V.; Kunz, E.; Kharzinova, V.R.; Okhlopkov, I.M.; Lv, F.-H.; Li, M.-H.; Rodionov, A.N.; Shakhin, A.V.; Sipko, T.P.; Medvedev, D.G.; et al. Mitochondrial DNA Analysis Clarifies Taxonomic Status of the Northernmost Snow Sheep (Ovis nivicola) Population. Life 2021, 11, 252. [Google Scholar] [CrossRef] [PubMed]
  49. Huxley, J. Clines: An Auxiliary Taxonomic Principle. Nature 1938, 142, 19–220. [Google Scholar] [CrossRef]
Figure 1. Caucasian tur in its natural habitat. Photo by M. Andreev and A. Andreeva (http://mountaindreams.ru, accessed on 17 June 2021).
Diversity 13 00312 g001
Figure 2. Map with sampling sites of Caucasian tur used in this study and the area of the species habitat. W_TUR = West-Caucasian tur, E_TUR = East-Caucasian tur, M_TUR = Mid-Caucasian tur.
Diversity 13 00312 g002
Figure 3. Number of polymorphic sites per chromosome in Caucasian tur (Capra caucasica). (A). Number of SNPs in all the studied populations. (B). Number of SNPs in West-Caucasian tur. (C). Number of SNPs in East-Caucasian tur. (D). Number of SNPs in Mid-Caucasian tur.
Diversity 13 00312 g003
Figure 4. Venn diagram representing the number of unique and shared polymorphic SNPs in the three groups of Caucasian tur (Capra caucasica). W_TUR = West-Caucasian tur, E_TUR = East-Caucasian tur, M_TUR = Mid-Caucasian tur.
Diversity 13 00312 g004
Figure 5. Principal component analysis (PCA) of the groups of Caucasian tur (Capra caucasica): (A) the first two components (PC1 and PC2), (B) the first and third components (PC1 and PC3). W_TUR = West-Caucasian tur, E_TUR = East-Caucasian tur, M_TUR = Mid-Caucasian tur.
Diversity 13 00312 g005
Figure 6. Neighbor-Net dendrogram of 15 Caucasian tur (Capra caucasica) individuals, based on IBS distances.
Diversity 13 00312 g006
Figure 7. Individual multilocus heterozygosity (MLH) in the groups of Caucasian tur (Capra caucasica).
Diversity 13 00312 g007
Figure 8. Admixture cross-validation (CV) error indicating the optimum number of clusters in the dataset.
Diversity 13 00312 g008
Table 1. Pairwise FST genetic distances between the groups of Caucasian tur (Capra caucasica).
GroupW_TURE_TURM_TUR
W_TUR0.000
E_TUR0.1610.000
M_TUR0.0990.1350.000
Notes: W_TUR = West-Caucasian tur, E_TUR = East-Caucasian tur, M_TUR = Mid-Caucasian tur. FST values in the range 0–0.05 indicate low genetic differentiation; value between 0.05 and 0.15, moderate differentiation; values between 0.15 and 0.25, high differentiation; and values above 0.25, very high genetic differentiation [40,41].
Table 2. Genetic diversity in the groups of Caucasian tur (Capra caucasica).
GroupnHO (±SE)HE (±SE)FIS [95% CI]AR (±SE)
W_TUR50.308 ± 0.0040.312 ± 0.0030.015 [0.002; 0.028]1.775 ± 0.007
E_TUR50.258 ± 0.0040.284 ± 0.0030.074 [0.060; 0.088]1.730 ± 0.007
M_TUR50.306 ± 0.0040.316 ± 0.0030.028 [0.015; 0.041]1.790 ± 0.007
Notes: n—number of samples, HO—observed heterozygosity, HE—expected heterozygosity, FIS—inbreeding coefficient, AR—allelic richness, SE—standard error, CI—confidence interval, W_TUR = West-Caucasian tur, E_TUR = East-Caucasian tur, M_TUR = Mid-Caucasian tur.
Publisher’s Note: MDPI stays neutral with regard to jurisdictional claims in published maps and institutional affiliations.

