Article

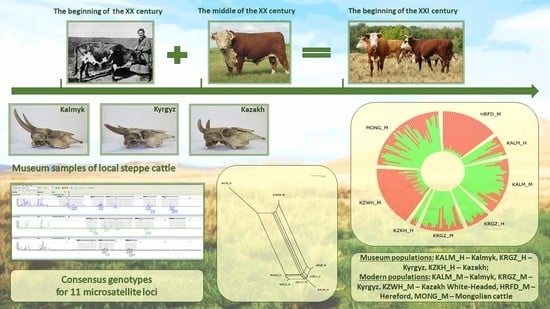
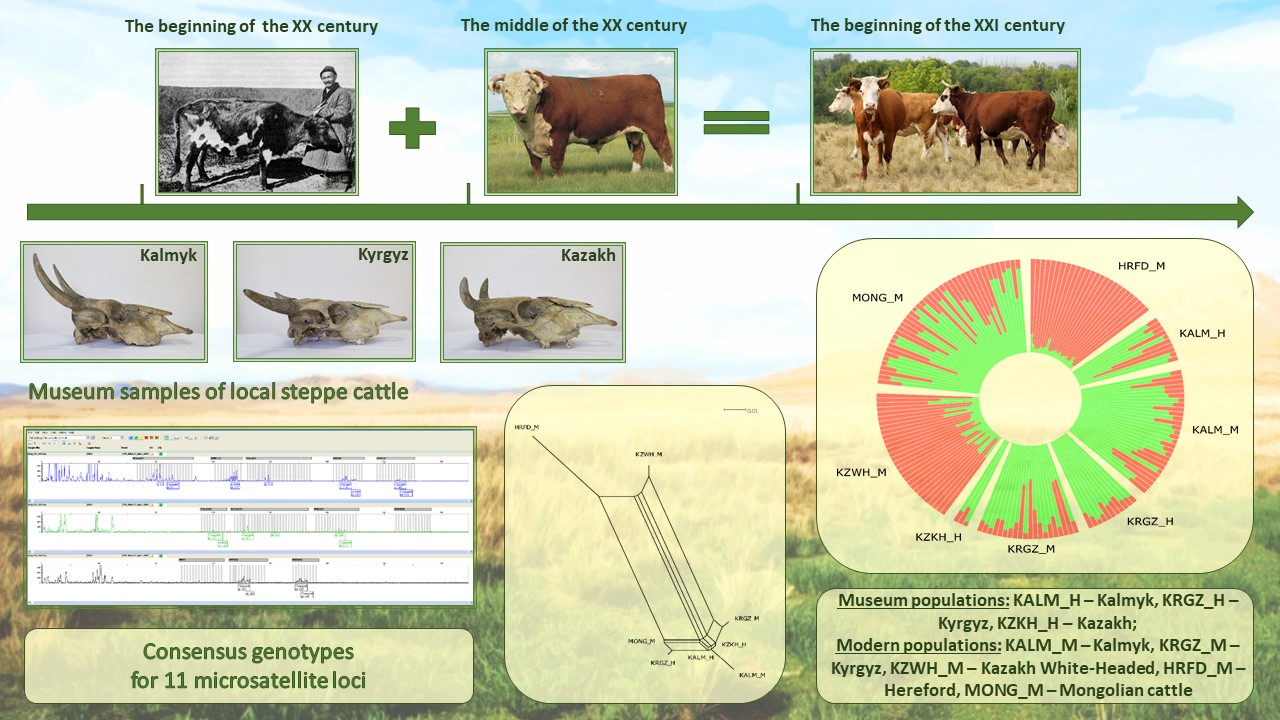
Comparative Study of the Genetic Diversity of Local Steppe Cattle Breeds from Russia, Kazakhstan and Kyrgyzstan by Microsatellite Analysis of Museum and Modern Samples †

by
Alexandra S. Abdelmanova
1,*,
Veronika R. Kharzinova
1,
Valeria V. Volkova
1,
Arsen V. Dotsev
1,
Alexander A. Sermyagin
1,
Oksana I. Boronetskaya
2,
Roman Yu. Chinarov
1,
Evgeniya M. Lutshikhina
3,
Johann Sölkner
4,
Gottfried Brem
5 and
Natalia A. Zinovieva
1,*
1
L.K. Ernst Federal Research Center for Animal Husbandry, Dubrovitsy, Podolsk Municipal District, Moscow Region, 142132 Podolsk, Russia
2
Museum of Livestock Named after E.F. Liskun, Timiryazev Russian State Agrarian University—Moscow Agrarian Academy, ul. Timiryazevskaya 49, 127550 Moscow, Russia
3
Institute of Biotechnology, National Academy of Science of Kyrgyz Republic, Bishkek 720071, Kyrgyzstan
4
Division of Livestock Sciences, University of Natural Resources and Life Sciences, 1180 Vienna, Austria
5
Institute of Animal Breeding and Genetics, University of Veterinary Medicine (VMU), Veterinärplatz, 1210 Vienna, Austria
*
Authors to whom correspondence should be addressed.
This paper is an extended version of the paper published in the 1st International Electronic Conference on Biological Diversity, Ecology, and Evolution (BDEE 2021), Online, 15–31 March 2021.
Diversity 2021, 13(8), 351; https://doi.org/10.3390/d13080351
Submission received: 3 July 2021 / Revised: 21 July 2021 / Accepted: 27 July 2021 / Published: 30 July 2021

Abstract

:
The comparative molecular genetic study of museum and modern representatives of cattle breeds can help to elucidate the origin and maintenance of historical genetic components in modern populations. We generated the consensus genotypes for 11 microsatellite loci for 24 museum samples of Kalmyk, Kyrgyz, and Kazakh cattle, dated from the first quarter of the 20th century, and compared them with those of modern Kalmyk, Kyrgyz, and Kazakh white-headed breeds. The level of genetic diversity of the modern Kalmyk and Kyrgyz cattle (uHe = 0.771–0.778) was similar to those observed in the museum samples (uHe = 0.772–0.776), while a visible decrease in genetic variability in the modern Kazakh white-headed breed compared to museum Kazakh cattle was detected (uHe = 0.726 and 0.767, respectively). The PCA plot, FST- and Jost’s D-based networks, and STRUCTURE clustering provided strong evidence of the maintenance of the historical genetic background in modern populations of Kalmyk and Kyrgyz cattle. In spite of the allele pool of Kazakh white-headed cattle having undergone great changes compared to the museum Kazakh cattle, several animals still carry the visible aspect of the historical genetic components. Our results can be used for the selection of individuals for the creation of gene banks and may significantly improve the efficiency of conservation programs aimed at preserving genetic diversity in the national genetic resources of cattle.

Graphical Abstract

1. Introduction

Nomadic cattle husbandry across the vast territory of the south steppe has been undertaken since ancient times. The harsh climate conditions of short dry summers and cold winters have resulted in herders moving across large areas to seek better pastures for livestock [1,2,3,4]. During the short period of a plant’s vegetation, cattle can restructure their body and create enough fat reserves to survive the long winters. Historically, poorly fleshed, weak livestock that are unable to find forage under the snow have died during the winter–spring period [5,6]. The similar way of life of nomadic tribes across the different parts of the south steppes over the centuries has resulted in their cattle having similar phenotypic characteristics. These animals are very hardy, of small to medium size, approximately 110–128 cm in stature, and are able to survive under poor forage conditions and be quickly fattened up with improved feeding [7,8,9]. Initial attempts to survey cattle inhabiting the south steppe of Russia were undertaken in the last decade of 19th century and the first decade of the 20th century, but the reports mainly described the number of cattle owned by different families and their movement routes [10]. Clear data on the exterior and particular properties of cattle of that time are not available. A comprehensive survey of the steppe cattle of Russia and the neighboring republic of former USSR countries was carried out in the first quarter of the 20th century, which resulted in the division of the entire cattle population into two groups (breeds), with a description of their properties, including coat color, exterior characteristics, and productivity [11]. The medium-sized, compact red cattle with a small head, long face, and short horns distributed in the southern regions of the European part of Russia (i.e., the Kalmykia, Rostov, Volgograd, and Astrakhan regions) and East Siberia were known as Kalmyk cattle (Supplementary Materials, Figure S1a). The origin of these cattle, officially recognized as a separate breed in 1934, was traced back to the 16th–17th centuries, when the Oirats tribe migrated from western Mongolia to the lower Volga through the territory of modern Kazakhstan, founding the Kalmyk Khanate [12,13]. At the end of the 18th century, because of disagreements with the government of the Russian Empire, part of the Oirats—now called Kalmyks—moved back to Dzungaria (the modern territories of northwest China) [14,15]. The small-sized cattle of different colors (red, black, brown, gray, white, pied, or tiger) with a relatively large head and well-developed horns that inhabited the territory of Kazakhstan and Kyrgyzstan were recognized as Kazakh or Kyrgyz cattle depending on the region of their distribution (Supplementary Materials, Figure S1b). It is well documented that the Kazakh and Kyrgyz tribes attacked Kalmyk caravans on their way to Dzungaria, capturing cattle as trophies [14,15]. This forms a basis for the suggestion that the ancient Kalmyk cattle have possibly contributed to the development of the gene pool of Kyrgyz (Kazakh) cattle. According to the cattle breeding plan of the USSR (1934), Kalmyk and Kyrgyz (Kazakh) cattle were chosen as the target breeds for further breeding in the steppe regions of the former USSR (Supplementary Materials, Figure S2) [16]. In the 1930–1940s, local steppe cattle were crossed with high-producing transboundary breeds to improve their growth capacity, meat, and carcass traits [17]. Kalmyk cattle were crossed with Brown Swiss and Simmental bulls, but most authors consider that these breeds only represent a small contribution to the development of the modern gene pool of Kalmyk cattle [8,16,17,18,19]. In Kyrgyzstan, major part of the local cattle population was crossed with Brown Swiss and Holland breeds that resulted in developing during the Soviet time several novel synthetic breeds [8,9]. The small remaining part of native Kyrgyz cattle was further developed without contribution of other breeds. The populations inhabiting the northern and western territories of Kazakhstan were crossed with Herefords followed by backcrossing of hybrid Kazakh-Hereford females with Hereford bulls over a number of generations, which resulted in the development of the Kazakh white-headed breed [17]. Additional crossing of Kazakh white-headed cows with Hereford bulls was regularly carried out during subsequent periods of breed development. Currently, the Kalmyk and Kazakh white-headed breeds are the main breeds used for meat production in the south steppe regions of Russia, Kazakhstan, and Kyrgyzstan. In Russia, the ratio of these breeds to the total number of beef cattle (2020) account for 36.6% and 11.7%, respectively [20]. Only a small number of purebred native Kyrgyz cattle are still kept by private owners in Kyrgyzstan. Because the pedigree records of modern Kyrgyz cattle are lacking, the decision on the assignment of an animal as native Kyrgyz cattle is made in most cases based on exterior characteristics and verbal information got from the owners. The origin of modern Kyrgyz cattle and its relationship with ancestral Kyrgyz cattle should be elucidated.
Native cattle breeds are an invaluable source of genetic diversity, which is necessary to ensure the sustainability of animal production systems in local geoclimatic conditions [18,21,22,23]. However, a drastic decline in the population size of most of the native breeds, as well as the active use of crossbreeding with high-producing commercial breeds, can lead to the irreversible loss of genetic diversity [24]. Conservation of genetic diversity is an important task in order to ensure the sustainability of the animal production system [25]. Successful conservation of local populations and breeds requires the selection of animals that are carriers of breed-specific genetic components, mostly reflecting the breeds’ origin and trajectories of development and artificial selection.
A method with great potential for reconstructing breeds’ origins and maintaining the ancestral genetic components in the modern populations of animal breeds is the analysis of specimens stored in museum collections [26,27,28,29]. Over the last decades, the field of ancient DNA (aDNA) heavily relied on mitochondrial DNA (mtDNA) markers. This is due to the low copy number and general difficulties associated with the recovery of nuclear DNA from archaeozoological materials [30]. However, the maternal inheritance characteristic of mtDNA has limited the ability to trace the history of cattle breeds with complex genetic background or breeds that were developed by crossing with bulls of other genetic origins. One of the most powerful tools for inferring genetic patterns of populations is microsatellite analysis [31,32,33]. During application of microsatellites for molecular genetic studies of farm animals over long time scales, reliable methods for analysis of these types of DNA markers have been developed [34]. Moreover, the data derived from different laboratories or different experiments can be standardized according to the Guidelines of the International Society of Animal Genetics (ISAG) [35].
The aim of our work was to compare the genetic diversity of Kalmyk, Kyrgyz, and Kazakh cattle inhabiting the steppe region of southern Russia and the neighboring republics of the former USSR in the first quarter of the 20th century with the current gene pool of the above breeds based on the analysis of microsatellite genotypes of museum and modern samples.

2. Materials and Methods

2.1. Sample Collection

The museum (historical) skulls of Kalmyk (KALM_H, n = 10), Kyrgyz (KRGZ_H, n = 11), and Kazakh (KZKH_H, n = 3) cattle dated to the first quarter of the 20th century were derived from the craniological collection of the Museum of Livestock named after E.F. Liskun (Moscow Agricultural Academy named after K.A. Timiryazev) (Figure 1).
The modern samples of Kalmyk (KALM_M, n = 28), Kyrgyz (KRGZ_M, n = 20), and Kazakh white-headed (KZWH_M, n = 30) cattle were derived from the Bioresource collection “Bank of genetic materials of domestic and wild animals and birds” of the L.K. Ernst Federal Research Center for Animal Husbandry. Tissue samples (ear skin) from modern animals were collected by trained personnel under strict veterinary rules in accordance with the guidelines for conducting laboratory research (tests) in the implementation of the veterinary control (supervision) approved by the Council Decision Eurasian Economic Commission No. 80 (10 November 2017). The 1–2 mm2 pieces of ear skin were used for DNA extraction using Nexttec columns (Nexttec Biotechnology GmbH, Leverkusen, Germany), according to the manufacturer’s instructions.
Additionally, we included modern samples of Mongolian cattle (MONG_M, n = 41) as a kinship breed with a similar genetic origin, which probably contributed to the development of Kalmyk cattle. Additionally, we included in the dataset samples of modern representatives of the Hereford breed (HRFD_M, n = 26) because of their great contribution to the development of the modern gene pool of Kazakh white-headed cattle.

2.2. DNA Extraction

All works with historical samples were performed in a dedicated facility of the L.K. Ernst Federal Research Center for Animal Husbandry [36]. The bone powder was produced from the roots of teeth using MIXER MILL MM 400 (Retsch GmbH, Haan, Germany). In total, 200 ± 5 µg of bone powder was subjected to the DNA extraction using a COrDIS Extract Decalcine Kit (GORDIZ LLC, Moscow, Russia), according to the manufacturer’s instructions with modifications of the lysis conditions and volumes (lysis at 56 °C, 1200 rpm, overnight, using a 2.5× volume of lysis and washing buffers). A negative control tube (“reagent blank”) containing only DNA extraction reagents without a sample was included in each batch of processed samples to trace the possible occurrence of DNA contamination.
The concentration of double-stranded DNA (dsDNA) was measured by using a Qubit™ fluorimeter (Invitrogen, Life Technologies, Waltham, MA, USA), and the purity of the DNA solutions was checked by determining the ratio of the absorption at 260 and 280 nm (OD260/280) on a NanoDrop 8000 instrument (Thermo Fisher Scientific Inc., Waltham, MA, USA). Only the samples with >1 ng/µL dsDNA concentration were used for the study.

2.3. Microsatellite Genotyping

The samples were genotyped for 11 highly polymorphic microsatellite loci (BM1818, BM2113, BM1824, ETH10, ETH225, INRA023, SPS115, TGLA53, TGLA122, TGLA126, and TGLA227) which were recommended by the International Society of Animal Genetics (ISAG) [35]. The multiplex PCRs were carried out in a final volume of 10 µL in a PCR buffer with 200 mM dNTPs, 1.0 mM MgCl2, a 0.5 mM primer mix, 1 unit of Taq polymerase (Dialat Ltd., Moscow, Russia), and 1 µL of genomic DNA. The initial denaturation at 95 °C for 4 min was followed by 35 cycles of PCR amplification (95 °C, 20 s; 63 °C, 30 s; 72 °C, 1 min). Additionally, the final extension was performed at 72 °C for 10 min. The negative controls (PCR reaction without DNA template) were included in each PCR experiment to check for possible DNA contaminations. PCR fragments were separated by capillary electrophoresis on an ABI3130xl genetic analyzer (Applied Biosystems, Beverly, MA, USA) using GeneScan™-350 ET ROX as a fragment standard. The fragment lengths were determined using the Gene Mapper software v4 (Applied Biosystems, Beverly, MA, USA). Allele sizes were standardized according to an ISAG International Bovine (Bos Taurus) STR typing comparison test (2018–2019).
A modified multiple-tube approach, proposed by Mondol et al. [37] and Modi et al. [38], was used to determine the consensus genotypes as previously described [29]. Briefly, each DNA sample was analyzed in five replicates. Initially, multiplex amplification of microsatellite loci was performed in duplicates and only the samples in which at least six loci were successfully amplified (positive multiplex PCRs) were selected for further analysis. For such samples, three additional independent PCR replicates were performed using the same DNA extractions. The genotyping results of the five PCR replicates were used to calculate the “quality indices” (QIs) for each sample/locus as described by Miquel et al. [39]. For the samples with QI values less than 0.75, three additional multiplex PCRs were carried out using the same DNA extraction. Genotypes with a QI value of 0.75 and higher at each locus were considered reliable and selected for further analysis. The number of positive PCRs from the number of replicates for each locus/sample was defined as amplification failure. Those genotypes different from the most frequent genotype were defined as genotyping errors and included allelic dropout (ADO) or false alleles (FAs). The overall error rates were calculated as the ratio of genotyping errors from the total number of positive PCRs. For calculation of the ADO and FA rates, we used the protocol proposed by Broquet and Petit [40]. For the quality control of genotyping, the probability values of correct genotyping (p) for each locus were calculated according He et al. [41]. The threshold for p-values at each locus was set as <0.001.

2.4. Data Analysis

FreeNA [42] and MICRO-CHECKER 2.2.3 software [43] were used to check the presence of null alleles. We applied GenAIEx 6.5 software [44] to calculate the number and frequency of alleles. The packages diveRsity [45], adegenet [46], and ggplot2 [47] of the R software (http://cran.r-project.org, accessed on 12 May 2021) were used for calculating the main statistics, including observed heterozygosity (Ho), unbiased expected heterozygosity (uHe), unbiased inbreeding coefficient (uFIS), and rarefied number of alleles (AR) [48], performing principal component analysis (PCA), and visualizing breed relationships. Pairwise differences among studied populations for uHe and AR estimates were tested using Wilcoxon rank-sum test [49] using Statistica 10 software (www.statsoft.com, accessed on 18 July 2021). The software environment R3.5.0 was used to prepare the data files [50].
Pairwise Jost’s D genetic distances [51] and paired FST genetic distances [52] were calculated to evaluate the degree of genetic differentiation of the studied breeds. The pairwise Jost’s D and FST matrices were used to construct the phylogenetic trees using the Neighbor-Net algorithm in SplitsTree 4.14.5 [53].
STRUCTURE 2.3.4 software [54] was applied to investigate the genetic structure of studied populations. We used the admixture model with the option of correlated allele frequencies. The burn-in period was set to 10,000 iterations, followed by 100,000 Markov chain Monte Carlo (MCMC) repetitions for each run. We performed 10 independent runs for a number of possible clusters (K) ranging from 2 to 8. CLUMPAK software [55], available at http://clumpak.tau.ac.il (accessed on 7 May 2021), was used to analyze multiple independent runs at a single K value. For measuring the constancy over runs, we calculated average pairwise similarity scores using CLUMPAK [55].
To infer demographic history with admixture, we applied the TreeMix software [56] to the microsatellite data. We computed the mean and variance in length at each microsatellite locus and used them to run TreeMix v1.13. We tested up to five migration events in twenty iterations per migration edge. The optimal number of migration events was determined using R package “optM” [57] based on TreeMix output files. We added the optimal number of migrations to the phylogenetic model and estimated the consistency between migration edges using TreeMix for 20 independent runs.

3. Results

3.1. Estimation of Consensus Genotypes for Museum Samples

The concentrations of dsDNA extracted from the museum specimens exceeded the set threshold of 1 ng/µL and varied from 2.88 to 38.40 ng/µL in different samples (Supplementary Materials, Table S1). Out of the 24 museum specimens, 18 samples were successfully genotyped for all 11 loci. For four samples, the consensus genotypes were obtained for 10 loci, including two samples of the Kyrgyz breed (H176, H181) and one sample each of the Kalmyk (H210) and Kazakh (H355) breeds. Two samples of Kyrgyz breed (H180 and H181) were genotyped for 9 loci (Supplementary Materials, Table S2a). No amplification failure was observed in the BM2113 locus. Among the other 10 loci, the ratio of positive PCRs varied from 99.23% in BM1824 to 72.31% in BM1818, corresponding to an amplification failure of 0.77% and 27.69%, respectively. The quality of genotyping differed between microsatellite loci and varied from QI = 0.96 in TGLA53 and TGLA122 to QI = 1.00 in BM2113 and BM1824. We identified the allelic dropout (ADO) in 2.35% of the estimated heterozygous genotypes with variations from 0.92% in TGLA227 to 5.80% in the SPS115 locus. Three loci (BM2113, BM1824, and ETH10) were free of ADO. We found false alleles (FAs) in six genotyped loci, whereby the FA rate varied from 0.78% in ETH10 to 2.13% in BM1818. Five loci (BM2113, INRA23, TGLA126, ETH225, and BM1824) were free of FAs. The error rate varied from 0.78% in ETH10 to 4.76% in TGLA122—an average of 2.32%. No genotyping errors were observed in the BM2113 and BM1824 loci. The probability values of correct genotyping (p) for each locus met the set threshold (p < 0.001) (Supplementary Materials, Table S3). Therefore, all studied loci that passed quality control were selected for further analysis.
Out of 145 modern specimens, the genotypes for all 11 loci were estimated for 136 samples, while for 8 and 1 samples the microsatellite genotypes were obtained for 10 and 9 loci, respectively (Supplementary Materials, Table S2b).

3.2. Allelic Variability and Genetic Diversity of Studied Breeds

We identified 130 microsatellite alleles in eight cattle populations including 124 alleles in modern samples and 95 alleles in museum samples. The most polymorphic were the TGLA122 and TGLA53 loci (21 and 19 alleles, respectively), while the least number of alleles (7 alleles) was found in the BM1824 locus (Table 1).
Of the alleles, 83.33% found in the museum Kalmyk cattle and 81.16% in the museum Kyrgyz cattle were present in the modern representatives of these breeds. Despite long-term crossbreeding of native Kazakh cattle with Herefords, 82.93% of the alleles of museum Kazakh cattle appeared in the modern Kazakh white-headed breed. Meanwhile, 92.98% of alleles observed in Herefords appeared in Kazakh white-headed cattle. The great contribution of Mongolian cattle to the development of the gene pool of the studied breeds of steppe cattle was reflected in the high rate of common alleles with Mongolian cattle: 87.50%, 88.41%, and 92.68% in the museum Kalmyk, Kyrgyz, and Kazakh cattle, respectively. These rates decreased to 81.61% and 81.82% in the modern populations of Kalmyk and Kyrgyz cattle, respectively. The Kazakh white-headed cattle retained among other modern breeds the highest rate of alleles in common with the Mongolian cattle (93.15%) (Table 2).
Comparing the museum and modern Kalmyk, Kyrgyz, and Kazakh cattle showed that 15 alleles, which were distributed in the museum populations, were lost in the modern cattle. By contrast, 60 novel alleles appeared in the modern populations. The greatest number of novel alleles (n = 33) was found in the Kazakh white-headed breed, reflecting the gene flow from Hereford breed. The TGLA122 and TGLA53 loci were the most altered: Three and two ancestral alleles were lost, while 11 and 9 novel alleles appeared, respectively (Supplementary Materials, Table S4). Considering the differences in sample size between museum and modern populations, it should be noted that the absence of part of alleles in historic populations could be the result of their smaller sample size.
Estimations of the genetic diversity calculated based on the genotypes for 11 microsatellite loci are summarized in Table 3.
We did not observe significant differences in the genetic diversity between the museum and modern populations of all studied breeds. For Kalmyk and Kyrgyz cattle, the values of the unbiased expected heterozygosity and rarefied allelic richness were similar (uHe = 0.772–0.776 for the museum samples and 0.771–0.778 for the modern samples; AR = 3.635–3.693 and 3.664–3.704, respectively). The Kazakh white-headed cattle were characterized by decreased genetic diversity compared to the museum Kazakh cattle (uHe = 0.726 vs. 0.767; AR = 3.336 vs. 3.727). This could be associated with lower level of genetic diversity of Hereford cattle and may reflect the contribution of the limited number of Hereford bulls in formation of the Kazakh white-headed breed. A significant deficiency of heterozygotes was found in the museum Kalmyk cattle (uFIS = 0.131), as well as in the modern Mongolian cattle (uFIS = 0.115), while the modern Kyrgyz cattle were characterized by an excess of heterozygotes (uFIS = −0.085) (Table 3).

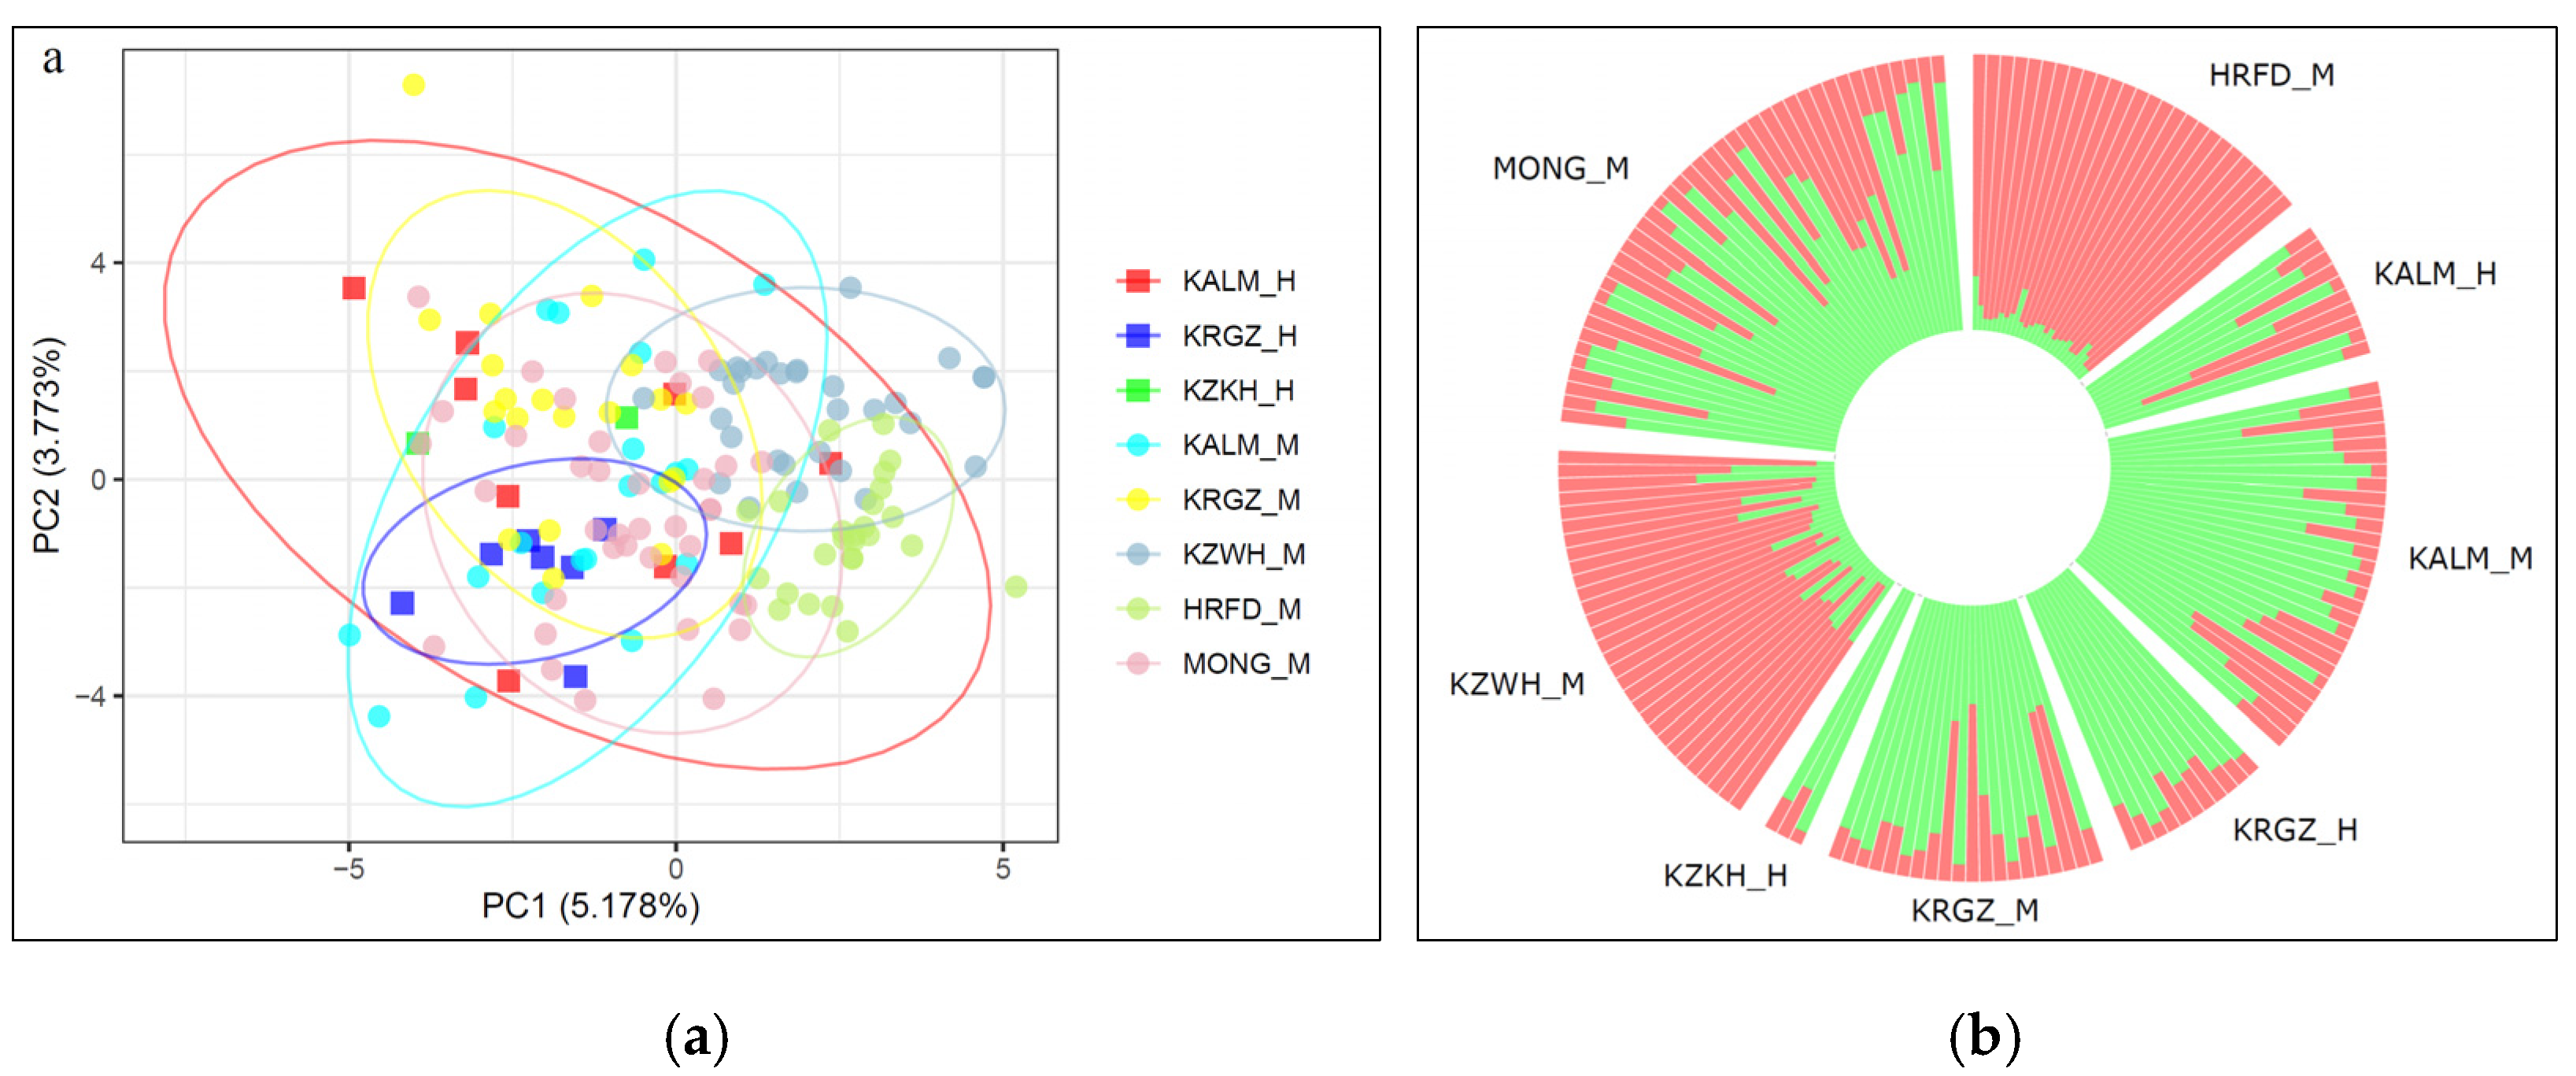
3.3. Relationships among the Studied Breeds

The first component of the PCA explained 5.178% of the genetic variability and split the Kazakh white-headed and Hereford breeds from the other studied breeds. The second component, responsible for 3.773%, divided the museum and modern Kyrgyz cattle. The Mongolian cattle were localized in the middle of the PCA plot, explaining their contribution to the development of the studied steppe breeds. The museum Kalmyk samples did not form a clear cluster. A possible explanation could be the different genetic backgrounds of the museum specimens of Kalmyk cattle (Figure 2a).
Calculation of the ∆K values for the different number of clusters (K) from one to five showed that the most probable number of ancestral populations that participated in the development of studied breeds is two. STRUCTURE analysis at K = 2 showed differences in the genetic structure of the studied breeds by the rate of native and Hereford-specific genetic components. The museum samples of the Kyrgyz and Kazakh cattle had similar genetic structures with the greatest rate of native genetic components, while part of the museum Kalmyk cattle revealed an admixed genetic structure. The modern Kalmyk and Kyrgyz cattle kept most of the native genetic components, while in the Kazakh white-headed cattle, the Hereford-specific components dominated (Figure 2b).
Analysis of FST and Jost’s D genetic distances showed a lack of allelic differentiation between pairs of museum populations: Kalmyk–Kyrgyz (FST and Jost’s D = 0) and Kalmyk–Kazakh (FST = −0.020, Jost’s D = −0.013). The modern Kalmyk and Kyrgyz cattle were closest to the museum populations of their ancestral breeds (FST = 0.018 and 0.025; Jost’s D = 0.017 and 0.047, respectively), while the Kazakh white-headed breed was most distant from museum populations (FST = 0.048, 0.082, and 0.096; Jost’s D = 0.089, 0.175 and 0.079 for museum Kalmyk, Kyrgyz and Kazakh cattle, respectively). Museum cattle revealed a stronger Mongolian genetic background (FST = 0–0.019; Jost’s D = 0–0.015) compared to the modern cattle breeds (FST = 0.026–0.052; Jost’s D = 0.039–0.098) (Supplemental Materials, Table S5).
A similar allelic pattern of the museum populations was reflected in their neighbored localization on the edges of the Neighbor-Net tree constructed based on Jost’s D values (Figure 3) and FST values (Supplemental Materials, Figure S3). Modern populations of the Kalmyk and Kyrgyz breeds were localized in the same cluster, but formed their own branches. This suggests that the development of these breeds was based on the historical genetic background. The Kazakh white-headed cattle formed a separate cluster with the Hereford breed, reflecting the great contribution of the latter in the development of the allele pool of the Kazakh white-headed cattle (Figure 3).
A single migration event was found to be the most optimal for describing the demographic history of the studied populations using TreeMix. The most stable TreeMix tree showed migration from the ancestors of the museum Kazakh cattle and Herefords to the Kazakh white-headed breed that agrees with the origin and development of the last (Figure 4).

4. Discussion

Conservation of the genetic diversity of animal genetic resources is important for food security and the ability of agricultural systems to adapt to possible future changes in production environments, including climate, market requirements, and diseases [58,59]. Predominantly using highly productive transboundary breeds in agricultural production and the associated decline in the population size of the local breeds has led to a drastic decrease in the genetic diversity of farm animal species, including cattle [59,60]. To ensure the sustainability of agricultural production, programs for the conservation of farm animal genetic resources should be developed [59,61].
One of the important points in developing such programs is the selection of the individuals to be used for conservation. The most valuable resources are individuals who are carriers of breed-specific genetic components and would allow reconstitution of that breed in case of its extinction [62]. However, in modern populations of local cattle breeds, the complex genetic backgrounds and active crossbreeding make it difficult to estimate the ancestral genetic components and infer the origin of breeds. The absence of such information would negatively affect their future development and breeding management. The study of museum and archeological samples can help in the identification of such components in the genome of modern representatives of breeds [29,63,64].
During the century-long history of the territories in the south steppe of Russia and the neighboring republics of the former Soviet Union, cattle breeds developed were well adapted to the harsh environment of this region and able to survive under poor foraging conditions [8,9]. In the present study, we were able to obtain valid genotypes for 11 microsatellite loci for the museum specimens of the native steppe Kalmyk, Kyrgyz, and Kazakh cattle dated to the first quarter of 20th century.
The level of genetic diversity of the modern Kalmyk and Kyrgyz cattle (uHe = 0.771–0.778) was similar to that determined in previous studies of these breeds (He = 0.76–0.78) [65] and comparable to those observed in the museum samples (uHe = 0.772–0.776) (Table 3). The modern populations of both of these breeds were less affected by crossing with transboundary breeds and were not subjected to artificial selection with high selection pressure [66,67]. On the contrary, we detected a visible decrease in the genetic variability of the modern Kazakh white-headed breed compared to the museum Kazakh cattle (uHe = 0.726 and 0.767; AR = 3.727 and 3.336, respectively) (Table 3). A possible explanation is that only a part of the Kazakh cattle inhabiting the northern and western territories of Kazakhstan were used for developing the modern population of Kazakh white-headed cattle [17]. Higher selection pressure for the limited number of traits and the use of a limited number of Hereford sires for breed improvement can be considered as additional factors leading to the decline in genetic diversity in the modern population of this breed. Meanwhile, the genetic diversity of the Kazakh white-headed cattle was higher than in Herefords (uHe = 0.726 vs. 0.653; AR = 3.336 vs. 2.994, p < 0.05), which is in general agreement with other studies [65,68,69,70] showing a lower level of genetic diversity in transboundary commercial breeds compared to local ones; He = 0.76–0.78 in Kalmyk and Kyrgyz cattle comparing to 0.70–0.71 in transboundary Brown Swiss and Holstein breeds [65]; He = 0.679–0.802 in twenty-seven Chinese indigenous yellow cattle breeds comparing to 0.661–0.697 in three commercial breeds [68]; uHe = 0.791–0.804 in local Vietnamese pigs comparing to 0.606–0.632 in commercial Yorkshire and Landrace pig breeds [69]; He = 0.72–0.81 in twenty-two Vietnamese pig breeds comparing to 0.56–0.65 in commercial Duroc, Yorkshire and Landrace pig breeds [70].
We observed a significant deviation from the Hardy-Weinberg equilibrium in heterozygote number for museum samples of the Kalmyk breed (heterozygote deficiency), which has been indicated by a positive value of uFIS (0.131). Interestingly, we found the heterozygote excess beyond the expected number of heterozygotes in the modern Kyrgyz cattle (uFIS = −0.085) that has the lowest population size among studied breeds. This observation is in agreement with the results of previous studies [65], indicated the heterozygote excess in two studied populations of Kyrgyz cattle (FIS = 0.132–0.135). The possible explanation could be the low pressure of the artificial selection, extremely long productive life (up to 10 lactations) of the cows, and the calves’ exchanges between owners.
The PCA plot (Figure 2a), STRUCTURE clustering (Figure 2b), FST-based tree (Figure S3), and Jost’s D network (Figure 3) showed strong maintenance of the historical genetic backgrounds in the modern populations of the Kalmyk and Kyrgyz cattle. The allele pool of the modern Kazakh white-headed cattle has undergone the greatest changes compared to the museum Kazakh cattle, which is associated with multiple backcrossing with Hereford bulls [8,9]. This revealed in more distant localization of Kazakh white-headed breed in relation to museum samples at PCA plot (Figure 2a); occurrence of the large part of Hereford specific genetic components in the cluster structure of Kazakh white-headed cattle (Figure 2b); formation by Kazakh white-headed and Hereford breeds of the joined branch on Neighbor-Net trees (Figure 3, Supplemental materials, Figure S3). The contribution of Herefords is confirmed by more than a threefold decrease of the genetic distance with Kazakh white-headed cattle (FST = 0.049) comparing to museum Kazakh cattle (FST = 0.154) (Supplemental materials, Table S5), as well as by observed gene flow from Hereford ancestors to the ancestral population of the Kazakh white-headed breed at TreeMix tree (Figure 4a). The positive SE value observed between Hereford and Kazakh white-headed cattle at residual matrix plotted from a TreeMix (Figure 4b) indicates that these two breeds are even more closely related to each other than in the modeled tree. However, individuals that have retained a visible portion of their historical genetic components are still present among modern Kazakh white-headed cattle (Figure 2b). Including such individuals in conservation programs has great value for maintenance of the genetic diversity of the local animal genetic resources.
Thus, our research results have demonstrated that the studied cattle breeds have still retained their historical genetic background, which allows them to this day not only to successfully compete with transboundary breeds, but also to perform important functions ranging from providing foods to socio-economic, cultural and ecological roles in their breeding areas. In our opinion, the strategy for the further preservation of the genetic resources of these breeds may consist at least of preventing mass crossbreeding with trans-boundary breeds. In the ongoing breeding policy, special attention should be paid to the preservation of historical allele pool, since it composes the genetic uniqueness of breeds, formed by combining the ecological processes, gene flow, local breeding practices, and geographical features.
Considering the development of new powerful molecular genetics tools that enable high-throughput analysis of cattle at the genome level [18,19,22,23,71,72], including analysis of museum and archeological specimens [73,74], additional studies are required to identify and trace more precisely the historical genomic components in the modern representatives of breeds.

5. Conclusions

Using the genotypes for 11 microsatellite loci, we compared the genetic diversity and established the genetic relationships between the museum (dated to the first part of 20th century) and modern populations of Kalmyk, Kyrgyz, and Kazakh cattle, distributed in the south steppe region of the European part of Russia, Kazakhstan, Kyrgyzstan, and West Siberia. We showed that the allele pool of modern cattle populations has undergone changes that have manifested visibly, which are most significant in the Kazakh white-headed cattle. At the same time, we were able to clearly show that modern representatives of all of the studied breeds retained a portion of their historical genetic components, making them valuable national genetic resources. These research results can be used for developing sustainable programs for conservation of the genetic diversity of native cattle breeds.

Supplementary Materials

The following are available online at https://www.mdpi.com/article/10.3390/d13080351/s1, Figure S1: Representatives of Kalmyk (a) and Kyrgyz (b) cattle demonstrated on the first agricultural exhibition of breeding cattle in Moscow 1896, Figure S2: Schematic map of the zoning of cattle breeds on the territory of the USSR in 1934, Figure S3: Neighbor-Net graphs based on FST genetic distances characterizing genetic relationships between studied museum and modern cattle populations, Table S1: Quantitative and qualitative characteristics of DNA extracted from the museum specimens and number of replicates used for estimating the consensus genotypes, Table S2: Microsatellite genotypes of museum and modern samples used for the studies, Table S3: Quality of microsatellite genotyping and distribution of genotyping errors among microsatellite loci in museum samples of studied cattle populations, Table S4: Alleles of microsatellites, which were occurred in museum samples, but were lost in modern populations and novel alleles, which are appeared in modern populations, Table S5: Genetic distances between the studied populations based on FST and Jost’s D indices.

Author Contributions

Conceptualization, N.A.Z.; methodology, A.S.A. and N.A.Z.; software, A.S.A. and A.V.D.; validation, A.S.A., A.V.D. and A.A.S.; investigation, A.S.A., V.R.K., V.V.V., A.A.S. and R.Y.C.; resources, O.I.B. and E.M.L.; data curation, A.S.A. and N.A.Z.; writing—original draft preparation, A.S.A. and N.A.Z.; writing—review and editing, A.S.A., A.A.S., O.I.B., J.S., G.B. and N.A.Z.; supervision, N.A.Z.; visualization, A.S.A.; supervision, N.A.Z.; project administration, N.A.Z.; funding acquisition, N.A.Z. All authors have read and agreed to the published version of the manuscript.

Funding

This research was funded by the Russian Science Foundation within project No. 19-76-20012 (study of museum samples) and the Russian Ministry of Science and Higher Education within theme No. 0445-2019-0024 (study of modern samples).

Institutional Review Board Statement

The study was approved by the Ethics Commission of the L.K. Ernst Federal Research Center for Animal Husbandry (protocol No. 3 from the 19 January 2021).

Informed Consent Statement

Not applicable.

Data Availability Statement

The data presented in this study are available in Supplementary Materials, Table S2.

Conflicts of Interest

The authors declare no conflict of interest. The funders had no role in the design of the study; in the collection, analyses, or interpretation of data; in the writing of the manuscript, or in the decision to publish the results.

References

  1. Jeong, C.; Wang, K.; Wilkin, S.; Taylor, W.T.T.; Miller, B.K.; Ulziibayar, S.; Stahl, R.; Chiovelli, C.; Bemmann, J.H.; Knolle, F.; et al. A Dynamic 6,000-Year Genetic History of Eurasia’s Eastern Steppe. Cell 2020, 183, 890–904.e29. [Google Scholar] [CrossRef] [PubMed]
  2. Wilkin, S.; Ventresca Miller, A.; Taylor, W.T.T.; Miller, B.K.; Hagan, R.W.; Bleasdale, M.; Scott, A.; Gankhuyg, S.; Ramsøe, A.; Uliziibayar, S.; et al. Dairy pastoralism sustained eastern Eurasian steppe populations for 5000 years. Nat. Ecol. Evol. 2020, 4, 346–355. [Google Scholar] [CrossRef] [PubMed]
  3. Nandintsetseg, B.; Shinoda, M.; Erdenetsetseg, B. Contributions of multiple climate hazards and overgrazing to the 2009/2010 winter disaster in Mongolia. Nat. Hazards 2018, 92, 109–126. [Google Scholar] [CrossRef]
  4. Ferret, C. Mobile pastoralism a century apart: Continuity and change in south-eastern Kazakhstan, 1910 and 2012. Cent. Asian Surv. Taylor Fr. 2018, 37, 503–525. [Google Scholar] [CrossRef]
  5. Suttie, J.M. Grazing Management in Mongolia; Suttie, J.M., Reynolds, S.J., Batelo, C., Eds.; Grasslands of the World, Plant Production and Protection Series 34; FAO-UN: Rome, Italy, 2005; pp. 265–304. [Google Scholar]
  6. Nandintsetseg, B.; Shinoda, M.; Du, C.; Munkhjargal, E. Cold-season disasters on the Eurasian steppes: Climate-driven or man-made. Sci. Rep. 2018, 8, 14769. [Google Scholar] [CrossRef]
  7. Leopoldov, A.V. Cattle at the First All-Union Agricultural Exhibition of 1923; Novaya Derevnya: Moscow, Russia, 1924; 178p, Available online: http://elib.cnshb.ru/books/free/0365/365927 (accessed on 15 June 2021).
  8. Liskun, E.F. Domestic Breeds of Cattle; State Publishing House of Agricultural Literature: Moscow, Russia, 1949; 175p. [Google Scholar]
  9. Ernst, L.K.; Dmitriev, N.G.; Paronyan, I.A. Genetic Resources of Farm Animals in Russia and Neighboring Countries; All-Russian Research Institute of Animal Genetics and Breeding: St. Petersburg, Russia, 1994; p. 469. [Google Scholar]
  10. Eldarov, N.A. About the History of Continuous Expedition Surveys in Kalmykia. Stat. Issues 2006, 6, 63–66. Available online: http://www.lib.kalmsu.ru/text/TRUD/Eldyaeva_NA/p002.pdf (accessed on 15 June 2021).
  11. Liskun, E.F. Russian Cattle Breeds; Novyj Agronom: Moscow, Russia, 1928; 212p. [Google Scholar]
  12. Pozdneev, A.M. Astrakhan Kalmyks and their attitude to Russia before the beginning of the present century. J. Minist. Public Educ. 1886, 244, 140–171. [Google Scholar]
  13. Lee, J.-Y. Were the Historical Oirats “Western Mongols”? An Examination of Their Uniqueness in Relation to the Mongols. Études Mongoles et Sibériennes, Centrasiatiques et Tibétaines 2016, 47. Available online: http://journals.openedition.org/emscat/2820 (accessed on 8 June 2021). [CrossRef] [Green Version]
  14. Grousset, R. The Empire of the Steppes: A History of Central Asia; Rutgers University Press: New Brunswick, NJ, USA, 1970. [Google Scholar]
  15. Kendirbai, G.T. The Politics of the Inner Asian Frontier and the 1771 Exodus of the Kalmyks. Inner Asia 2018, 20, 263–292. [Google Scholar] [CrossRef]
  16. Ivanova, O.A.; Rogov, A.L.; Fedorov, V.I. Cattle Breeding; Selkhozgiz: Moscow, Russia, 1934; 287p. [Google Scholar]
  17. Dmitriev, N.G.; Ernst, L.K. Animal Genetic Resources of the USSR; FAO and UNEP: Rome, Italy, 1989; Available online: http://www.fao.org/3/ah759e/AH759E07.htm (accessed on 10 February 2021).
  18. Sermyagin, A.A.; Dotsev, A.V.; Gladyr, E.A.; Traspov, A.A.; Deniskova, T.E.; Kostjunina, O.V.; Reyer, H.; Wimmers, K.; Barbato, M.; Paronyan, I.A.; et al. Whole-genome SNP analysis elucidates the genetic structure of Russian cattle and its relationship with Eurasian taurine breeds. Genet. Sel. Evol. 2018, 50, 37. [Google Scholar] [CrossRef] [Green Version]
  19. Yurchenko, A.; Yudin, N.; Aitnazarov, R.; Plyusnina, A.; Brukhin, V.; Soloshenko, V.; Lhasaranov, B.; Popov, R.; Paronyan, I.A.; Plemyashov, K.V.; et al. Genome-wide genotyping uncovers genetic profiles and history of the Russian cattle breeds. Heredity 2018, 120, 125–137. [Google Scholar] [CrossRef] [PubMed]
  20. Butusov, D.V.; Ministry of Agriculture of the Russian Federation, Moscow, Russia. Animal Genetic Resources, State Support Measures, Key Tasks. Personal communication, 2021. [Google Scholar]
  21. Felius, M.; Theunissen, B.; Lenstra, J. Conservation of cattle genetic resources: The role of breeds. J. Agric. Sci. 2015, 153, 152–162. [Google Scholar] [CrossRef]
  22. Zinovieva, N.A.; Dotsev, A.V.; Sermyagin, A.A.; Deniskova, T.E.; Abdelmanova, A.S.; Kharzinova, V.R.; Sölkner, J.; Reyer, H.; Wimmers, K.; Brem, G. Selection signatures in two oldest Russian native cattle breeds revealed using high-density single nucleotide polymorphism analysis. PLoS ONE 2020, 15, e0242200. [Google Scholar] [CrossRef] [PubMed]
  23. Zinovieva, N.A.; Sheiko, I.P.; Dotsev, A.V.; Sheiko, R.I.; Mikhailova, M.E.; Sermyagin, A.A.; Abdelmanova, A.S.; Kharzinova, V.R.; Reyer, H.; Wimmers, K.; et al. Genome-wide SNP analysis clearly distinguished the Belarusian Red cattle from other European cattle breeds. Anim. Genet. 2021. [Google Scholar] [CrossRef] [PubMed]
  24. Scherf, B.D.; Pilling, D. The Second Report on the State of the World’s Animal Genetic Resources for Food and Agriculture; FAO: Rome, Italy, 2015; Available online: http://www.fao.org/3/a-i4787e/index.html (accessed on 8 June 2021).
  25. Sponenberg, D.P. Conserving the Genetic Diversity of Domesticated Livestock. Diversity 2020, 12, 282. [Google Scholar] [CrossRef]
  26. Rowe, K.C.; Singhal, S.; Macmanes, M.D.; Ayroles, J.F.; Morelli, T.L.; Rubidge, E.M.; Bi, K.; Moritz, C.C. Museum genomics: Low-cost and high-accuracy genetic data from historical specimens. Mol. Ecol. Resour. 2011, 11, 1082–1092. [Google Scholar] [CrossRef]
  27. Billerman, S.M.; Walsh, J. Historical DNA as a tool to address key questions in avian biology and evolution: A review of methods, challenges, applications, and future directions. Mol. Ecol. Resour. 2019, 19, 1115–1130. [Google Scholar] [CrossRef]
  28. Zinovieva, N.A.; Sermyagin, A.A.; Dotsev, A.V.; Boronetslaya, O.I.; Petrikeeva, L.V.; Abdelmanova, A.S.; Brem, G. Animal genetic resources: Developing the research of allele pool of Russian cattle breeds—Minireview. Sel’skokhozyaistvennaya Biologiya 2019, 54, 631–641. [Google Scholar] [CrossRef] [Green Version]
  29. Abdelmanova, A.S.; Kharzinova, V.R.; Volkova, V.V.; Mishina, A.I.; Dotsev, A.V.; Sermyagin, A.A.; Boronetskaya, O.I.; Petrikeeva, L.V.; Chinarov, R.Y.; Brem, G.; et al. Genetic Diversity of Historical and Modern Populations of Russian Cattle Breeds Revealed by Microsatellite Analysis. Genes 2020, 11, 940. [Google Scholar] [CrossRef]
  30. McHugo, G.P.; Dover, M.J.; MacHugh, D.E. Unlocking the origins and biology of domestic animals using ancient DNA and paleogenomics. BMC Biol. 2019, 17, 98. [Google Scholar] [CrossRef] [Green Version]
  31. Putman, A.I.; Carbone, I. Challenges in analysis and interpretation of microsatellite data for population genetic studies. Ecol. Evol. 2014, 4, 4399–4428. [Google Scholar] [CrossRef]
  32. Laoun, A.; Harkat, S.; Lafri, M.; Gaouar, S.B.S.; Belabdi, I.; Ciani, E.; De Groot, M.; Blanquet, V.; Leroy, G.; Rognon, X.; et al. Inference of Breed Structure in Farm Animals: Empirical Comparison between SNP and Microsatellite Performance. Genes 2020, 11, 57. [Google Scholar] [CrossRef] [Green Version]
  33. Eusebi, P.G.; Martinez, A.; Cortes, O. Genomic Tools for Effective Conservation of Livestock Breed Diversity. Diversity 2020, 12, 8. [Google Scholar] [CrossRef] [Green Version]
  34. Brenig, B.; Schütz, E. Recent development of allele frequencies and exclusion probabilities of microsatellites used for parentage control in the German Holstein Friesian cattle population. BMC Genet. 2016, 17, 18. [Google Scholar] [CrossRef] [PubMed] [Green Version]
  35. Molecular Genetic Characterization of Animal Genetic Resources; FAO Animal Production and Health Guidelines. FAO: Rome, Italy, 2011; pp. 68–69. Available online: http://www.fao.org/3/i2413e/i2413e00.pdf (accessed on 8 June 2021).
  36. Abdelmanova, A.S.; Mishina, A.I.; Volkova, V.V.; Chinarov, R.Y.; Sermyagin, A.A.; Dotsev, A.V.; Boronetskaya, O.I.; Petrikeeva, L.V.; Kostyunina, O.V.; Brem, G.; et al. Comparative study of different methods of DNA extraction from cattle bones specimens maintained in a craniological collection. Sel’skokhozyaistvennaya Biol. [Agric. Biol.] 2019, 54, 1110–1121. [Google Scholar] [CrossRef]
  37. Mondol, S.; Karanth, K.U.; Kumar, N.S.; Gopalaswamy, A.M.; Andheria, A.; Ramakrishnan, U. Evaluation of non-invasive genetic sampling methods for estimating tiger population size. Biol. Conserv. 2009, 142, 2350–2360. [Google Scholar] [CrossRef]
  38. Modi, S.; Habib, B.; Ghaskadbi, P.; Nigam, P.; Mondol, S. Standardization and validation of a panel of cross-species microsatellites to individually identify the Asiatic wild dog (Cuon alpinus). Peer J. 2019, 7, e7453-10. [Google Scholar] [CrossRef] [PubMed] [Green Version]
  39. Miquel, C.; Bellemain, E.; Poillot, C.; Bessière, J.; Durand, A.; Taberlet, P. Quality indexes to assess the reliability of genotypes in studies using noninvasive sampling and multiple-tube approach. Mol. Ecol. Notes 2006, 6, 985–988. [Google Scholar] [CrossRef]
  40. Broquet, T.; Petit, E. Quantifying genotyping errors in noninvasive population genetics. Mol. Ecol. 2004, 13, 3601–3608. [Google Scholar] [CrossRef]
  41. He, G.; Kang, H.; Guo, S.T.; Ji, W.H.; Qi, X.G.; Ren, Y.; Jin, X.L.; Li, B.G. Evaluating the reliability of microsatellite genotyping from low-quality DNA templates with a polynomial distribution model. Chin. Sci Bull 2011, 56, 2523–2530. [Google Scholar] [CrossRef] [Green Version]
  42. Chapuis, M.-P.; Estoup, A. Microsatellite Null Alleles and Estimation of Population Differentiation. Mol. Biol. Evol. 2007, 24, 621–631. [Google Scholar] [CrossRef] [Green Version]
  43. Van Oosterhout, C.; Hutchinson, W.F.; Wills, D.P.M.; Shipley, P. micro-checker: Software for identifying and correcting genotyping errors in microsatellite data. Mol. Ecol. Notes 2004, 4, 535–538. [Google Scholar] [CrossRef]
  44. Peakall, R.; Smouse, P.E. GenAlEx 6.5: Genetic analysis in Excel. Population genetic software for teaching and research--an update. Bioinformatics 2012, 28, 2537–2539. [Google Scholar] [CrossRef] [PubMed] [Green Version]
  45. Keenan, K.; McGinnity, P.; Cross, T.F.; Crozier, W.W.; Prodöhl, P.A. diveRsity : An R package for the estimation and exploration of population genetics parameters and their associated errors. Methods Ecol. Evol. 2013, 4, 782–788. [Google Scholar] [CrossRef] [Green Version]
  46. Jombart, T. adegenet: A R package for the multivariate analysis of genetic markers. Bioinformatics 2008, 24, 1403–1405. [Google Scholar] [CrossRef] [PubMed] [Green Version]
  47. Wickham, H. Ggplot2: Elegant Graphics for Data Analysis; Use R! Springer: New York, NY, USA, 2009; ISBN 978-0-387-98140-6. [Google Scholar]
  48. Kalinowski, S.T. Counting Alleles with Rarefaction: Private Alleles and Hierarchical Sampling Designs. Conserv. Genet. 2004, 5, 539–543. [Google Scholar] [CrossRef]
  49. Wilcoxon, F. Individual Comparisons by Ranking Methods. Biom. Bull. 1945, 1, 80–83. [Google Scholar] [CrossRef]
  50. R Core Team. R: A Language and Environment for Statistical Computing; R Foundation for Statistical Computing: Vienna, Austria; Available online: https://www.R-project.org/ (accessed on 12 May 2020).
  51. Jost, L. G ST and its relatives do not measure differentiation. Mol. Ecol. 2008, 17, 4015–4026. [Google Scholar] [CrossRef]
  52. Weir, B.S.; Cockerham, C.C. Estimating F-Statistics for the Analysis of Population Structure. Evolution 1984, 38, 1358–1370. [Google Scholar] [CrossRef]
  53. Huson, D.H.; Bryant, D. Application of Phylogenetic Networks in Evolutionary Studies. Mol. Biol. Evol. 2006, 23, 254–267. [Google Scholar] [CrossRef] [PubMed]
  54. Pritchard, J.K.; Stephens, M.; Donnelly, P. Inference of population structure using multilocus genotype data. Genetics 2000, 155, 945–959. [Google Scholar] [CrossRef]
  55. Kopelman, N.M.; Mayzel, J.; Jakobsson, M.; Rosenberg, N.A.; Mayrose, I. CLUMPAK: A program for identifying clustering modes and packaging population structure inferences across K. Mol. Ecol. Resour. 2015, 15, 1179–1191. [Google Scholar] [CrossRef] [Green Version]
  56. Pickrell, J.K.; Pritchard, J.K. Inference of population splits and mixtures from genome-wide allele frequency data. PLoS Genet. 2012, 8, e100296. [Google Scholar] [CrossRef] [Green Version]
  57. Fitak, R.R. optM: An R package to optimize the number of migration edges using threshold models. J. Hered. 2019. Available online: https://cran.r-project.org/web/packages/OptM/index.html (accessed on 21 June 2021).
  58. Hoffmann, I. Climate change and the characterization, breeding and conservation of animal genetic resources. Anim. Genet. 2010, 41, 32–46. [Google Scholar] [CrossRef] [PubMed]
  59. FAO. Status and trends of Animal Genetic Resources. Commission on Genetic Resources for Food and Agriculture. 2019. Available online: http://www.fao.org/3/my867en/my867en.pdf (accessed on 24 June 2021).
  60. Hanotte, O.; Toll, J.; Iniguez, L.; Rege, E. Farm animal genetic resources: Why and what do we need to conserve. In Options and Strategies for the Conservation of Farm Animal Genetic Resources: Report of an International Workshop, Montpellier, France, 7–10 November 2005; Gibson, J., Gamage, S., Hanotte, O., Iniguez, L., Maillard, J.C., Rischkowsky, B., Semambo, D., Toll, J., Eds.; CGIAR System-Wide Genetic Resources Programme (SGRP): Rome, Italy; Bioversity International: Rome, Italy, 2006; p. 53. [Google Scholar]
  61. Cao, J.; Baumung, R.; Boettcher, P.; Scherf, B.; Besbes, B.; Leroy, G. Monitoring and Progress in the Implementation of the Global Plan of Action on Animal Genetic Resources. Sustainability 2021, 13, 775. [Google Scholar] [CrossRef]
  62. van Breukelen, A.E.; Doekes, H.P.; Windig, J.J.; Oldenbroek, K. Characterization of Genetic Diversity Conserved in the Gene Bank for Dutch Cattle Breeds. Diversity 2019, 11, 229. [Google Scholar] [CrossRef] [Green Version]
  63. Edwards, C.J.; Connellan, J.; Wallace, P.F.; Park, S.D.E.; McCormick, F.M.; Olsaker, I.; Eythórsdóttir, E.; MacHugh, D.E.; Bailey, J.F.; Bradley, D.G. Feasibility and utility of microsatellite markers in archaeological cattle remains from a Viking Age settlement in Dublin. Anim. Genet. 2003, 34, 410–416. [Google Scholar] [CrossRef] [Green Version]
  64. Gargani, M.; Pariset, L.; Lenstra, J.A.; De Minicis, E.; European Cattle Genetic Diversity Consortium; Valentini, A. Microsatellite genotyping of medieval cattle from central Italy suggests an old origin of Chianina and Romagnola cattle. Front. Genet. 2015, 6, 68. [Google Scholar] [CrossRef] [PubMed] [Green Version]
  65. Svishcheva, G.; Babayan, O.; Lkhasaranov, B.; Tsendsuren, A.; Abdurasulov, A.; Stolpovsky, Y. Microsatellite diversity and phylogenetic relationships among East Eurasian Bos taurus breeds with an emphasis on rare and ancient local cattle. Animals 2020, 10, 1493. [Google Scholar] [CrossRef]
  66. Kayumov, F.G.; Eremenko, V.K. Kalmyk Cattle in the Conditions of South Ural and West Kazakhstan; Gazprompechat: Orenburg, Russia, 2004; 383p. [Google Scholar]
  67. Zhumakanov, K.T.; Abdurasulov, A.H.; Zhunushov, A.T. Conservation of Gene Pool of Agricultural Animals in Kyrgyzstan. Agric. J. 2016, 9, 50–54. Available online: https://cyberleninka.ru/article/n/sohranenie-genofonda-selskohozyaystvennyh-zhivotnyh-kyrgyzstana-problema-gosudarstvennogo-znacheniya (accessed on 26 June 2020).
  68. Zhang, G.X.; Wang, Z.G.; Chen, W.S.; Wu, C.X.; Han, X.; Chang, H.; Zan, L.S.; Li, R.L.; Wang, J.H.; Song, W.T.; et al. Genetic diversity and population structure of indigenous yellow cattle breeds of China using 30 microsatellite markers. Anim. Genet. 2007, 38, 550–559. [Google Scholar] [CrossRef]
  69. Berthouly-Salazar, C.; Thévenon, S.; Van, T.N.; Nguyen, B.T.; Pham, L.D.; Chi, C.V.; Maillard, J.C. Uncontrolled admixture and loss of genetic diversity in a local Vietnamese pig breed. Ecol. Evol. 2012, 2, 962–975. [Google Scholar] [CrossRef] [Green Version]
  70. Ba, N.V.; Arakawa, A.; Ishihara, S.; Nam, L.Q.; Thuy, T.T.T.; Dinh, N.C.; Ninh, P.H.; Cuc, N.T.K.; Kikuchi, K.; Pham, L.D.; et al. Evaluation of genetic richness among Vietnamese native pig breeds using microsatellite markers. Anim. Sci. J. 2020, 91, e13343. [Google Scholar] [CrossRef]
  71. McTavish, E.J.; Decker, J.E.; Schnabel, R.D.; Taylor, J.F.; Hillis, D.M. New World cattle show ancestry from multiple independent domestication events. Proc. Natl. Acad. Sci. USA 2013, 110, E1398–E1406. [Google Scholar] [CrossRef] [PubMed] [Green Version]
  72. Decker, J.E.; McKay, S.D.; Rolf, M.M.; Kim, J.; Molina Alcalá, A.; Sonstegard, T.S.; Hanotte, O.; Götherström, A.; Seabury, C.M.; Praharani, L.; et al. Worldwide Patterns of Ancestry, Divergence, and Admixture in Domesticated Cattle. PLoS Genet 2014, 10, e1004254. [Google Scholar] [CrossRef] [PubMed] [Green Version]
  73. Upadhyay, M.; Chen, W.; Lenstra, J.; Goderie, C.R.; MacHugh, D.E.; Park, S.D.; Magee, D.A.; Matassino, D.; Ciani, F.; Megens, H.J.; et al. European Cattle Genetic Diversity Consortium; RPMA Crooijmans. Genetic origin, admixture and population history of aurochs (Bos primigenius) and primitive European cattle. Heredity 2017, 118, 169–176. [Google Scholar] [CrossRef] [PubMed] [Green Version]
  74. Verdugo, M.P.; Mullin, V.E.; Scheu, A.; Mattiangeli, V.; Daly, K.G.; Maisano Delser, P.; Hare, A.J.; Burger, J.; Collins, M.J.; Kehati, R.; et al. Ancient cattle genomics, origins, and rapid turnover in the Fertile Crescent. Science 2019, 365, 173–176. [Google Scholar] [CrossRef] [PubMed]
Figure 1. Museum skulls of cattle breeds used for the the study dated by the first quarter of 20th century: (a)—Kalmyk, (b)—Kyrgyz, (c)—Kazakh.
Diversity 13 00351 g001
Figure 2. (a). Principal component analysis (PCA) of the museum and modern cattle populations. X-axis, principal component 1 (PC1); Y-axis, principal component 2 (PC2); (b). Genetic structure of museum and modern cattle populations revealed by STRUCTURE analysis for the number of clusters K = 2. Museum populations: KALM_H—Kalmyk, KRGZ_H—Kyrgyz, KZKH_H—Kazakh, modern populations: KALM_M—Kalmyk, KRGZ_M—Kyrgyz, KZWH_M—Kazakh White-Headed, HRFD_M—Hereford, MONG_M—Mongolian cattle.
Diversity 13 00351 g002
Figure 3. Neighbor-Net graphs based on Jost’s D genetic distances characterizing genetic relationships between studied museum and modern cattle populations. Museum populations: KALM_H—Kalmyk, KRGZ_H—Kyrgyz, KZKH_H—Kazakh, modern populations: KALM_M—Kalmyk, KRGZ_M—Kyrgyz, KZWH_M—Kazakh White-Headed, HRFD_M—Hereford, MONG_M—Mongolian cattle.
Diversity 13 00351 g003
Figure 4. (a) Maximum likelihood tree inferred from studied cattle populations with single migration edge. Scale bar shows 10 times the average standard error (SE) of the estimated entries in the sample covariance matrix. Putative gene flow is indicated by the arrow, pointing in the direction of flow from the donor to the recipient population, and coloured in orange, proportional to the gene flow intensity. (b) Residual matrix plotted from a TreeMix analysis under single migration event and expressed as the number of SE of the deviation. Positive SE values between pairs of populations indicate that populations are more closely related to each other than in the modeled tree, while negative SE values show that the observed covariance is overestimated. Museum populations: KALM_H—Kalmyk, KRGZ_H—Kyrgyz, KZKH_H—Kazakh, modern populations: KALM_M—Kalmyk, KRGZ_M—Kyrgyz, KZWH_M—Kazakh White-Headed, HRFD_M—Hereford, MONG_M—Mongolian cattle.
Diversity 13 00351 g004
Table 1. Number of identified alleles among microsatellite loci in studied cattle populations (%).
#LocusEntire DatasetMuseum SamplesModern Samples
Observed Allele Ranges, bpNumber of AllelesObserved Allele Ranges, bpNumber of AllelesObserved Allele Ranges, bpNumber of Alleles
1TGLA22769–1011577–1011269–9914
2BM2113125–14310125–1438125–14310
3TGLA53152–18819154–18413152–18818
4ETH10209–2258213–2257209–2258
5SPS115244–2629248–2605244–2629
6TGLA122137–18321137–17314137–18320
7INRA23196–21812198–21610196–21812
8TGLA126107–1259107–1237111–1258
9BM1818256–27410256–2748258–2749
10ETH225140–16010140–1587140–1609
11BM1824178–1907178–1884178–1907
In average11.82 ± 1.38 8.63 ± 0.97 11.27 ± 1.30
Notes: locus—microsatellite locus; observed allele ranges—the limits of allelic lengths of studied microsatellite loci in historical samples analysed (a allele sizes were standardised according to International Society of Animal Genetics (ISAG) International Bovine (Bos Taurus) short tandem repeat (STR) typing comparison test 2018–2019).
Table 2. Allelic variability and number of common alleles in studied breeds.
PopulationsKALM_HKRGZ_HKZKH_HKALM_MKRGZ_MKZWH_MHRFD_MMONG_M
KALM_H72
KRGZ_H4969
KZKH_H373041
KALM_M60583787
KRGZ_M6356356888
KZWH_M555334636573
HRFD_M48403049535357
MONG_M6361387172685394
Notes: museum populations: KALM_H—Kalmyk, KRGZ_H—Kyrgyz, KZKH_H—Kazakh, modern populations: KALM_M—Kalmyk, KRGZ_M—Kyrgyz, KZWH_M—Kazakh White-Headed, HRFD_M—Hereford, MONG_M—Mongolian cattle; number of alleles identified in studied breeds is shown at diagonal; the number of alleles, which are common for two breeds are shown below the diagonal.
Table 3. Summary statistics for museum and modern populations of studied breeds based on genotypes of 11 microsatellites.
PopulationnHo (M ± SE)uHe (M ± SE)AR (M ± SE)uFIS (CI, 95%)
KALM_H100.671 ± 0.0480.772 ± 0.029 *3.635 ± 0.199 *0.131 [0.033; 0.229]
KRGZ_H110.707 ± 0.0530.776 ± 0.035 *3.693 ± 0.251 *0.081 [−0.055; 0.217]
KZKH_H30.818 ± 0.0820.767 ± 0.0673.727 ± 0.333−0.066 [−0.174; 0.042]
KALM_M280.736 ± 0.0490.771 ± 0.0343.664 ± 0.232 *0.044 [−0.050; 0.138]
KRGZ_M200.841 ± 0.0210.778 ± 0.024 *3.704 ± 0.196 *−0.085 [−0.137; −0.033]
KZWH_M300.736 ± 0.0390.726 ± 0.0303.336 ± 0.167 *−0.011 [−0.063; 0.041]
HRFD_M260.668 ± 0.0640.653 ± 0.0532.994 ± 0.211−0.005 [−0.078; 0.068]
MONG_M410.672 ± 0.0360.761 ± 0.020 *3.531 ± 0.176 *0.115 [0.028; 0.202]
Notes: n, number of individuals; Ho, observed heterozygosity; uHe, unbiased expected heterozygosity; AR, rarefied allele richness; uFIS, unbiased inbreeding coefficient; M, mean value; SE, standard error; CI 95%, range variation coefficient of uF is at a confidence interval of 95%; museum populations: KALM_H—Kalmyk, KRGZ_H—Kyrgyz, KZKH_H—Kazakh, modern populations: KALM_M—Kalmyk, KRGZ_M—Kyrgyz, KZWH_M—Kazakh White-Headed, HRFD_M—Hereford, MONG_M—Mongolian cattle; * p < 0.05 comparing to Hereford breed according to pairwise comparing Wilcoxon rank-sum test.
Publisher’s Note: MDPI stays neutral with regard to jurisdictional claims in published maps and institutional affiliations.

