Abstract
Federal land management agencies in the US are tasked with maintaining the ecological integrity of over 2 million km2 of land for myriad public uses. Citizen science, operating at the nexus of science, education, and outreach, offers unique benefits to address socio-ecological questions and problems, and thus may offer novel opportunities to support the complex mission of public land managers. Here, we use a case study of an iNaturalist program, the Tribal Nations Botanical Research Collaborative (TNBRC), to examine the use of citizen science programs in public land management. The TNBRC collected 2030 observations of 34 plant species across the project area, while offering learning opportunities for participants. Using occurrence data, we examined observational trends through time and identified five species with 50 or fewer digital observations to investigate as species of possible conservation concern. We compared predictive outcomes of habitat suitability models built using citizen science data and Forest Inventory and Analysis (FIA) data. Models exhibited high agreement, identifying the same underlying predictors of species occurrence and, 95% of the time, identifying the same pixels as suitable habitat. Actions such as staff training on data use and interpretation could enhance integration of citizen science in Federal land management.
1. Introduction
Citizen or community science programs provide ecological data at spatial and temporal extents previously unattainable due to financial or logistic constraints of traditional studies [1,2]. Broadly, citizen science projects can be divided into categories based on investment in volunteer training. High investment programs, such as Earthwatch (Earth Watch. Available online: https://earthwatch.org (accessed on 25 June 2021)), generate detailed, accurate data often at the population or community levels, comparable with traditional ecological studies. Low investment programs are generally smart phone-based, provide minimal instruction to volunteers, and generate coarse data (e.g., species-level occurrence) at landscape scales. Programs with low investment in volunteer education are increasing in popularity, since such programs reduce barriers to participation, allowing volunteers to opportunistically collect data on self-directed time tables, without requiring significant additional investment in equipment or travel. Several key technological breakthroughs have revolutionized the way that citizen scientists collect or process data for these programs, thus enabling project scaling and improved confidence in data products. Cloud storage permits the remote storage of data, and internet connectivity allows global contributions of information toward project goals. As an example, the project “Chimp & See” hosted on the citizen science platform, Zooniverse (Zooniverse. Available online: https://www.zooniverse.org/ (accessed on 25 June 2021)), curates thousands of camera trap images of chimpanzees, which volunteers from across the globe review to classify behaviors. Advances in smart phone technology and decreases in the price point of these devices now permit an estimated 5 billion people, including 96% of Americans, to carry Global Positioning System (GPS) units and high-resolution cameras at all times [3]. Increased access to technology has increased fluency with the use of electronic devices and related software across all socio-economic levels, lowering economic and educational barriers to public participation in science. Finally, development of analytical methodology, supported by advances in computational speeds, now permits the analysis of large citizen science datasets in ways that reduce observer bias and other problematic aspects of data collected by the public [4]. Leveraging these advances, citizen science has meaningfully contributed to monitoring climate change through impacts on phenology and species distributions, tracked invasion of non-native species, provided baseline data prior to disturbance [5], and assessed global patterns of species richness [6,7].
Major funders such as the National Science Foundation (NSF) and the National Environmental Research Council in the United Kingdom now emphasize accountability of the sciences to the public to justify use of tax revenues for scientific endeavors [2], thus increasing the popularity of integrating citizens into research and promoting democratization of the sciences. Sociological investigations of citizen science projects indicate that public-integrated projects have the potential to address multiple goals, beyond simple data acquisition and analysis [8,9], Bonney et al. (2016) highlighted projects, which while generating data, also served to enhance interest in science and nature, promote environmental stewardship or awareness of conservation topics, and demonstrate the overall value of science. Moreover, accessible application-based programs have the potential to foster scientific engagement across socio-economic divides, thus supporting the diversification of STEM fields in the long term [10]. The complex socio-ecological benefits provided by citizen science uniquely address the multivariate goals of US Federal land management agencies or any other manager of common property tasked with the responsibility to sustain and provision ecological resources for a diverse public. Recognizing this potential, US Federal agencies are promoting citizen science projects on public lands, through organizational efforts, such as the citizenscience.gov site (citizenscience.gov. Available online: https://www.citizenscience.gov/# (accessed on 25 June 2021)), and funding programs, such as the US Forest Service’s (USFS) Citizen Science Competitive Funding Program (USDA Citizen Science Competitive Funding Program. Available online: https://www.fs.usda.gov/working-with-us/citizen-science/competitive-funding-program (accessed on 25 June 2021)), resulting in a multitude of on-the-ground projects (488 registered to the Federal Crowdsourcing and Citizen Science Catalog).
Here, we describe an initiative to identify plants traditionally used by Arizona Tribes on USFS lands, the Tribal Nations Botanical Research Collaborative (TNBRC; Tribal Nations Botanical Research Collaborative iNaturalist Site. Available online: https://www.inaturalist.org/projects/tribal-nations-botanical-research-collaborative (accessed on 25 June 2021)), using the iNaturalist platform. The challenge of managing shared resources for diverse constituencies with at times competing interests is a wicked problem, only intensified by rapid global change, which decouples resources from established communities, and increasing human population size, which intensifies competition for limited resources. Simultaneously, societies are struggling to address inequities driven by racism systemic across institutions, including those that manage public areas. This manuscript highlights how citizen science can be used as a tool to uphold the interests of underrepresented groups in land management, collect information to undergird the ability of these groups to shape management priorities and actions, and educate land managers and the public about conservation concerns. Specific programmatic goals of the TNBRC were to provide Tribal members with harvest locations for focal plant species, generate information on species status for Federal land managers, promote stewardship of shared resources to members of the general public, and foster the connection between Tribal partners and USFS lands. In an informal survey, USFS employees highlighted a lack of familiarity working with citizen science data and concerns regarding data quality of such application-based projects as barriers to integrating data generated by citizen scientists in planning, monitoring, and management efforts. For this reason, we provided an in-depth exploration of data analysis and quality. Specifically, we asked: (1) What ecological information can citizen science provide for public land managers? (2) What are the significant caveats, limitations, and best practices to consider when interpreting citizen science data? Finally, we present this collaboration between Tribal Nations, scientists, Federal entities, and key public constituents as a roadmap to address similarly complex socio-ecological issues on shared public lands.
2. Materials and Methods
2.1. Project History and Structure
The TNBRC, a collaboration between Arizona Tribal Nations, the USFS, and Northern Arizona University (NAU), developed out of requests by USFS Tribal partners for information on traditionally used plants on USFS lands. Harvest of wild plants for food, medicine, ceremonies or other purposes remains a culturally and spiritually important practice for many Native American Tribes. Because Native American Reservations represent a fraction of the territory once inhabited by Tribes, access to public lands is integral to the continuation of cultural practices, as these areas may contain traditionally important plants not found on reservations. Variation in harvest permit regulations among Federal agencies have disincentivized traditional harvests on public lands. For instance, the National Park Service (NPS) restricted plant harvests in the past by levying high permit fees and requiring Tribal Nations to demonstrate “no detriment” of harvests to natural resources in order to comply with the NPS’s preservationist mission of “conserving unimpaired the natural and cultural resources and values of the NPS for the enjoyment, education, and inspiration of this and future generations”. While the NPS is actively striving to codify exemptions that would facilitate traditional harvests by US Tribes [11], the legacy of stringent permit requirements has resulted in Tribal members avoiding NPS lands for harvesting purposes, and indeed led to general avoidance of harvesting on Federal lands because subtle differences in agency missions and management strategies are often not apparent to non-US governmental entities (personal communication with meeting participants at Citizen Science Organizational Meeting, 1 August 2018). For the USFS, engagement with Tribal partners is core to the USDA Forest Service Strategic Plan (FY 2015–2020), and supports the goal to “deliver benefits to the public”. Hence, the USFS was eager to promote access of Tribal members to plant resources for traditional harvest, particularly in Arizona, which is home to 21 federally recognized Tribes. Simultaneously, the TNBRC filled a significant informational gap because the USFS focuses on monitoring and management of tree species, whereas many traditional use plants are herbs or shrubs. As these species are typically neither invasive nor rare enough to be listed under the Endangered Species Act (ESA), they are infrequently monitored. Moreover, while status of traditional-use tree species is captured in USFS Forest Inventory and Analysis (FIA) surveys, precise harvest locations are challenging to access from this database because FIA plot location is obscured to prevent plot tampering. Because citizen science data are biased to easy-to-access areas, occurrence data are ideal for identifying potential harvest sites even if a species is monitored under an existing program (e.g., FIA). Leveraging volunteer efforts, the TNBRC generated data at a landscape scale, with minimum Federal spending.
After receiving funding from the USFS Citizen Science Competitive Funding Program in 2018, members of seven Tribal Nations (Hopi Tribe, Hualapai Nation, Navajo Nation, San Carlos Apache Nation, White Mountain Apache Nation, Yavapai-Apache Nation, and People of Zuni) convened with project partners at the USFS and NAU to generate best practices for data collection and management and establish a list of 34 project focal species. Focal species included plants used for food, medicine, fiber, dye, or ceremonies, and excluded plants that were sensitive due to either immense cultural or economic value (Supplementary Materials). Following protocols and guidance of Tribal members, we established a project on the iNaturalist. We then hosted a series of activities to meet TNBRC project goals, which fell into two broad categories: public outreach and education to promote project participation, and activities to foster connection of Tribal members to public lands (Table 1). While general public participation was voluntarily, we provided travel and food costs and stipends to Tribal participants. The USFS encourages compensation of Tribes for providing specialized expertise, such as traditional knowledge, that could be incorporated into restoration efforts (FSM 1563.01 and FHS 1509.11). The project is currently in a phase of data collection and membership growth, with USFS meetings planned to showcase informatic findings of analyses of citizen science data presented here.

Table 1.
Key activities for the TNBRC. After assessing specific project needs and key audiences, we delivered a series of activities to boost project participation, awareness, and data generation.
2.2. Project Area
The project area included 9712.5 km2 in central Arizona across four national forests, the Coconino, Tonto, Apache-Sitgreaves, and Kaibab, that comprise the project area of the Four Forest Restoration Initiative (4FRI). The 4FRI is the largest Collaborative Forest Landscape Restoration Program (CFLRP) nationally, with extensive fuel thinning projects planned across the project area in order to restore density, structure, and composition of ponderosa pine ecosystems to historical conditions that existed prior to the enactment of widespread fire suppression policies of the 20th and 21st centuries. Fuel reductions, aimed at restoring fire-adapted ecosystems and reducing the risk of catastrophic wildfire, include timber harvests and prescribed burns. While the effects of these treatments on overstory communities have been extensively studied, far less is known about the impact to understory shrubs and herbs that comprise the majority of traditional-use plants. Thus, there is an urgent need to document the pre-treatment status of understory species and begin to link fitness response to treatment impacts.
2.3. Platform Selection
The iNaturalist platform is a web-based application that can be downloaded to smartphones and used to make species observations. iNaturalist was an ideal platform to host the TNBRC for several reasons. First, iNaturalist is free, user-friendly, and assists with species identification by generating taxonomic suggestions when observations, in the form of georeferenced photographs, are uploaded to the site; thus cost, technological acumen, and botanical knowledge were not barriers to project participation. Second, iNaturalist employs protocols to score species observations as “research grade”, once field observations have been confirmed by other iNaturalist volunteers. Once attaining “research grade” status, data are ported to platforms such as the Global Biodiversity Information Facility (GBIF), for which there exists an established literature of use in research [12,13]. Finally, the platform allows extensive flexibility for designing iNaturalist projects, including data protection mitigations (described below in Section 2.4).
2.4. Cultural and Botanical Protection Protocols
Tribal partners guided project structure, protocols, and data delivery to reduce the risk of irresponsible harvests and protect culturally sensitive data. We enacted several key protections. First, Tribal partners selected species that were not especially rare or likely to be endangered by harvests. Second, to prevent non-Tribal communities from targeting harvests of species for commercial uses, the project intentionally provided no cultural information on the uses of these plants. Third, we blurred location information of TNBRC focal species on the iNaturalist site, so that location information was not visible to the general public. Accurate location coordinates of focal plant species were accessible only by project leaders, which include USFS Tribal Liaisons, who then provide location information to Tribal partners upon request.
2.5. Data Acquisition, Quality Control, and Analysis
We queried the GBIF database [14], an international repository for species occurrence data, using R statistical software version 3.6.3. (R-package “rgbif”) for species identified in the TNBRC project [15]. Searches were limited to North America to avoid downloading information on species transplanted outside their historical range, and to retain focus on the project area. We removed inaccurate data points following standard data cleaning protocol [13] using the R-package “CoordinateClean”, which purged duplicated entries, imprecise points, or locations in unexpected areas (e.g., in the ocean). Cleaned observations were used to examine trends through time and to create habitat suitability models (described in Section 2.6). When examining temporal trends, we partitioned data from sources, such as museum or herbaria specimens (data source referred to as “Other”), from geotagged photographs largely derived from citizen science projects (data source referred to as “Digital”) and tested for observational change through time for both data sources using linear models. We examined rates of observations between these two groups to isolate abundance change patterns of focal species because application-based citizen science observations, generally, have increased in recent years, whereas other forms of observation, such as collecting herbarium specimens, are assumed to remain somewhat constant through time. Because observations varied dramatically among species, we relativized observations across species to express observations in a given year as the proportion of the maximum number of observations over a 1-year time period. To assess rarity, we also quantified observation numbers for each species through time, with the caveat that observation number and frequency should not be interpreted as a direct measure of abundance because these metrics conflate abundance and observability (i.e., tendency for focal taxa to occur near human populations, visibility, size, etc.). Low rates of occurrence, however, may serve to highlight species that warrant further investigation of ecological status.
2.6. Species Distribution Model (SDM) Comparison
Land managers at the USFS cited data quality as a barrier for incorporation of citizen science data in land management and ecological studies. For this reason, we wanted to compare habitat suitability projections for species distribution models (SDMs) built using citizen science data with those constructed from traditional survey data collected by professionals, to determine whether broad disparities existed in model projections between these two categories of data sources in our study area. To conduct this comparison, for the TNBRC focal species we selected Emory oak (Quercus emoryi Torr.) because location information for this species was available both from the GBIF repository, which curates principally citizen science data, and from the Forest Inventory and Analysis (FIA) data portal, which collects data on tree growth and survival on standardized plots established by the USFS. Notably, significant differences in data quality exist between these data sources. The FIA database provides presence and true absence data across plots randomly located within 24.28 km2 (6000-acre) hexagons, which grid the US. Alternatively, citizen science data are presence-only data (no true absences) and are spatially biased towards areas with high human traffic and access. In this comparison, sample sizes also differed; FIA sampled 3199 forested plots in Arizona, finding Emory oak at 384 sites, while GBIF included only 22 occurrences for the same area. While citizen science data quality will differ by species and region, spatial bias, lack of true absence data, and small sample size are perennial problems with these datasets. The existence of high quality, spatially extensive FIA data offered an opportunity to test for broad-scale differences in predictions generated by the two approaches. Such accuracy assessments are critical because for many species, particularly herbs and shrubs, citizen science data will be the only information available.
2.6.1. Dataset Construction
For models built using professionally collected data, we generated presence–absence data for each Phase 2 FIA plot, with presence indicating the occurrence of one or more Emory oak trees at a plot in the 2011–2019 time period. Phase 2 ground sampling plots consist of four 7.32 m fixed-radius subplots, which, with a buffer area around each, cover a 0.004 km2 (1-acre) sample area in total. In Arizona, FIA Phase 2 plot stand surveys are conducted on a 10-year rotation. Due to lag times in data posting, data presented here represent FIA surveys from 2011–2019. Lack of 2020 data, while decreasing sampling intensity relative to the complete decadal sample, does not introduce spatial bias because plots are surveyed in a random order. To model Emory oak habitat using citizen science data, we downloaded data from the GBIF data portal using the same protocols described in Section 2.5, though in this case, we included observations collected within the same time frame as the FIA to avoid model discrepancies caused by spatial distribution change over time in response to factors such as climate or land-use change. We also expanded the extent of the focal area beyond the national forests to improve model predictability. Within the US, Emory oaks occur most abundantly in Arizona, with scattered populations in southern New Mexico and western Texas. Here, we focused on Arizona data, in order to (1) represent the core region of Emory oak distribution within the United States, rather than outlying habitat, while focusing on the region encompassing participating national forests, (2) constrain the focal area to the US because FIA data are not collected globally, and (3) reduce cross-state heterogeneity in FIA data (i.e., census timing).
2.6.2. Model Construction
For both FIA and GBIF datasets, we built SDMs to predict current suitable habitat for Emory oak using R-package “SDM” [16] in R version 4.0.3 [15]. Predictor variables included 19 bioclimatic variables acquired from the WorldClim database (WorldClim. Available online: www.worldclim.org/current (accessed on 25 June 2021)) at a resolution of approx. 4.5 km (2.5-min of a longitude/latitude degree) [17]. Bioclimatic variables are derived from temperature and precipitation and summarized to maximize biological relevance by reflecting variation in climatic means, extremes, and seasonality. For final model structures, these 19 variables were culled by calculating the variance inflation factor (VIF), which estimates collinearity among predictor variables, and removing highly correlated variables (VIF > 10). Though we used the same model construction methodology, slight predictor variables were selected for FIA- and GBIF-derived datasets, reflecting inherent differences in these datasets that we wished to capture for comparison. For the FIA data-based model, we identified 7 bioclimatic variables, though only 5 of these were significant predictors in the GBIF model. Final bioclimatic predictors used in model parameterization for both models included the following: (1) mean diurnal range (mean of monthly (maximum temperature–minimum temperature)), (2) temperature seasonality (standard deviation*100), (3) mean temperature of wettest quarter, (4) precipitation of driest month, and (5) precipitation of coldest quarter. In addition to these variables, the FIA data-based model included: (1) mean temperature of the driest quarter and (2) precipitation seasonality (coefficient of variation). Because the GBIF dataset included presence-only occurrence data, we generated pseudo-absence data at a sampling density equivalent to FIA data.
We built SDMs implementing 6 modeling techniques, including 2 parametric, regression-based approaches, flexible discriminant analysis (FDA) and generalized linear modeling (GLM); 2 non-parametric regression-based techniques, multivariate adaptive regression splines (MARS) and generalized additive modeling (GAM); and 2 machine-learning approaches, random forest (RF) and boosted regression trees (BRT). Models were compiled into an ensemble model, weighting by the true skill statistic (TSS; described below). Model accuracy assessments were performed using training and test datasets created through iterative subsampling by bootstrapping and k-fold partitioning (k = 5; runs = 10). For each iteration, we calculated the area under curve (AUC) and the TSS to assess the predictive performance of this model [18]. For the AUC assessment, a receiver operating characteristic (ROC), which compares sensitivities (proportion of correctly predicted presences) to false positive rates (1—specificity, or the proportion of correctly predicted absences), was calculated across the range of possible thresholds for classifying model scores and the area under the curve (AUC) calculated to create a ROC curve. An AUC > 0.75 indicates a high performing model, with an AUC of 1 indicating perfect predictive power. The TSS similarly incorporates sensitivity and specificity comparing models against random, yielding values that range from −1 to +1, where +1 indicates perfect prediction and ≤0 indicates a model that performs no better than random. For each predictor variable, we calculated importance of that variable to model predictions using both a method that examines cross-validation among model runs when variables are excluded, and a permutation method that assesses correlation of the focal variable and projections when the focal variable is manipulated [16]. We compared FIA- and GBIF-based models by predicting occurrences using a threshold that maximized TSS across models, and subtracting the suitable habitat projected by the GBIF dataset from that predicted by the FIA dataset.
3. Results
3.1. Project Metrics
The Tribal Nations Botanical Research Collaborative (TNBRC), organized in late 2018, launched the project page on iNaturalist in Spring 2019. Roughly two years later, as of 16 March 2021, the project has curated 2030 observations of the 34 focal species. Seven hundred and nine individuals have contributed observations to the project, while 268 individuals confirmed species identifications to advance observations to research-grade status. Seventy-two individuals are core project members, receiving routine project communications and actively engaging in activities. Of the 2030 observations, 75.37% are research grade. Plug-and-play R-code, which only requires that users enter a species name, was created to provide up-to-date information on occurrence of traditional-use plants within the 4FRI project area. Code was customized to provide useful products for each primary stakeholder: (1) mapped locations for Tribal partners to facilitate harvests and (2) trends through time and (3) predicted suitable habitat for USFS land managers and ecological specialists (Figure 1).
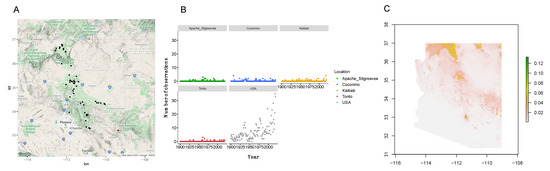
Figure 1.
Example data products generated using “plug-and-play” R-code for the Tribal Nations Botanical Research Collaborative focal species, Nicotiana attenuata, including (A) a map of locations to identify potential populations to harvest, (B) change in observations through time by participating forest and nationally, and (C) a habitat suitability model.
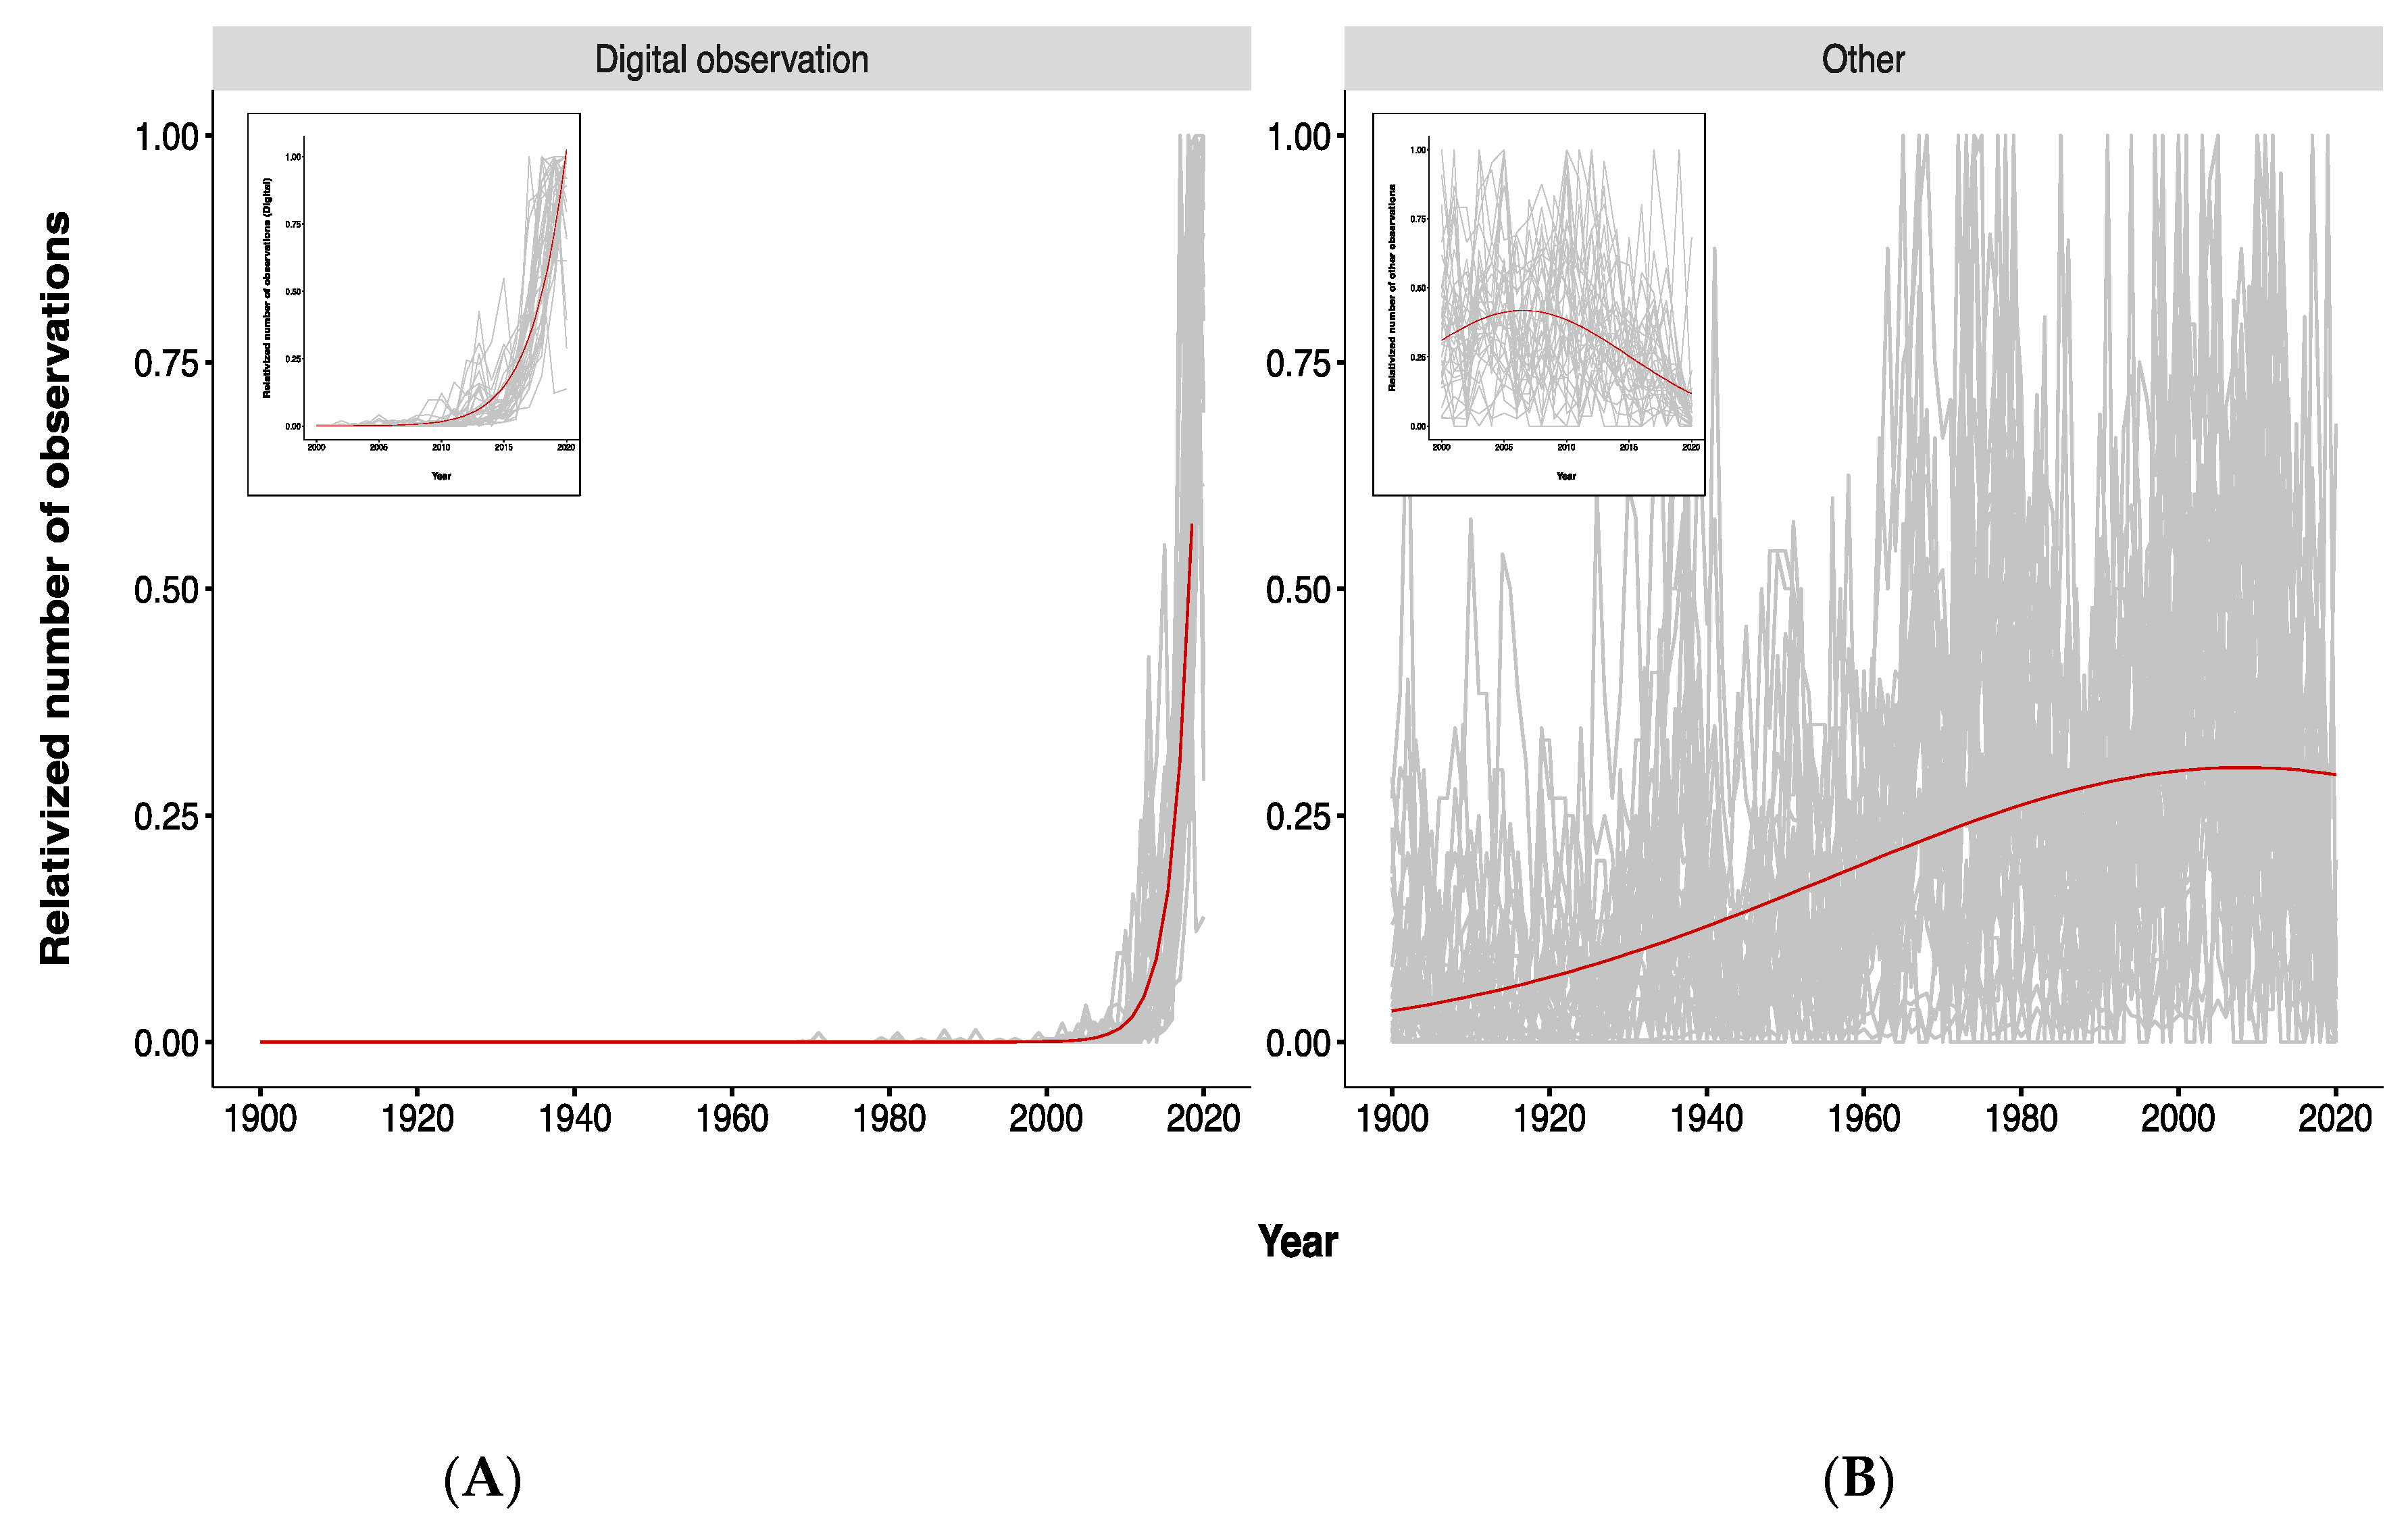
3.2. Trends in Observations through Time
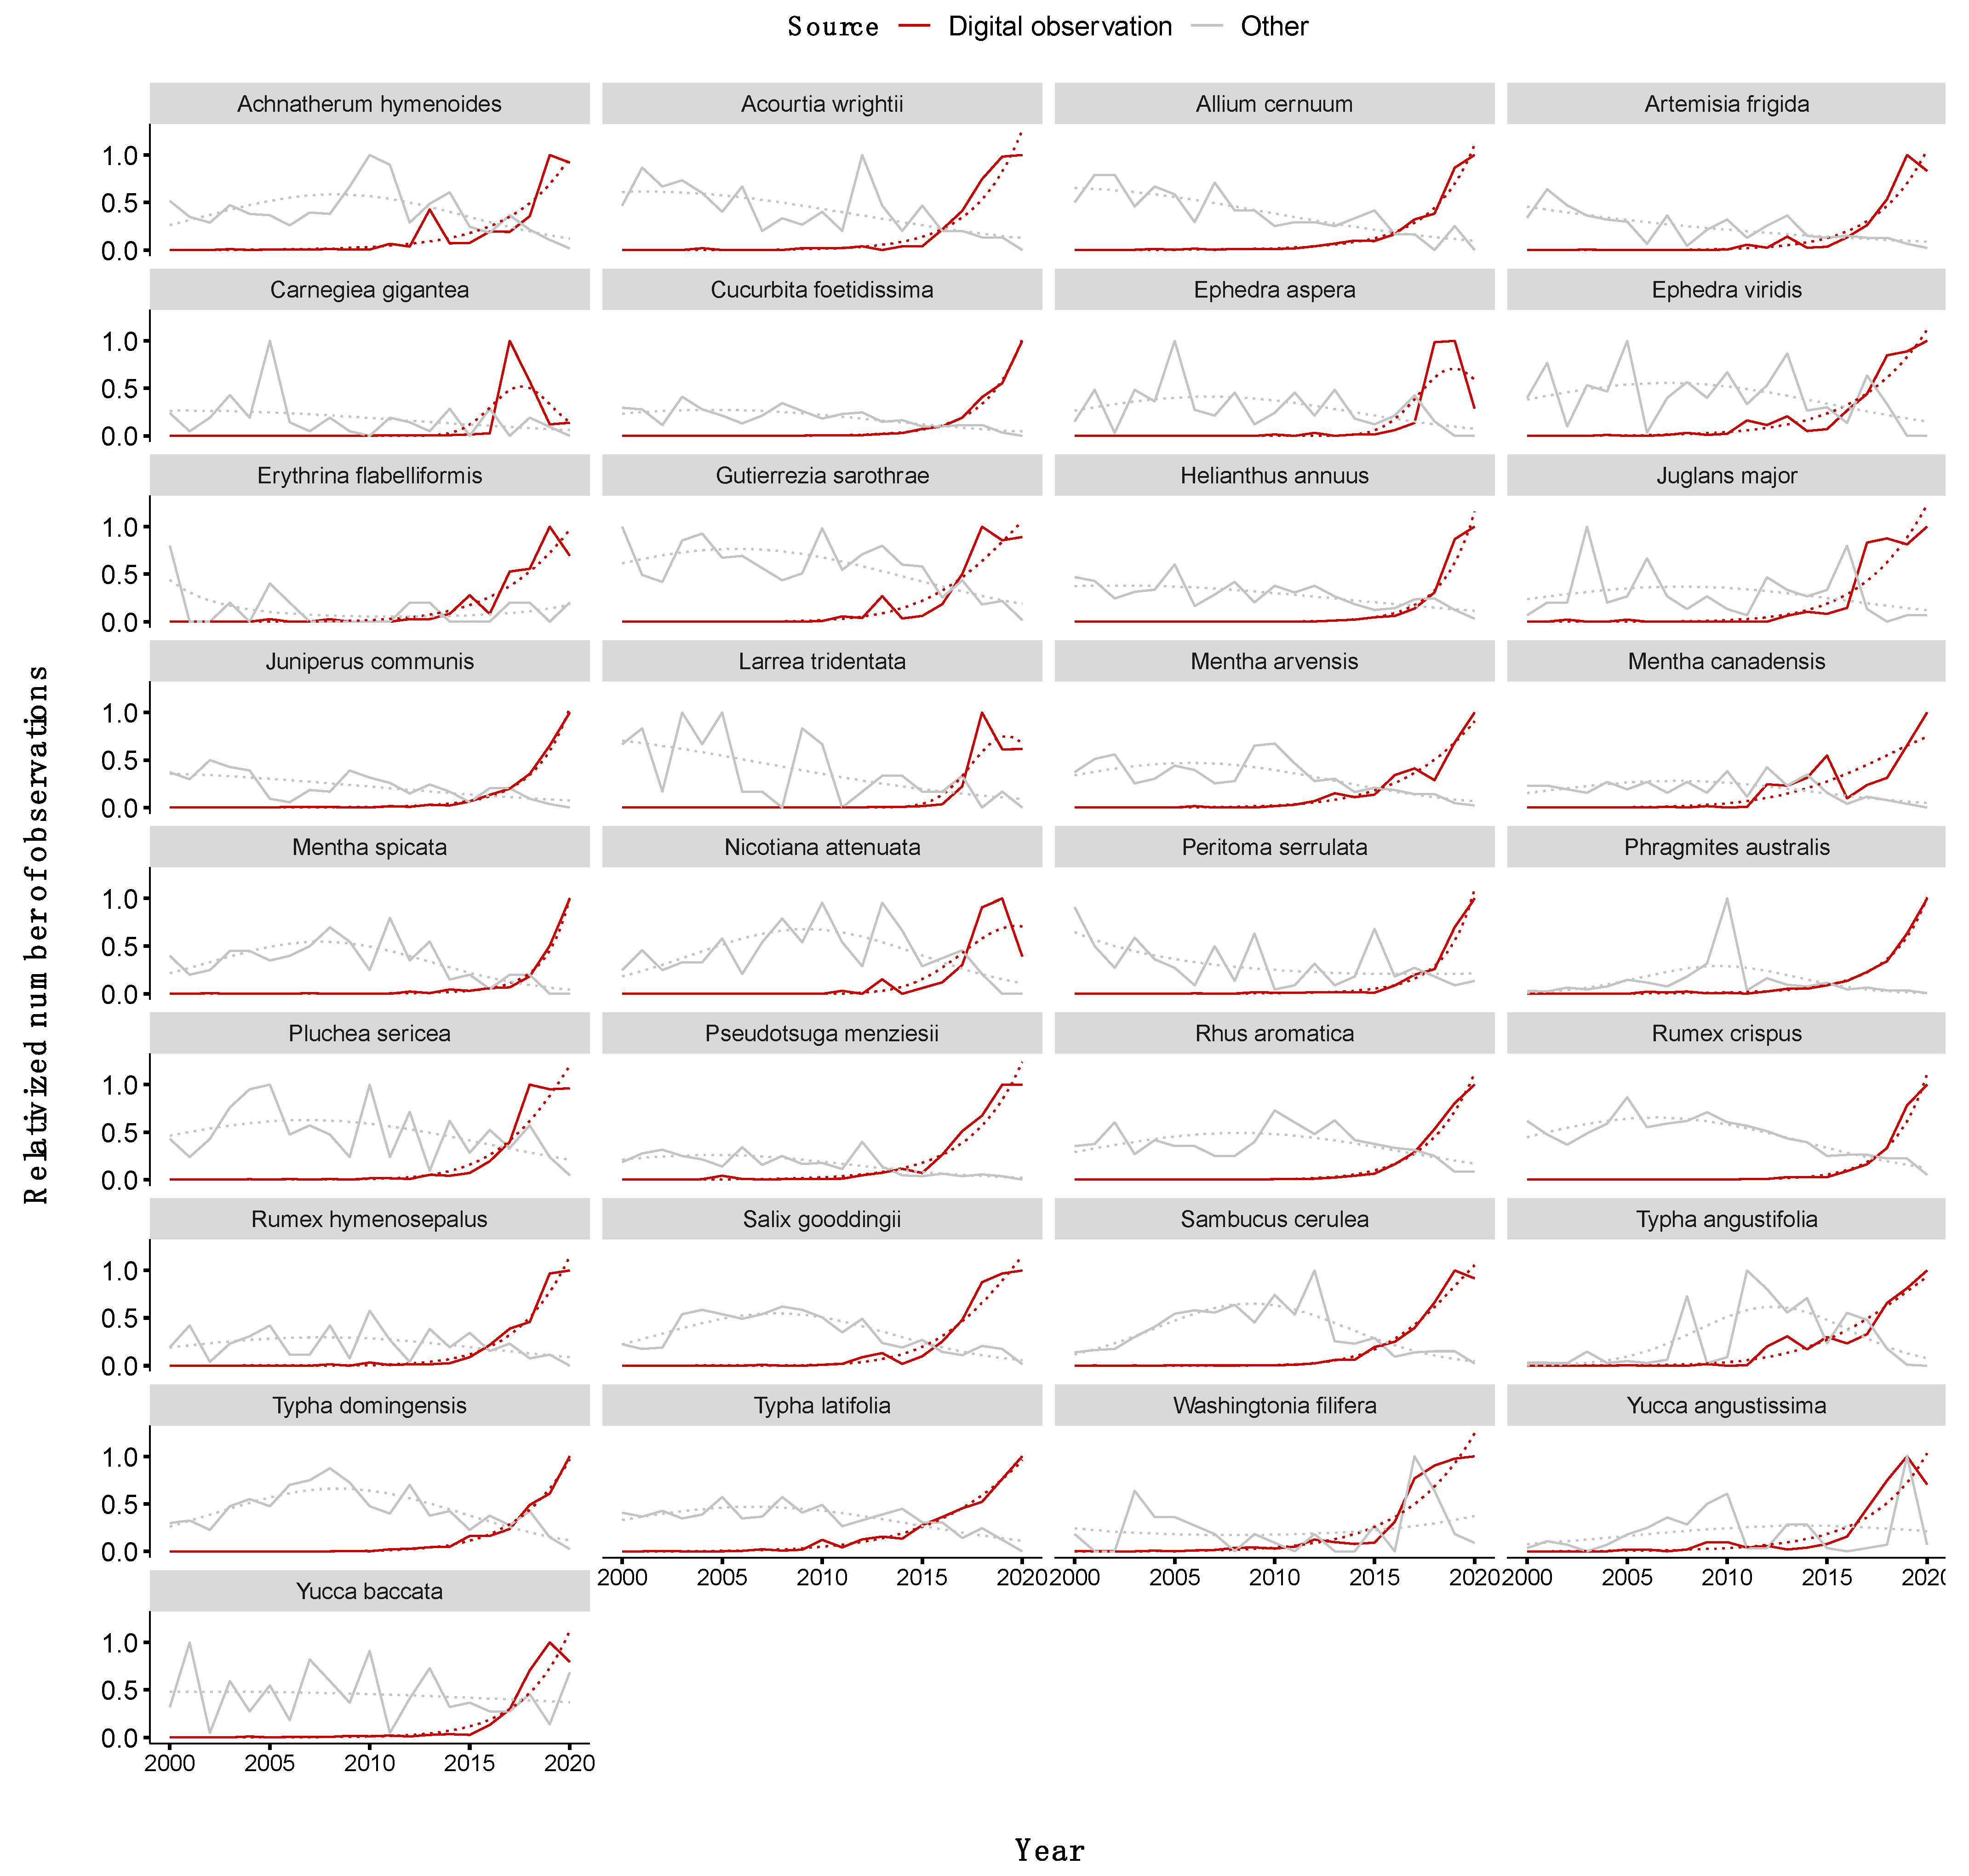
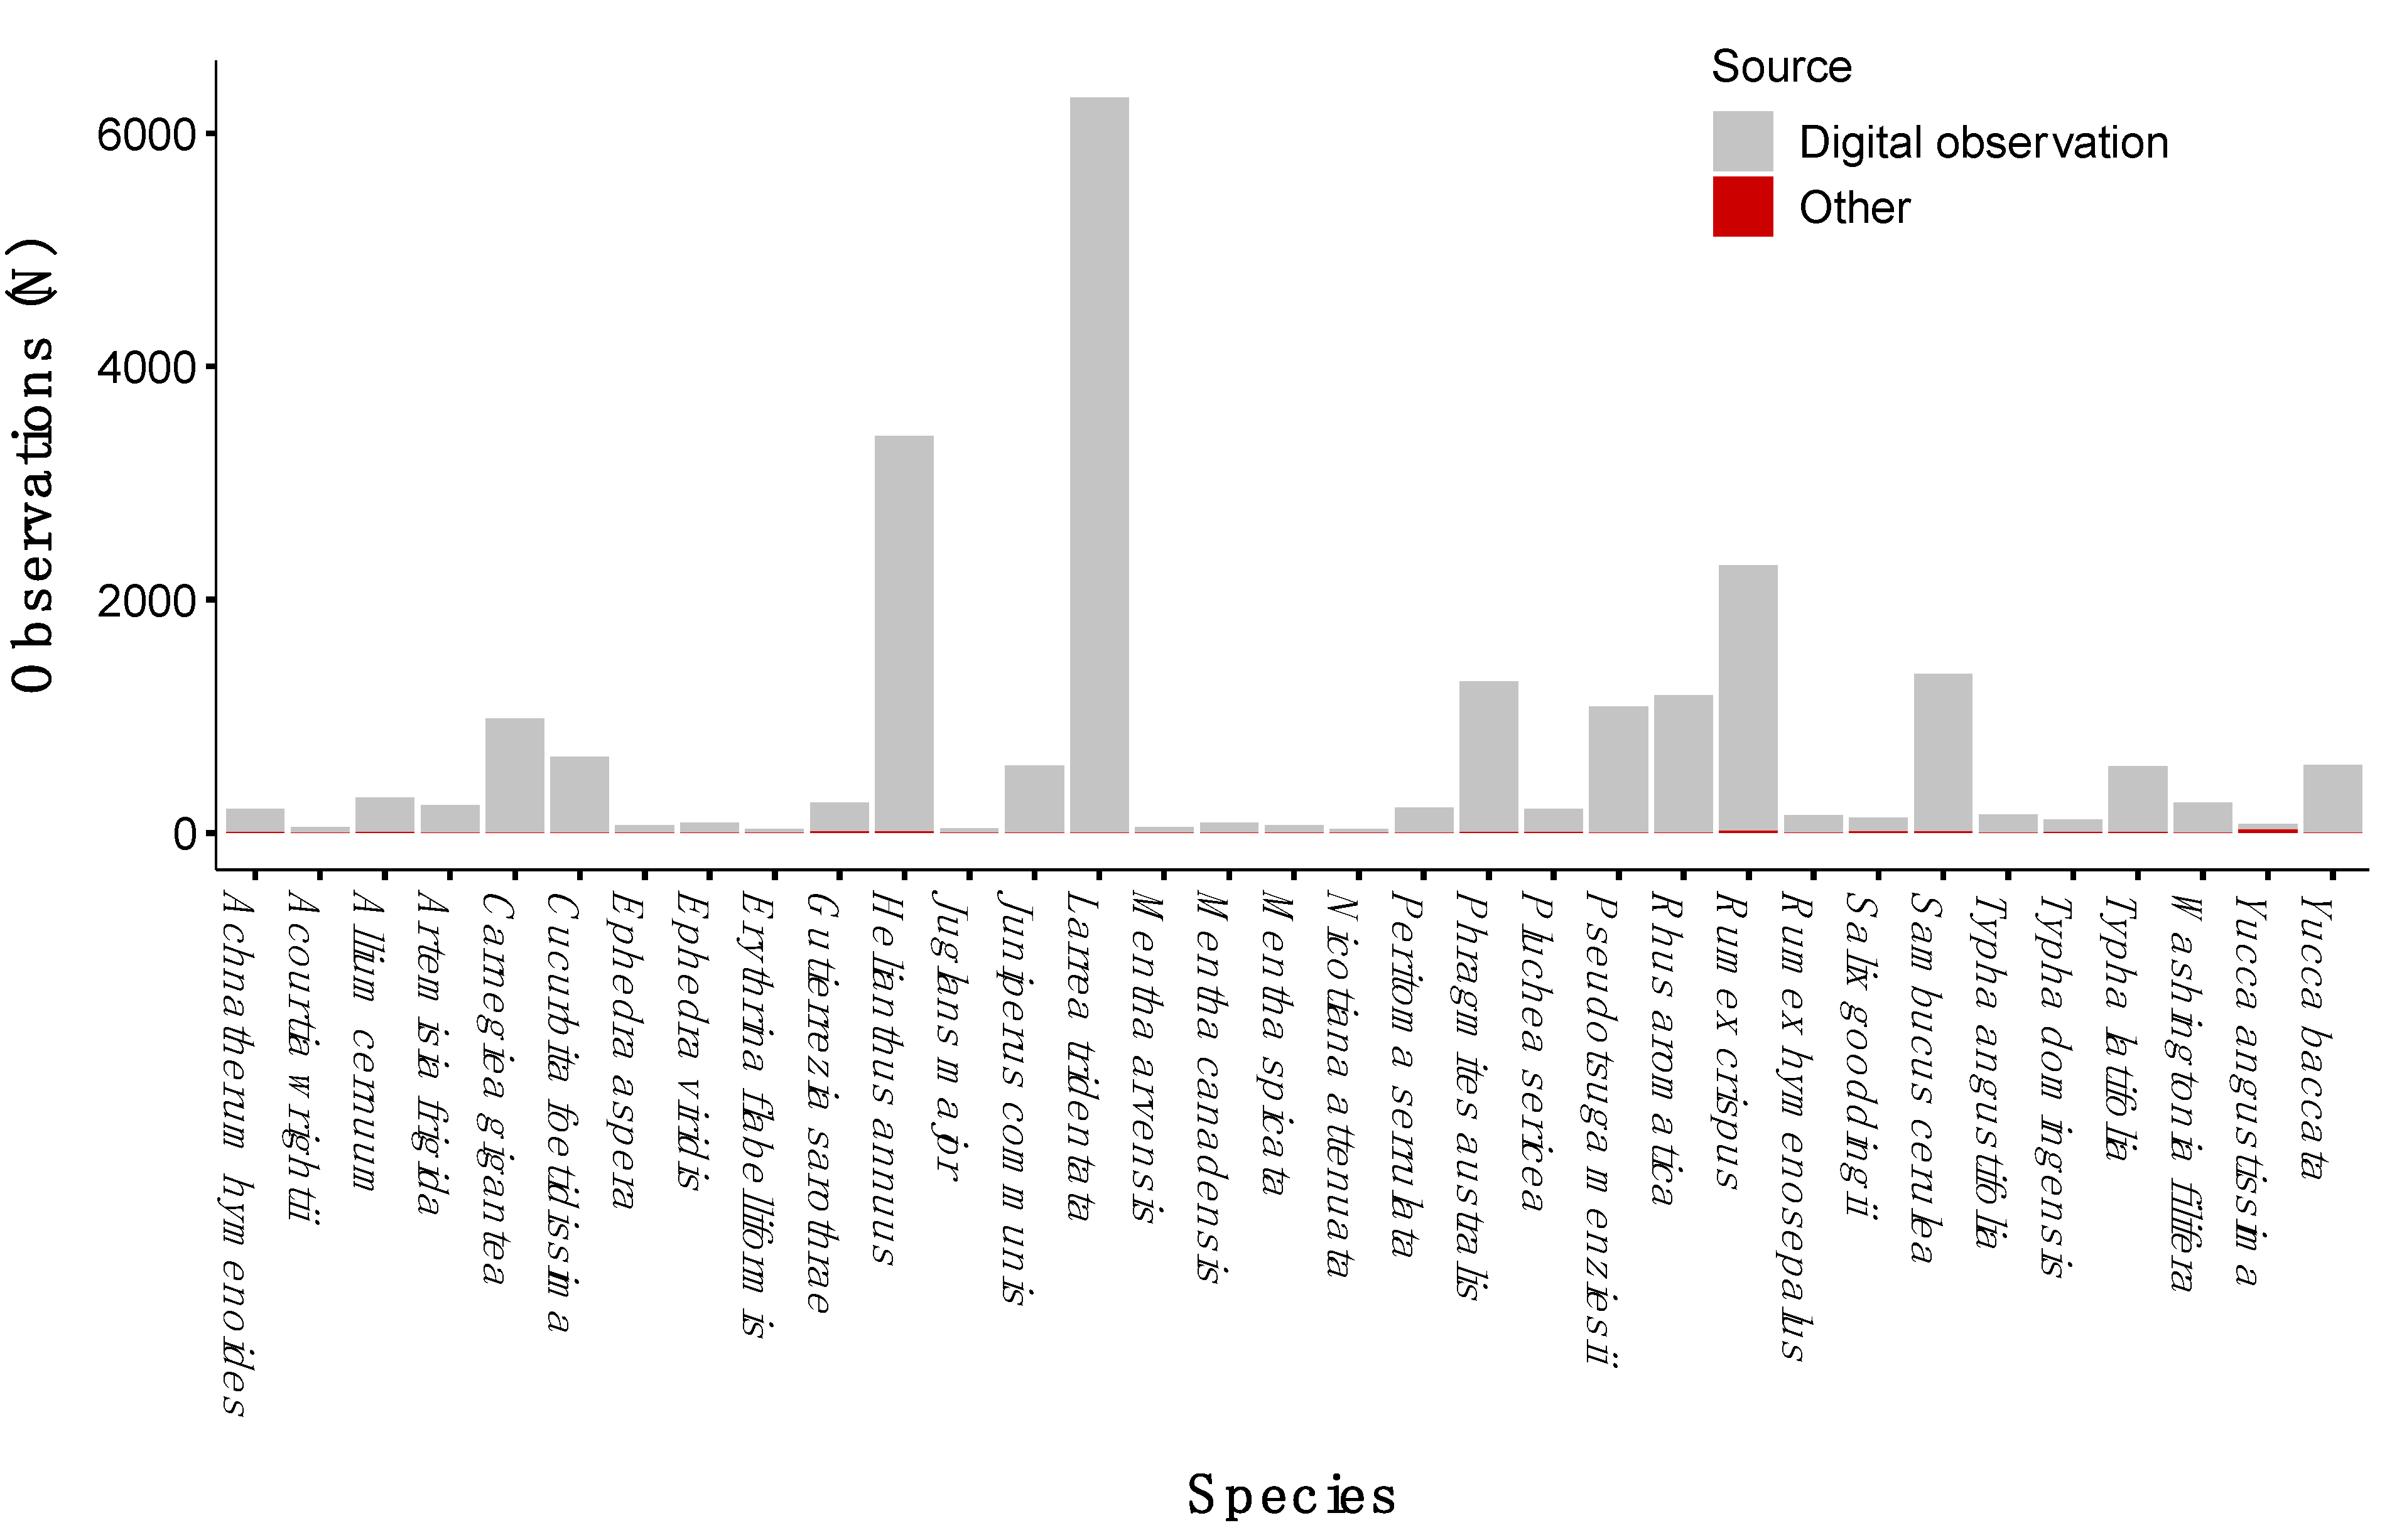
The GBIF repository appends the source of curated location information, allowing data from various sources to be partitioned (i.e., smart phone-based digital observations can be distinguished from herbaria specimens). Generally, observations from digital platforms, largely comprising application-based georeferenced photographs from citizen science projects, have increased through time (X2 = 544.72, p < 0.0001), particularly in the last 20 years (Figure 2), whereas observations from herbaria and other sources increased through time, but have declined in the last 20 years (Figure 2). The number of observations through time also differ among species (X2 = 130.66, p < 0.0001), Examining individual species trajectories within the last 20 years, most species followed the same general trend. Observations from sources such as herbaria declined in recent years, while digital observations increased (Figure 3). There were several exceptions, however. Saguaro cactus (Carnegiea gigantea (Engelm.) Britton & Rose), ephedra (Ephedra aspera Engelm. Ex S. Watson), and creosote bush (Larrea tridentata (DC.) Coville) declined in number of digital observations, particularly in 2020 (Figure 3). As another way to assess risk to focal species, we tallied observations in 2019 (prior to the COVID-19 pandemic) (Figure 4), and identified five species with 50 or fewer digital observations, including Acourtia wrightii (A. Gray) Reveal and King, Erythrina flabelliformis Kearney, Juglans major (Torr.) A. Heller, Mentha arvensis L., and Nicotiana attenuata Torr. ex. S. Watson.
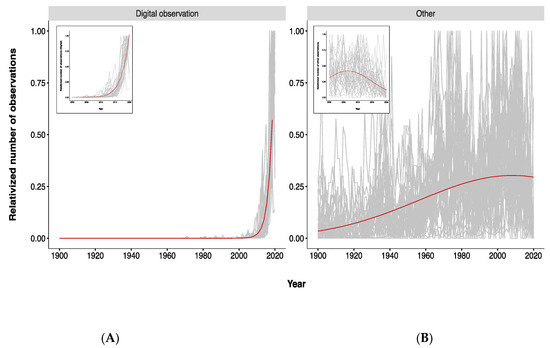
Figure 2.
Change in observations of Tribal Nations Botanical Research Collaborative focal species through time for digital observations (Panel A) and other forms of species observations (i.e., herbaria specimens; Panel B). For comparison across species, observations have been relativized to vary between 0 and 1. Gray lines trace observations for individual species through time, while red lines indicate overall trends. Insets show trends within the past 20 years for respective data sources.
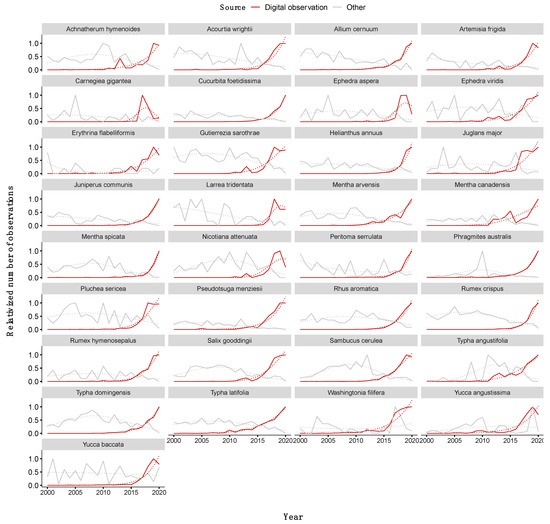
Figure 3.
Trajectories of TNBRC focal species through time for observations from digital sources (red) and other sources (gray). Trend lines for polynomial relationships of observation variation through time indicated by gray lines. While observational data are not a surrogate for actual abundance, these trends can be used to identify species of concern when a decline in observations is detected across data sources. For TNBRC focal species, three plants, Carnegiea gigantea, Ephedra aspera, and Larrea tridentata, showed downward trends the final year of this study.
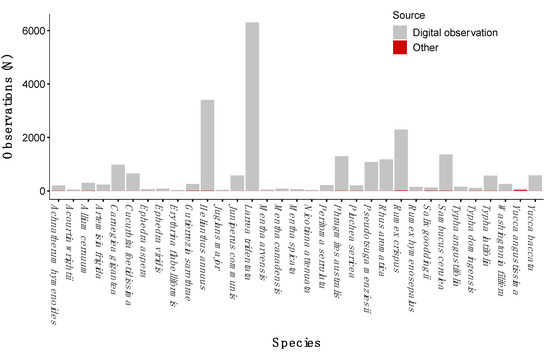
Figure 4.
Number of observations for each Tribal Nations Botanical Research Collaborative focal species in 2019. In all cases, digital observations (gray) exceeded observations from other sources (red), and were tallied to identify species with few observations.
3.3. Species Distribution Model Comparisons
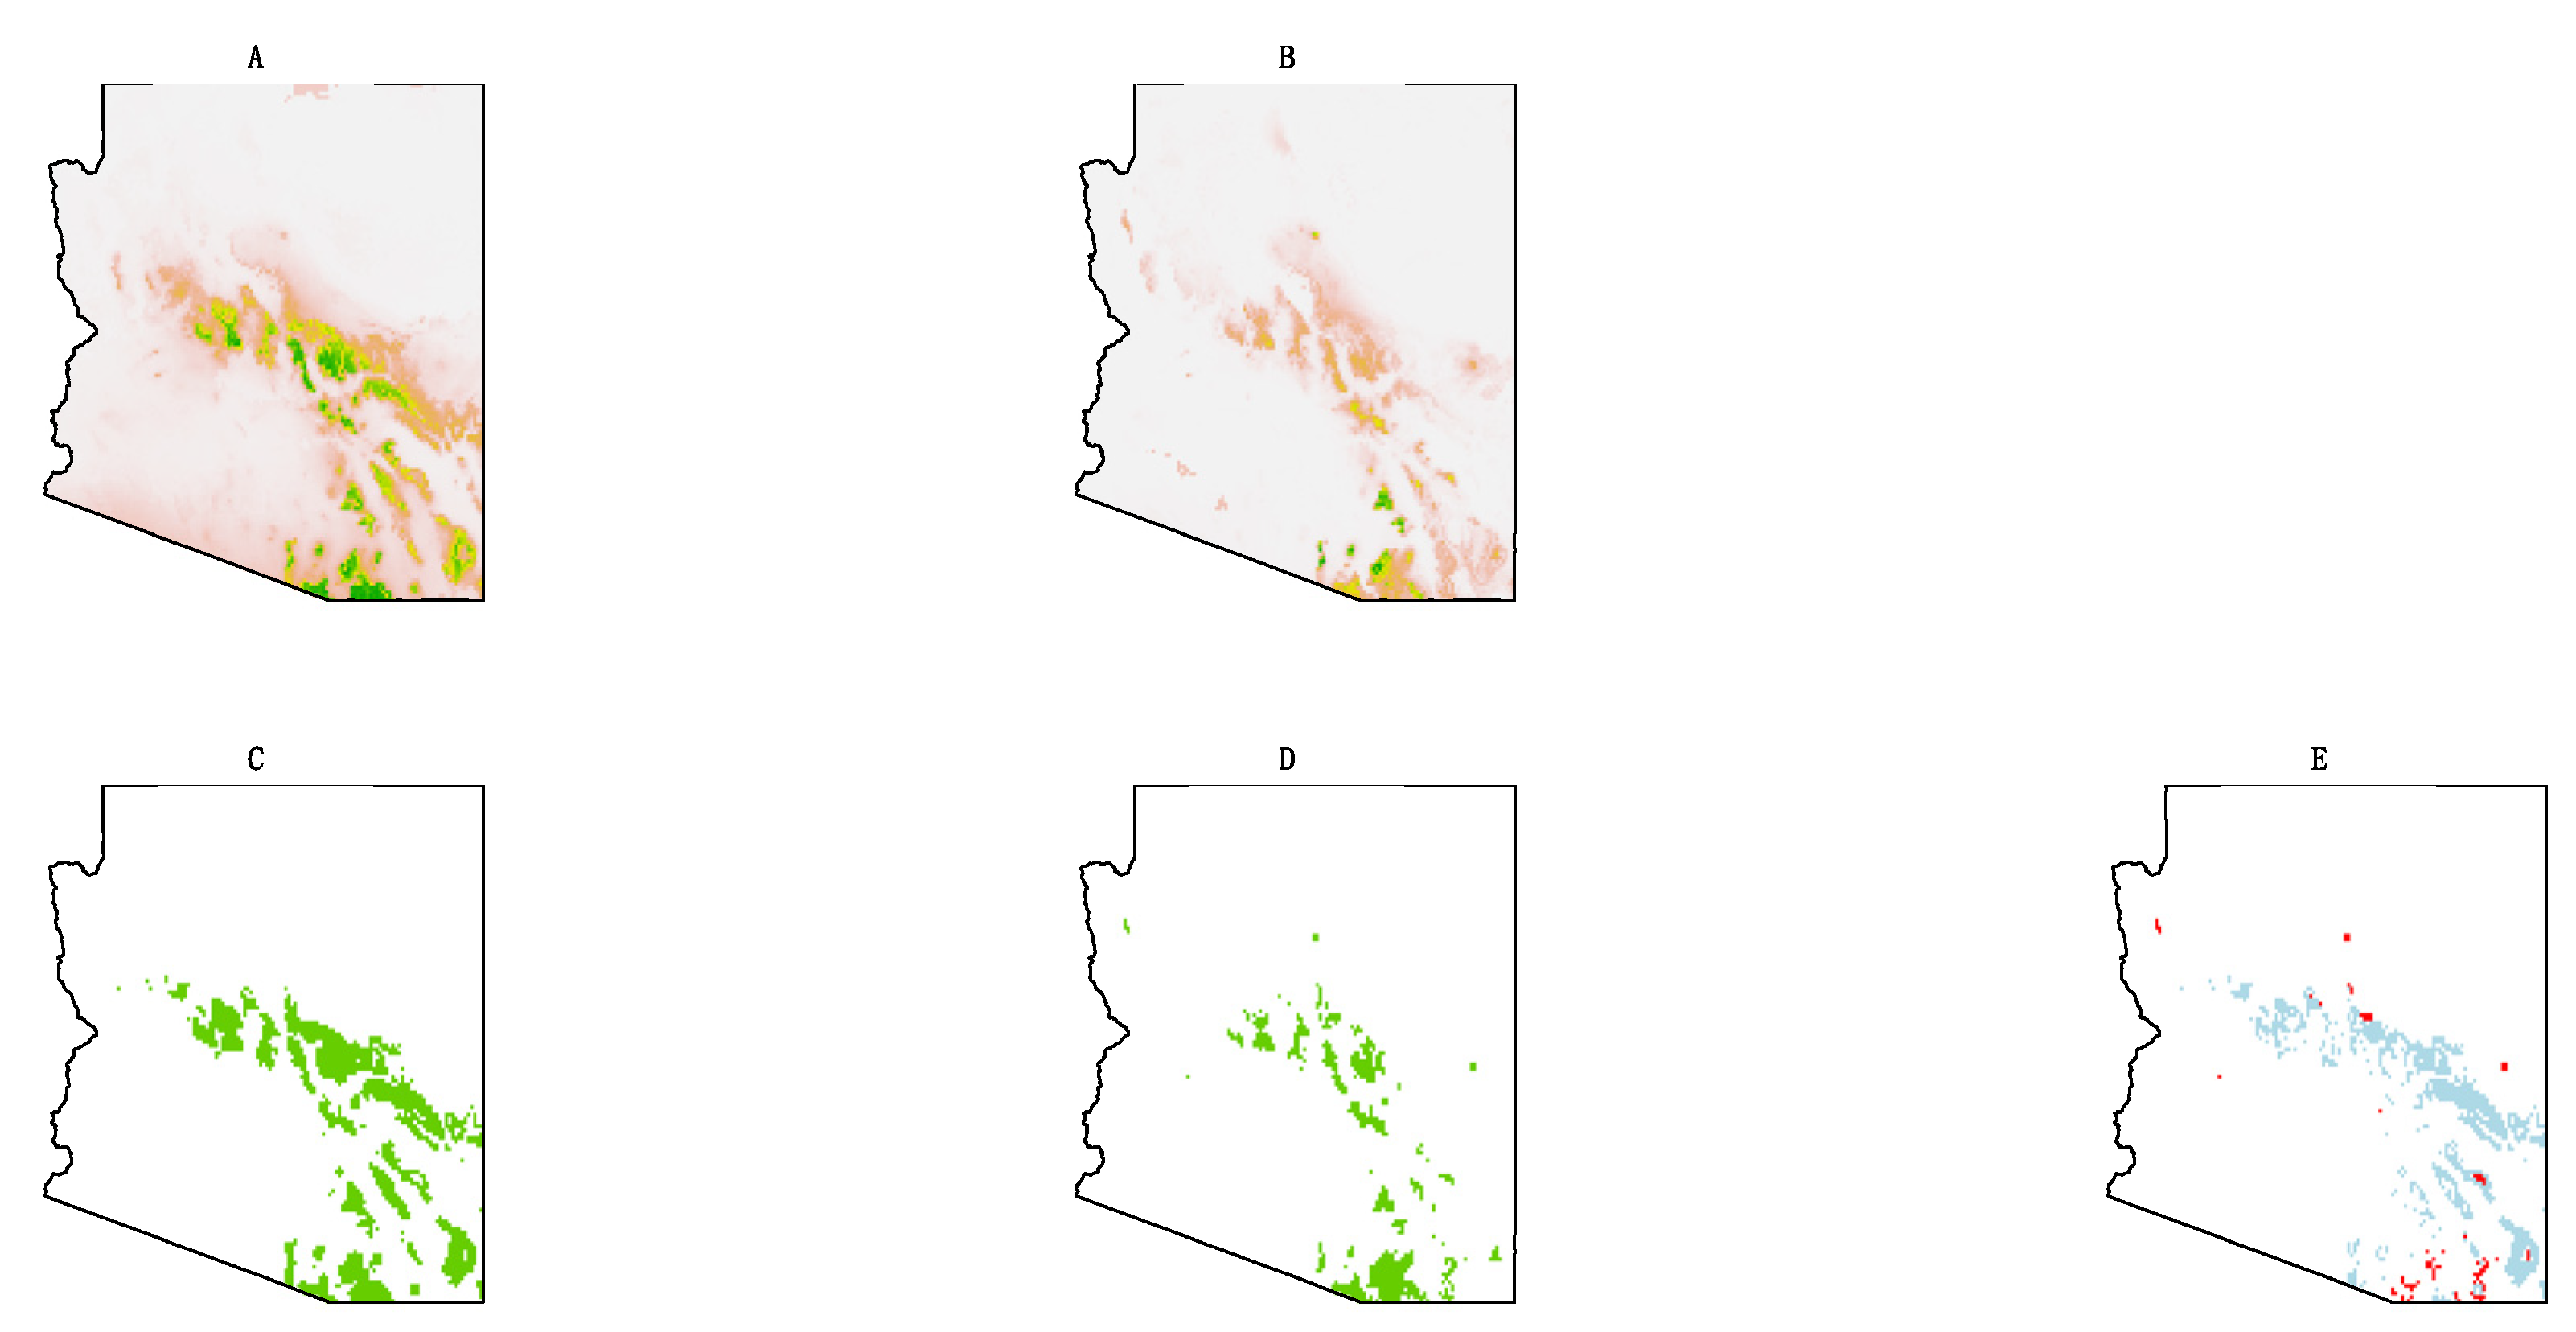
All modeling techniques, which included FDA, GLM, GAM, MARS, RF, and BRT, demonstrated a high level of predictive performance, regardless of data source (Table 2). Consistently across models, precipitation in the coldest quarter, a measure of winter precipitation, was the most important predictor of occurrence, explaining as much as 61.5% of the variation in Emory oak occurrence, depending on model technique (Table 3). Increase in winter precipitation was correlated within an increase in likelihood of Emory oak presence (Figures S5 and S6). Other important predictors for both models included, bio4, temperature seasonality, and bio14, precipitation of driest month, both of which were negatively correlated with occurrence (Figures S5 and S6). Initial removal of correlated variables resulted in the largest disparity in the two models; FIA data-based models included two additional predictor variables: bio9, mean temperature of driest quarter, and bio15, precipitation seasonality, the latter of which was a statistically significant predictor of Emory oak occurrence (Table 2). Current suitable habitat for Emory oak in Arizona is estimated to be 26,806 km2 or about 9% of the state by the FIA model, and 11,065 km2 or about 4% of the state by the GBIF model. When converted to a binary prediction (i.e., presence, absence), habitat suitability predicted by SDMs constructed with FIA and GBIF data agreed across 95% of the landscape. For 4.6% of the land area, FIA data predicted that Emory oak would occur, while GBIF data predicted an absence, whereas GBIF data over-predicted occurrence relative to FIA-based models by only 0.4% (Figure 5).
Table 2.
Model performance assessed by AUC and TSS for SDMs created from FIA and GBIF data for each modeling method that contributed to the ensemble model, including FDA, GLM, GAM, MARS, RF, and BRT.
Table 3.
Analysis of variable importance to predict habitat suitability of Emory oak for FIA and GBIF data-based models. Results of individual models that comprised the final ensemble model for each data type are presented. Asterisks beside the variable name indicate a statistically significant contribution to final predictive model. Relative importance of each variable is also estimated.

Figure 5.
Results of comparison of species distribution models (SDMs) for Emory oak built from (A) Forest Inventory and Analysis (FIA) data and (B) models built from predominantly citizen science data curated in the Global Biodiversity Information Facility (GBIF). Panels (C) and (D) indicate areas of predicted Emory oak occurrence for FIA and GBIF-based models, respectively. Panel (E) highlights areas of model disagreement, in which blue areas indicate pixels predicted as likely habitat by GBIF models, but not FIA models, while red areas indicate areas of likely habitat predicted by FIA models, but not GBIF models.
4. Discussion
4.1. Benefits of Citizen Science Data in Public Land Management: Tribal Nations Botanical Research Collaborative Case Study
Prior to European colonization, over 20 Native American Tribes lived in the territory now called Arizona. Now, over half of the land area of Arizona is Federal public land, with the US Forest Service managing the second largest area (approx. 15.4% of total land area), the Bureau of Land Management managing the largest land area (approx. 16.7%), and the Department of Defense (ca. 4.1%), National Park Service (approx. 3.6%), and Fish and Fish and Wildlife Service (approx. 2.3%) managing lesser extents. Remaining land is divided among Tribal Nations (ca. 27.2%), private holdings (approx. 17.8%), and State and Local Governments (approx. 12.7%) [19]. For many Tribes, culturally important wild-harvested plants occur off-reservation on federally managed lands, thus Federal entities have a responsibility to provide access to these plants and to sustainably manage these resources for future generations. This mandate aligns with two primary goals of the USFS 2015–2020 Strategic Plan, (1) “Sustain our nation’s forests and grasslands”, and (2) “Deliver benefits to the public”. Despite clear alignment with USFS goals, managing for traditional-use species is generally not supported financially, thus national forests necessarily focus management efforts on threatened and endangered species, which have strong legal protections and associated management mandates, and invasive species, which represent a risk to commodities such as timber or public experience. Thus, there was a need, both from a USFS and Tribal perspective, to monitor plants traditionally harvested by Tribal Nations, but little financial support to do so. Citizen science offered an ideal solution, allowing the USFS to collect landscape-level spatial information on traditional-use plants with little to no cost to the participating units. Citizen science delivers the additional benefit of encouraging cross-sectional participation in science. In the case of the TNBRC, the project provided a forum for Tribal Nation partners to steer land management and ecological research, and encouraged all community members to engage with public lands in a meaningful way. We have held a variety of events, including bioblitzes with Tribal members, virtual workshops, school events, and volunteer trainings, all of which incorporated educational and outreach components (Table 1). Such experiences provide difficult to measure benefits, which nonetheless contribute to project goals and success. As an example, TNBRC project managers led several trips with Tribal constituents, during which time Tribal members were informed of opportunities to harvest plants on national forests, with the objective of reducing obstacles to traditional harvests on public lands. By using a citizen science platform, the TNBRC addressed multiple goals, providing data to land managers on traditionally used plants, increasing awareness of the importance of protecting these species, educating the general public on conservation-related topics, and supporting Tribal engagement and access to these species. Citizen science provides a unique opportunity to tackle problems with biological and social components, such as the conservation of culturally important plants.
4.2. Citizen Science Data and Interpretation
As previously acknowledged, citizen science data conflates observations with actual species abundance, obfuscating interpretations of species trajectories through time. For the TNBRC focal species, we examined trends in observations from citizen science data, and identified several species with recent downward trends in both digital observations and herbaria collections, including saguaro cactus, ephedra, and creosote bush. In this case, recent downturns likely indicate a reduction in tourism due to travel restrictions resulting from the COVID-19 pandemic because all three species are large, common Sonoran Desert species likely overlooked by local citizen scientists and botanists, but of interest and highly visible to nature enthusiasts visiting from other regions. Because citizen science data from projects conflate observation and occurrence, observational trajectories alone are insufficient to identify actual population declines, and must be interpreted with caution. These data, however, could be used as an early warning sign of decline if patterns are sustained through time and there is agreement among multiple data types (i.e., herbaria collection rates and data from digital citizen science applications). By alerting forest botanists of potential species decline, citizen science can be used to isolate specific issues, creating a tractable target for investigations. On-line repositories for citizen science data, in combination with the flexibility of statistical freeware, such as the R statistical software platform, allow researchers to hone “plug-n-play” code to provide deliverables unique to participant and stakeholder needs in near-real time with minimal effort once code has been created. For instance, we developed code that generated maps to specific locations where focal plants have been located to provide to Tribal Members, graphed the trajectory of observations through time for participating national forests, and built SDMs for ecologists seeking to understand constraints on these species or identify new populations. To increase use of citizen science data in Federal land management, tutorials in data manipulation and interpretation could be developed for practitioners utilizing citizen science data. However, if this represents too great of a barrier for Federal land managers, partnerships with other institutions, such as universities, may be a more efficient pathway to utilizing citizen science data.
4.3. Reducing Statistical Bias of Citizen Science Data
Statistical methods for decoupling observation signals from abundance, such as including a metric of overall observation intensity (e.g., observations of a local common species or total observations across the overall search area) as a model covariate and/or comparatively analyzing trends from different data sources, can be applied to improve understanding of species trajectories through time. In this case, the GBIF database tracks data origin, allowing collection rates of museum and herbaria specimens, which in recent years have remained constant or declined, to be partitioned from smartphone-based observational rates (Figure 2). Analyzing across both data sources for agreement may highlight instances of actual abundance changes, which then can be further investigated (Figure 3). Other analytic approaches may offer more inferential power. For instance, a suite of statistical methods have been developed to calculate diversity statistics and address inherent challenges in calculating such metrics, given the high sensitivity of diversity parameters to sample size and completeness [20]. Thus, observational data may be summarized in diversity metrics and standardized by extrapolation using sample completeness, which estimates false absences based on the number of rare species within an assemblage, to allow comparisons across assemblages [21,22].
Similarly, habitat modeling and other forms of spatial modeling incorporate methodology to address observer bias in citizen science data. By employing techniques such as spatial thinning and exclusion of observations of low integrity or spatial resolution, bias and error in citizen science can be reduced, yielding useful data products [23,24]. Here, FIA data allowed us to compare predictions of citizen science data-driven habitat models against predictions of FIA data-driven models. Because FIA Phase II plots represent a random, spatially-extensive sample of both species presence and absence, models generated from FIA data should generate far more accurate predictions relative to citizen science-based models, which are inherently spatially biased toward areas of high human occupancy and access and may include fewer observations [25,26]. In this case, FIA data provided a far greater number of observations within the study area relative to GBIF; 384 Emory oak occurrence observations were generated by the FIA dataset, compared with only 22 for the GBIF repository. Despite this, occurrence predictions of the two models agreed 95% of the time, with GBIF underpredicting occurrence relative to FIA 4.6% of the time and over-predicting only 0.4%. Importantly, models agreed in the drivers of habitat occurrence, indicating that citizen science data may be used to understand basic ecological relationships determining species occurrence. High agreement between models suggests that use of citizen science data generates useful habitat suitability models, which could be used to locate additional populations of focal species or better understand basic environmental constraints on distribution. Indeed, other evaluations of citizen science datasets indicate a growing consensus that these projects provide useful, accurate data, which yield meaningful products when properly analyzed with the emerging statistical toolkit for citizen science data [4,26]. In this case, high agreement between FIA and GBIF-based models suggests that habitat suitability models may reasonably be built from GBIF data for the other TNBRC focal species, which are not represented in FIA datasets because they are either herbaceous or shrub species.
4.4. Best Practices: Adaptive and Participatory Project Planning
During project development, we identified key stakeholders that directed the structure, focus, and safety protocols for the TNCRC citizen science project, thus building a broad, engaged volunteer coalition. We held annual partnership meetings in which informal feedback was incorporated into project deliverables and activities. Additionally, we delivered regular training events with key volunteer demographics identified by project participants, which included Friends of the Forest groups, Tribal youth, and regional/local botanical societies. In March 2021, feedback was formally assessed in a series of surveys, delivered remotely using Google survey. Surveys were targeted to various audiences to assess project needs. For instance, surveys to Tribal members sought information on program satisfaction and solicited pathways to enhance participation in the TNBRC program. For USFS audiences, we asked questions to determine the best form of data delivery and appropriate methods of storing data (i.e., which USFS databases would be important repositories for data generated by this project). Feedback, which is still being collected, will be integrated into the 2021 project plan. Routinely soliciting and integrating feedback from project partners supports an engaged volunteer base. However, such adaptive management can be challenging when constrained by specific expectations from funders because programmatic activities and foci emerge organically in often unexpected ways.
4.5. Integrating Citizen Science into Federal Land Management
Despite an increase in citizen science programs on public lands, no formal structure yet exists to incorporate citizen science data into land management, or to integrate the mosaic of projects occurring nationwide. Portals such as citizenscience.gov offer excellent launching points to strategically construct a citizen science infrastructure. In conversations with land managers at the CFLRP Monitoring Community of Practice Monthly Meeting (2 September 2021), land managers were generally unaware of statistical tools to accommodate bias in citizen science data, or of the availability of data across their region. An educational campaign to increase awareness of availability of citizen science data to address particular management goals, such as tracking invasive species or monitoring Endangered Species Act (ESA) listed species, could enhance the accessibility of these resources for land managers. Moreover, the development of “plug-and-play” code targeting specific land management units’ needs and incorporating statistical methodology to reduce observer bias in citizen science data would promote active use in land management. Training could be provided to highlight successful uses of citizen science data and address how to analyze such data and interpret results. By partnering with research institutions, Federal citizen science programs could tie to larger, experimental explorations of ecological questions or longer-term datasets, which could be analyzed in a more comprehensive way. Additionally, the development of Federal repositories for citizen science data and analysis could help land managers connect to local resources. For the TNBRC, engaging in the next USFS strategic planning process may provide additional institutional support for management of traditional plants, a need that has been previously recognized by agency employees and researchers.
5. Conclusions: The Future of Citizen Science Use in Land Management
Citizen or community science programs have the potential to address complex socio-ecological problems in land management by integrating public guidance and participation in the scientific process, while collecting data at management-relevant scales. Here, we presented a case study in which citizen science was employed to respond to the request of Tribal partners to collect data on traditional-use plants on public lands. A citizen science platform allowed the TNBRC to address ecological, educational, and social goals simultaneously. We collected data for 34 species occurring across 9725.5 km2. In the case of herbaceous focal species and shrubs, there previously existed little or no baseline ecological data across most of the project area. We built an inclusive program, building upon the inherently democratic structure of citizen science, by incorporating participant feedback in order to represent Tribal Nations values and perspectives in land management. Simultaneously, citizen science encouraged participation by the wider public in collecting data and engaging with public lands at a deep level, while providing opportunities to learn basic botanical lessons and gain an understanding of the importance of conserving traditional-use plant resources for Tribal community members. Citizen science is no replacement for systematic Federal monitoring, or for scientific research, which, when properly designed, has greater statistical and inferential power to address certain ecological questions, as well as identify causal relationships and mechanisms for patterns observed in citizen science projects. Citizen science programs are, however, excellent launch points for inquiry, management, and engagement, providing surprisingly accurate ecological information when data are properly analyzed. Development of easy-to-use software and increased education could permit broad-scale adoption and use of citizen science data for public land management. This would represent a unique benefit to managers, as citizen science programs offer a tremendous opportunity to support multivariate missions of government and non-government organizations managing public common areas globally. The work presented here advances conservation in several critical ways. First, we demonstrated a pathway for democratizing ecological science and land management, specifically detailing a project aimed at increasing representation of indigenous voices in these fields. Secondly, we illustrated how citizen science, which is collected at broad spatial scales and in real-time, can be used to identify conservation concerns quickly. This informatic agility is increasingly important in a rapidly changing environment and could be leveraged to implement timely management intervention to protect biodiversity. Finally, we addressed one of the key arguments levied to dismiss citizen science data in conservation planning—that citizen science data quality is too low to permit use in science and management. We demonstrated that analyses of citizen science data, if correctly interpreted, can be appropriately employed to address a variety of ecological questions. Taken together, these lessons inform the development of citizen science programs to promote a more inclusive and nimble system for managing public lands.
Supplementary Materials
The following are available online at https://www.mdpi.com/article/10.3390/d13070293/s1, Figure S1: ROC curves for various modeling techniques and subsampling methodology for FIA-based models, Figure S2: ROC curves for various modeling techniques and subsampling methodology for GBIF-based models. Figure S3: Importance of environmental predictors of Emory oak habitat in SDMs built from FIA data. Figure S4: Importance of environmental predictors of Emory oak habitat in SDMs built from GBIF data. Figure S5: Relationships between Emory oak presence and bioclimatic variables for FIA-based models. Figure S6: Relationships between Emory oak presence and bioclimatic variables for GBIF-based models. Table S1: Tribal Nations Botanical Research Collaborative Species List. Table S2: Codes for bioclimatic variables.
Author Contributions
Conceptualization, S.S., V.R. and N.L.; methodology, S.S., V.R. and N.L.; formal analysis, S.S.; investigation, S.S., V.R. and N.L.; resources, N.L.; data curation, S.S.; writing—original draft preparation, S.S.; writing—review and editing, V.R. and N.L.; visualization, S.S.; supervision, S.S., V.R. and N.L.; project administration, N.L.; funding acquisition, S.S. and N.L. All authors have read and agreed to the published version of the manuscript.
Funding
This research was funded by U.S. Forest Service Citizen Science Competitive Funding Program, agreement number 16-CS-11030420-026 and 20-CS-11030400-137.
Institutional Review Board Statement
Not applicable.
Informed Consent Statement
Not applicable.
Data Availability Statement
All data are available on the Global Biodiversity Information Facility.
Acknowledgments
We thank all Tribal Nations Botanical Research Collaborative project members for their participation, enthusiasm and insights, leadership of the participating National Forests (Coconino, Tonto, Apache-Sitgreaves, and Kaibab) for their continued support of this project, and Mark Christiano for iNaturalist technical assistance.
Conflicts of Interest
The authors declare no conflict of interest.
References
- Adler, F.R.; Green, A.M.; Sekercioglu, C.H. Citizen science in ecology: A place for humans in nature. Ann. N. Y. Acad. Sci. 2020, 1–13. [Google Scholar] [CrossRef] [PubMed]
- Silvertown, J. A new dawn for citizen science. Trends Ecol. Evol. 2009, 24, 467–471. [Google Scholar] [CrossRef]
- Silver, L. Pew Research Center Report; Pew Research Center: Washington, DC, USA, 2019; pp. 1–47. [Google Scholar]
- Brown, E.D.; Williams, B.K. The potential for citizen science to produce reliable and useful information in ecology. Conserv. Biol. 2019, 33, 561–569. [Google Scholar] [CrossRef] [Green Version]
- Conrad, C.C.; Hilchey, K.G. A review of citizen science and community-based environmental monitoring: Issues and opportunities. Environ. Monit. Assess 2011, 176, 273–291. [Google Scholar] [CrossRef]
- Jarvis, R.M.; Breen, B.B.; Krägeloh, C.U.; Billington, D.R. Citizen science and the power of public participation in marine spatial planning. Mar. Policy 2015, 57, 21–26. [Google Scholar] [CrossRef]
- Lepczyk, C.A. Integrating published data and citizen science to describe bird diversity across a landscape. J. Appl. Ecol. 2005, 42, 672–677. [Google Scholar] [CrossRef]
- Bonney, R.; Phillips, T.B.; Ballard, H.L.; Enck, J.W. Can citizen science enhance public understanding of science? Public Underst. Sci. 2016, 25, 2–16. [Google Scholar] [CrossRef] [PubMed]
- Dickinson, J.L.; Shirk, J.; Bonter, D.; Bonney, R.; Crain, R.L.; Martin, J.; Phillips, T.; Purcell, K. The current state of citizen science as a tool for ecological research and public engagement. Front. Ecol. Environ. 2012, 10, 291–297. [Google Scholar] [CrossRef] [Green Version]
- Bela, G.; Peltola, T.; Young, J.C.; Balázs, B.; Arpin, I.; Pataki, G.; Hauck, J.; Kelemen, E.; Kopperoinen, L.; Van Herzele, A.; et al. Learning and the transformative potential of citizen science. Conserv. Biol. 2016, 30, 990–999. [Google Scholar] [CrossRef] [Green Version]
- Gathering of Certain Plants or Plant Parts by Federally Recognized Indian Tribes for Traditional Purposes. Federal Regist. 2016, 81, 45024–45039.
- Maldonado, C.; Molina, C.I.; Zizka, A.; Persson, C.; Taylor, C.M.; Albán, J.; Chilquillo, E.; Rønsted, N.; Antonelli, A. Estimating species diversity and distribution in the era of Big Data: To what extent can we trust public databases? Glob. Ecol. Biogeogr. 2015, 24, 973–984. [Google Scholar] [CrossRef] [Green Version]
- Yesson, C.; Brewer, P.W.; Sutton, T.; Caithness, N.; Pahwa, J.S.; Burgess, M.; Gray, W.A.; White, R.J.; Jones, A.C.; Bisby, F.A.; et al. How global is the global biodiversity information facility? PLoS ONE 2007, 2, e1124. [Google Scholar] [CrossRef]
- The Global Biodiversity Information Facility (GBIF): Ingenta Connect. Available online: https://www.ingentaconnect.com/content/rout/2dq26u/2007/00000001/00000001/art00002 (accessed on 27 January 2020).
- R Core Team. R: A Language and Environment for Statistical Computing; R Foundation for Statistical Computing: Vienna, Austria, 2020. [Google Scholar]
- Naimi, B.; Araújo, M.B. Sdm: A reproducible and extensible R platform for species distribution modelling. Ecography 2016, 39, 368–375. [Google Scholar] [CrossRef] [Green Version]
- Hijmans, R.J.; Cameron, S.E.; Parra, J.L.; Jones, P.G.; Jarvis, A. Very high resolution interpolated climate surfaces for global land areas. Int. J. Climatol. 2005, 25, 1965–1978. [Google Scholar] [CrossRef]
- Allouche, O.; Tsoar, A.; Kadmon, R. Assessing the accuracy of species distribution models: Prevalence, kappa and the true skill statistic (TSS). J. Appl. Ecol. 2006, 43, 1223–1232. [Google Scholar] [CrossRef]
- Federal Land Ownership: Overview and Data 2020; Congressional Research Service: Washington, DC, USA, 2020; pp. 1–24.
- Chao, A.; Jost, L. Coverage-based rarefaction and extrapolation: Standardizing samples by completeness rather than size. Ecology 2012, 93, 2533–2547. [Google Scholar] [CrossRef] [PubMed]
- Chao, A.; Gotelli, N.J.; Hsieh, T.C.; Sander, E.L.; Ma, K.H.; Colwell, R.K.; Ellison, A.M. Rarefaction and extrapolation with Hill numbers: A framework for sampling and estimation in species diversity studies. Ecol. Monogr. 2014, 84, 45–67. [Google Scholar] [CrossRef] [Green Version]
- Dornelas, M.; Magurran, A.E.; Buckland, S.T.; Chao, A.; Chazdon, R.L.; Colwell, R.K.; Curtis, T.; Gaston, K.J.; Gotelli, N.J.; Kosnik, M.A.; et al. Quantifying temporal change in biodiversity: Challenges and opportunities. Proc. Biol. Sci. 2013, 280, 20121931. [Google Scholar] [CrossRef] [Green Version]
- Phillips, S.J.; Dudik, M.; Elith, J.; Graham, C.H.; Leathwick, J.; Ferrier, S.; Applications, S.E.; Jan, N.; Phillips, J.; Leathwick, J.; et al. Sample Selection Bias and Presence-Only Distribution Models: Implications for Background and Pseudo-Absence Data. Ecol. Appl. 2009, 19, 181–197. [Google Scholar] [CrossRef] [Green Version]
- Beck, J.; Böller, M.; Erhardt, A.; Schwanghart, W. Spatial bias in the GBIF database and its effect on modeling species’ geographic distributions. Ecol. Inform. 2014, 19, 10–15. [Google Scholar] [CrossRef]
- Johnston, A.; Moran, N.; Musgrove, A.; Fink, D.; Baillie, S.R. Estimating species distributions from spatially biased citizen science data. Ecol. Model. 2020, 422, 108927. [Google Scholar] [CrossRef]
- Kosmala, M.; Wiggins, A.; Swanson, A.; Simmons, B. Assessing data quality in citizen science. Front. Ecol. Environ. 2016, 14, 551–560. [Google Scholar] [CrossRef] [Green Version]

Publisher’s Note: MDPI stays neutral with regard to jurisdictional claims in published maps and institutional affiliations. |
© 2021 by the authors. Licensee MDPI, Basel, Switzerland. This article is an open access article distributed under the terms and conditions of the Creative Commons Attribution (CC BY) license (https://creativecommons.org/licenses/by/4.0/).