Abstract
Roads have impacts on the fauna arising from habitat fragmentation, roadkill and the barrier effect. Furthermore, roads lead species to change their activity with repercussions on predator–prey interactions and trigger indirect effects that are currently unknown. This study analyzes the effect of a motorway on the trophic behavior of the terrestrial carnivore community of its surroundings. Monthly scat sampling was conducted over a year at three distances from a motorway (0–50 m, 500–550 m and 1000–1050 m). We collected 498 scats, these originating from red fox (39.16%), cat (24.50%), stone marten (24.09%) and badger (12.25%). The relative abundance of the trophic resources in them was estimated together with the trophic diversity and niche overlap of the carnivore species. The results showed a distinct effect of distance from the road on trophic behavior of carnivores, as well as differences between species and seasons. The scats nearest the road had 10–20% more biomass of small mammals, equivalent in relative terms to a 21–48% increase in small mammals’ biomass when compared with scats collected further from the road. This finding indicates changes in predator–prey interactions near the road and shows that the human-generated structural and functional changes to ecosystems spread throughout trophic networks.
1. Introduction
Roads represent a massive environmental perturbation worldwide, having a global extent of over 64 million kilometers [1,2]. Although about 80% of the Earth’s terrestrial surface remains roadless, the terrain has been fragmented into some 600,000 fragments, over half of which are smaller than one square kilometer [3]. The spatial impact of roads continues to grow, and their global extent is projected to increase by over 60% from 2010 to 2050 [4]. By 2050, an estimated 25 million additional kilometers of new roads will affect regions that currently sustain exceptional biodiversity and offer vital ecosystem services [5]. The impact of this “giant embracing us”, as so termed by Forman [6], is not restricted to the surface that the infrastructures physically occupy but instead may extend for hundreds of meters to either side (see definition of “road effect zone” [7]). Hence, the area affected ecologically covers a high percentage of the total surface in many regions [8,9]. For example, half of the nonurbanized European territory lies less than 1.5 km from the nearest road or railway line, and a quarter is less than 500 m away. In Spain, 99% of the territory is less than 10 km from a road, railway line or similar infrastructure [9].
The scientific community has made a great effort over recent decades to identify and analyze the effects of transport infrastructures on the biotic and abiotic components of the ecosystems that they traverse (see reviews in [10,11,12]). Road–wildlife interactions are one of the most studied aspects, not only because of their impact on biodiversity [9,13] but also because of the risks to users and the significant economic costs [14]. Most studies have focused on the direct negative effects of transport infrastructures (such as roadkill, habitat degradation and fragmentation), while the indirect effects that may cascade through the faunal community remain largely unknown. Regarding the latter, an important aspect is the change that roads bring about in the use of territories, species behavior and interspecific interactions.
Recent studies have shown how activity patterns close to roads are altered in different ways among vertebrate species and functional groups [13,15]. Predator and prey species respond to roads by changing their activity and abundance patterns [15,16] and altering their predatory behavior or antipredatory responses [17,18]. The structure and dynamics of prey species, such as small mammals and lagomorphs, have been shown to change in the presence of a road [19,20,21], with likely repercussions on the activity patterns, territory use and behavior of their predators. Indeed, it has also been shown that the activity patterns of Mediterranean carnivores are similarly modified by road presence [13,21,22], resulting perhaps from changes in trophic resources caused by the road, from attraction to roadkill [23] or from changes in the intensity of local interspecific interactions, such as competition or intraguild predation [16].
Understanding changes in vertebrate trophic webs is especially relevant to unravel unexpected consequences of human infrastructures, such as possible changes in predation levels near roads [24,25] and their repercussions on ecosystem structure and dynamics. There are indications that some of the negative effects of roads may derive from the trophic behavior of different species and the predator–prey interactions that arise. For example, some studies have shown a relationship between diet type and the probability of becoming roadkill [26,27] and how for some carnivores being killed on roads is associated with prey availability in their vicinity [28,29]. In turn, predator–prey interactions may determine the use and effectiveness of the wildlife passages that are the most frequent mitigation measure employed at roads [30,31,32].
The present study is the first to analyze the diet of the mammalian predator guild in the vicinity of a road, in a case of a guild dominated by generalist species. Diet analyses are a useful tool for this purpose because they can reveal the use of trophic resources by different species and the trophic interactions between them. They also allow trophic availability and resource distribution in space and time to be analyzed [33]. Given that within our study area small mammals have been shown to be more abundant near the road [21] and that local carnivore activity is also altered [34], our starting hypothesis was that distance from the road will have a significant effect on carnivore trophic behavior. Specifically, we expected that the local carnivore diet close to the road would be enriched in small mammals, reflecting the functional responses derived from the changes in predator and prey density and activity.
2. Materials and Methods
2.1. Study Area
The study took place along a 5 km stretch (UTM 30 T 373259 4510571 to 30 T 368053 4507625) of the four-lane AP-51 motorway in Ávila province, central Spain (Figure S1). The traffic volume here averages 8396 vehicles per day. The chosen stretch crosses a well-preserved landscape dominated by Iberian holm oak (Quercus ilex subsp. ballota) woodlands (c. 40% cover) and expanses of Mediterranean scrub chiefly of giant feather grass Stipa gigantea Lag., gum cistus Cistus ladanifer L. and holm oak regrowth (40%), mixed with nonintensive holm oak grazing woodlands (dehesas; 10%) and cereal crops (10%). The local climate is Mediterranean, with a three-month summer drought period, a mean annual temperature of 10 °C and mean annual precipitation of 364 mm. The topography is relatively level, ranging in elevation between 1050 and 1250 m.
2.2. Scat Collection
Three transect lines were surveyed at monthly intervals during the course of a year (December 2009–November 2010). The lines were parallel to each other and to the carriageway, at three distances from the road that typically show differential densities of small mammals [16] (0–50 m, 500–550 m, 1000–1050 m). Each line was some 3 km long and chiefly followed dirt roads, with a small proportion (c. 10% in total) cross-country along trails and paths. The total distance sampled during the study was 127 km.
Two experienced observers recorded and identified carnivore scats encountered during the surveys. Identification was based as much on morphological characteristics, such as size and shape, as on other characteristics such as smell and placement [35]. Scats that could not be safely identified were excluded from the diet study. Identification was to species level, with the exception of cats, which were recorded as Felis sp. given the impossibility to distinguish between scats of the domestic cat (Felis catus) and wildcat (Felis sylvestris).
2.3. Scat Analysis
A total of 498 scats were analyzed out of 1005 found during the surveys. Those in poorer condition or not safely identifiable were discarded. Those selected were a representative sample in terms of species, season and distance from the motorway. The species analyzed were the red fox (Vulpes vulpes), cat (Felis sp.), stone marten (Martes foina) and badger (Meles meles). Seasons were grouped into two periods, Autumn–Winter and Spring–Summer, taking into account the known differences in trophic resource availability between these periods [21,36]. Table 1 gives the total number of scats analyzed per species, season and distance from road.

Table 1.
Number of scats analyzed (N) to determine carnivore diet per species, season (A–W: Autumn–Winter; Sp–Su: Spring–Summer) and distance from road (D): D1: 0–50 m; D2: 500–550 m; D3: 1000–1050 m.
Collected scats were treated with insecticide, to prevent possible attack by coprophagous insects, before storage in paper bags in a dry place. Subsequent laboratory analysis followed the procedure described by Reynolds and Aebischer [37]: scats were first disintegrated in a 0.5 mm sieve under a jet of water. Macroscopic components (bones, hairs, feathers, seeds, arthropods exoskeleton fragments, fruits) were afterward separated and sorted into six categories: small mammals, lagomorphs (rabbit and hare), fruits and seeds, arthropods (insects and crayfish), reptiles and birds. Carrion was excluded as a food resource as we consider its consumption to be incidental. Mammal remains were identified from the cuticular surface patterning and internal structure of hairs [38]. The dry mass of each of the food categories present in each scat (wi) was also recorded.
In order to assess the magnitude of possible identification errors, apart from the total sample, we collected an additional sample of 70 fresh scats not included in the diet analyses. Observers were required to assign these fresh scats to a species irrespective of whether or not the scat posed identification problems, and these test samples were subsequently submitted to genetic analysis. The scats were preserved in plastic vials with 96% ethanol until DNA extraction. DNA was extracted using the PSP Spin Stool DNA Kit (Stratec, Birkenfeld, Germany), and the samples were assigned to species using species-specific mitochondrial DNA markers specifically designed for the identification of noninvasive samples from Iberian carnivores [39]. The description and comparison of the results of the morphological and genetic identifications are shown in Table S1. Under these conditions, designed to estimate the (potential) maximum level of identification errors based on morphology, it was found that morphological identification of fox scats incurred a low rate (10%) of misidentification. Scats of other species incurred higher error rates, with a bias towards fox scats being identified as coming from these species. This indicates that the analyzed samples of other species may include a certain proportion of fox scats. Hence, interspecific comparisons may be partly loaded (and differences blurred) by the inclusion of incorrectly identified scats.
2.4. Data Analysis
The percentage of fresh biomass ingested per food resource, PBi, was used as a descriptive index of carnivore diet:
where wi is the dry mass of remains from a particular food resource i, CFi is a correction factor and n is the total number of food resource categories considered. The correction factors used were those most often employed within the literature for each species [40,41,42,43,44] and are described in Table S2.
The dietary niche breadth for each species employed Levin’s standardized index [45] using the estimated biomass proportions. The index is given as follows:
where pi is the proportion in biomass terms of i (. The following standardized equation was used to ensure comparability with other studies:
The index values range between near 0 (lowest niche breadth) and 1 (greatest niche breadth = 1).
Pianka’s index, S [46], was used to estimate trophic niche overlap, as applied to the proportional intake of fresh biomass. It is calculated as follows:
where pij is the proportion of food resource i in the diet of predator j and pik is the proportion of i in that of predator k. Index values range between 0 (total separation) and 1 (total overlap).
In addition, certain other indices that are commonly employed in the literature (see review in [47]), based on the frequency of occurrence (FO) of different food resources and their relative frequency of occurrence (RF), were calculated. Such indices tend to overestimate the importance of small food items (e.g., insects, [47]). Hence, they were only calculated to ensure that the presented data (Table S3) can be compared with those of other studies but they were not used in the statistical analyses.
2.5. Statistical Analysis
The general carnivore diet patterns were ordinated using multidimensional scaling (MDS) to compare scats on the basis of the vectors of the PBi values of each. The nonparametric MDS was constructed from the matrix of dissimilarities computed as Manhattan distances [48]. The number of dimensions used for the ordination of the 498 observations was established taking account of the Kruskal stress value, a measure of how well the configuration matches the data [49]. To determine which food categories were contributing most to differences in carnivore diets, Spearman correlations were performed between the location of observations on the dimensions and the PBi of the food resources used in the input matrix.
A three-way MANOVA was conducted to determine the effect of the analyzed factors (species, season and distance to motorway and their interactions), with MDS coordinates as response variables, before we confirmed MANOVA assumptions of multivariate homogeneity and normality. Differences between groups were determined by testing the pairwise comparisons between the different factor levels.
To assist the graphical interpretation of results, a direction vector in ordination planes for each food resource was defined from the Spearman correlation coefficients obtained between the PBi values and the axis coordinates [50]. In addition, for each level of the distance from the motorway factor, the direction that it would have on the ordination plane was represented in accordance with the vector defined by the beta values obtained in the pairwise comparison MANOVAs.
In addition, the effect of the three analyzed factors and their interactions on the PBi values of the principal trophic resources in biomass terms for the whole sample (small mammals and lagomorphs) was also analyzed. For this purpose, a generalized linear model (GLM) was conducted using arcsine square root transformed proportions and correcting statistical tests for overdispersion.
The significance level was set at p = 0.05, and a sequential Bonferroni probability correction [51] was applied for multiple testing. All analyses were carried out with the STATISTICA 8.0 statistical program [52] using the individual scat as the sampling unit.
3. Results
The analyzed total of 498 scats comprised 39.16% red fox, 24.50% Felis sp., 24.09% stone marten and 12.25% badger scats. The main descriptors of the diet of each of these are given in Table S3. The dietary analysis shows the community in general to have a medium-low niche-breadth (range Bs = 0.23–0.56) with medium-high trophic niche overlap (S = 0.57–0.88). The most important dietary component of the carnivores in biomass terms was small mammals (49.34%), followed by lagomorphs (28.76%), fruits and seeds (11.44%), reptiles (4.58%), arthropods (2.96%) and birds (2.92%). However, the main food sources varied among carnivores (Table S3), with small mammals and lagomorphs being especially dominant in cat and red fox diets. Fruits and seeds were rather relevant in the diet of stone marten and to a lesser extent in that of badger. Arthropods were also relevant for the latter.
The MDS (Figure 1) provided three ordination axes (Stress = 0.087). In accordance with the correlation coefficients obtained (see Table S4), the first dimension represented an increase in the proportion of small mammals relative to the other trophic resources. The second dimension distinguished an increase in the proportion of lagomorphs, fruits and reptiles at its positive extreme against an increased proportion of birds and arthropods at the negative extreme. The third dimension represented a proportionate increase in lagomorphs and arthropods against major consumption of the other food resources.
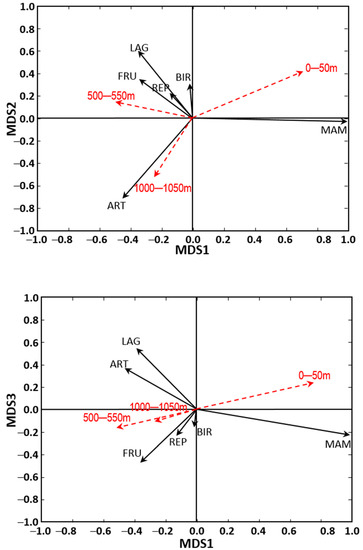
Figure 1.
Three-dimensional ordination (MDS) of general trends in carnivore diet. The influence of food resources in terms of percentage of fresh biomass (PB) is represented by arrows of length and direction obtained from their correlation with the axes. To assist the graphical interpretation of results, the figures include dotted red arrows representing the directions of the β coefficients of MANOVA for the three distances, with a module equivalent to β multiplied by 10 to clarify presentation. PB Abbreviations: MAM, small mammals; LAG, lagomorphs; FRU, fruit and seeds; ART, arthropods; BIR, birds; REP, reptiles.
The MANOVA results demonstrated the existence of significant between-species differences in diet, season and distances from the motorway, as well as a significant interaction between the factors “species” and “season” (see Table 2). Regarding the main focus of our study, the pairwise comparisons showed significant differences in diet between 0 and 1000 m from the road (p < 0.001). However, differences between 0 and 500 m (p = 0.040) were not significant after applying the Bonferroni correction, and differences between 500 and 1000 m (p = 0.206) were not significant either. The graphical representation of the beta values obtained (Figure 1) shows that the zone nearest the road saw increased predation on small mammals, whereas consumption of other trophic resources characterized the more distant zones.
Table 2.
Factors determining the diet of the carnivore community of the study area. Results of the MANOVA on the effects of species, season and distance to the road, and their interactions, on the position on the three axes of the multidimensional scaling that summarize scat contents.
Accordingly, the GLM results showed significant differences associated with the distance from the motorway in the percentage of small mammal biomass in the scats (Table 3). In comparison with values obtained at 1000–1050 m, the scats from the zone nearest the road contained a greater percentage of small mammals (β0–50 = 0.154 ± 0.048, p = 0.001), with a slightly increased percentage of small mammal biomass in scats from the intermediate zone (β500–550 = –0.099 ± 0.050, p = 0.047). The percentage increases were around 10% in the 0–50 m zone relative to the 1000–1500 m zone and 20% relative to the 500–550 m zone, representing in relative terms increases of 21% and 48%, respectively, in small mammal content (Figure 2). The GLM did not show significant differential responses of carnivores to the factor distance from the motorway (nonsignificant Distance x Species interaction in Table 3), but the response is patent in cat, stone marten and badger while absent in fox (Figure S2). Highly significant differences in small mammal PB were also found among species and associated with the species by season interaction. Contrary to the case of small mammals, no significant differences were found in the percentage of lagomorph biomass in the scats for any of the analyzed factors (Table 3).
Table 3.
Factors determining the percentage of fresh biomass (PB) of the main trophic resources (small mammals and lagomorphs) present in the analyzed scats. Results of the GLM using PBs of small mammals and lagomorphs as response variables. The variables were arcsine square root transformed for analysis.
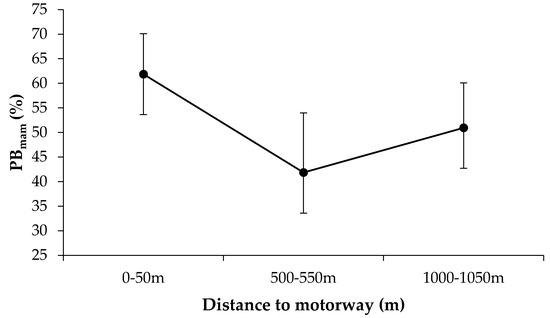
Figure 2.
Weighted marginal means and confidence intervals (CI–95%) of percentages of fresh small mammal biomass (PBmam) in scats from the three distance-from-road bands considered. The variable was arcsine square root transformed for analysis but its graphical representation has been back-transformed to facilitate its interpretation. Note that the Y axis does not start at 0%.
4. Discussion
The results show that the road has a significant general effect on carnivore trophic behavior in its vicinity. In fact, they reveal profound and previously unreported indirect effects triggered by transport infrastructures in the structural and functional characteristics of the ecosystems within the road effect zone.
The three analyzed factors (species, season and distance from road) had significant effects on the diet of the carnivore community, but the effect of proximity to the road is the most novel and interesting result of this study. The interspecific and phenological differences have been described in earlier studies and correspond mainly with the biological and behavioral characteristics of each species and with seasonal fluctuations in resource availability [53,54,55,56]. The present findings now add that distance from a road also significantly influences the trophic behavior of the carnivore community, leading to an increased consumption of small mammals close to the infrastructure. This general pattern needs to be considered with some caution due to two points. First, even though the diets of all species match those revealed by previous studies and precautions were taken to prevent identification error, the genetic analyses revealed some degree of contamination by fox scats of the samples obtained from the other species (Table S1, see also [57,58,59]). Secondly, high intraspecific variability precluded the detection of significant differences among species in the response, but as depicted in Figure S2, fox scats keep a constant proportion of small mammal biomass along the analyzed distance gradient while cat, stone marten and badger fit the general pattern.
Carnivore diets near the road, as revealed by scat analyses, show enhanced consumption of small mammals. Earlier studies have shown that roads alter the abundance of prey species, with zones nearest roads characterized by abundant small mammal populations [16,19,21,60]. In our study site, small mammals in the area nearest the road are not only more abundant but also show a moderation of their seasonal and interannual population cycles [21]. Furthermore, mice near roads may experience physiological stress that makes them more vulnerable to predation [61]. The roadside vicinity may therefore offer an important prey source for carnivores, especially at times when trophic resources in the wider environment are scarce. Furthermore, small mammals are a key dietary component in our study area because alternative prey such as lagomorphs occur only at low densities (unpublished data), such that any reduction in small mammal consumption is compensated for by small increases in all other available food types in areas more distant from the road. The results thus suggest that the predator community reacts very locally to the trophic offer associated with the road both by altering trophic behavior in response to small mammal abundance nearby and by altering foraging patterns (this study) and use of space (see below, [34]).
Regarding the use of space, the results suggest that some individual carnivores make intensive use of the area nearest the road. The study design does not allow knowing the movement patterns of individuals or knowing which individuals defecated at any point of the study area. However, given that the mean gut retention time of mid-sized carnivores is 7–25 h [62,63,64], were individuals to range systematically through areas more and less distant from the road within their home ranges (of 300–500 ha, according to species, [65]) their scats would include a mixture of material ingested throughout their territories. In such circumstances, the contents of their scats would not show any clear spatial pattern (as seems to be the case of the fox) and would not reflect the higher small mammal abundance found nearest the road (seen in the other three species). The simplest explanation of the increased small mammal content in the scats nearest the motorway is that individuals that defecate there are those that make disproportionate use of this zone for hunting, becoming what may be termed “road verge specialists”. Earlier studies have shown that carnivores most often mark where their main prey lives and thus where they spend most time hunting [66]. The home ranges of verge-specialized individuals may partly overlap with those of individuals occupying areas more distant from the road, resulting in a transitional area (detected in the 500 m samples) where scats reveal a mixed dietary content intermediate between those of the two extreme locations. Further studies based on the diet of radio-tagged individuals and/or the genetic individualization of carnivore scats will be needed to clarify this point.
Few radiotracking studies have analyzed the use of space by carnivores near roads, and these have often given contradictory results. Some indicate that some individuals of stone marten may not avoid roads, where habitat is available, and may even show an increased likelihood of including them in their home ranges [67]. Ascensão et al. [22] also found that one stone marten included the vicinity of a road in its home range and that it mainly moved parallel to the motorway when in its proximity. Such use of the motorway may be as much determined by its traffic volume as by the availability of roadside habitat [67]. The intensive use by carnivores of the roadside zone in our study area [34] may reflect the availability of suitable habitat, the abundance of trophic resources and the relatively low traffic volume (8,396 vehicles per day, SE 233), which reduces the likelihood of avoidance behavior or any general negative effect on the predator community (predator release effect, [15,25,68]). It may also be that juveniles or other subordinate carnivore individuals are displaced towards roads by dominants, as implied by the nonbreeding status of coyotes (Canis latrans) and bobcats (Lynx rufus) whose home ranges include motorways [69].
Finally, our results also illustrate potential interspecific interactions triggered within the carnivore community. They indicate that the roadside community comprises generalist mesocarnivores showing high trophic overlap and narrow trophic niche breadths. Predation theory predicts a convergence of diets when resources are more abundant and trophic niche segregation to reduce competition when resource availability varies spatially and/or temporally [70,71,72]. The observed dietary convergence among roadside carnivores indicates an abundance of trophic resources and illustrates the possible role of interference interactions in shaping their activity patterns [73,74]. The existence of some degree of segregation in the activity patterns of roadside carnivores [16,34] may reflect avoidance behaviors between interspecific pairs of individuals with high dietary overlap [73,74].
5. Conclusions
The results obtained show that road presence has indirect effects on carnivores via their trophic behavior. This adds to changes in the use of space by the different species and potentially also to variations in the intensity of interactions between them. Such a combination of effects is especially important given that (i) ecosystems affected by roads are ever more frequent and (ii) the results imply that both the structure and function of the predator community are locally altered from their normal state where roads are absent. An understanding of this cascade of changes may prove to be key to assess the long-term effects of roads beyond the direct negative effects, such as roadkill, that they cause.
Finally, it must be pointed out that the present study was carried out with a community of generalist Mediterranean mesocarnivores inhabiting a well-conserved landscape offering just one principal group of prey species. Similar studies in other environmental settings would open a research line of great interest in studying the indirect effects generated by roads within the faunal communities that surround them. The combination in such studies of (i) dietary analysis with (ii) the monitoring of individual movements and (iii) the individualization of scats by genetic techniques, as well as an increase in the study area size to include individuals living away from the road, would give a full picture of patterns described here.
Supplementary Materials
The following are available online at https://www.mdpi.com/article/10.3390/d13040173/s1: Figure S1: Study area location, Figure S2: Weighted Marginal Means and confidence intervals (CI–95%) of percentages of fresh small mammal biomass (PBmam) in scats from the four carnivore species collected at the three bands considered (cat, stone marten, red fox and badger), Table S1: Morphological identification (Morphological Id.) of scats compared with identifications by genetic analysis (DNA Id.), Table S2: Correction factors (CF) used per species to convert weight of each food category found in scats into fresh biomass ingested, Table S3: Descriptive diet indices obtained per species, Table S4: Spearman correlation coefficients (r) between percentage biomass (PBs) of food categories present in scats and values of coordinates obtained in the three MDS axes (MDS1, MDS2, MDS3).
Author Contributions
Conceptualization, P.R.-C., C.M. and J.E.M.; methodology, C.M.; P.R.-C. and B.F.; software, P.R.-C.; validation, C.F. and P.R.-C.; formal analysis, P.R.-C. and J.E.M.; investigation, P.R.-C. and C.M.; data curation, P.R.-C.; writing—original draft preparation, P.R.-C., C.M. and J.E.M.; writing—review and editing, P.RC., C.M. and J.E.M.; supervision, C.F. and J.E.M.; project administration, J.E.M.; funding acquisition, J.E.M. All authors have read and agreed to the published version of the manuscript.
Funding
This study forms part of the CENIT-OASIS project funded by a consortium supported by the Centro para el Desarrollo Tecnológico e Industrial, CDTI, of the Spanish Ministry of Science and Innovation. The Comunidad de Madrid supports the research group through the REMEDINAL TE-CM Research Network (P2018/EMT4338).
Institutional Review Board Statement
Not applicable since all the study was carried out without animal capture or handling.
Informed Consent Statement
Not applicable.
Data Availability Statement
The data can be obtained on the request from a corresponding author.
Acknowledgments
We are especially grateful to Isabel Barja for her advice on scat analysis, to Jorge Hernández for help with fieldwork and to Carmen Serena and Cristina Ayala for their assistance with scat analysis in the laboratory. C. Fernandes thanks the support of cE3c through an assistant researcher contract (FCiência.ID contract #366) and FCT (Fundação para a Ciência e a Tecnologia) for Portuguese National Funds attributed to cE3c within the strategic project UID/BIA/00329/2020; C. Fernandes also thanks FPUL for a contract of invited assistant professor.
Conflicts of Interest
The authors declare no conflict of interest.
References
- CIA. Central Intelligence Agency. The World FactBook. 2013. Available online: www.cia.gov (accessed on 11 February 2020).
- Van, D.R.R.; Smith, J.; Grilo, C. Handbook of Road Ecology; John Wiley & Sons, Ltd.: Oxford. UK, 2015. [Google Scholar]
- Ibisch, P.L.; Hoffmann, M.T.; Kreft, S.; Pe’Er, G.; Kati, V.; Biber-Freudenberger, L.; Dellasala, D.A.; Vale, M.M.; Hobson, P.R.; Selva, N. A global map of roadless areas and their conservation status. Science 2016, 354, 1423–1427. [Google Scholar] [CrossRef]
- Dulac, J. Global Land Transport Infrastructure Requirements: Estimating Road and Railway Infrastructure Capacity and Costs to 2050; International Energy Agency: Paris, France, 2013. [Google Scholar]
- Laurance, W.F.; Clements, G.R.; Sloan, S.; O’Connell, C.S.; Mueller, N.D.; Goosem, M.; Venter, O.; Edwards, D.P.; Phalan, B.; Balmford, A.; et al. A global strategy for road building. Nat. Cell Biol. 2014, 513, 229–232. [Google Scholar] [CrossRef]
- Forman, R.T. Road ecology: A solution for the giant embracing us. Landsc. Ecol. 1998, 13, 3–5. [Google Scholar] [CrossRef]
- Forman, R.T.T.; Alexander, L.E. Roads and their major ecological effects. Annu. Rev. Ecol. Syst. 1998, 29, 207–231. [Google Scholar] [CrossRef]
- Forman, R.T.T. Estimate of the Area Affected Ecologically by the Road System in the United States. Conserv. Biol. 2000, 14, 31–35. [Google Scholar] [CrossRef]
- Torres, A.; Jaeger, J.A.G.; Alonso, J.C. Assessing large-scale wildlife responses to human infrastructure development. Proc. Natl. Acad. Sci. USA 2016, 113, 8472–8477. [Google Scholar] [CrossRef] [PubMed]
- Trombulak, S.C.; Frissell, C.A. Review of ecological effects of roads in terrestrial and aquatic ecosystems. Conserv. Biol. 2000, 14, 18–30. [Google Scholar] [CrossRef]
- Forman, R.T.; Sperling, D.; Bissonette, J.A.; Clevenger, A.P.; Cutshall, C.D.; Dale, V.H.; Fahrig, L.; France, R.; Goldman, C.R.; Heanue, K.; et al. Road Ecology: Science and Solutions; Island Press: Washington, DC, USA, 2003. [Google Scholar]
- Coffin, A.W. From roadkill to road ecology: A review of the ecological effects of roads. J. Transp. Geogr. 2007, 15, 396–406. [Google Scholar] [CrossRef]
- Benítez-López, A.; Alkemade, R.; Verweij, P.A. The impacts of roads and other infrastructure on mammal and bird populations: A meta-analysis. Biol. Conserv. 2010, 143, 1307–1316. [Google Scholar] [CrossRef]
- Sáenz-de-SantaMaría, A.; Tellería, J.L. Wildlife-vehicle collisions in Spain. Eur. J. Wildl. Res. 2015, 61, 399–406. [Google Scholar] [CrossRef]
- Fahrig, L.; Rytwinski, T. Effects of Roads on Animal Abundance: An Empirical Review and Synthesis. Ecol. Soc. 2009, 14, 21. [Google Scholar] [CrossRef]
- Ruiz-Capillas, P.; Mata, C.; Malo, J.E. Community Response of Mammalian Predators and Their Prey to Motorways: Implications for Predator–Prey Dynamics. Ecosystem 2013, 16, 617–626. [Google Scholar] [CrossRef]
- Siemers, B.M.; Schaub, A. Hunting at the highway: Traffic noise reduces foraging efficiency in acoustic predators. Proc. R. Soc. Lond B Biol. Sci. 2011, 278, 1646–1652. [Google Scholar] [CrossRef]
- Shannon, G.; Angeloni, L.M.; Wittemyer, G.; Fristrup, K.M.; Crooks, K.R. Road traffic noise modifies behaviour of a keystone species. Anim. Behav. 2014, 94, 135–141. [Google Scholar] [CrossRef]
- Ascensão, F.; Clevenger, A.P.; Grilo, C.; Filipe, J.; Santos-Reis, M. Highway verges as habitat providers for small mammals in agrosilvopastoral environments. Biodivers. Conserv. 2012, 21, 3681–3697. [Google Scholar] [CrossRef]
- Planillo, A.; Malo, J.E.; Arrazola, J.E.M. Motorway verges: Paradise for prey species? A case study with the European rabbit. Mamm. Biol. 2013, 78, 187–192. [Google Scholar] [CrossRef]
- Ruiz-Capillas, P.; Mata, C.; Malo, J.E. Road verges are refuges for small mammal populations in extensively managed Mediter-ranean landscapes. Biol. Conserv. 2013, 158, 223–229. [Google Scholar] [CrossRef]
- Ascensão, F.; Grilo, C.; LaPoint, S.; Tracey, J.; Clevenger, A.P.; Santos-Reis, M. Inter-Individual Variability of Stone Marten Behavioral Responses to a Highway. PLoS ONE 2014, 9, e103544. [Google Scholar] [CrossRef] [PubMed]
- Santos, R.A.L.; Santos, S.M.; Santos-Reis, M.; De Figueiredo, A.P.; Bager, A.; Aguiar, L.M.S.; Ascensão, F. Carcass Persistence and Detectability: Reducing the Uncertainty Surrounding Wildlife-Vehicle Collision Surveys. PLoS ONE 2016, 11, e0165608. [Google Scholar] [CrossRef]
- Svobodová, J.; Sálek, M.; Albrecht, T. Roads do not increase predation on experimental nests in a highly fragmented forest land-scape. Folia Zool. 2007, 56, 84–89. [Google Scholar]
- Downing, R.J.; Rytwinski, T.; Fahrig, L. Positive effects of roads on small mammals: A test of the predation release hypothesis. Ecol. Res. 2015, 30, 651–662. [Google Scholar] [CrossRef]
- Ford, A.T.; Fahrig, L. Diet and body size of North American mammal road mortalities. Transp. Res. Part. D Transp. Environ. 2007, 12, 498–505. [Google Scholar] [CrossRef]
- Barthelmess, E.L.; Brooks, M.S. The influence of body-size and diet on road-kill trends in mammals. Biodivers. Conserv. 2010, 19, 1611–1629. [Google Scholar] [CrossRef]
- Barrientos, R.; Bolonio, L. The presence of rabbits adjacent to roads increases polecat road mortality. Biodivers. Conserv. 2008, 18, 405–418. [Google Scholar] [CrossRef]
- Planillo, A.; Mata, C.; Manica, A.; Malo, J.E. Carnivore abundance near motorways related to prey and roadkills. J. Wildl. Manag. 2017, 82, 319–327. [Google Scholar] [CrossRef]
- Little, S.J.; Harcourt, R.G.; Clevenger, A.P. Do wildlife passages act as prey-traps? Biol. Conserv. 2002, 107, 135–145. [Google Scholar] [CrossRef]
- Mata, C.; Herranz, J.; Malo, J.E. Roads do not increase predation on experimental nests in a highly fragmented forest landscape. Diversity 2020, 12, 166. [Google Scholar] [CrossRef]
- Tissier, M.L.; Jumeau, J.; Croguennec, C.; Petit, O.; Habold, C.; Handrich, Y. An anti-predation device to facilitate and secure the crossing of small mammals in motorway wildlife underpasses. (I) Lab tests of basic design features. Ecol. Eng. 2016, 95, 738–742. [Google Scholar] [CrossRef]
- Torre, I.; Arrizabalaga, A.; Flaquer, C. Three methods for assessing richness and composition of small mammal communities. J., Mammal. 2004, 85, 524–530. [Google Scholar] [CrossRef]
- Mata, C.; Ruiz-Capillas, P.; Malo, J.E. Small-scale differences in carnivore activity patterns close to motorways. Eur. J. Wildl. Res. 2017, 63, 64. [Google Scholar] [CrossRef]
- Bang, P.; Dahlström, P. Huellas y Señales de los Animales de Europa, 1st ed.; Ediciones Omega, SA: Barcelona, Spain, 1997. [Google Scholar]
- Gálvez-Bravo, L. Conejo–Oryctolagus cuniculus. In Enciclopedia Virtual de los Vertebrados Españoles; Salvador, A., Cassinello, J., Eds.; Museo Nacional de Ciencias Naturales: Madrid, Spain, 2012; Available online: http://www.vertebradosibericos.org/ (accessed on 11 February 2020).
- Reynolds, J.C.; Aebischer, N.J. Comparison and quantification of carnivore diet by faecal analysis: A critique, with recommendations, based on a study of the Fox Vulpes vulpes. Mammal. Rev. 1991, 21, 97–122. [Google Scholar] [CrossRef]
- Teerink, B.J. Hair of West-European Mammals; Cambridge University Press: London, UK, 1991. [Google Scholar]
- Fernandes, C.A.; Ginja, C.; Pereira, I.; Tenreiro, R.; Bruford, M.W.; Santos-Reis, M. Species-specific mitochondrial DNA markers for identification of non-invasive samples from sympatric carnivores in the Iberian Peninsula. Conserv. Genet. 2008, 9, 681–690. [Google Scholar] [CrossRef]
- Romanowski, J.; Lesiński, G. A note on the diet of stone marten in southeastern Romania. Acta Theriol. 1991, 36, 201–204. [Google Scholar] [CrossRef]
- Sarmento, P. Feeding ecology of the European wilcat Felis silvestris in Portugal. Acta Theriol. 1996, 41, 409–414. [Google Scholar] [CrossRef]
- Jedrzejewska, B.; Jedrzejewskim, W. Predation in Vertebrate Communities: The Bialowieza Primevalforest as a Case Study; Ecological Studies 135; Springer: Berlin, Germany, 1998. [Google Scholar]
- Revilla, E.; Palomares, F. Spatial organization, group living and ecological correlates in low-density populations of Eurasian badgers, Meles meles. J. Anim. Ecol. 2002, 71, 497–512. [Google Scholar] [CrossRef]
- Rosalino, L.M.; Loureiro, F.; Macdonald, D.W.; Santos-Reis, M. Food digestibility of an Eurasian badger Meles meles with special reference to the Mediterranean region. Acta Theriol. 2003, 48, 283–288. [Google Scholar] [CrossRef]
- Krebs, C.J. Ecological Methodology; Harper Collins Publisher: New York, NY, USA, 1989. [Google Scholar]
- Pianka, E.R. The Structure of Lizard Communities. Annu. Rev. Ecol. Syst. 1973, 4, 53–74. [Google Scholar] [CrossRef]
- Klare, U.; Kamler, J.F.; Macdonald, D.W. A comparison and critique of different scat-analysis methods for determining carnivore diet. Mammal. Rev. 2011, 41, 294–312. [Google Scholar] [CrossRef]
- Legendre, P.; Legendre, L. Numerical Ecology, 2nd ed.; Elsevier Science: Amsterdam, The Netherland, 1998. [Google Scholar]
- Kruskal, J.B. Multidimensional scaling by optimizing goodness of fit to a nonmetric hypothesis. Psychometrika 1964, 29, 1–27. [Google Scholar] [CrossRef]
- Zuur, A.; Ieno, E.N.; Smith, G.M. Analyzing Ecological Data; Springer Science & Business Media: New York, NY, USA, 2007. [Google Scholar]
- Rice, W.R. Analyzing Tables of Statistical Tests. Evolution 1989, 43, 223–225. [Google Scholar] [CrossRef]
- StatSoft Inc. STATISTICA (Data Analysis Software System), version 8.0; StatSoft Inc.: Tulsa, OK, USA, 2007. [Google Scholar]
- Genovesi, P.; Secchi, M.; Boitani, L. Diet of stone martens: An example of ecological flexibility. J. Zool. 1996, 238, 545–555. [Google Scholar] [CrossRef]
- Malo, A.F.; Lozano, J.; Huertas, D.L.; Virgós, E. A change of diet from rodents to rabbits (Oryctolagus cuniculus). Is the wildcat (Felis silvestris) a specialist predator? J. Zool. 1999, 263, 401–407. [Google Scholar] [CrossRef]
- Rosalino, L.M.; Loureiro, F.; Macdonald, D.W.; Santos-Reis, M. Dietary shifts of the badger (Meles meles) in Mediterranean wood-lands: An opportunistic forager with seasonal specialisms. Mamm. Biol. 2005, 70, 12–23. [Google Scholar] [CrossRef]
- Dell’Arte, G.L.; Laaksonen, T.; Norrdahl, K.; Korpimäki, E. Variation in the diet composition of a generalist predator, the red fox, in relation to season and density of main prey. Acta Oecol. 2007, 31, 276–281. [Google Scholar] [CrossRef]
- Davison, A.; Birks, J.D.; Brookes, R.C.; Braithwaite, T.C.; Messenger, J.E. On the origin of faeces: Morphological versus molecular methods for surveying rare carnivores from their scats. J. Zool. 2002, 257, 141–143. [Google Scholar] [CrossRef]
- Monterroso, P.; Castro, D.; Silva, T.L.; Ferreras, P.; Godinho, R.; Alves, P.C. Factors affecting the (in)accuracy of mammalian meso-carnivore scat identification in South-western Europe. J. Zool. 2012, 289, 243–250. [Google Scholar] [CrossRef]
- Morin, D.J.; Higdon, S.D.; Holub, J.L.; Montague, D.M.; Fies, M.L.; Waits, L.P.; Kelly, M.J. Bias in carnivore diet analysis resulting from misclassification of predator scats based on field identification. Wildl. Soc. Bull. 2016, 40, 669–677. [Google Scholar] [CrossRef]
- Sabino-Marques, H.; Mira, A. Living on the verge: Are roads a more suitable refuge for small mammals than streams in Medi-terranean pastureland? Ecol. Res. 2001, 26, 277–287. [Google Scholar] [CrossRef]
- Navarro-Castilla, A.; Mata, C.; Ruiz-Capillas, P.; Palme, R.; Malo, J.E.; Barja, I. Are Motorways Potential Stressors of Roadside Wood Mice (Apodemus sylvaticus) Populations? PLoS ONE 2014, 9, e91942. [Google Scholar] [CrossRef]
- Graae, B.J.; Pagh, S.; Bruun, H.H. An experimental evaluation of the Arctic fox (Alopex lagopus) as a seed disperser. Arct. Antarc. Alp. Res. 2004, 36, 468–473. [Google Scholar] [CrossRef]
- Varela, O.; Bucher, E.H. Passage time, viability, and germination of seeds ingested by foxes. J. Arid. Environ. 2006, 67, 566–578. [Google Scholar] [CrossRef]
- Tsuji, Y.; Shiraishi, T.; Miura, S. Gastrointestinal passage time of seeds ingested by captive Japanese martens Martes melampus. Acta Theriol. 2011, 56, 353–357. [Google Scholar] [CrossRef]
- Palomo, L.J.; Gisbert, J.; Blanco, J.C. Atlas y Libro Rojo de los Mamíferos Terrestres de España; Dirección General de Conservación de la Naturaleza-SECEM-SECEMU: Madrid, Spain, 2007. [Google Scholar]
- Piñeiro, A.; Barja, I. Evaluating the function of wildcat faecal marks in relation to the defence of favourable hunting areas. Ethol. Ecol. Evol. 2014, 27, 161–172. [Google Scholar] [CrossRef]
- Grilo, C.; Sousa, J.; Ascensão, F.; Matos, H.; Leitão, I.; Pinheiro, P.; Costa, M.; Bernardo, J.; Reto, D.; Lourenço, R.; et al. Individual Spatial Responses towards Roads: Implications for Mortality Risk. PLoS ONE 2012, 7, e43811. [Google Scholar] [CrossRef]
- Rytwinski, T.; Fahrig, L. Why are some animal populations unaffected or positively affected by roads? Oecologia 2013, 173, 1143–1156. [Google Scholar] [CrossRef] [PubMed]
- Riley, S.P.D.; Pollinger, J.P.; Sauvajot, R.M.; York, E.C.; Bromley, C.; Fuller, T.K.; Wayne, R.K. A southern California freeway is a physical and social barrier to gene flow in carnivores. Mol. Ecol. 2006, 15, 1733–1741. [Google Scholar] [CrossRef] [PubMed]
- Schoener, T.W. The controversy over interspecific competition. Am. Sci. 1982, 70, 27–39. [Google Scholar]
- Carvalho, J.C.; Gomes, P. Feeding resource partitioning among four sympatric carnivores in the Peneda-Gerês National Park (Portugal). J. Zool. 1999, 263, 275–283. [Google Scholar] [CrossRef]
- Barrientos, R.; Virgós, E. Reduction of potential food interference in two sympatric carnivores by sequential use of shared re-sources. Acta Oecol. 2006, 30, 107–116. [Google Scholar] [CrossRef]
- Fedriani, J.M.; Palomares, F.; Delibes, M. Niche relations among three sympatric Mediterranean carnivores. Oecologia 1999, 121, 138–148. [Google Scholar] [CrossRef]
- Barrull, J.; Mate, I.; Ruiz-Olmo, J.; Casanovas, J.C.; Gosàlbez, J.; Salicrú, M. Factors and mechanisms that explain coexistence in a Mediterranean carnivore assemblage: An integrated study based on camera trapping and diet. Mamm. Biol. 2014, 79, 123–131. [Google Scholar] [CrossRef]
Publisher’s Note: MDPI stays neutral with regard to jurisdictional claims in published maps and institutional affiliations. |
© 2021 by the authors. Licensee MDPI, Basel, Switzerland. This article is an open access article distributed under the terms and conditions of the Creative Commons Attribution (CC BY) license (https://creativecommons.org/licenses/by/4.0/).