Article

Habitat Partitioning and Overlap by Large Lacertid Lizards in Southern Europe

1
GRECO, Institute of Aquatic Ecology, Campus Montillivi s/n, University of Girona, 17071 Girona, Spain
2
Area d’Herpetologia, BiBIO, Museu de Granollers–Ciències Naturals, Palaudàries 102, 08402 Catalunya, Spain
*
Author to whom correspondence should be addressed.
Diversity 2021, 13(4), 155; https://doi.org/10.3390/d13040155
Submission received: 17 March 2021 / Revised: 29 March 2021 / Accepted: 2 April 2021 / Published: 4 April 2021
(This article belongs to the Special Issue Evolutionary Ecology of Lizards)

Abstract

:
South-western Europe has a rich diversity of lacertid lizards. In this study, we evaluated the occupancy patterns and niche segregation of five species of lacertids, focusing on large-bodied species (i.e., adults having >75 mm snout-vent length) that occur in south-western Europe (Italian to the Iberian Peninsula). We characterized the niches occupied by these species based on climate and vegetation cover properties. We expected some commonality among phylogenetically related species, but also patterns of habitat segregation mitigating competition between ecologically equivalent species. We used multivariate ordination and probabilistic methods to describe the occupancy patterns and evaluated niche evolution through phylogenetic analyses. Our results showed climate niche partitioning, but with a wide overlap in transitional zones, where segregation is maintained by species-specific responses to the vegetation cover. The analyses also showed that phylogenetically related species tend to share large parts of their habitat niches. The occurrence of independent evolutionary lineages contributed to the regional species richness favored by a long history of niche divergence.

1. Introduction

Climate is a powerful environmental factor driving the process of niche diversification in reptiles [1,2]. Tolerance to maximum temperatures in reptiles is evolutionarily constrained, possibly because of the importance of external heat sources in maintaining activity and for bodily water balance [3,4]. For these reasons, there is a significant association between the composition of reptile assemblages and thermal latitudinal gradients [5]. However, the thermoregulation efficiency of reptiles is not only mediated by the overall climate conditions, but also by the temperature conditions in microhabitats [6]. Vegetation cover and structure regulate the patterns of reptile occurrence, but at a finer scale than the climate [7,8].
South-western Europe encompasses a relatively rich reptile fauna, favored by its topographic heterogeneity, insularity and mild climate conditions [9]. In this region, several groups of phylogenetically related species display complex patterns of overlap structured by environmental gradients or by interspecific interactions [10,11,12]. In this study we evaluated the niche occupancy patterns of five species of large lacertid lizard (i.e., adults having >75 mm snout-vent length) that occur in south-western Europe and comprise a monophyletic group [13]. We focused on phylogenetically related species because stronger competitive interactions among them can be expected [14]. The target species in this study included one species having a broad circumboreal distribution, Lacerta agilis (Linnaeus 1758), two western Mediterranean endemics Lacerta bilineata (Daudin, 1802) and Timon lepidus (Daudin, 1802), and two Iberian endemics Lacerta schreiberi (Bedriaga, 1878) and Timon nevadensis (Buchholz, 1963). Given these substantial chorological differences, it was also expected that these species would diverge in their environmental associations. For example, T. nevadensis mainly occupies semi-arid steppe-like habitats, L. agilis appears to be confined to sub-alpine meadows, and the other species are possibly more habitat generalists [15,16].
The purpose of this study was to investigate the patterns of habitat occupancy of these five species of large lacertids and evaluate them from an evolutionary perspective. We hypothesized that the diversity of large lacertid lizards in southern Europe would be favored by niche partitioning. However, this partitioning will be phylogenetically constrained because related species tend to occupy similar or equivalent niches [17]. To test these hypotheses, we used multivariate ordination and novel probabilistic methods that enabled quantification of the niche overlap between species, and the niche breadth.

2. Materials and Methods

2.1. Study Region and Surveys

The study region encompassed most of south-western Europe including the Iberian Peninsula, southern France and the Italian Peninsula (Figure 1). The region is dominated by Mediterranean climate types, ranging from subtropical warm desert to humid sub-Mediterranean and oceanic, and temperate to tundra-like types in the mountain ranges (Pyrenees, Alps) [18]. This environmental heterogeneity favors the concentration of high biotic diversity in this region, including species having xeric Mediterranean and meso-temperate affinities [19].
Species records were obtained opportunistically, based on random habitat surveys conducted in the region from spring to autumn, following the annual activity periods. The surveys were planned to capture the maximum heterogeneity of habitats within the distribution ranges of these species, but with no a priori selection of the most suitable habitats (i.e., a random sampling of available habitats). In total, 823 sites were surveyed throughout south-western Europe by 1–3 observers; each site was visited only once. The occurrence of each species was assessed based on visual surveys and rock flipping, because both techniques have been used to build inventories of diurnal lizards [20]. The surveys were conducted on sunny days between 10:00 a.m. and 5:00 p.m. local time. The visual surveys were complemented with rock flipping in cases where identification of the species could not be visually ascertained. In total, 188 records of five species of large lacertids were obtained (Figure 1) and were distributed as follows: L. agilis (number of records = 29), L. bilineata (59), L. schreiberi (8), T. lepidus (80), and T. nevadensis (12).

2.2. Environmental Data

The niches for the species were described based on climate and vegetation. We used three variables to describe the climate: the maximum temperature of the warmest month, the minimum temperature of the coldest month, and the accumulated annual precipitation, provided by the WorldClim database [21]. These variables represent climatic properties that reportedly influence reptile ranges because they describe thermal extremes and available environmental moisture [22].
The influence of plant cover was assessed using a surrogate for vegetation primary productivity, the enhanced vegetation index (EVI; [23]); EVI values correlate positively with the density of trees [24]. The EVI data were obtained for the 2009–2019 period from the high-resolution (250 m pixel–1) MODIS Collection EVI composite images [25]. The MODIS data were first checked to remove atmospheric artefacts, and then used to generate a series of variables describing the seasonal variability among habitats [26] including: the mean value (EVImean), the coefficient of variation (EVIcv), and the range (EVIrange), considering the inter-annual (mean value for 10 years) and spatial variability (mean value for 50 points, generated randomly within a maximum radius of 5 km). This larger area assessed the effect of the environment around the core habitat where specimens were found and took into account that species occurrence is sustained by isolated suitable habitat patch, but also by the interconnection of habitat patches that support the entire population [27].

2.3. Data Analysis

Species associations with two niche dimensions (climate and habitat) were visualized using outlying mean index (OMI) analysis [28]. The OMI ordination describes the species responses by quantifying their ecological marginality (the distance between the species centroid and the mean environmental conditions [28]). An OMI value close to zero indicates a higher similarity between the species position and the background environmental conditions. The OMI analysis also provided an estimate of the niche breadth of the species (tolerance index), and the proportion of the environmental variance explained by the OMI axes (residual tolerance; [28]). These analyses were carried out using the software package ade-4 [29] for R [30].
The niche overlap was estimated between pairs of species for a probabilistic niche region [31]. This overlap index was generated after 10,000 Monte Carlo draws for a niche region (alpha = 0.95), using the predictor variables. This analysis evaluates the probability that an individual of species X is found in the habitat of species Y, and vice versa, and produces two index values for a single pair of species (i.e., X→Y and Y→X) [32]. This method has the advantage of being weakly sensitive to the sample size [31], which is useful when evaluating the ecological overlap between species having dissimilar distributions, as was the case in this study. These analyses were carried out using the nicheROVER software package [32] for R.
We also compared the habitat characteristics between the pairs of species. Before modelling these associations, we tested the predictor variables for spatial autocorrelation using Moran’s I correlograms [33]. Moran’s I values were statistically significant, varying from 0.16 (EVIcv) to 0.55 (maximum temperature). To remove spatial autocorrelation, we built Binomial Generalized Linear Auto-Covariate Models (BGLAMs; [34]) selecting the best candidate model using the Akaike information criterion corrected for small sample sizes (AICc; [35]). In general, the best candidate models show lower AICc values, and an AICc weight ≥0.1 [35]. These analyses were carried out using the software packages spdep [36] and AICcmodavg [37] in the R environment.

2.4. Molecular Phylogenetics and Biogeography

Evolutionary relationships among the species of Lacerta and Timon were assessed by building a phylogenetic tree generated using Bayesian analysis of mitochondrial cytochrome b and 12s genes, obtained from GenBank (Supplementary Materials; Appendix I). The sequences were assembled and aligned using Bioedit 7.09 [38]. Our dataset comprised 32 sequences of variable length combining the two genes, and represented nine Lacerta and six Timon species, and four outgroups. The analysis of DNA evolution was conducted using jModelTest [39] and showed that the GTR+I+G model was the best for both the 12s and cytochrome b genes. We used three points of calibration to establish the times of divergence among species. The emergence of the Canary Island of El Hierro representing the divergence of Gallotia caesaris caesaris and Gallotia caesaris gomerae (1.0 Mya [40]) was used selecting a normal prior distribution (sigma = 0.02). The split between Lacerta and Timon was dated based using as a prior a gamma distribution based on a minimum age of 17.5 Mya [41] with shape and scale set to 1.0. The same prior distribution was used to calibrate the divergence between L. viridis and L. bilineata 8.7 Mya [42]. Bayesian analyses were performed using BEAST v 2.6.3. [43] running two chains of 5 × 10⁸ iterations, sampling every 10,000 iterations. Chains were checked for convergence and ESS using Tracer 1.5 [44] and were combined after a burn-in of 99%. To reconstruct the biogeographic history of large lacertid lizards in south-western Europe we used ancestral range estimation using BioGeoBEARS implemented in RASP 4.2 [45]. The regions included were south-western Asia (Caucasus, Anatolia, Iran and the Middle East), Europe (excluding the Iberian Peninsula), north-western Africa and the Iberian Peninsula. The models of vicariance, dispersal and extinction allowing all the combinations of ancestral areas (except the Iberian Peninsula plus Asia) were evaluated using the Akaike criterion [46].

3. Results

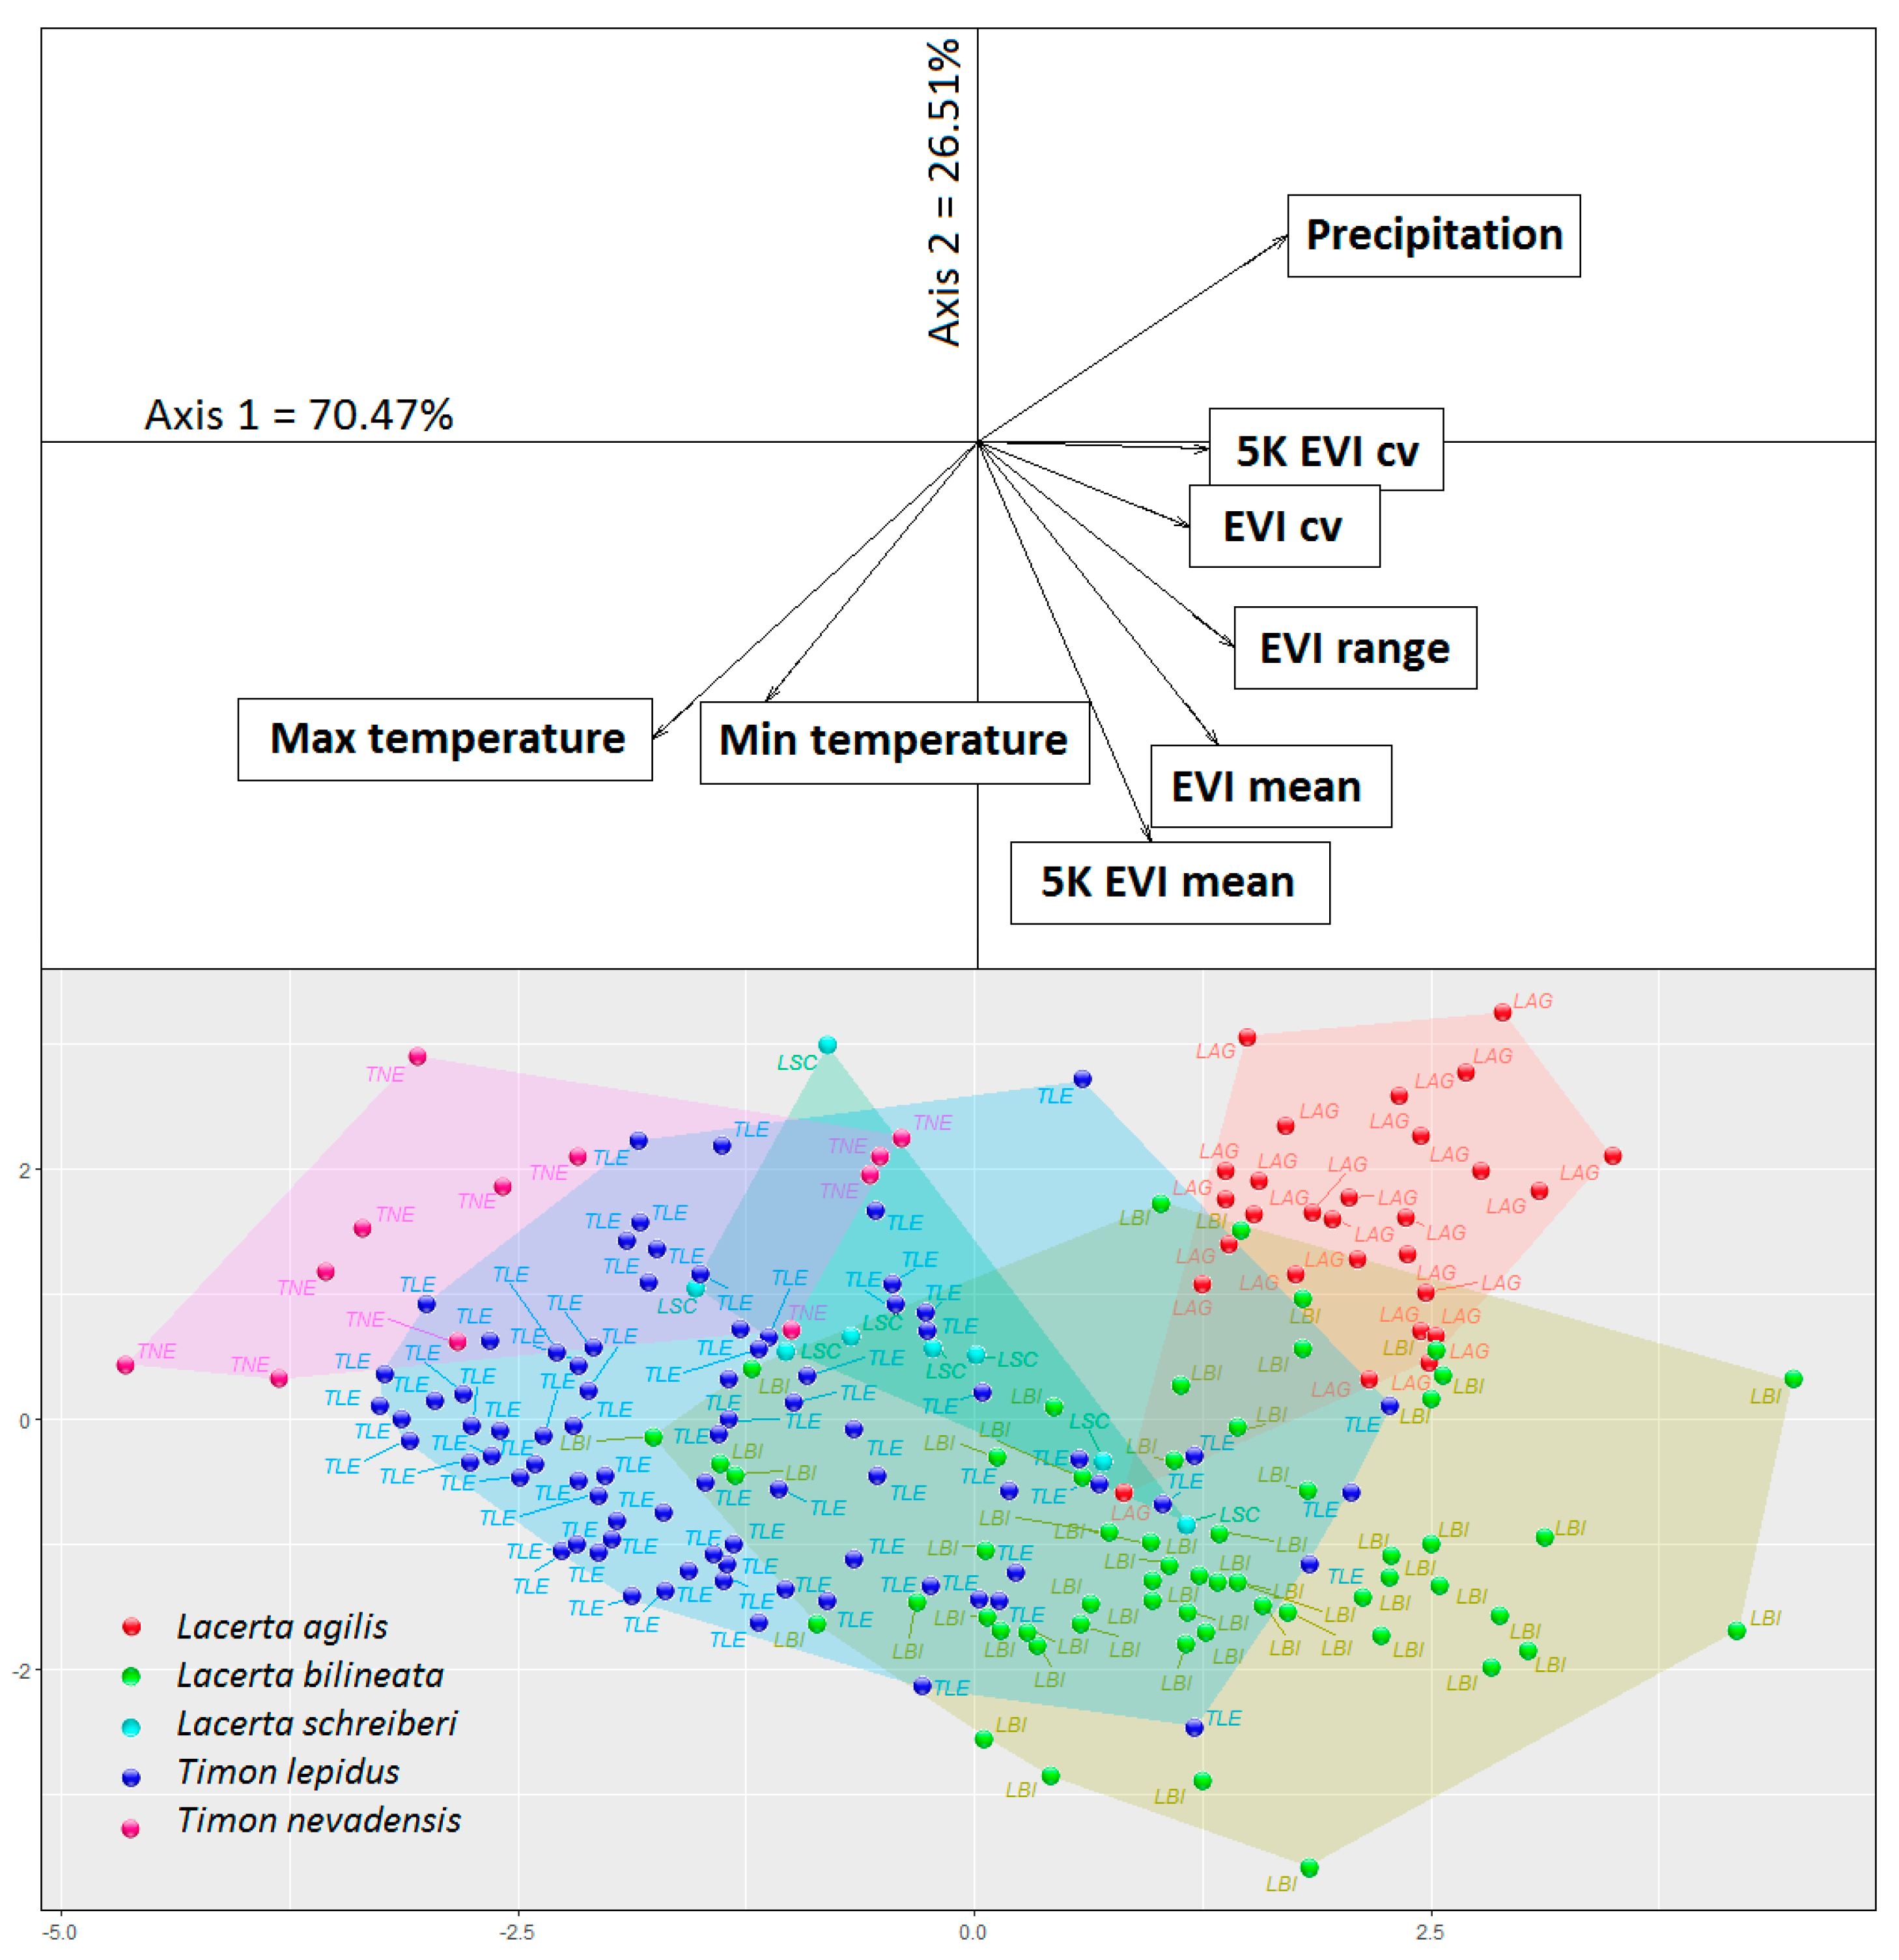
The first two axes of the OMI explained 96.98% of total inertia (axis 1: 70.47%, axis 2: 26.51%). The first axis described a gradient from higher to lower temperature and precipitation and differentiated those species that occur under humid-cold conditions from those that occur under hot-dry conditions (Figure 2). The second axis described a transition between habitats having different vegetation cover, typically distinguishing habitats having a relatively high EVI and a low seasonal coefficient of variation (CV) (e.g., forests) from those having a relatively low EVI and a high seasonal CV (i.e., grasslands/cultivated lands; Figure 2). The genus Timon was separated from the genus Lacerta mainly along the first axis, the former showing a positive association with dry-warm climates (Figure 2). The niche indices indicated that a large part of the variation in the occurrence of species was explained by the environmental variables, with residual tolerance values between 19.2% (L. agilis) to 66.9% (L. schreiberi) (Table 1). In general, the species showed moderate to high distances from the environmental centroid, ranging from 20.2% (L. schreiberi) to 74.4% (L. agilis) (Table 1), which indicated that they occupied confined subspaces within the available environment (Figure 2). The tolerance indices consistently showed moderate to low values, ranging from 22.6% (T. lepidus) to 6.4% (L. agilis) (Table 1), indicating that these species differed in their niche sizes (Figure 2).
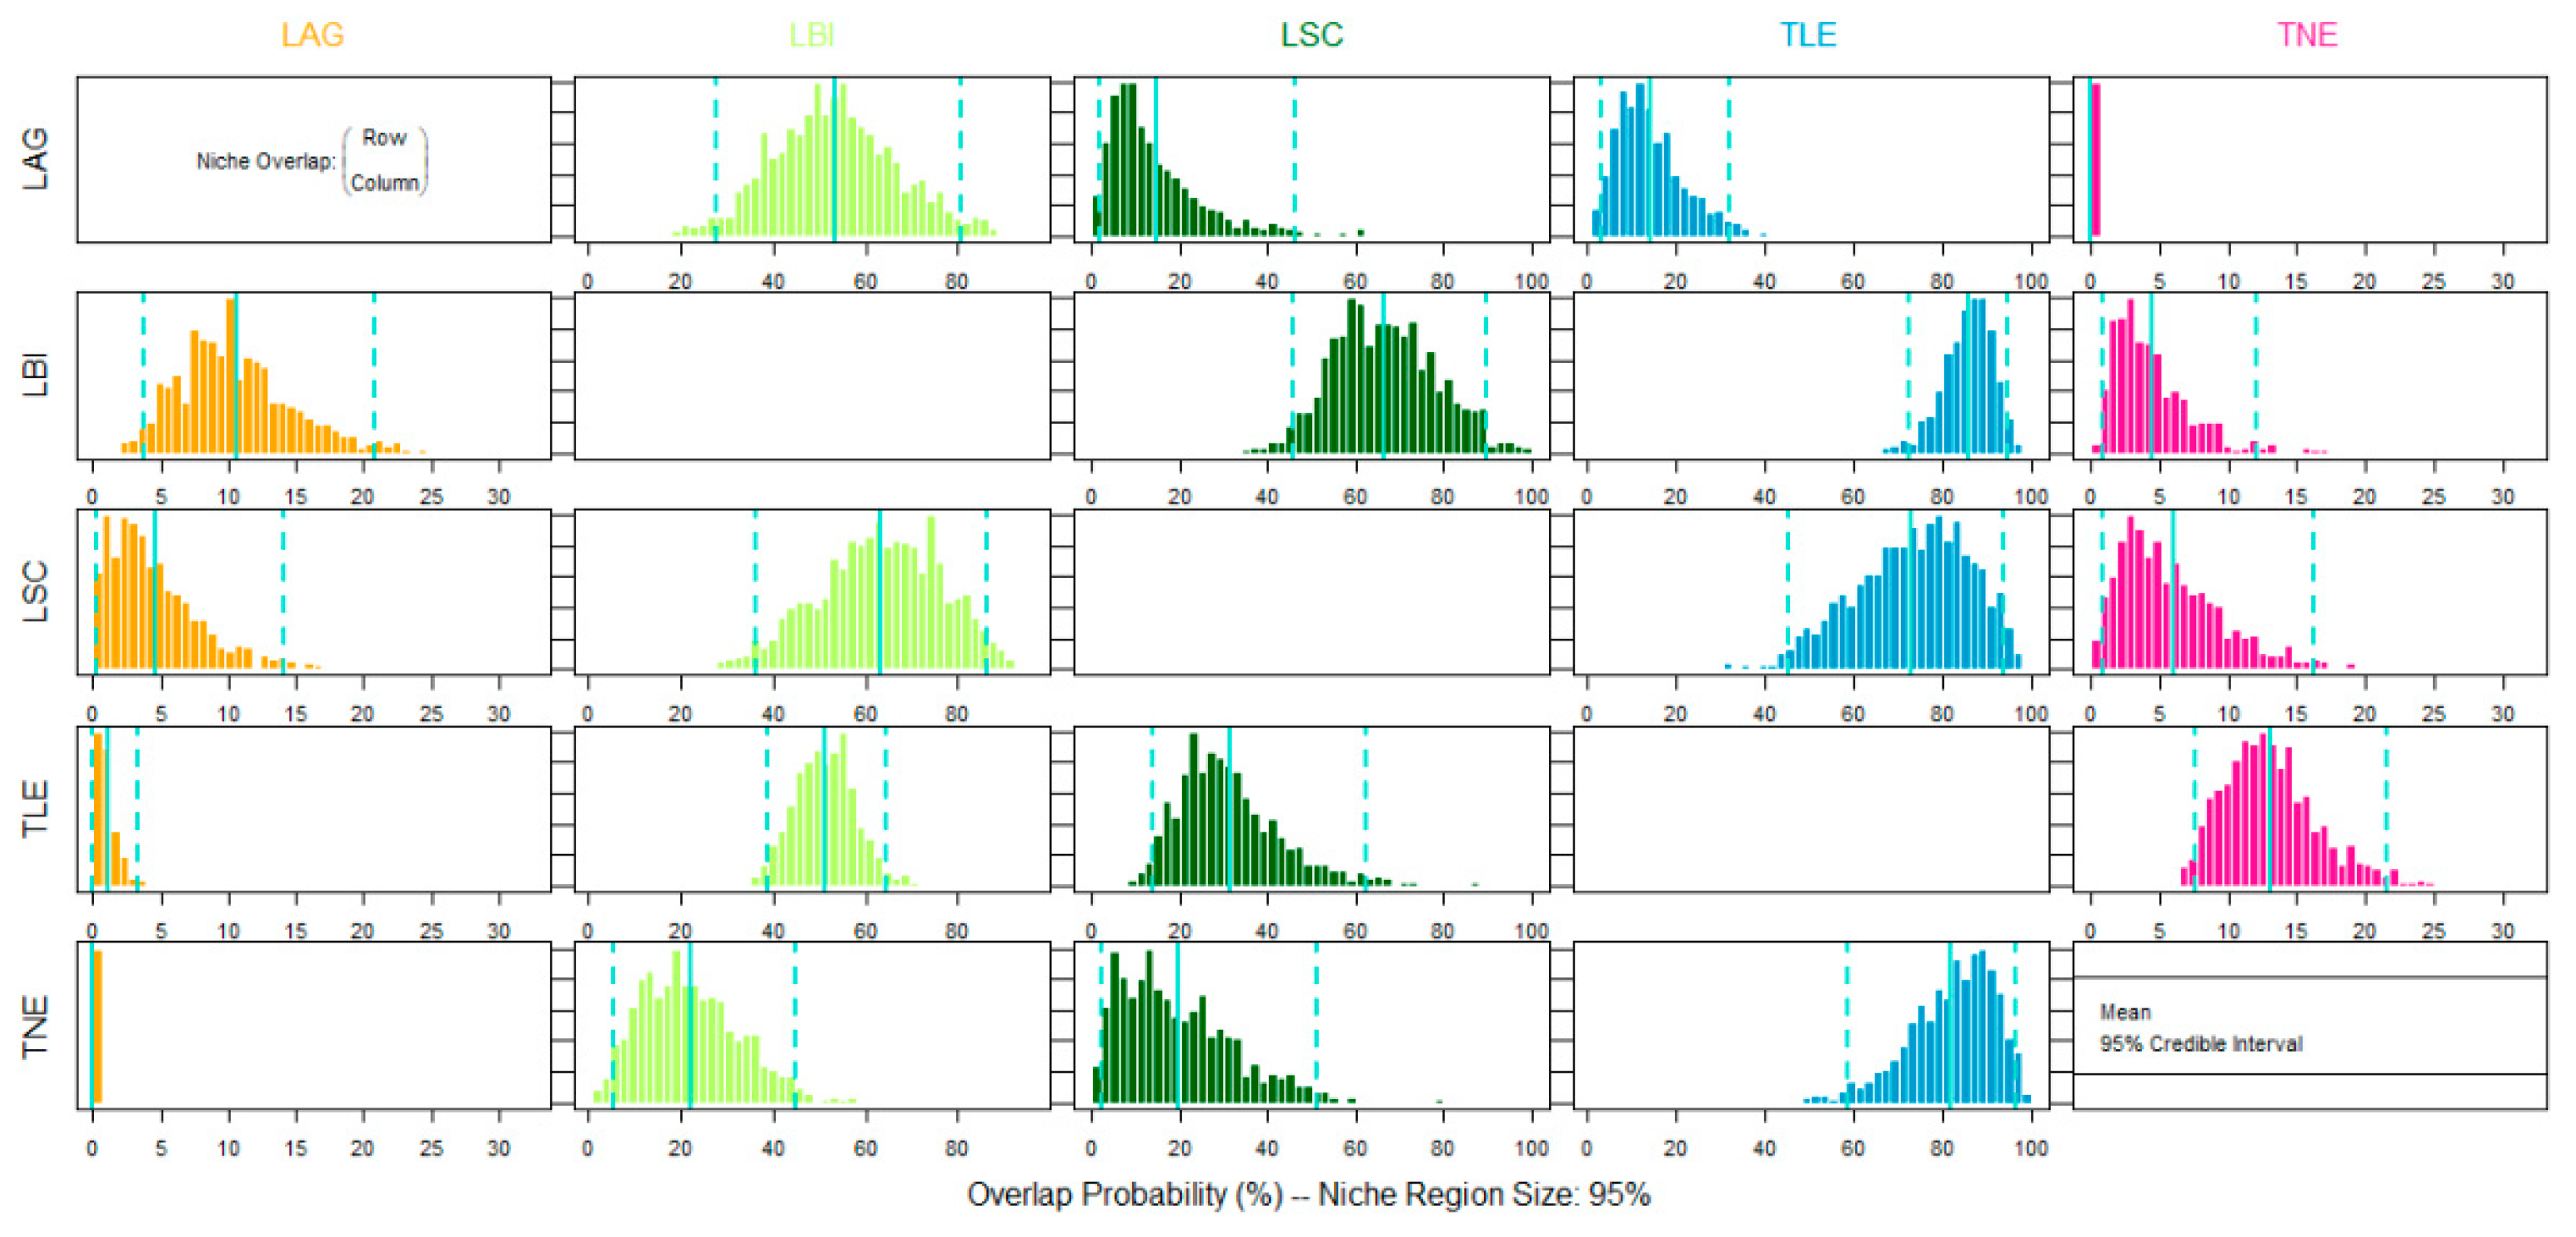
The niche overlap indices showed high values (>60) between pairs of sister species; for example, T. nevadensisT. lepidus: 83.03 (Figure 3 and Figure 4 and Table 2). Among phylogenetically more distant species the patterns were complex, including high (e.g., L. schreiberiL. bilineata: 61.59; L. bilineataT. lepidus: 86.03), moderate (L. agilisL. bilineata: 53.54), and low (L. bilineataT. nevadensis: 4.28) levels of overlap, and in some cases no overlap (L. agilisT. nevadensis: 0.0) (Figure 3 and 4 and Table 2). Between some pairs of species, the overlap was highly asymmetric (e.g., L. agilis-L. bilineata, T. lepidus-L. schreiberi, and T. lepidus-T. nevadensis) indicating that the niche of species Y (smaller niche) was partially nested within that of species X (larger niche) (Figure 2).
The BGLAMs showed than the niche separation between L. agilis-L. bilineata was mainly related to the by maximum-minimum temperatures (R2 = 0.257) (Table 3). The separation between L. agilis-T. lepidus was also attributed to temperature, and to a lesser degree to plant cover (R2 = 0.469). In contrast, the separation between L. bilineata-T. lepidus was mainly related to plant cover and to a lesser extent to the maximum temperature and annual precipitation (R2 = 0.181). Comparisons that included L. schreiberi and T. nevadensis produced statistically poorly supported models and are not shown.
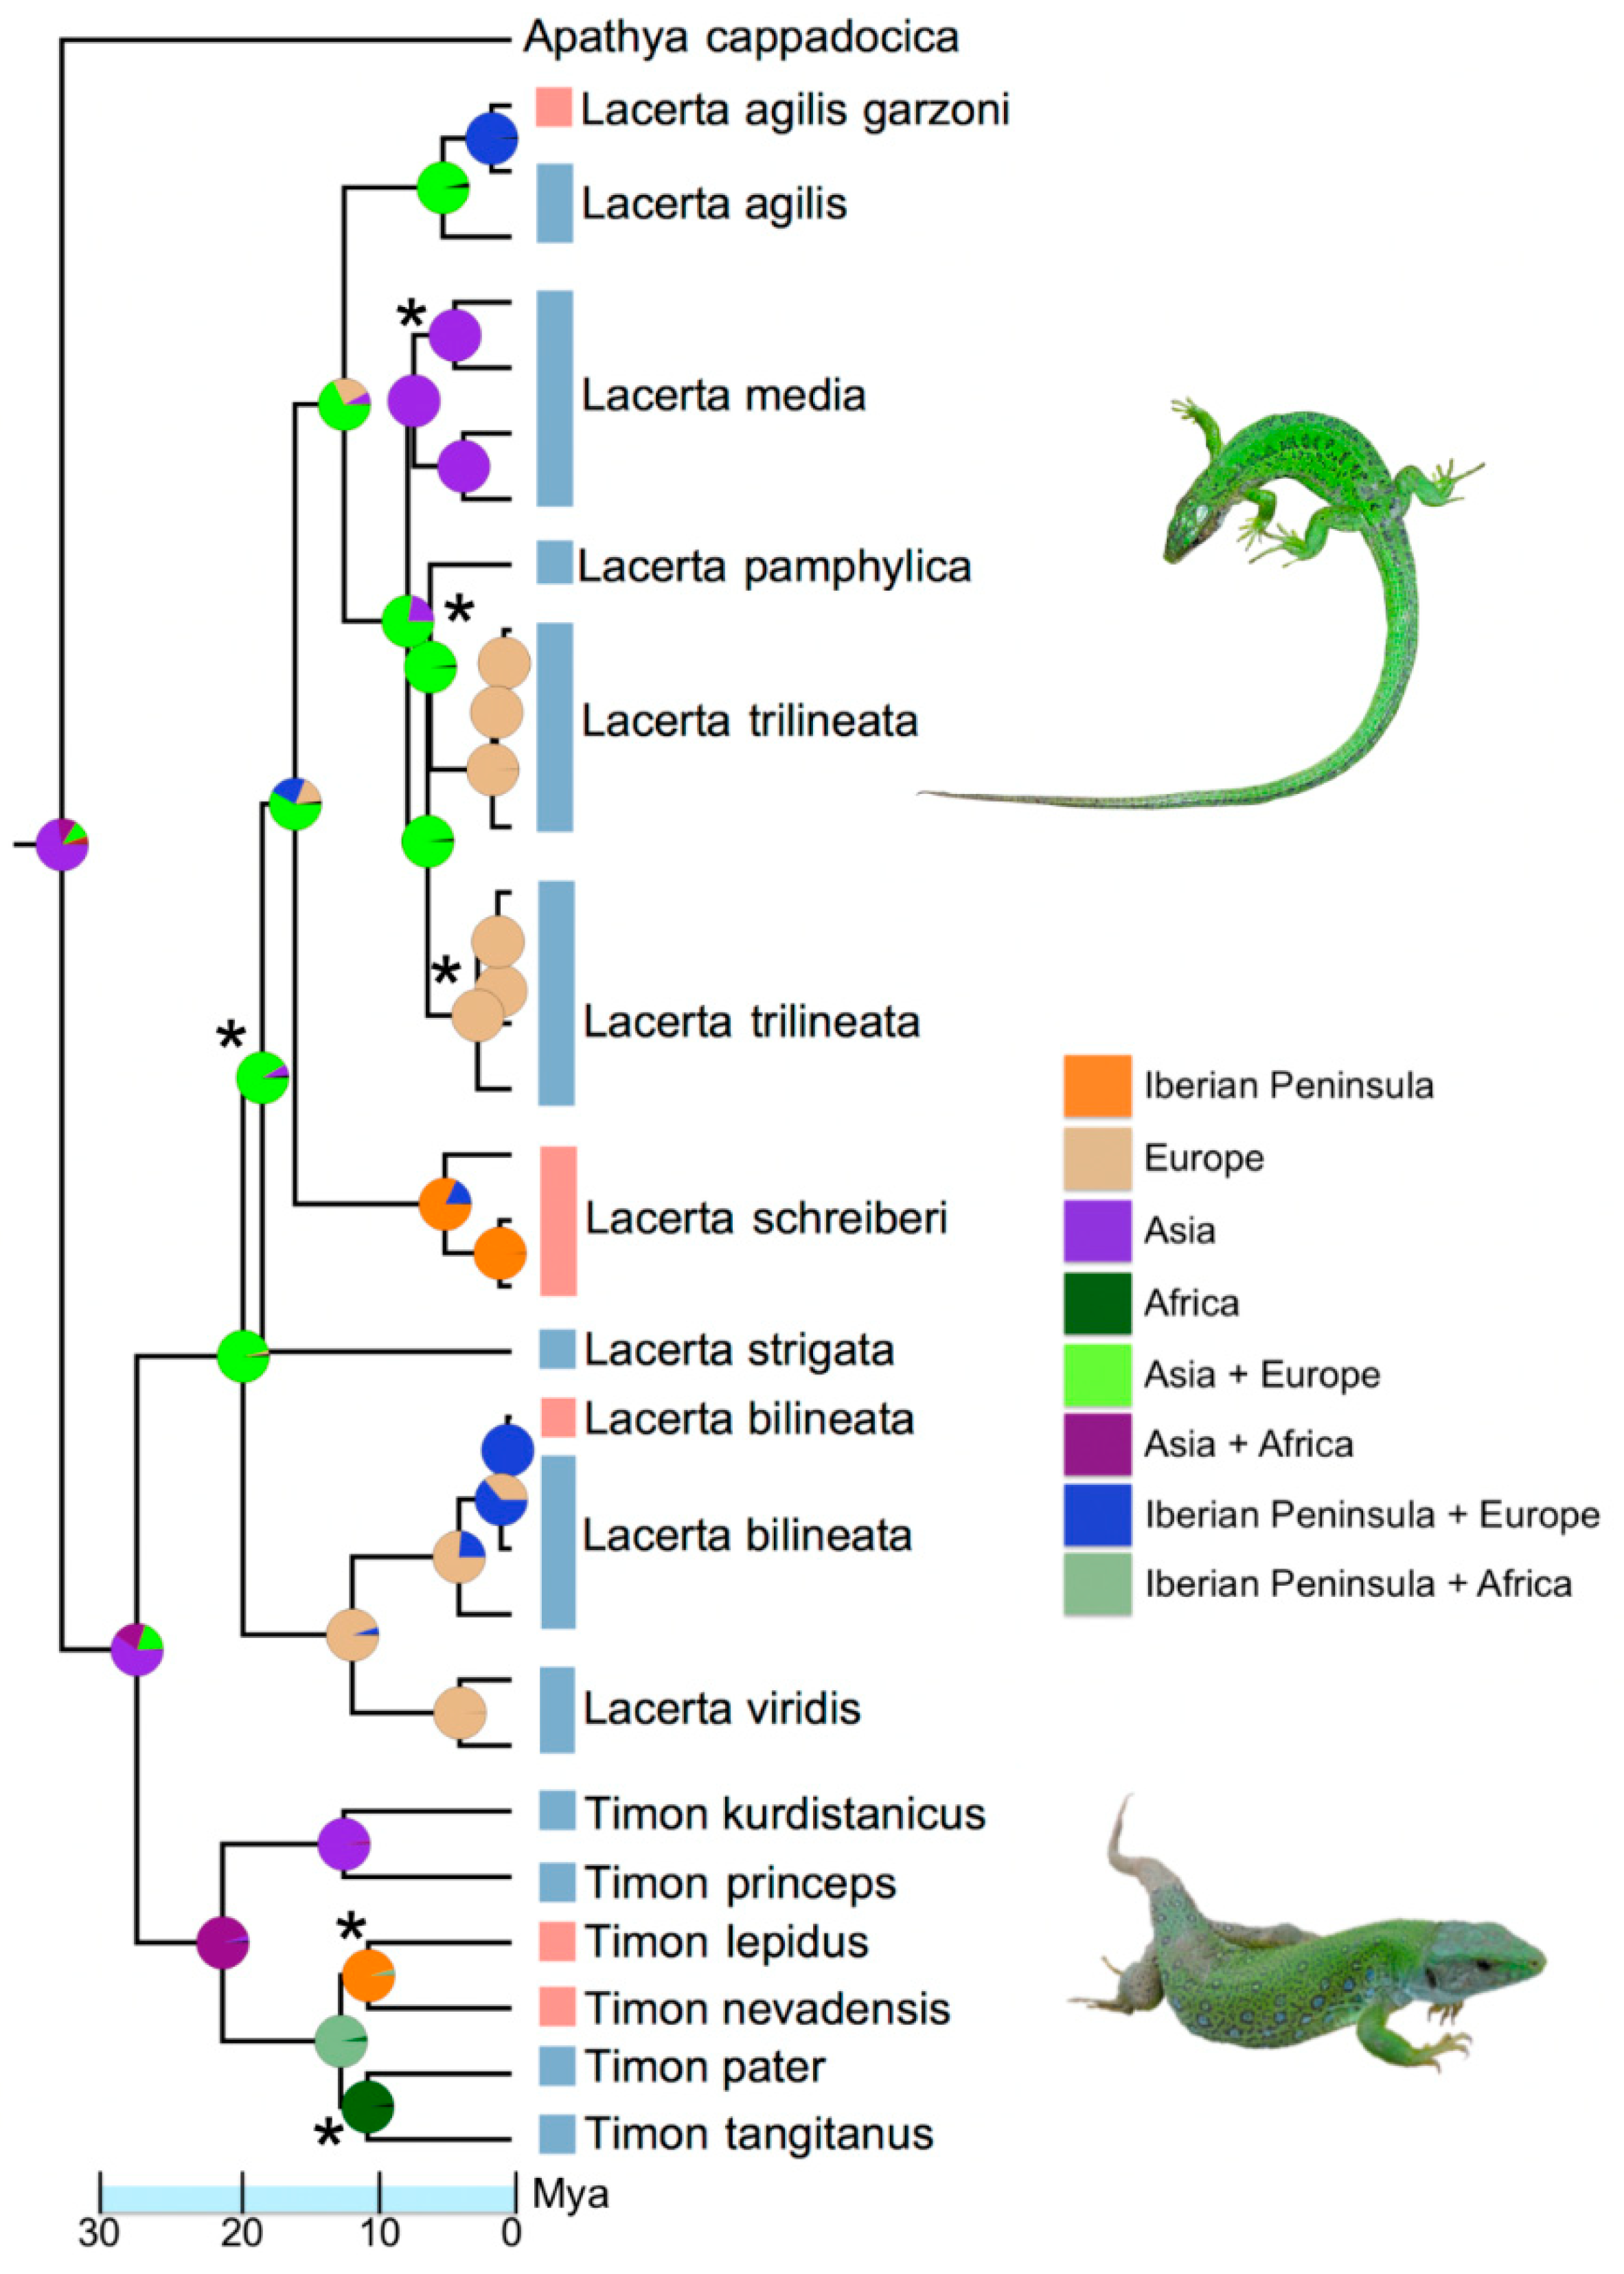
The Bayesian phylogenetic analysis strongly supported the monophyly of the genera Timon and Lacerta, and most of the relationships across species within these genera (Figure 4). The most supported biogeographic model was DIVALIKE +J (AICc = 79.3, AICc weight = 0.630), indicating a founder event (j = 0.047) and low rates of dispersal and extinction (both <0.0001). Based on ancestral range reconstruction, large European lacertids arose in western Asia and independently colonized south-western Europe on four occasions. The oldest colonization event occurred approximately 8.9–15.5 Mya, during the invasion of the western Iberian Peninsula from Europe by the ancestor of L. schreiberi. The ancestor of Timon emigrated from western Asia to north-western Africa, and subsequently invaded the Iberian Peninsula approximately 6.5–13.0 Mya. The split of the ancestral Iberian species into T. lepidus and T. tangitanus probably occurred 4.6–11.5 Mya. The split of L. bilineata from the shared ancestor with L. viridis occurred approximately 8.7–9.4 Mya, possibly after their isolation in the Balkan and Italian peninsulas. Lacerta bilineata recently colonized the Iberian Peninsula from the Italian Peninsula (300,000–550,000 years ago) and the widespread palaearctic species L. agilis, colonized to the eastern Pyrenees from central Europe approximately 0.4–1.8 Mya.

4. Discussion

The OMI analysis showed that in south-western Europe the large lacertid lizards differed in niche marginality and tolerance. In general, environmental variables explained a major part of the variability in the occurrence of these species (residual tolerance 19.2% to 53.3%); an exception was L. schreiberi (residual tolerance 66.9%), possibly as a result of the low number of records. The ecological diversification of these species has possibly been driven by physiological tolerance, particularly variability in preferred temperature and the level of environmental moisture [47].
The analysis also indicated that T. lepidus and L. bilineata had the highest ecological tolerances, potentially enabling them to occupy parts of the niches of the other species. In contrast, T. nevadensis and L. agilis, occupied relatively narrow niches, at opposite extremes of the environmental range. Ecological partitioning was evident, but incomplete, between L. agilis and L. bilineata (maximum overlap probability 53.54%) and between L. agilis-T. lepidus (maximum overlap probability 14.76%). These species pairs consistently showed either geographical overlap (L. agilis-L. bilineata 170,990 km2) or were almost completely parapatric (L. agilis-T. lepidus).
Regression models showed that the segregation between L. agilis and these species of lacertids (L. bilineata and T. lepidus) was mainly influenced by the variables describing temperature conditions, with the occurrence of L. agilis being negatively associated with temperature. This is consistent with the relict status of this species in the region, where it appears mainly isolated to mountain ranges, at altitudes above 1300 m [48]. The BGLAMs revealed that vegetation cover was unrelated to the niche partitioning between L. agilis and L. bilineata, possibly because of the use of open habitats in harsh subalpine environments by the later species [15,49].
There was wide but asymmetric overlap in the niches of T. lepidus and L. bilineata, and the niche of the latter was partially nested within that of T. lepidus. Both species also coexist over a wide geographic range (110,203 km2), but T. lepidus is more widespread in the Iberian Peninsula. The later arrival of L. bilineata to the Iberian Peninsula may have been a disadvantage for this species, with it being excluded from potentially suitable habitats by the other lacertid species that evolved in this region (T. lepidus, L. schreiberi). Our results indicated that in the zone of coexistence between T. lepidus and L. bilineata, the species were largely segregated according to the vegetation cover. In general, forest habitats constitute unfavorable habitat for temperate lacertid lizards, which regulate their body temperature by sun basking [50]. The canopy of temperate forests greatly reduces light transmittance to the lower understory layers [51]. For this reason, closed forests are usually avoided by lacertid lizards, although they can colonize discontinuities in these habitats including path edges, interspersed meadows, forest margins and rocky outcrops [52,53,54]. Lacerta bilineata exploits microhabitats with a very dense vegetation cover, because this lizard thermoregulates efficiently using bushes and tree logs as basking platforms [47,55].
OMI and overlap analyses showed similarities in the patterns of habitat occupancy, between the species pairs T. lepidus-T. nevadensis and L. schreiberi-L. bilineata, and T. nevadensis niche was almost completely nested within that of T. lepidus. Timon nevadensis typically occupies relatively sparsely vegetated semiarid habitats, but T. lepidus is also able to exploit open, de-vegetated habitats in regions where T. nevadensis does not occur (e.g., in the shrub-steppes of the Ebro valley; [56]). These findings suggest that the range limits of both species may be sustained by interspecific interactions in the contact zones rather than by ecotonal transitions [57]. Our results showed a substantial habitat overlap between L. schreiberi-L. bilineata, which may trigger competitive interactions where both species contact geographically [58,59]. The results did not indicate that the species of Iberian origin (L. schreiberi, T. lepidus, and T. nevadensis) have greater habitat overlap than those of recent arrivals (e.g., L. bilineata and L. agilis). It is possible that during the prolonged isolation in the Iberian Peninsula these species diverged in their environmental niches, to reduce interspecific competition. Together these results indicate that the interaction of several mechanisms (i.e., interspecific competition, species evolutionary history, ecophysiological tolerance) determine the occurrence of large lizard species in the region, in a similar way to that observed for other lizard assemblages [60,61]. However, one limitation of our study was that it was not able to discern the relative importance of autoecological and synecological aspects of the distribution patterns.

5. Conclusions

The Iberian Peninsula has the richest lacertid fauna in south-western Europe, supporting five species of large lacertids. Our results revealed that this species richness is favored by climate niche partitioning, but with transitional areas of overlap where the segregation is maintained by species-specific responses to the level of vegetation cover. Interspecific competition may also play a key role in the patterns of occurrence, with the species that have arrived more recently on the Iberian Peninsula having been excluded from potentially favorable habitats because of prior habitat occupancy by species that evolved in this region. The occurrence of several independent evolutionary lineages has partly contributed to the species richness, which has been favored by a long history of ecological divergence between subclades having distinct geographic origins. The analyses applied in this study have the advantage of being weakly sensitive to sample size and are robust to spatially aggregated records, so they may be useful in disentangling the patterns of niche partitioning in assemblages including ecologically (or phylogenetically) related species structured by the effect of various interacting factors (i.e., competition, evolutionary history, environmental tolerance), which is characteristic of biotic communities in the Mediterranean region [62,63].

Supplementary Materials

The following are available online at https://www.mdpi.com/article/10.3390/d13040155/s1, Appendix I: Gene Bank accesion numbers and taxa selected for phylogenetic inference.

Author Contributions

Conceptualization, D.E. and F.A.; methodology, D.E. and F.A.; software, D.E. and F.A.; validation, D.E. and F.A.; formal analysis, D.E. and F.A.; investigation, D.E. and F.A.; resources, D.E.; writing—original draft preparation, D.E. and F.A.; writing—review and editing, D.E. and F.A. All authors have read and agreed to the published version of the manuscript.

Funding

This research received no external funding.

Institutional Review Board Statement

Not applicable.

Informed Consent Statement

Not applicable.

Data Availability Statement

The authors confirm that the data supporting the findings of this study are available within the article [and/or] its Supplementary Materials.

Acknowledgments

The authors thank Jihène Ben Hassine, Guillem Pascual, Alberto Sánchez-Vialas, and Roberto López for their assistance during the field work.

Conflicts of Interest

The authors declare no conflict of interest.

References

  1. Jezkova, T.A.; Wiens, J.J. Testing the role of climate in speciation: New methods and applications to squamate reptiles (lizard and snakes). Mol. Ecol. 2018, 27, 2754–2769. [Google Scholar] [CrossRef]
  2. Velasco, J.A.; Martínez-Meyer, E.; Flores-Villela, O.; García, A.; Algar, A.C.; Köhler, G.; Daza, J.M. Climatic niche attributes and diversification in Anolis lizards. J. Biogeogr. 2016, 43, 134–144. [Google Scholar] [CrossRef] [Green Version]
  3. Rozen-Rechels, D.; Farigoule, P.; Agostini, S.; Badiane, A.; Meylan, S.; Le Galliard, J.F. Short-term change in water availability influences thermoregulation behaviours in a dry-skinned ectotherm. J. Anim. Ecol. 2020, 89, 2099–2110. [Google Scholar] [CrossRef]
  4. Grigg, J.W.; Buckley, L.B. Conservatism of lizard thermal tolerances and body temperatures across evolutionary history and geography. Biol. Lett. 2013, 29, 20121056. [Google Scholar] [CrossRef] [Green Version]
  5. Rodríguez, M.Á.; Belmontes, J.A.; Hawkins, B.A. Energy, water and large-scale patterns of reptile and amphibian species richness in Europe. Acta Oecologica 2005, 28, 65–70. [Google Scholar] [CrossRef]
  6. Law, B.S.; Bradley, R.A. Habitat use and basking site selection in the water skink, Eulamprus quoyii. J. Herpetol. 1990, 24, 235–240. [Google Scholar] [CrossRef]
  7. Capula, M.; Luiselli, L.; Rugiero, L. Comparative ecology in sympatric Podarcis muralis and P. sicula (Reptilia: Lacertidae) from the historical centre of Rome: What about competition and niche segregation in an urban habitat? Ital. J. Zool. 1993, 60, 287–291. [Google Scholar]
  8. Escoriza, D. Patterns of alpha diversity among Tunisian lizards (Lacertidae). J. Arid Environ. 2018, 151, 23–30. [Google Scholar] [CrossRef]
  9. Speybroeck, J.; Beukema, W.; Bok, B.; Van Der Voort, J. Field Guide to the Amphibians and Reptiles of Britain and Europe; Bloomsbury: London, UK, 2016. [Google Scholar]
  10. Arnold, E.N. Resource partition among lacertid lizards in southern Europe. J. Zool. Lond. B 1987, 1, 739–782. [Google Scholar] [CrossRef]
  11. Pollo, C.J.; Pérez-Mellado, V. An analysis of a Mediterranean assemblage of three small lacertid lizards in central Spain. Acta Oecologica 1991, 12, 655–671. [Google Scholar]
  12. Escoriza, D.; Pascual, G.; Sánchez-Vialas, A. Habitat use in south-west European skinks (genus Chalcides). PeerJ 2018, 6, e4274. [Google Scholar] [CrossRef] [PubMed] [Green Version]
  13. Tonini, J.F.R.; Beard, K.H.; Ferreira, R.B.; Jetz, W.; Pyron, R.A. Fully-sampled phylogenies of squamates reveal evolutionary patterns in threat status. Biol. Conserv. 2016, 204, 23–31. [Google Scholar] [CrossRef]
  14. Labra, A.; Pienaar, J.; Hansen, T.F. Evolution of thermal physiology in Liolaemus lizards: Adaptation, phylogenetic inertia, and niche tracking. Am. Nat. 2009, 174, 204–220. [Google Scholar] [CrossRef] [PubMed]
  15. Amat, F.A.; Llorente, G.A.; Carretero, M.A. A preliminary study on thermal ecology, activity times and microhabitat use of Lacerta agilis (Squamata: Lacertidae) in the Pyrenees. J. Zool. 2003, 52, 413–422. [Google Scholar]
  16. Salvador, A. Reptiles, 2a Edición Revisada y Aumentada; Fauna Ibérica; MNCN-CSIC: Madrid, Spain, 2014; Volume 10. [Google Scholar]
  17. Wiens, J.J.; Graham, C.H. Niche conservatism: Integrating evolution, ecology, and conservation biology. Annu. Rev. Ecol. Evol. Syst. 2005, 36, 519–539. [Google Scholar] [CrossRef] [Green Version]
  18. Kriticos, D.J.; Webber, B.L.; Leriche, A.; Ota, N.; Macadam, I.; Bathols, J.; Scott, J.K. CliMond: Global high-resolution historical and future scenario climate surfaces for bioclimatic modelling. Methods Ecol. Evol. 2012, 3, 53–64. [Google Scholar] [CrossRef]
  19. Cuttelod, A.; García, N.; Abdul Malak, D.; Temple, H.; Katariya, V. The Mediterranean: A Biodiversity Hotspot under Threat. In The 2008 Review of The IUCN Red List of Threatened Species; Vié, J.-C., Hilton-Taylor, C., Stuart, S.N., Eds.; IUCN: Gland, Switzerland, 2020. [Google Scholar]
  20. Losos, J.B.; Marks, J.C.; Schoener, T.W. Habitat use and ecological interactions of an introduced and a native species of Anolis lizard on Grand Cayman, with a review of the outcomes of anole introductions. Oecologia 1993, 95, 525–532. [Google Scholar] [CrossRef]
  21. Fick, S.E.; Hijmans, R.J. WorldClim 2: New 1-km spatial resolution climate surfaces for global land areas. Int. J. Climatol. 2017, 37, 4302–4315. [Google Scholar] [CrossRef]
  22. Araújo, M.B.; Thuiller, W.; Pearson, R.G. Climate warming and the decline of amphibians and reptiles in Europe. J. Biogeogr. 2006, 33, 1712–1728. [Google Scholar] [CrossRef]
  23. Huete, A.; Didan, K.; Miura, T.; Rodriguez, E.P.; Gao, X.; Ferreira, L.G. Overview of the radiometric and biophysical performance of the MODIS vegetation indices. Remote Sens. Environ. 2002, 83, 195–213. [Google Scholar] [CrossRef]
  24. Waring, R.H.; Coops, N.C.; Fan, W.; Nightingale, J.M. MODIS enhanced vegetation index predicts tree species richness across forested ecoregions in the contiguous USA. Remote Sens. Environ. 2006, 103, 218–226. [Google Scholar] [CrossRef]
  25. Didan, K. MOD13Q1 Modis/Terra Vegetation Indices 16-Day L3 Global 250m SIN Grid V006. Nasa Eosdis Land Processes DAAC. Available online: https://modis.ornl.gov (accessed on 10 October 2020).
  26. de Oliveira, B.S.; Ferreira, M.E.; Coutinho, A.C.; Esquerdo, J.C. Phenological-metric algorithm for mapping soybean in savanna biome in Brazil. Aust. J. Crop Sci. 2019, 13, 1456–1466. [Google Scholar] [CrossRef]
  27. Templeton, A.R.; Brazeal, H.; Neuwald, J.L. The transition from isolated patches to a metapopulation in the eastern collared lizard in response to prescribed fires. Ecology 2011, 92, 1736–1747. [Google Scholar] [CrossRef] [PubMed] [Green Version]
  28. Dolédec, S.; Chessel, D.; Gimaret-Carpentier, C. Niche separation in community analysis: A new method. Ecology 2000, 81, 2914–2927. [Google Scholar] [CrossRef]
  29. Dray, S.; Dufour, A.B. The ade4 package: Implementing the duality diagram for ecologists. J. Stat. Softw. 2007, 22, 1–20. [Google Scholar] [CrossRef] [Green Version]
  30. R Development Core Team. R: A Language and Environment for Statistical Computing; R Foundation for Statistical Computing: Vienna, Austria, 2020. Available online: https://www.R-project.org (accessed on 10 September 2020).
  31. Swanson, H.K.; Lysy, M.; Power, M.; Stasko, A.D.; Johnson, J.D.; Reist, J.D. A new probabilistic method for quantifying n-dimensional ecological niches and niche overlap. Ecology 2015, 96, 318–324. [Google Scholar] [CrossRef] [PubMed]
  32. Lysy, M.; Stasko, A.D.; Swanson, H.K. nicheROVER: (Niche) (R)Egion and Niche (Over)Lap Metrics for Multidimensional Ecological Niches. R Package Version 1.0. Available online: https://CRAN.R-project.org/package=nicheROVER (accessed on 4 December 2020).
  33. Legendre, P. Spatial autocorrelation: Trouble or new paradigm? Ecology 1993, 7, 1659–1673. [Google Scholar] [CrossRef]
  34. Waller, L.A. Spatial Models for Categorical Data. In Wiley StatsRef: Statistics Reference Online; Wiley: New York, NY, USA, 2014. [Google Scholar]
  35. Burnham, K.P.; Anderson, D.R. A practical information-theoretic approach. In Model Selection and Multimodel Inference, 2nd ed.; Springer: New York, NY, USA, 2002. [Google Scholar]
  36. Bivand, R.S.; Wong, D.W. Comparing implementations of global and local indicators of spatial association. Test 2018, 27, 716–748. [Google Scholar] [CrossRef]
  37. Mazerolle, M.J. AICcmodavg: Model Selection and Multimodel Inference Based on (Q)AIC(c). R Package Version 2.3-1. Available online: https://cran.r-project.org/package=AICcmodavg (accessed on 6 January 2021).
  38. Hall, T.A. BioEdit: A user-friendly biological sequence alignment editor and analysis program for Windows 95/98/NT. Nucleic Acids Symp. Ser. 1999, 41, 95–98. [Google Scholar]
  39. Posada, D. jModelTest: Phylogenetic model averaging. Mol. Biol. Evol. 2008, 25, 1253–1256. [Google Scholar] [CrossRef]
  40. Carranza, S.; Arnold, E.N.; Amat, F. DNA phylogeny of Lacerta (Iberolacerta) and other lacertine lizards (Reptilia: Lacertidae): Did competition cause long-term mountain restriction? Syst. Biod. 2004, 2, 57–77. [Google Scholar] [CrossRef] [Green Version]
  41. Cernansky, A. Earliest world record of green lizards (Lacertilia, Lacertidae) from the Lower Miocene of Central Europe. Biologia 2010, 65, 737–741. [Google Scholar] [CrossRef]
  42. Venczel, M. Lizards from the late Miocene of Polgárdi (W-Hungary). Nymphaea 2006, 33, 25–38. [Google Scholar]
  43. Bouckaert, R.; Vaughan, T.G.; Barido-Sottani, J.; Duchêne, S.; Fourment, M.; Gavryushkina, A.; Heled, J.; Jones, G.; Kühnert, D.; De Maio, N.; et al. BEAST 2.5: An advanced software platform for Bayesian evolutionary analysis. PLoS Comp. Biol. 2019, 15, e1006650. [Google Scholar] [CrossRef] [Green Version]
  44. Rambaut, A.; Drummond, A.J. Tracer, Version 1.4. 2007. Available online: http://beast.bio.ed.ac.uk/Tracer (accessed on 10 September 2015).
  45. Yu, Y.; Harris, A.J.; Blair, C.; He, X. RASP (Reconstruct Ancestral State in Phylogenies): A tool for historical biogeography. Mol. Phyl. Evol. 2015, 87, 46–49. [Google Scholar] [CrossRef]
  46. Akaike, H. A new look at the statistical model identification. IEEE Tran. Autom. Cont. 1974, 19, 716–723. [Google Scholar] [CrossRef]
  47. Saint Girons, M.C. Relations interspécifiques et cycle d’activité chez Lacerta viridis et Lacerta agilis (Sauria, Lacertidae). Vie et Milieu 1976, 26, 115–132. [Google Scholar]
  48. Geniez, P.; Cheylan, M. Les Amphibiens et Les Reptiles du Languedoc-Roussillon et Régions Limitrophes: Atlas Biogéographique; Biotope: Mèze, France, 2012. [Google Scholar]
  49. Arribas, O.J. Distribución y estatus de Lacerta agilis y Zootoca vivipara en Cataluña. Bull. Soc. Catalana Herpetol. 1999, 14, 10–21. [Google Scholar]
  50. House, S.M.; Taylor, P.J.; Spellerberg, I.F. Patterns of daily behaviour in two lizard species Lacerta agilis L. and Lacerta vivipara Jacquin. Oecologia 1979, 44, 396–402. [Google Scholar] [CrossRef] [PubMed]
  51. Sercu, B.K.; Baeten, L.; van Coillie, F.; Martel, A.; Lens, L.; Verheyen, K.; Bonte, D. How tree species identity and diversity affect light transmittance to the understory in mature temperate forests. Ecol. Evol. 2017, 7, 10861–10870. [Google Scholar] [CrossRef] [PubMed]
  52. García, J.D.D.; Arévalo, J.R.; Fernández-Palacios, J.M. Road edge effect on the abundance of the lizard Gallotia galloti (Sauria: Lacertidae) in two Canary Islands forests. Biodivers. Conserv. 2007, 16, 2949–2963. [Google Scholar] [CrossRef]
  53. Amo, L.; López, P.; Martín, J. Natural oak forest vs. ancient pine plantations: Lizard microhabitat use may explain the effects of ancient reforestations on distribution and conservation of Iberian lizards. Biodivers. Conserv. 2007, 16, 3409–3422. [Google Scholar] [CrossRef]
  54. Schiavo, R.M.; Ferri, V. Ciclo annuale di Lacerta bilineata (Daudin, 1802) nella pianura padana lombarda. Pianura 1996, 10, 5–12. [Google Scholar]
  55. Nettmann, H.K.; Rykena, S. Lacerta viridis (Laurenti, 1768)—Smaragdeidechse. In Handbuch der Reptilien und Amphibien Europas; Band 2/I. Echsen II (Lacerta); Bohme, W., Ed.; Aula-Verlag: Wiesbaden, Germany, 1984; pp. 129–189. [Google Scholar]
  56. Suárez, F.; Manrique, J. Low breeding success in Mediterranean shrubsteppe passerines: Thekla lark Galerida theklae, lesser short-toed lark Calandrella rufescens, and black-eared wheatear Oenanthe hispanica. Ornis Scand. 1992, 23, 24–28. [Google Scholar] [CrossRef]
  57. Miraldo, A.; Faria, C.; Hewitt, G.M.; Paulo, O.S.; Emerson, B.C. Genetic analysis of a contact zone between two lineages of the ocellated lizard (Lacerta lepida Daudin 1802) in south-eastern I beria reveal a steep and narrow hybrid zone. J. Zool. Syst. Evol. Res. 2013, 51, 45–54. [Google Scholar] [CrossRef] [Green Version]
  58. Barbadillo, L.J. Nuevas citas herpetológicas para la Provincia de Burgos. Rev. Esp. Herpetol. 1986, 1, 57–61. [Google Scholar]
  59. Delibes, A.; Salvador, A. Censos de lacértidos en la cordillera Cantábrica. Rev. Esp. Herpetol. 1986, 1, 335–361. [Google Scholar]
  60. Barbault, R.; Stearns, S. Towards an evolutionary ecology linking species interactions, life-history strategies and community dynamics: An introduction. Acta Oecologica 1991, 12, 3–10. [Google Scholar]
  61. Spawls, S.; Rotich, D. An annotated checklist of the lizards of Kenya. J. East Afr. Nat. Hist. 1997, 86, 61–83. [Google Scholar] [CrossRef] [Green Version]
  62. Thompson, J.D.; Lavergne, S.; Affre, L.; Gaudeul, M.; Debussche, M. Ecological differentiation of Mediterranean endemic plants. Taxon 2005, 54, 967–976. [Google Scholar] [CrossRef] [Green Version]
  63. Hampe, A.; Arroyo, J.; Jordano, P.; Petit, R.J. Rangewide phylogeography of a bird-dispersed Eurasian shrub: Contrasting Mediterranean and temperate glacial refugia. Mol. Ecol. 2003, 12, 3415–3426. [Google Scholar] [CrossRef] [PubMed]
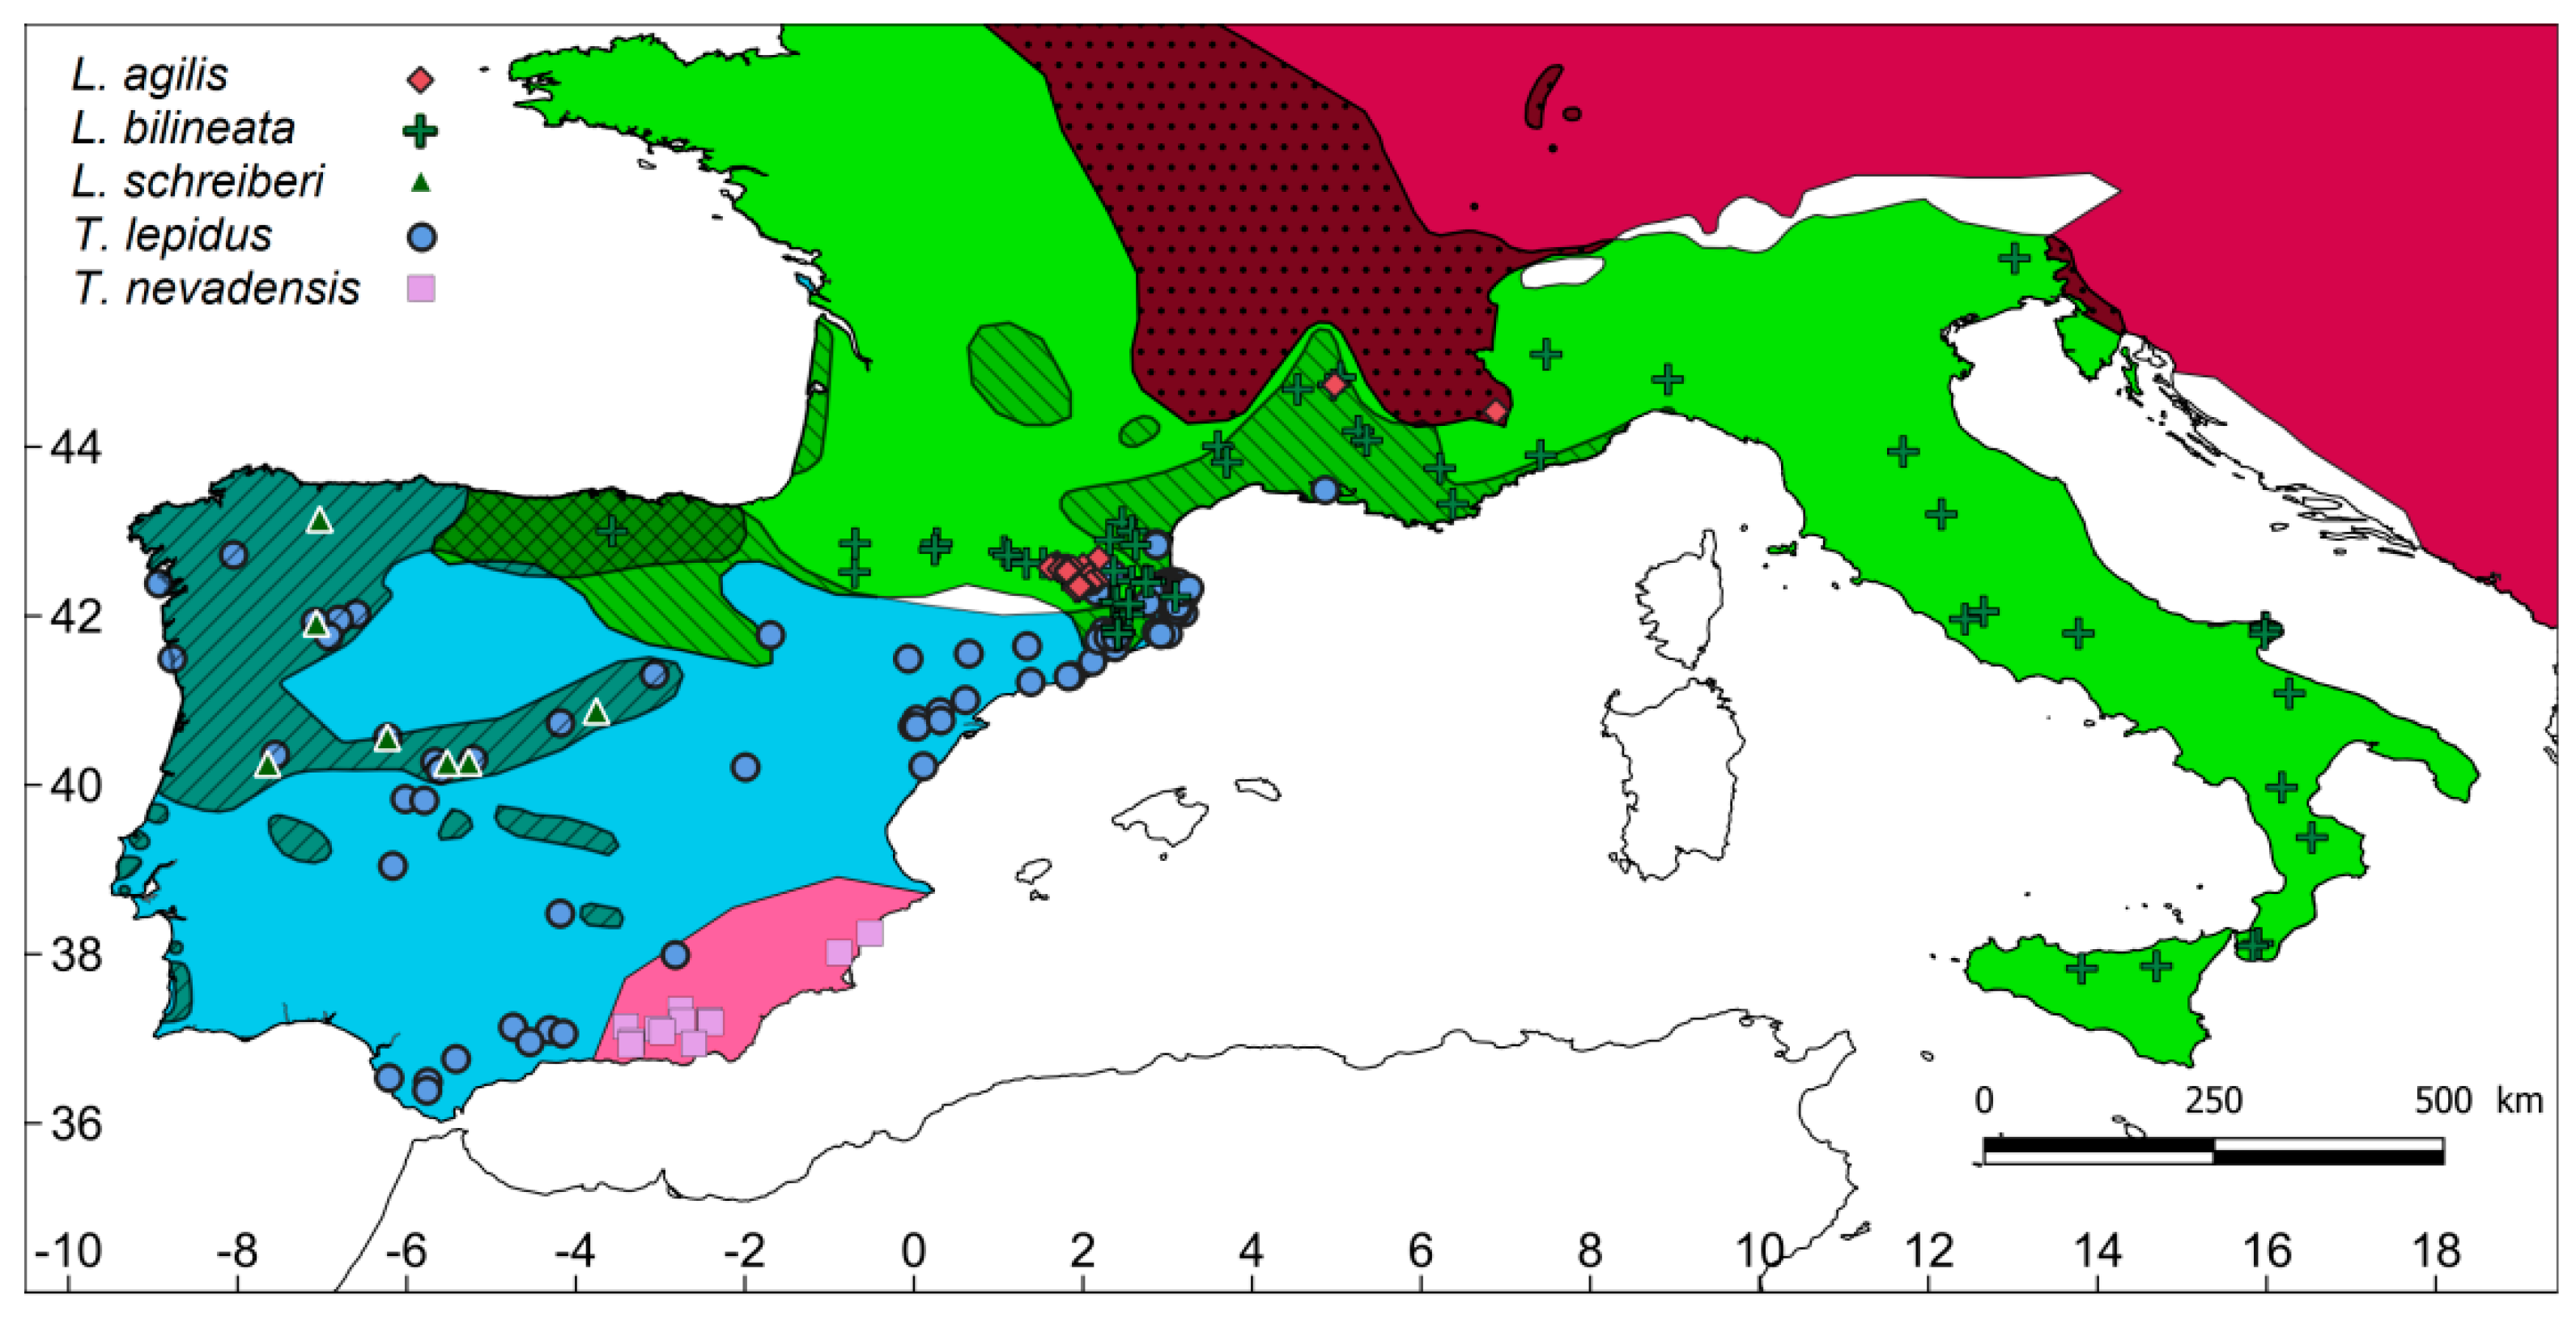
Figure 1. Map of the study region including the distribution of the species according to the IUCN (polygons) and the surveyed sites (circles). The polygons with diagonal stripes and dots indicate the areas of geographic overlap between two species or three species (grid).
Diversity 13 00155 g001
Figure 2. Outlying mean index (OMI) scatter plot. The lower panel shows the species sites, with a convex hull encompassing those that were conspecific. The upper panel shows the environmental factors represented as vectors. The plot origin (0,0) represents the average environmental conditions. LAG = L. agilis; LBI = L. bilineata; LSC = L. schreiberi; TLE = T. lepidus; TNE = T. nevadensis.
Diversity 13 00155 g002
Figure 3. Ecological overlap between large lacertid species in southwestern Europe, estimated with the posterior distribution of the probabilistic niche overlap metric (%) for the niche region of alpha = 0.95. The posterior mean and 95% credible intervals are shown in sky blue lines.LAG = L. agilis; LBI = L. bilineata; LSC = L. schreiberi; TLE = T. lepidus; TNE = T. nevadensis.
Diversity 13 00155 g003
Figure 4. Phylogenetic relationships among Lacerta and Timon species estimated using Bayesian analysis on Cytochrome b and 12s mitochondrial genes. Asterisks denoted those nodes supported by posterior probabilities lower than 0.90. Pie charts depicted the probability of occurrence of the ancestors within the eight areas defined by the BioGeoBears analysis.
Diversity 13 00155 g004
Table 1. Niche indices generated for the large lacertids in southwestern Europe. OMI, distance of the species’ centroid to the average environmental conditions; Tolerance, niche breadth; Rtol, residual tolerance.
OMITolRtol
L. agilis74.46.419.2
L. bilineata30.318.351.5
L. schreiberi20.212.866.9
T. lepidus24.122.653.3
T. nevadensis66.07.226.8
Table 2. Niche overlap between southwestern European large lacertid species. The overlap index described the probability that species X (row) appears in the habitat of the species Y (column), for a region α = 0.95.
L. agilisL. bilineataL. schreiberiT. lepidusT. nevadensis
L. agilis53.5414.4814.760.0003
L. bilineata10.4365.5686.034.28
L. schreiberi4.5461.5971.935.69
T. lepidus1.0751.2130.5813.17
T. nevadensis0.022.2718.2883.03
Table 3. Binomial Generalized Linear Auto-Covariate Models (BGLAMs) evaluating the environmental separation between pairs of species which geographically contact. Lacerta schreiberi and T. nevadensis were not included in the analyses. AIC, Akaike information criterion; AICWt, AIC weights. LAG = L. agilis; LBI = L. bilineata; TLE = T. lepidus. T, temperature; Prec, precipitations; EVI, Enhanced Vegetation Index; m, mean; cv, coefficient of variation.
AICAICWtR2VariablesEstimates
LAG-LBI35.970.310.241Tmin–2.971
37.330.160.257Tmin
Tmax
–2.288
–0.789
LAG-TLE23.950.370.411Tmax–3.060
25.800.150.416Tmax
Tmin
–2.726
–0.566
26.310.110.469Tmax
Tmin
EVIm
–2.408
–0.684
–1.534
LBI-TLE63.310.300.144EVIm1.264
64.640.160.154EVIm
EVIcv
1.286
0.275
64.850.140.181EVIm
Tmax
Prec
1.133
–0.658
0.301
Publisher’s Note: MDPI stays neutral with regard to jurisdictional claims in published maps and institutional affiliations.