Article

Monitoring Brazilian Cavefish: Ecology and Conservation of Four Threatened Catfish of Genus Ituglanis (Siluriformes: Trichomycteridae) from Central Brazil

by
Maria Elina Bichuette
1,* and
Eleonora Trajano
2
1
Laboratório de Estudos Subterrâneos, Departamento de Ecologia e Biologia Evolutiva, Universidade Federal de São Carlos, Rodovia Washington Luís km 235, P.O. Box 676, 13565-905 São Carlos, São Paulo, Brazil
2
Centro Excursionista Universitário (CEU), Rua da Reitoria/USP, 05508-220 São Paulo, São Paulo, Brazil
*
Author to whom correspondence should be addressed.
Diversity 2021, 13(2), 91; https://doi.org/10.3390/d13020091
Submission received: 28 December 2020 / Revised: 15 February 2021 / Accepted: 17 February 2021 / Published: 20 February 2021
(This article belongs to the Special Issue Cave Communities: From the Surface Border to the Deep Darkness)

Abstract

:
We investigated population parameters using the capture-mark-recapture method (Ituglanis passensis and I. bambui) and visual censuses (I. epikasrticus and I. ramiroi). The four species are regionally threatened (Brazilian Red List) and occur in caves of Terra Ronca State Park, São Domingos region, Central Brazil. We conducted seven fieldtrips across three years of dry seasons. For the capture-mark-recapture method, a 400 m long stream inside Passa Três cave, where I. passensis occurs and a 300 m long reach of an upper tributary where I. bambui occurs inside Angélica cave were divided into 20 and 17 study sections, respectively. Catfishes were hand-netted, measured (standard length), weighed, marked by subcutaneous injection of biocompatible pigments, and released. The four species show medium-to-low mean population densities (0.03 ind/m2 0.7 ind/m2). Capture-mark-recapture data pointed to a relatively small population size for I. passensis, restricted to a 1600 m long stream inside Passa Três cave (N = 719) and for I. bambui (N = 246; 300 m of epikarstic drainage). Ituglanis passensis and I. bambui move along relatively small areas with a restricted home range. We observed recruitment patterns and a trend of decrease in condition factor during the dry seasons for I. bambui but not for I. passensis, suggesting that epikarstic waters are probably more limiting concerning food input. Ituglanis passensis and I. bambui showed low growth and consequently high longevity, corroborated by captivity data (20 years). We suggest urgent actions and long-term monitoring projects to effectively protect this unique and endemic ichthyofauna.

1. Introduction

Troglobites, characterized by exclusively subterranean species [1], show, in general, small population size [2]. In many cases, this statement is based on inference, taken from the notion of restricted geographic distribution (which applies to many but not all species) associated with low population densities rather than on data obtained through population study methods, such as capture-mark-recapture.
Available data for subterranean fish show that population densities may vary considerably, from very low to very high, and are sometimes higher than their relatives from epigean (surface) environments [3]. This variation can be partly related to the methods of study since the lowest densities are usually recorded in studies that used the visual census method [3].
There is great difficulty in estimating the absolute size of the troglobitic populations, important not only from a scientific point of view but also for conservation purposes. Most of the time, we do not know the full extent of habitats occupied by the species, and the characteristics of the subterranean realm, which is largely inaccessible, prevent accurate studies [3].
Based on literature data, Trajano (2001) proposed a classification for possible population density patterns for troglobitic fish: species with low population densities (<0.1 ind/m2), for example, Nemacheilus troglocataractus, Typhlichthys subterraneus, Pimelodella kronei, Rhamdiopsis krugi (Poço Encantado cave population), and Rhamdiopis sp.; species with medium population densities (0.1–1.0 ind/m2) [4] such as Schistura oedipus, Amblyopsis rosae, Trichomycterus itacarambiensis, and Ancistrus cryptophthalmus; and species with high population densities (1.0 ind/m2), such as Astyanax spp. [5], Poecilia mexicana, and Caecobarbus geertsii. Variability in the densities is observed for Eigenamannia vicentespelaea population (densities varying from 0.04 ind/m2 to 0.17 ind/m2), tending toward low [6], and Rhamdiopsis krugi (densities varying from 0.07 ind/m2 to 9 ind/m2 indicated by personal observation (pers. obs.) from M. E. Bichuette.
Ecological characters usually associated with energy saving comprise the life cycles of many troglobites, which feature strategies tending to K in r-K continuum or early life cycle sensu [7]. Such strategies include production of low fecundity, infrequent reproduction, delayed reproductive maturity, slow individual growth, and high longevity [8], interpreted as adaptations to conditions of low, infrequent, and often unpredictable nutrient supply. One consequence of scarce and infrequent food is the generally small home range, with some cavefish species presenting low individual movements and therefore a sedentary behavior [9,10,11,12], saving energy. However, some studies have shown the contrary, a large home range [13,14].
Because of these attributes, low values of condition factor have been recorded for many cavefish and are attributed to scarce food availability [3], commonly observed (with exceptions) in subterranean habitats. Few studies have produced robust reliable data on growth rates and longevity in troglobitic fish [5,15] for Caecobarbus geertsii, [16,17] for Amblyopsidae cavefish [9,10] and [12] for cave catfishes Pimelodella kronei, Trichomycterus itacarambiensis, and Ancistrus cryptophthalmus, respectively. Such studies have indicated an early life cycle for these species.
Trichomycteridae (Gill, 1872) catfishes represent one of the most diverse groups of Siluriformes (Ostariophysi), with 304 species [18]. Currently, the family Trichomycteridae is considered the third richest in exclusively subterranean species, with 19 troglobites distributed in four genera: Glaphyropoma [19], Silvinichthys [20], Trichomycterus [21,22,23,24,25,26,27], and Ituglanis (six species) [28,29,30,31].
Ituglanis (Costa and Bockmann, 1993) includes six troglobitic species, all from limestone caves in Central Brazil: I. passensis (Fernández and Bichuette, 2002), I. bambui (Bichuette and Trajano, 2004), I. epikarsticus (Bichuette and Trajano, 2004), I. ramiroi (Bichuette and Trajano, 2004), Ituglanis mambai (Bichuette and Trajano, 2008), and Ituglanis boticario (Rizzato and Bichuette, 2014), plus three undescribed species (M.E. Bichuette, pers. obs.). Most species are characterized by reduction until absence of eye and melanic pigmentation [28,29,31].
One of the places with high endemism of subterranean Ituglanis species in Brazil is the São Domingos karst area (upper Tocantins River basin) [32,33]. Four exclusively subterranean Ituglanis occur in caves from Terra Ronca State Park, and all are regionally threatened: I. passensis, I. epikarsticus, and I. ramiroi (vulnerable category, VU) and I. bambui (critically endangered category, CR) [34]. We monitored these populations with the aim to determine some population parameters: population sizes and densities, recruitment, and condition factor (body conditions). These data are useful in conservation proposals to protect and maintain these populations.

2. Materials and Methods

2.1. Study Area and Fish

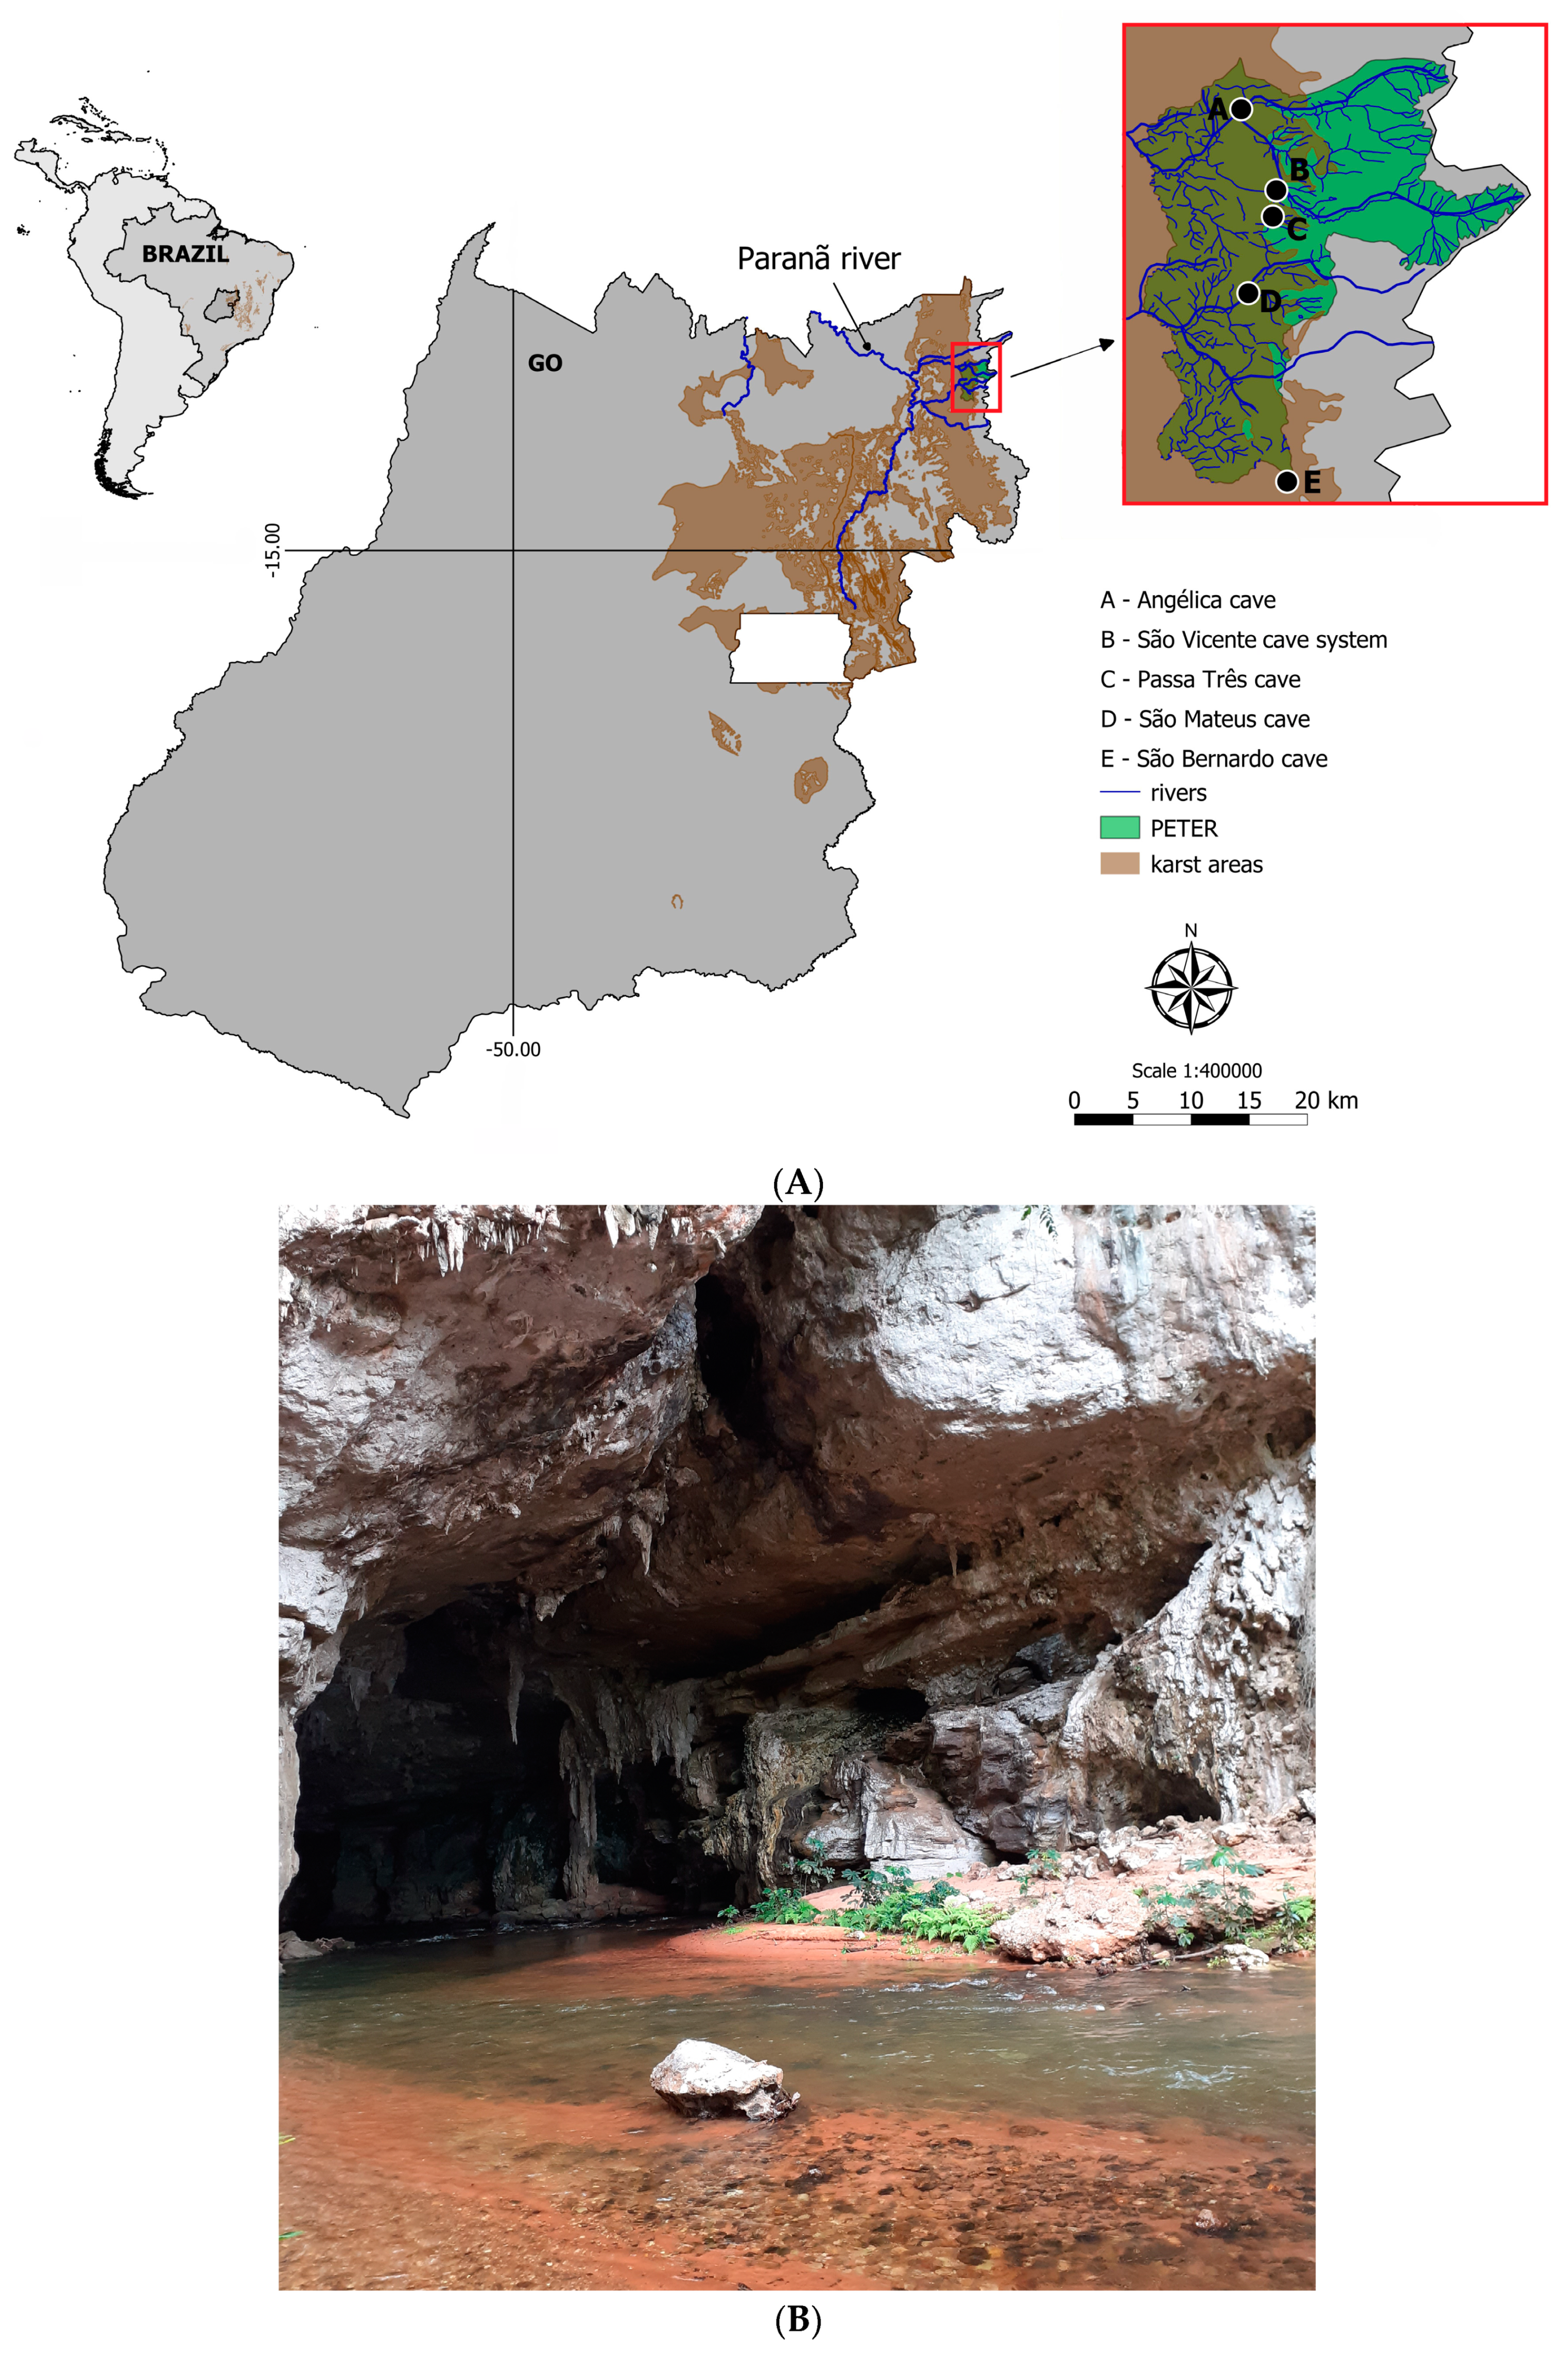
The study sites were located in Terra Ronca State Park (46°10′–46°30′ S, 13°30′–13°50′ W) in the upper Tocantins River basin, State of Goiás, Central Brazil. The park is part of large limestone and sandstone landscape commonly called São Domingos karst area. More than 200 caves occur in the region, including some of the largest cave systems in Brazil (some with more than 20 km of map passageways) (Figure 1A).
The troglobitic populations of all four Ituglanis catfishes from the São Domingos karst area live in the upper levels of subterranean systems isolated from each other by non-karst rocks (Figure 1B). The subterranean streams run parallel westwards and dozens of kilometers downstream until their resurgence; hence, there are no subterranean connections between those populations, which seemingly evolved independently.
The Ituglanis passensis (Figure 2A) population is endemic to Passa Três cave, an upper vadose tributary of the São Vicente cave system, São Domingos karst area, Central Brazil. There is morphological evidence for preterit adaptation to the epikarst, indicating vertical colonization of the subterranean biotope [32].
Among the species that live and disperse through non-cave habitats, I. epikarsticus (Figure 2B) was the first described troglobitic fish adapted to life in the epikarst [29]. The species is known from few specimens found in a set of rimstone pools located ca. 1000 m deep inside São Mateus cave, São Domingos karst area, Central Brazil; this is the only place where such catfish are found. There is no contact between the matrix rock and the rimstone pools; therefore, there is no possibility of horizontal movements to and from non-cave habitats. One possibility for these catfish to reach the rimstone pools is through washing events from the epikarst population. Ituglanis epikarsticus has not been observed anywhere else in the cave, which has been explored by speleologists since the 1970s [29].
Ituglanis bambui (Figure 2C) was described based on specimens found in an upper vadose tributary inside Angélica cave, São Domingos karst area, Central Brazil, located near (ca. 200 m) the cave sinkhole [29]. Later on, several specimens matching I. bambui description were recovered in rimstone pools near the opposite (the resurgence) end of the cave system, approximately 4 km from the first site in a straight line. This indicates that the I. bambui population distributes through the epikarst above Angélica cave. Fish observed in the vadose tributary near the sinkhole may be a small cave peripherical population of the main population [32].
Ituglanis ramiroi (Figure 2D) was first known from specimens collected at side pools (Figure 3D) at the base level stream conduit in São Bernardo cave [29]. Later on, individuals were found in an upper tributary located near the surface level and fed by the epikarst aquifer, above the tributary where the troglobitic Pimelodella spelaea catfish lives [35].
Figure 3A–D below show the details of habitats of the four Ituglanis species.

2.2. Fieldwork

Ituglanis passensis (Passa Três cave) and I. bambui (Angélica cave) were studied in seven fieldtrips conducted across three years (between July 1999 and August 2001), always in the dry season, with variable intervals between each visit: 8–25 July 1999, 3–19 September 1999, 23 April–7 May 2000, 18 July–6 August 2000, 9–19 September 2000, 27 April–14 May 2001, and 5–26 August 2001. After we realized that the marks were lost after a few months due to reabsorption, we visited Passa Três cave twice (with an interval of 11 days) and Angélica cave also twice (with an interval of seven days) in August 2001. Direct observations and capture data were used in the calculations of population parameters. Fieldwork was restricted to the dry season due to the occurrence of flash floods in the rainy season.
To study the I. passensis population, we divided the stream conduit in 20 sections 20 m long, marked with colored plastic tape. Section 1 to Section 4 were located before a waterfall of 6 m (Figure 4A), about 100 m from the entrance to the cave (sinkhole). The remaining sections were located downstream from this waterfall towards the deeper area of the cave, ending at a short sump (a section of flooded passage), transposed only in July 2001 (Figure 4A). Using the mark-recapture method, the study covered about 400 m2 (calculated from map), that is, ca. 1/5 of the accessible habitat occupied by I. passensis. In addition, visual censuses were conducted in July and August 2001 downstream from the sump. To study I. bambui, we divided the upper vadose tributary of Angélica cave into 17 sections (ca. 900 m2 calculated from a map); each section was 15 m long, and widths varied between 0.80 and 10 m (Figure 4B).
On three occasions (July 1999, July or August 2000, and August 2001), we conducted visual censuses for I. epikarsticus at São Mateus cave (two hours of observations on each occasion) and I. ramiroi at São Bernardo cave (three hours of observations). We measured the areas of rimstone and side pools to estimate the densities of individuals in these populations.
We captured the specimens with hand nets after visual inspection of the habitats, including potential hiding places such as rock crevices, under stone chips and pebbles, and by revolving the bottom to dislodge buried fish. The time of inspection was 30 min per section in Passa Três cave and 30–40 min per section in Angélica cave.
After capture, the catfish were anesthetized in a solution of benzocaine, weighed (W) with a dynamometer (0.20 g accuracy), and measured (standard length, SL, in mm) with a caliper with 0.1 mm accuracy. They were marked using subcutaneous injection of biocompatible ink (nankeen). For I. bambui, we marked individuals larger than 23.0 mm SL; we did not capture I. passensis specimens smaller than 35.0 mm SL. Individual marking took place by a combination of the position of marks, in the flanks (left or right side), below the dorsal fin. For each capture, we recorded date, section, position of the marks, weight, and length. The fish were then released in the same section in which they were collected.
We measured the water physico-chemical variables at Passa Três and Angélica caves (pH, conductivity.ms.cm−1, dissolved oxygen.mg.L−1, temperature/°C, and salinity/%) during the population study. We established two fixed points located in the aphotic zone of Passa Três cave (section 3, 50 m downstream the sinkhole/cave entrance; section 17, 340 m downstream from the sinkhole/cave sinkhole) and in one point at the aphotic zone of Angélica cave (section 9, about 200 m from the cave entrance). For São Bernardo (I. ramiroi locality) and São Mateus (I. epikarsticus locality) caves, punctual measures were recorded. For comparison purposes, we recorded water variables in epigean drainages of Passa Três, Angélica, São Bernardo, and São Mateus.
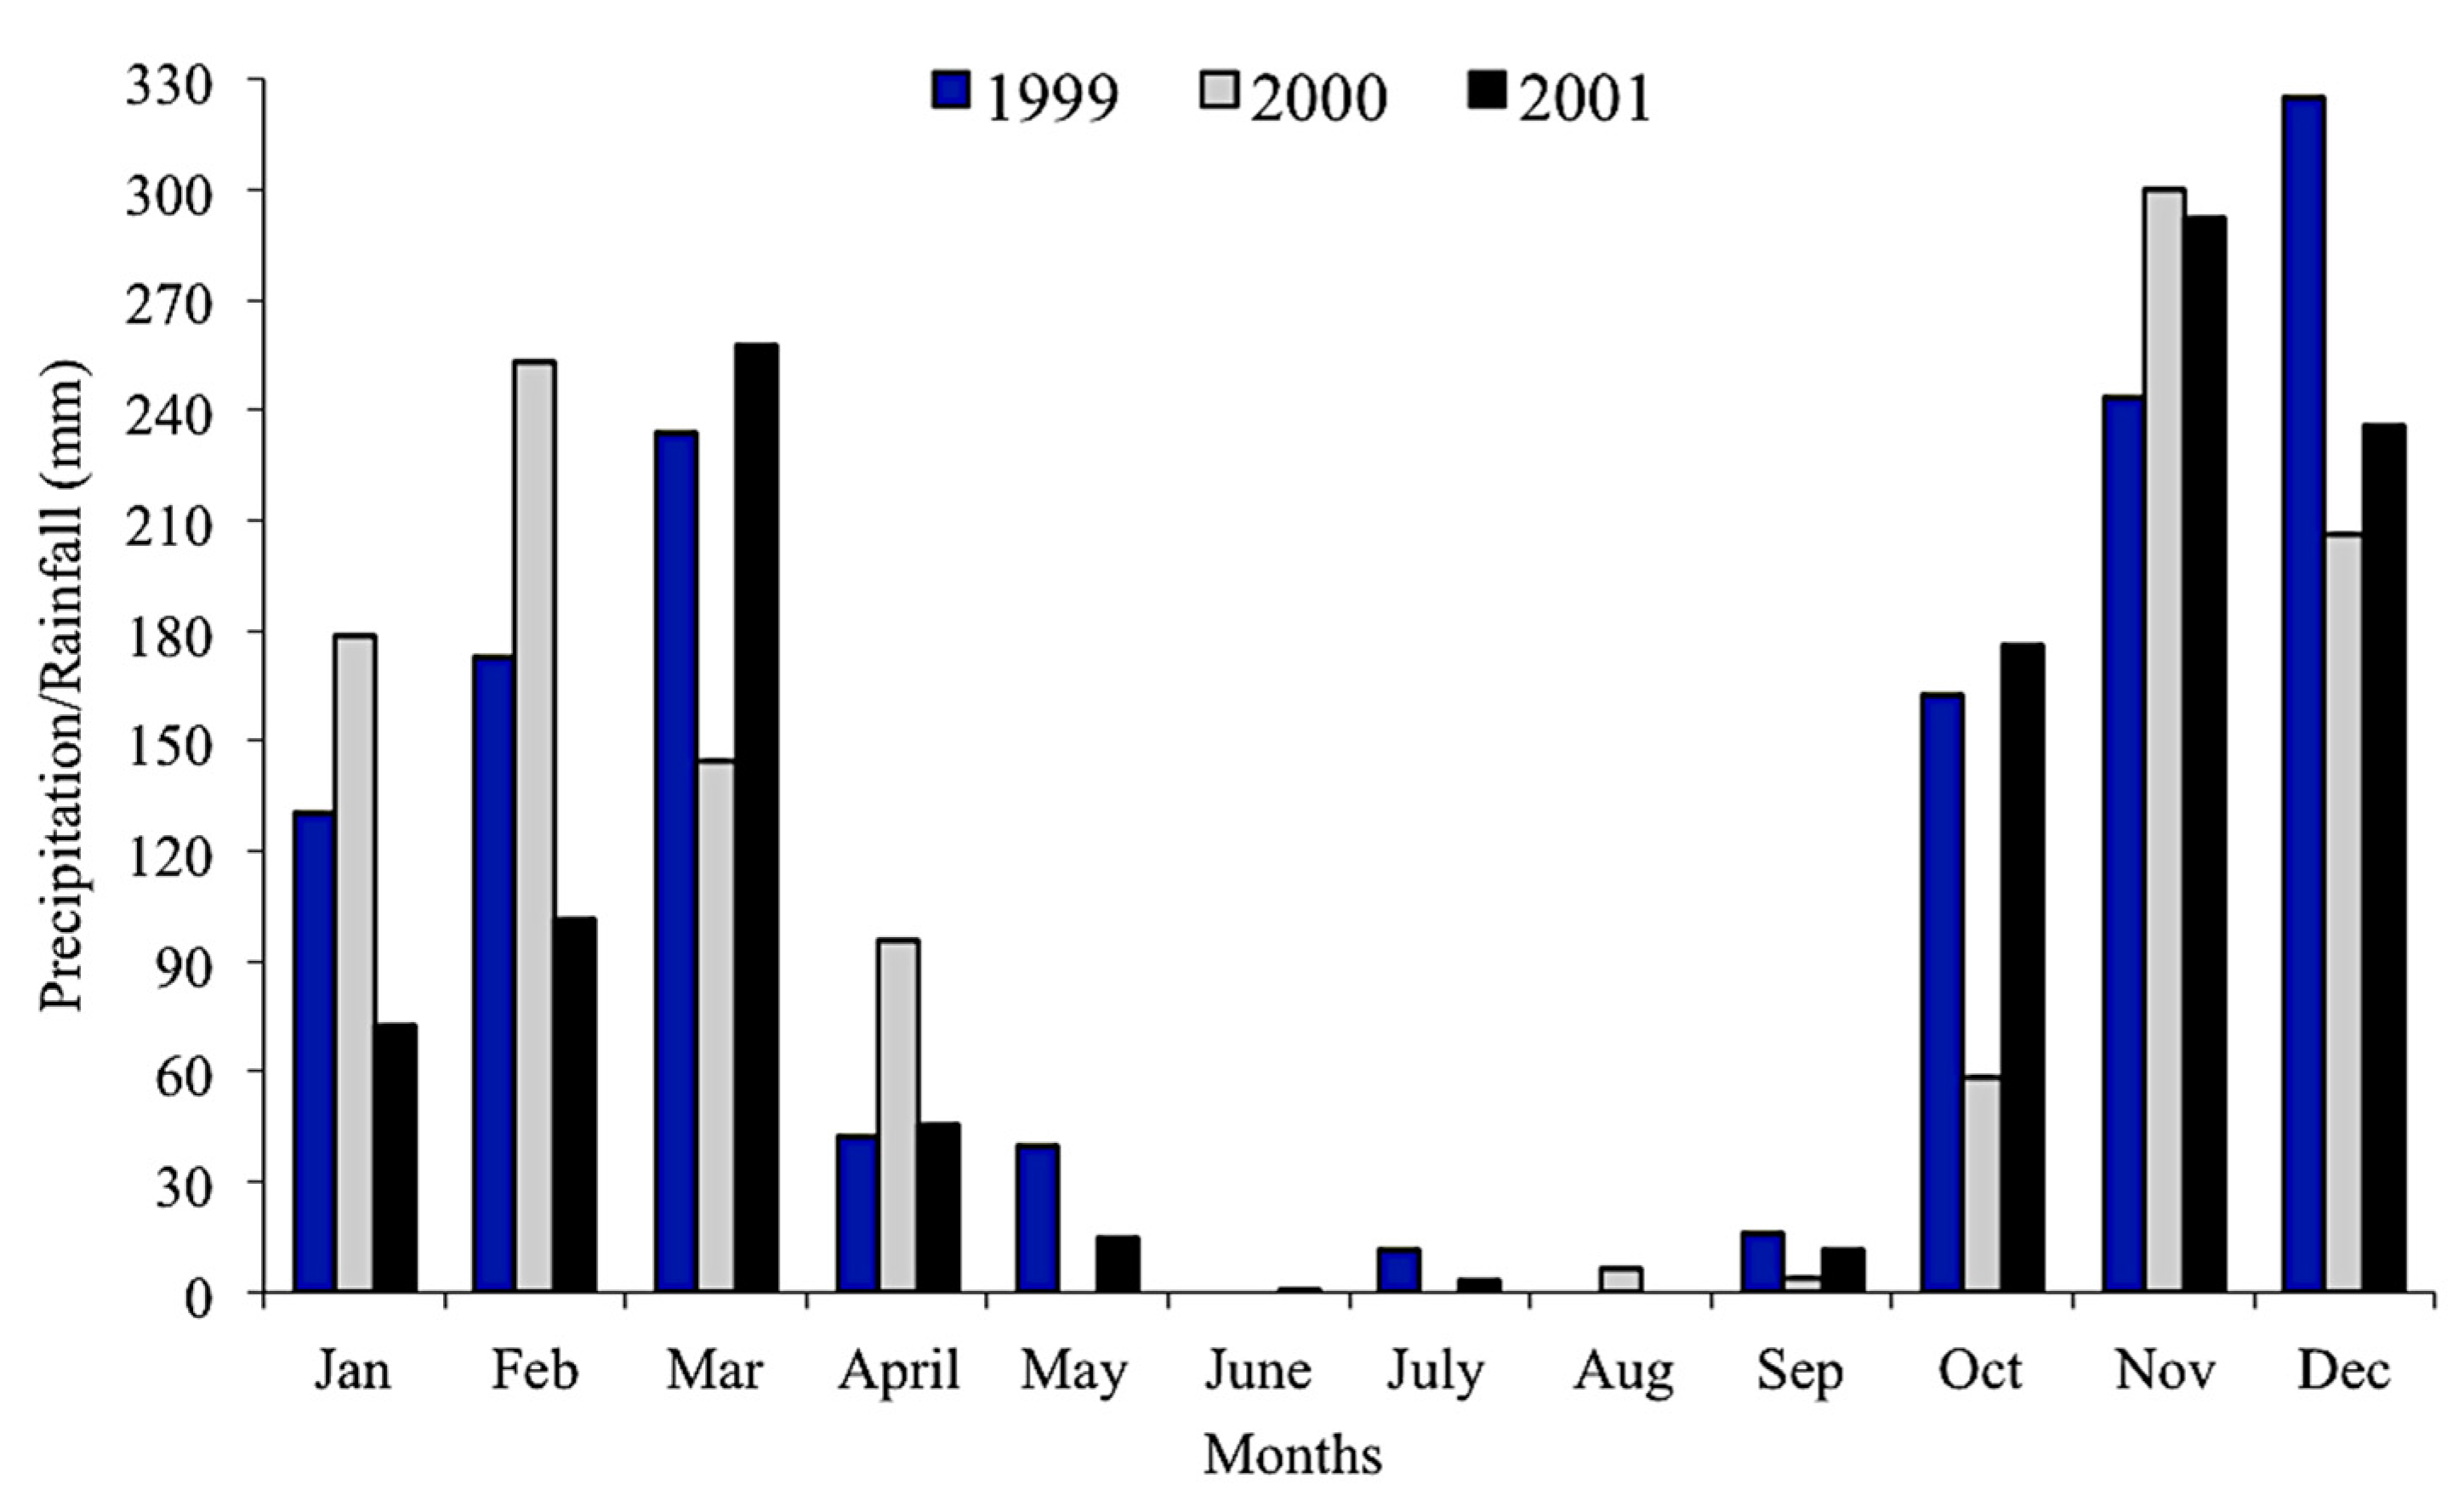
We obtained precipitation data from 1999 to 2001 from a station located 80 km from the study area in the municipality of Posse (INMET–National Institute of Meteorology).

2.3. Data Analysis

We estimated the monthly population sizes and densities of I. passensis and I. bambui based on observed and captured individuals per each year of study (1999, 2000, and 2001). We also verified the preference of these species by upstream or downstream subterranean stream stretches. We used the Lincoln–Petersen model [36]—based on a single episode of capture, marking, and recapture—to estimate the population sizes per year (three year blocks). Standard errors of means (SEM) and confidence intervals were calculated. We used the Petersen method to develop the analysis [37].
The individual growth rates were calculated for I. passensis and I. bambui using the capture-recapture data. For this, we used the increment in body length divided by the time between the captures (days). Standard length (SL) measures presented ± 0.1 mm errors, thus we calculated the error propagation formula in subtraction, sv = ±(sa2 + sb2)1/2, where sv is the propagated final error, and sa2 and sb2 are the errors of measures associated with each of the measures [38], calculated in ±0.14 mm. For cases where the differences between initial and final standard lengths fell within this interval, growth was considered null.
To detect possible differences in the distribution of standard lengths and weights of I. passensis and I. bambui, which would reveal recruitment and starvation/unhealthy periods, we compared their frequency classes for each collecting occasion. The condition factor—which measures its degree of health, reflecting its feeding conditions [39]—of each individual was also calculated. For comparison purposes, 20 specimens of I. passensis captured downstream from the sump of Passa Três cave stream had their standard lengths and weights recorded.
The relationship between the weight and the standard length of the individuals captured in all occasions was represented by regressions log P = b × (log SL)a, where b is the regression coefficient, and a is the point of intersection with the y-axis when (SL) is zero. The values of b were compared to 3, indicating isometric growth, and were used for the calculation of the condition factor of Fulton (K): K = 100P.SLb [39], considering the data sets for each occasion of collecting.
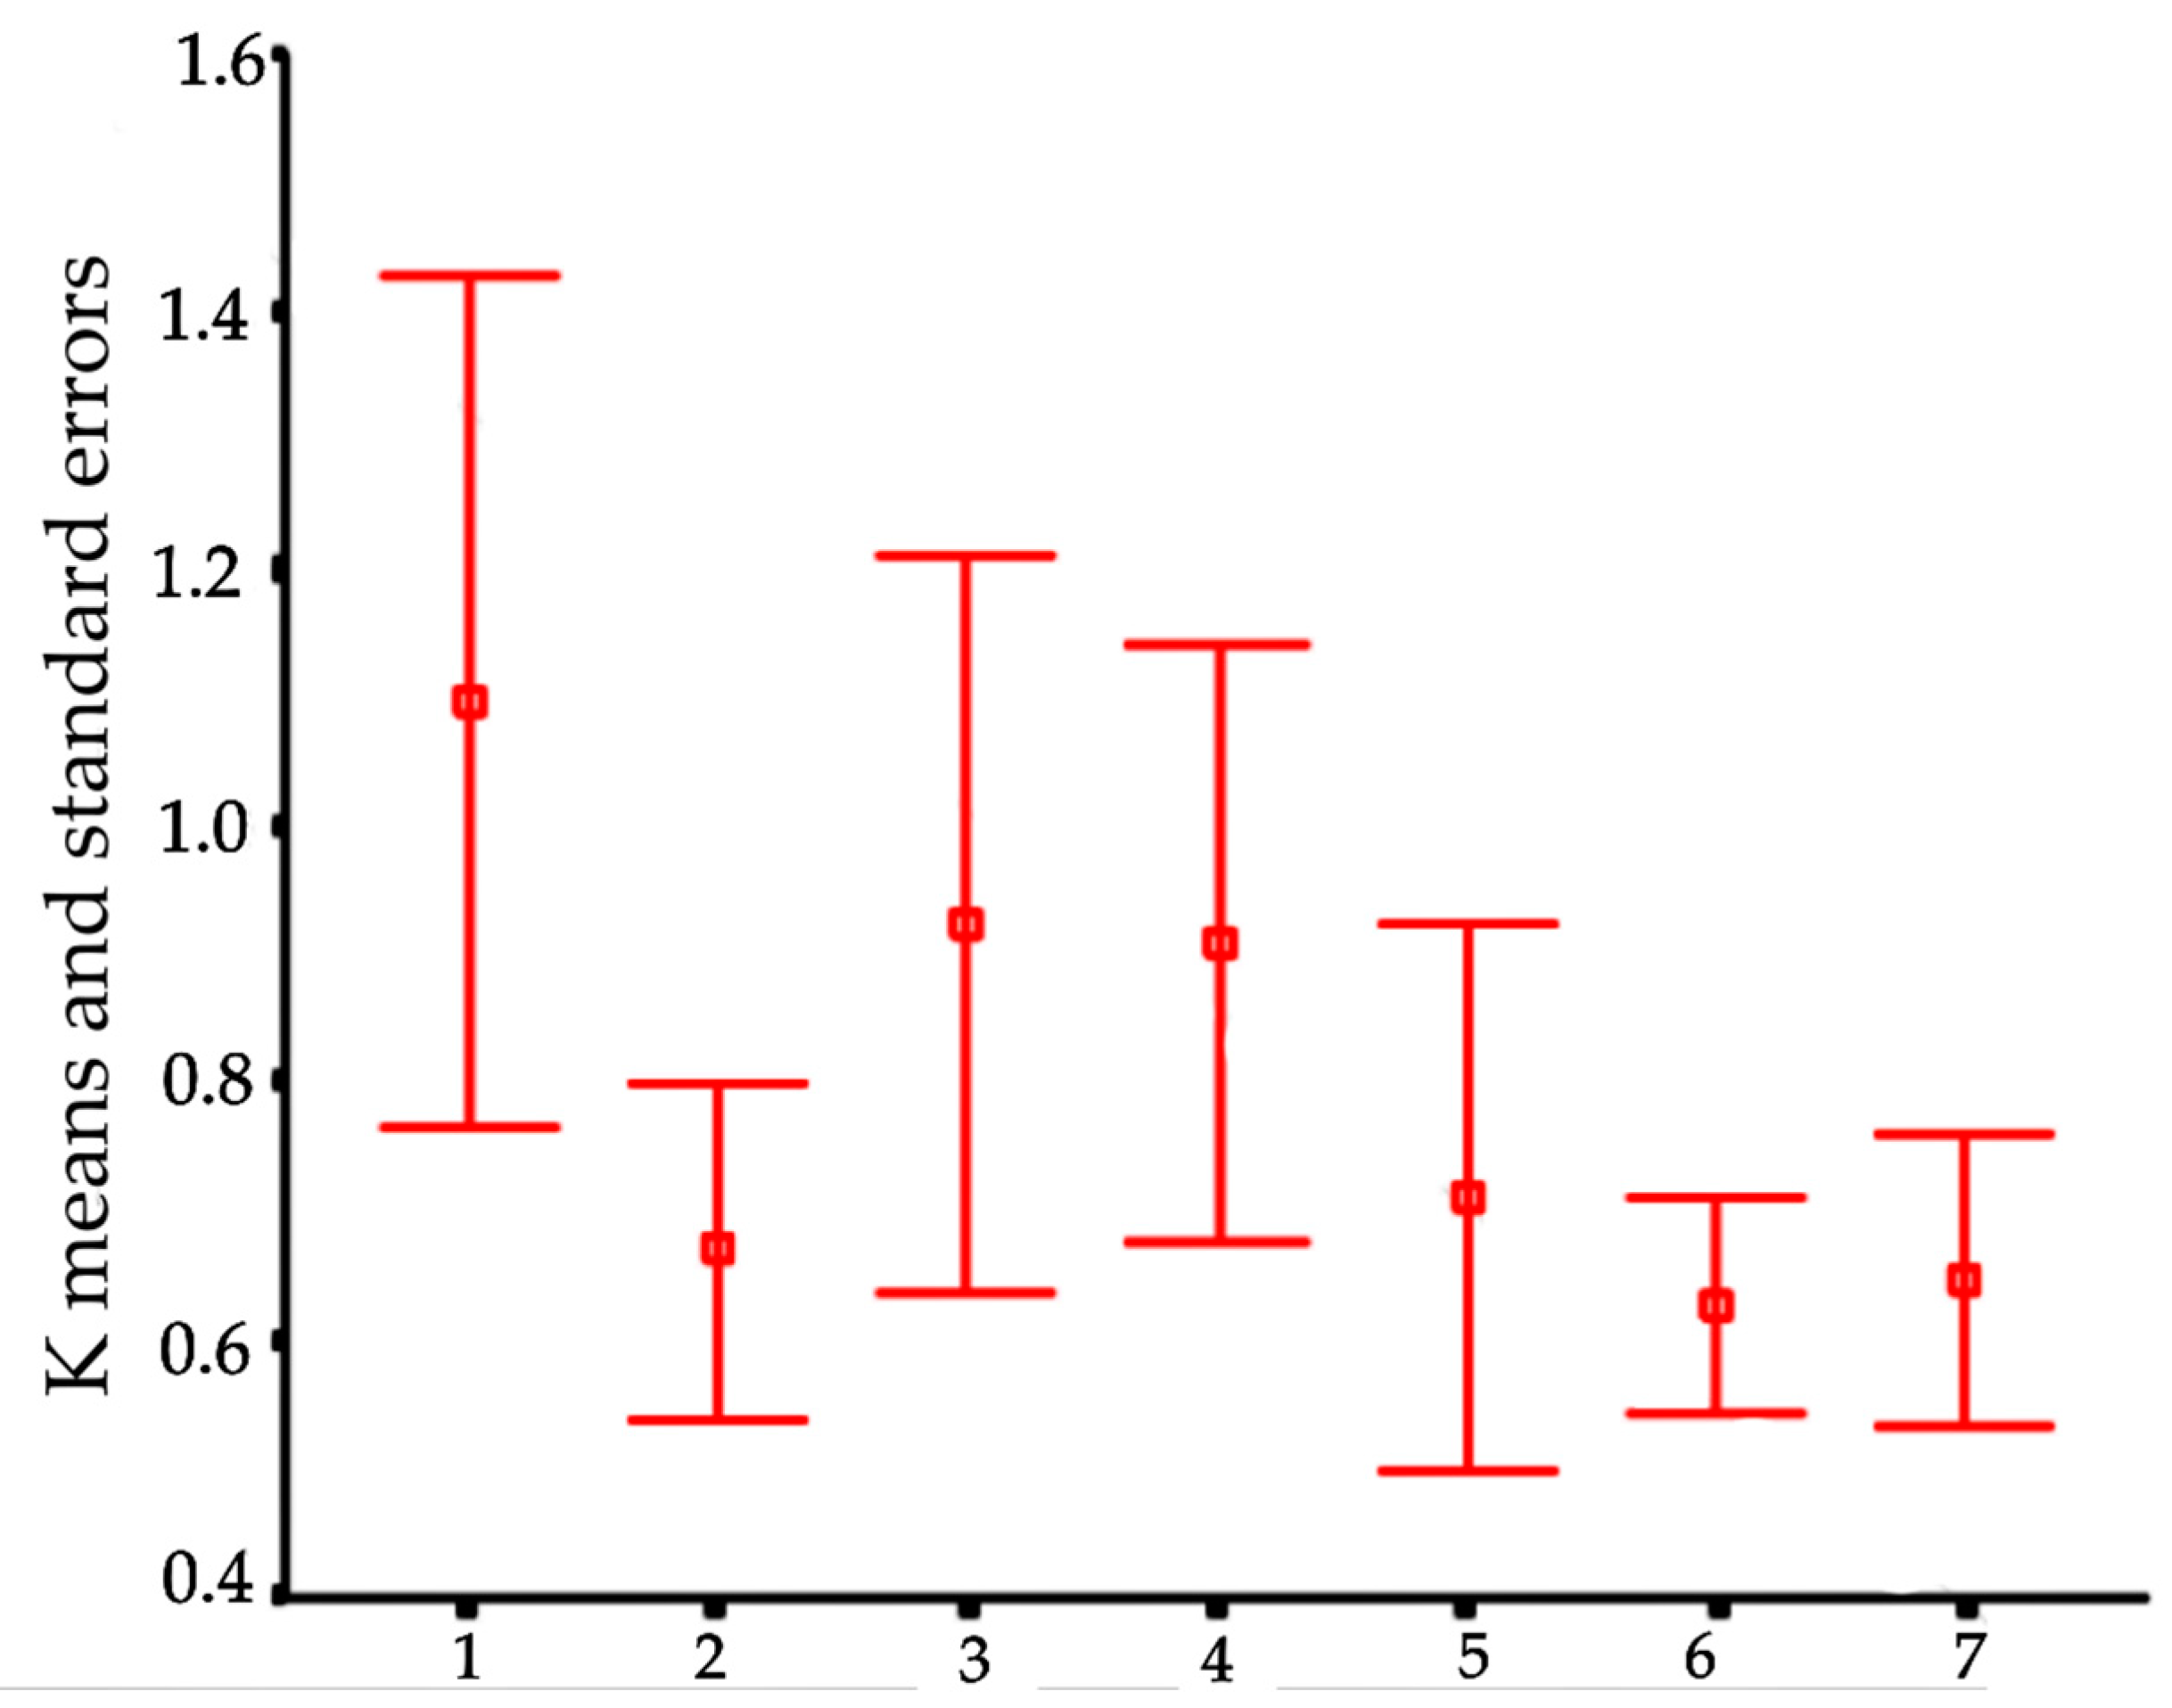
In order to visualize trends in population/fish densities, standard lengths, weights, and condition factor across the two-year study, we created Dice-Leeras diagrams that displayed the means and the standard errors for these variables [40].
The variables—population/fish densities, standard length, weight, and condition factor—were compared through parametric and non-parametric tests (before tests, the data were tested for homogeneity of variances and normality). For comparisons of two samples, e.g., data from 1999 versus 2000, we used the two-sample t-test (for parametric data) or the Mann–Whitney test (U), and for three or more groups (treatments), we used the Kruskal–Wallis test (H, for non-parametric group of data). Then, Dunnett’s post-hoc test was carried out to detect significantly different groups [41]. For these statistical analyses, we used SigmaStat software (version 2.0, 1992–1995, Jandel Corporation, San Jose, CA, USA), with α = 5%.
For I. epikarsticus and I. ramiroi, estimates of abundance and density were based on the counts using the visual census technique (VC).

3. Results

3.1. Population Size and Densities

The numbers of captured, marked, released, and recaptured individuals of I. passensis were grouped every two consecutive samples (Table 1). In total, 270 individuals were observed, 261 captured, and 179 released. The capture rate was 93.5%, i.e., most of the observed fish were captured. Probably due to loss of marks, there were no multiple recaptures. As expected, confidence intervals of population estimates were lower in occasions with higher recapture rates (September 2000 and August 2001). Discrepant population size estimates (between 83.8 and 719.0) were expected due to the low recapture rates (Table 2). It is important to stress that this is a minimum value since, through visual census; we observed 258 individuals in July 2001 and 168 in August 2001. The subterranean drainage downstream from the sump was formed mainly by rocky substrate, and the fish are exposed in the river bottom and not burrowed or in shelters as observed upstream.
For I. bambui, we observed 384 individuals, captured 127, and released 90 (Table 2). The capture rate was also low, around 33.0%. The upper vadose tributary of Angélica cave is silty and clay bottomed, hampering captures because many catfish were very fast when disturbed by the collector presence. As observed for I. passensis, there were no multiple recaptures, and we observed high amplitude on the estimated population sizes (between 61.3 and 246) due to the very low recapture rates.
Table 3 and Table 4 and Figure 5A–D respectively show population densities based on visual censuses (means and standard errors of the mean) for I. passensis and I. bambui, considering samples across the years and grouped sections for Passa Três and Angélica caves.
We did not detect differences among the months in the three years for the population densities of I. passensis (Figure 5A) (Kruskal–Wallis test, H = 7.536, p = 0.274) or I. bambui (Figure 5C) (Kruskal–Wallis test, H = 9.533, p = 0.146), nor between the annual mean densities (Mann–Whitney test, U = 9001.0, p = 0.170).
Population densities of I. passensis were higher in downstream stretches (Table 3 and Figure 5B) and significantly distinct; between sections 10 and 11, and 18,19,20, the stream bottoms were formed by rocky substrate, pebbles, with some gravel and depths up to 0.40 m, offering many shelters for I. passensis. On the other hand, in sections 2, 8, 9, 13, 14, 15, 16, and 17, pools with sandy bottoms and depths to 1.0 m were intercalated with lotic and shallow waters. The volume of the available habitat is higher in the sections with pools, influencing the population densities of I. passensis. Another regulating factor was the presence of several large predator fish (110 mm standard length on average)—the erythrinid Hoplerythrinus unitaeniatus (Characiformes)—observed exclusively in pools downstream from section 15.
Population densities of I. passensis downstream from the sump (area of 400 m2) were 0.65 ind/m2 (July 2001) and 0.42 ind/m2 (August 2001) (Figure 5A,B). Compared to the same extension/area upstream from the sump, the downstream densities were higher (see Table 3). However, compared to the last two grouped sections upstream from the sump (18, 19, and 20), the densities were similar or lower (August 2001, Table 3 and Figure 5B). The stream gallery downstream from the sump was relatively similar to sections 10, 11, 18, 19, and 20, with few pools and mainly rocky substrate, where the fishes were easily observed and captured. Only three or four individual Hoplerythrinus unitaeniatus were observed downstream from the sump (July and August 2001, respectively).
Ituglanis bambui exhibited significantly higher densities in sections 1,2,9,10,11,12,13, and 14 (Table 4 and Figure 5D), varying from 0.04–0.27 ind/m2. The upper tributary in Angélica cave is quite homogeneous, with a silty and rocky bottom and slow circulation of the water (lentic). Between sections 1 and 2, the number of rocky blocks was distinctly larger than in the other sections, which are probably good shelters for the fish. There are no regular predators of I. bambui in this tributary.
Densities of I. epikarsticus varied between 0.03 and 0.17 ind/m2, whereas densities for I. ramiroi were larger and varied between 0.13 and 0.3 ind/m2 (Figure 6). Additionally, there was a marked decrease in sightings of I. epikarsticus and, consequently, in densities throughout the study.

3.2. Growth and Movements

Initial (ISL) and final (FSL) lengths recorded for the marked and recaptured specimens of I. passensis and I. bambui are shown in Table 5. We did not compute the recaptures recorded in August 2001 due to the short time interval between the collections in that month (seven days for I. passensis and 11 days for I. bambui). For I. passensis, growth rates varied between negative values, from −0.35 to 1.62 mm/month with a mean of 0.89 mm/month (sd = 0.728). Negative growth as well as the smallest increases in length was recorded for those individuals with larger body lengths. For I. bambui, the growth rate calculated for two specimens was 0.39 and 1.58 mm/month and, as observed for I. passensis, the lowest rate was recorded for the individual with larger body length.
In relation to individual movements, considering I. passensis, out of 33 individuals recaptured throughout the study, 29 (89.9%) were recorded in the same section as the previous catch and four (10.1%) in adjacent sections. These results show individual movements of −1 (if the fish were caught at the end of one section and recaptured at the beginning of the next) to 80 m at time intervals ranging from seven to 98 days. For the four individuals of I. bambui recaptured, three (75%) were recorded in the same section as the previous catch and only one (25%) in the adjacent section. These results are similar to those observed for I. passensis, with individual movements of −1 to 60 m in time intervals ranging from 11 to 92 days.

3.3. Standard Lengths, Weights, and Condition Factor

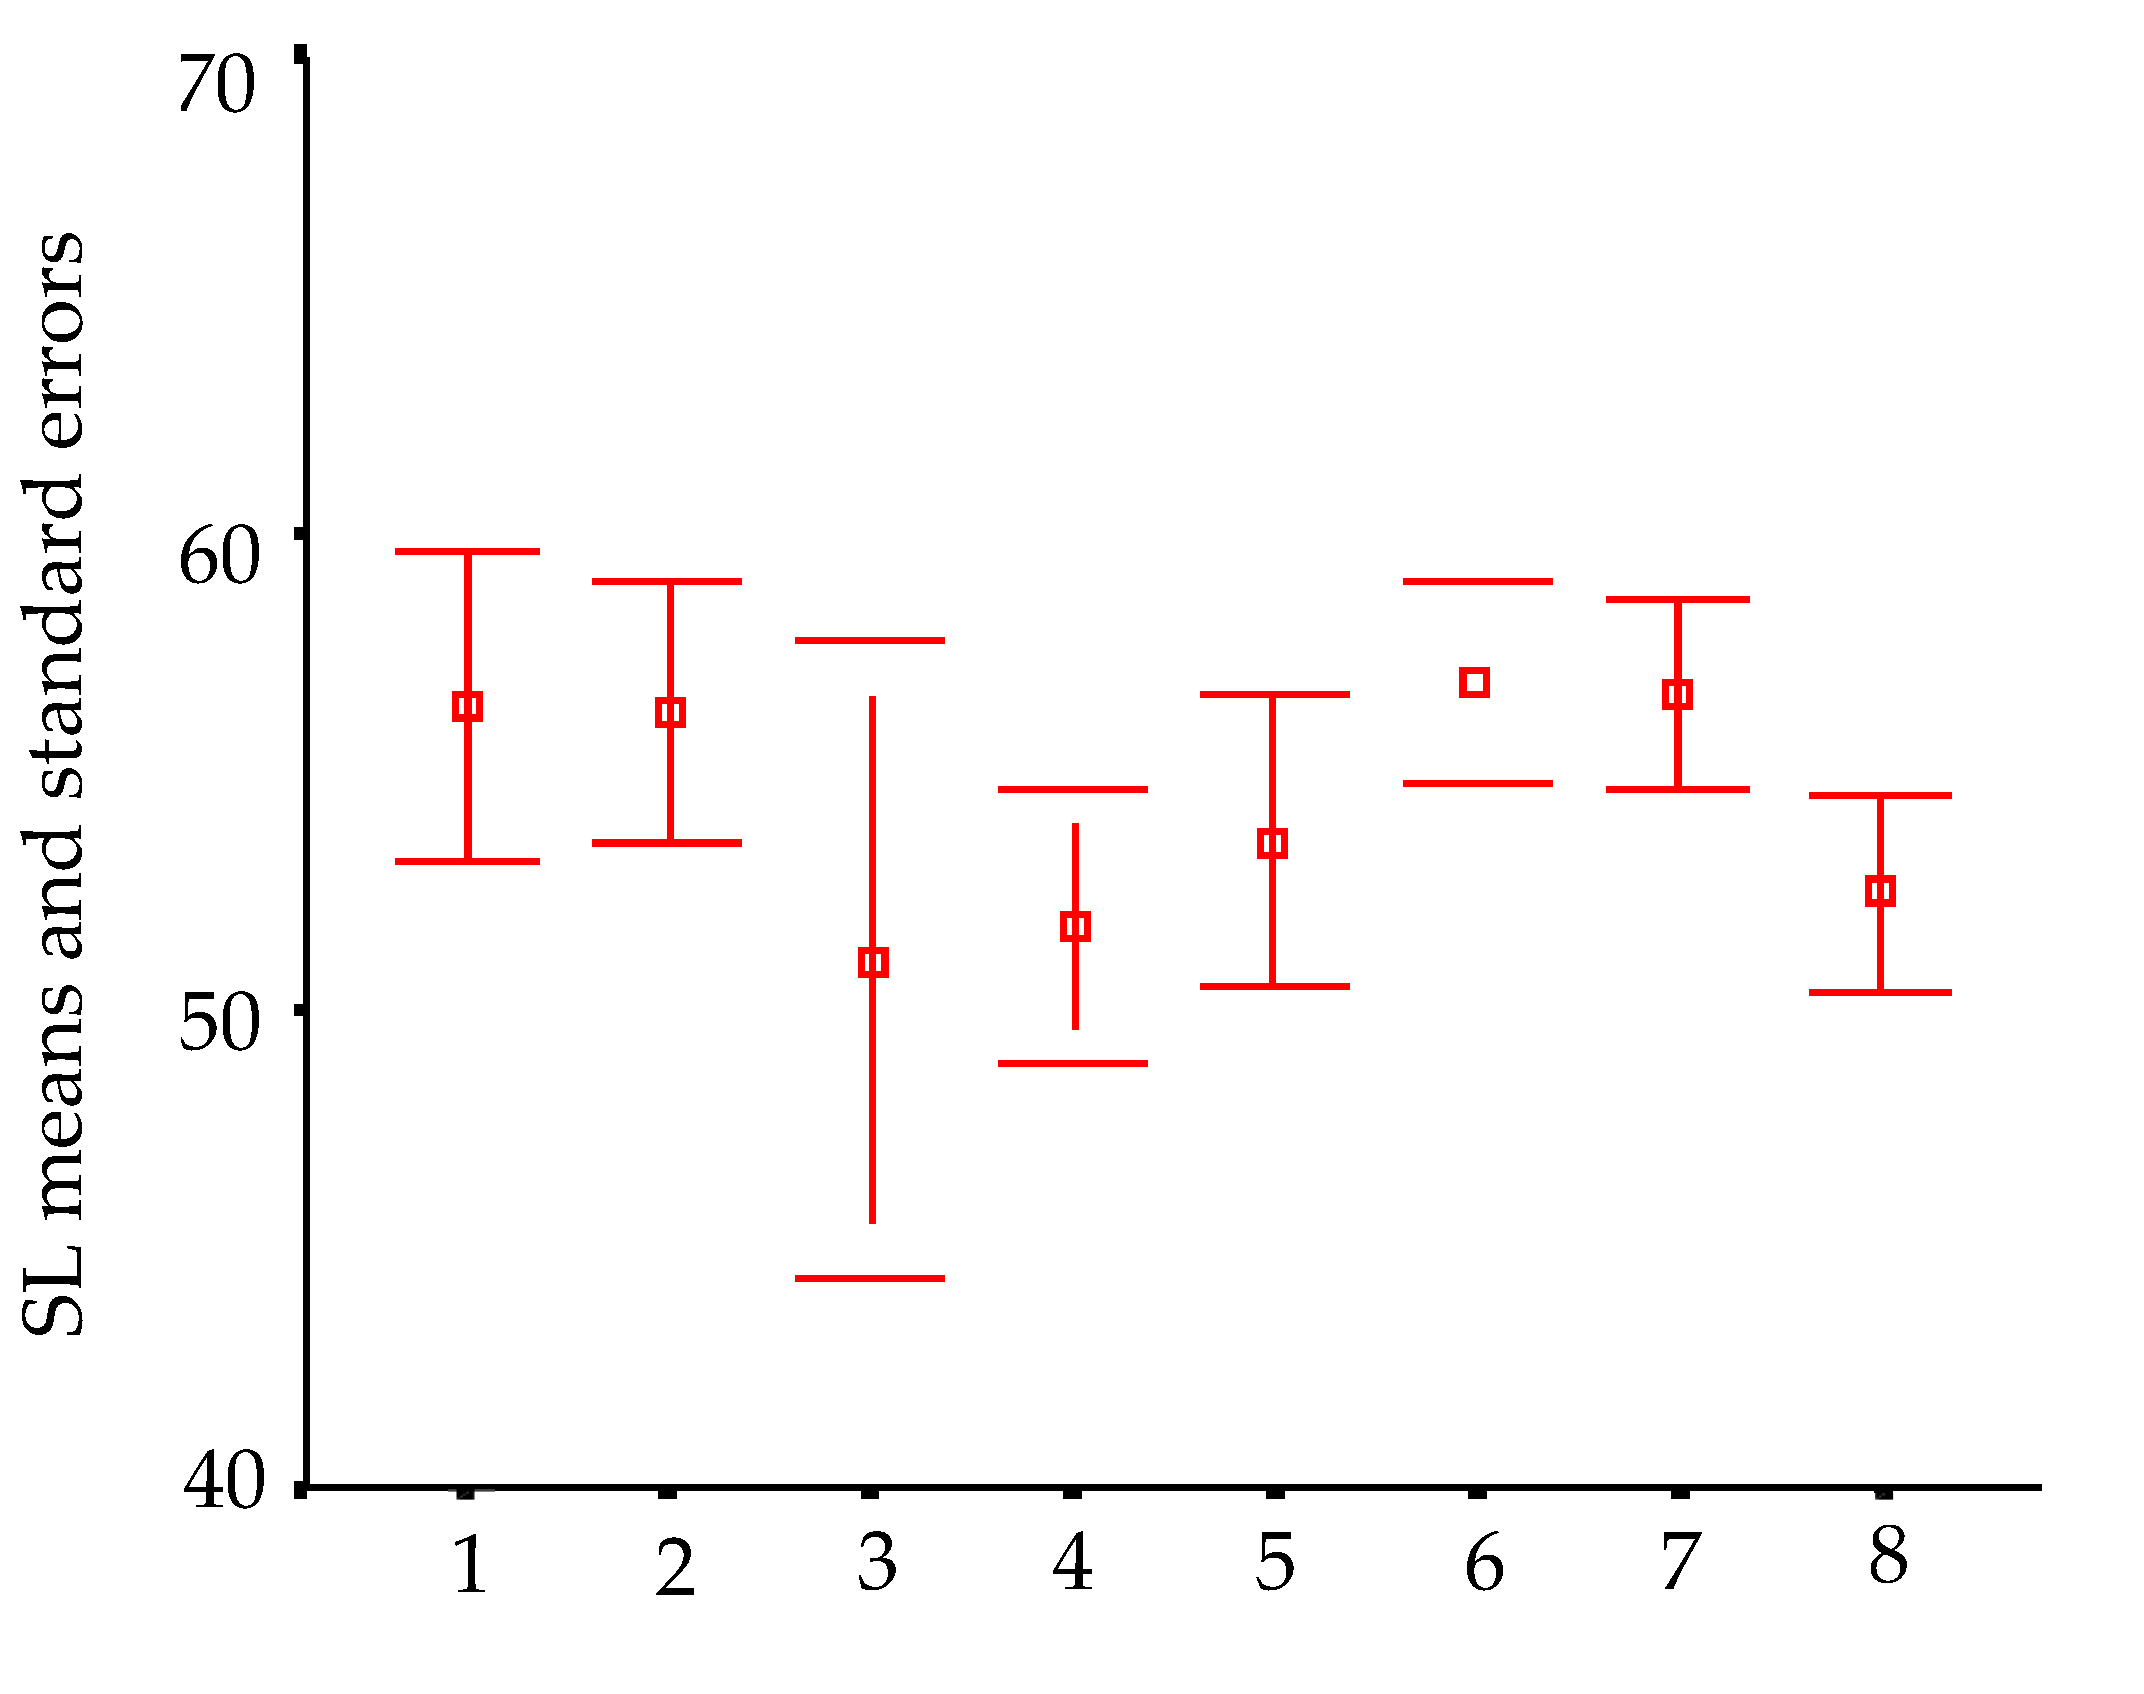
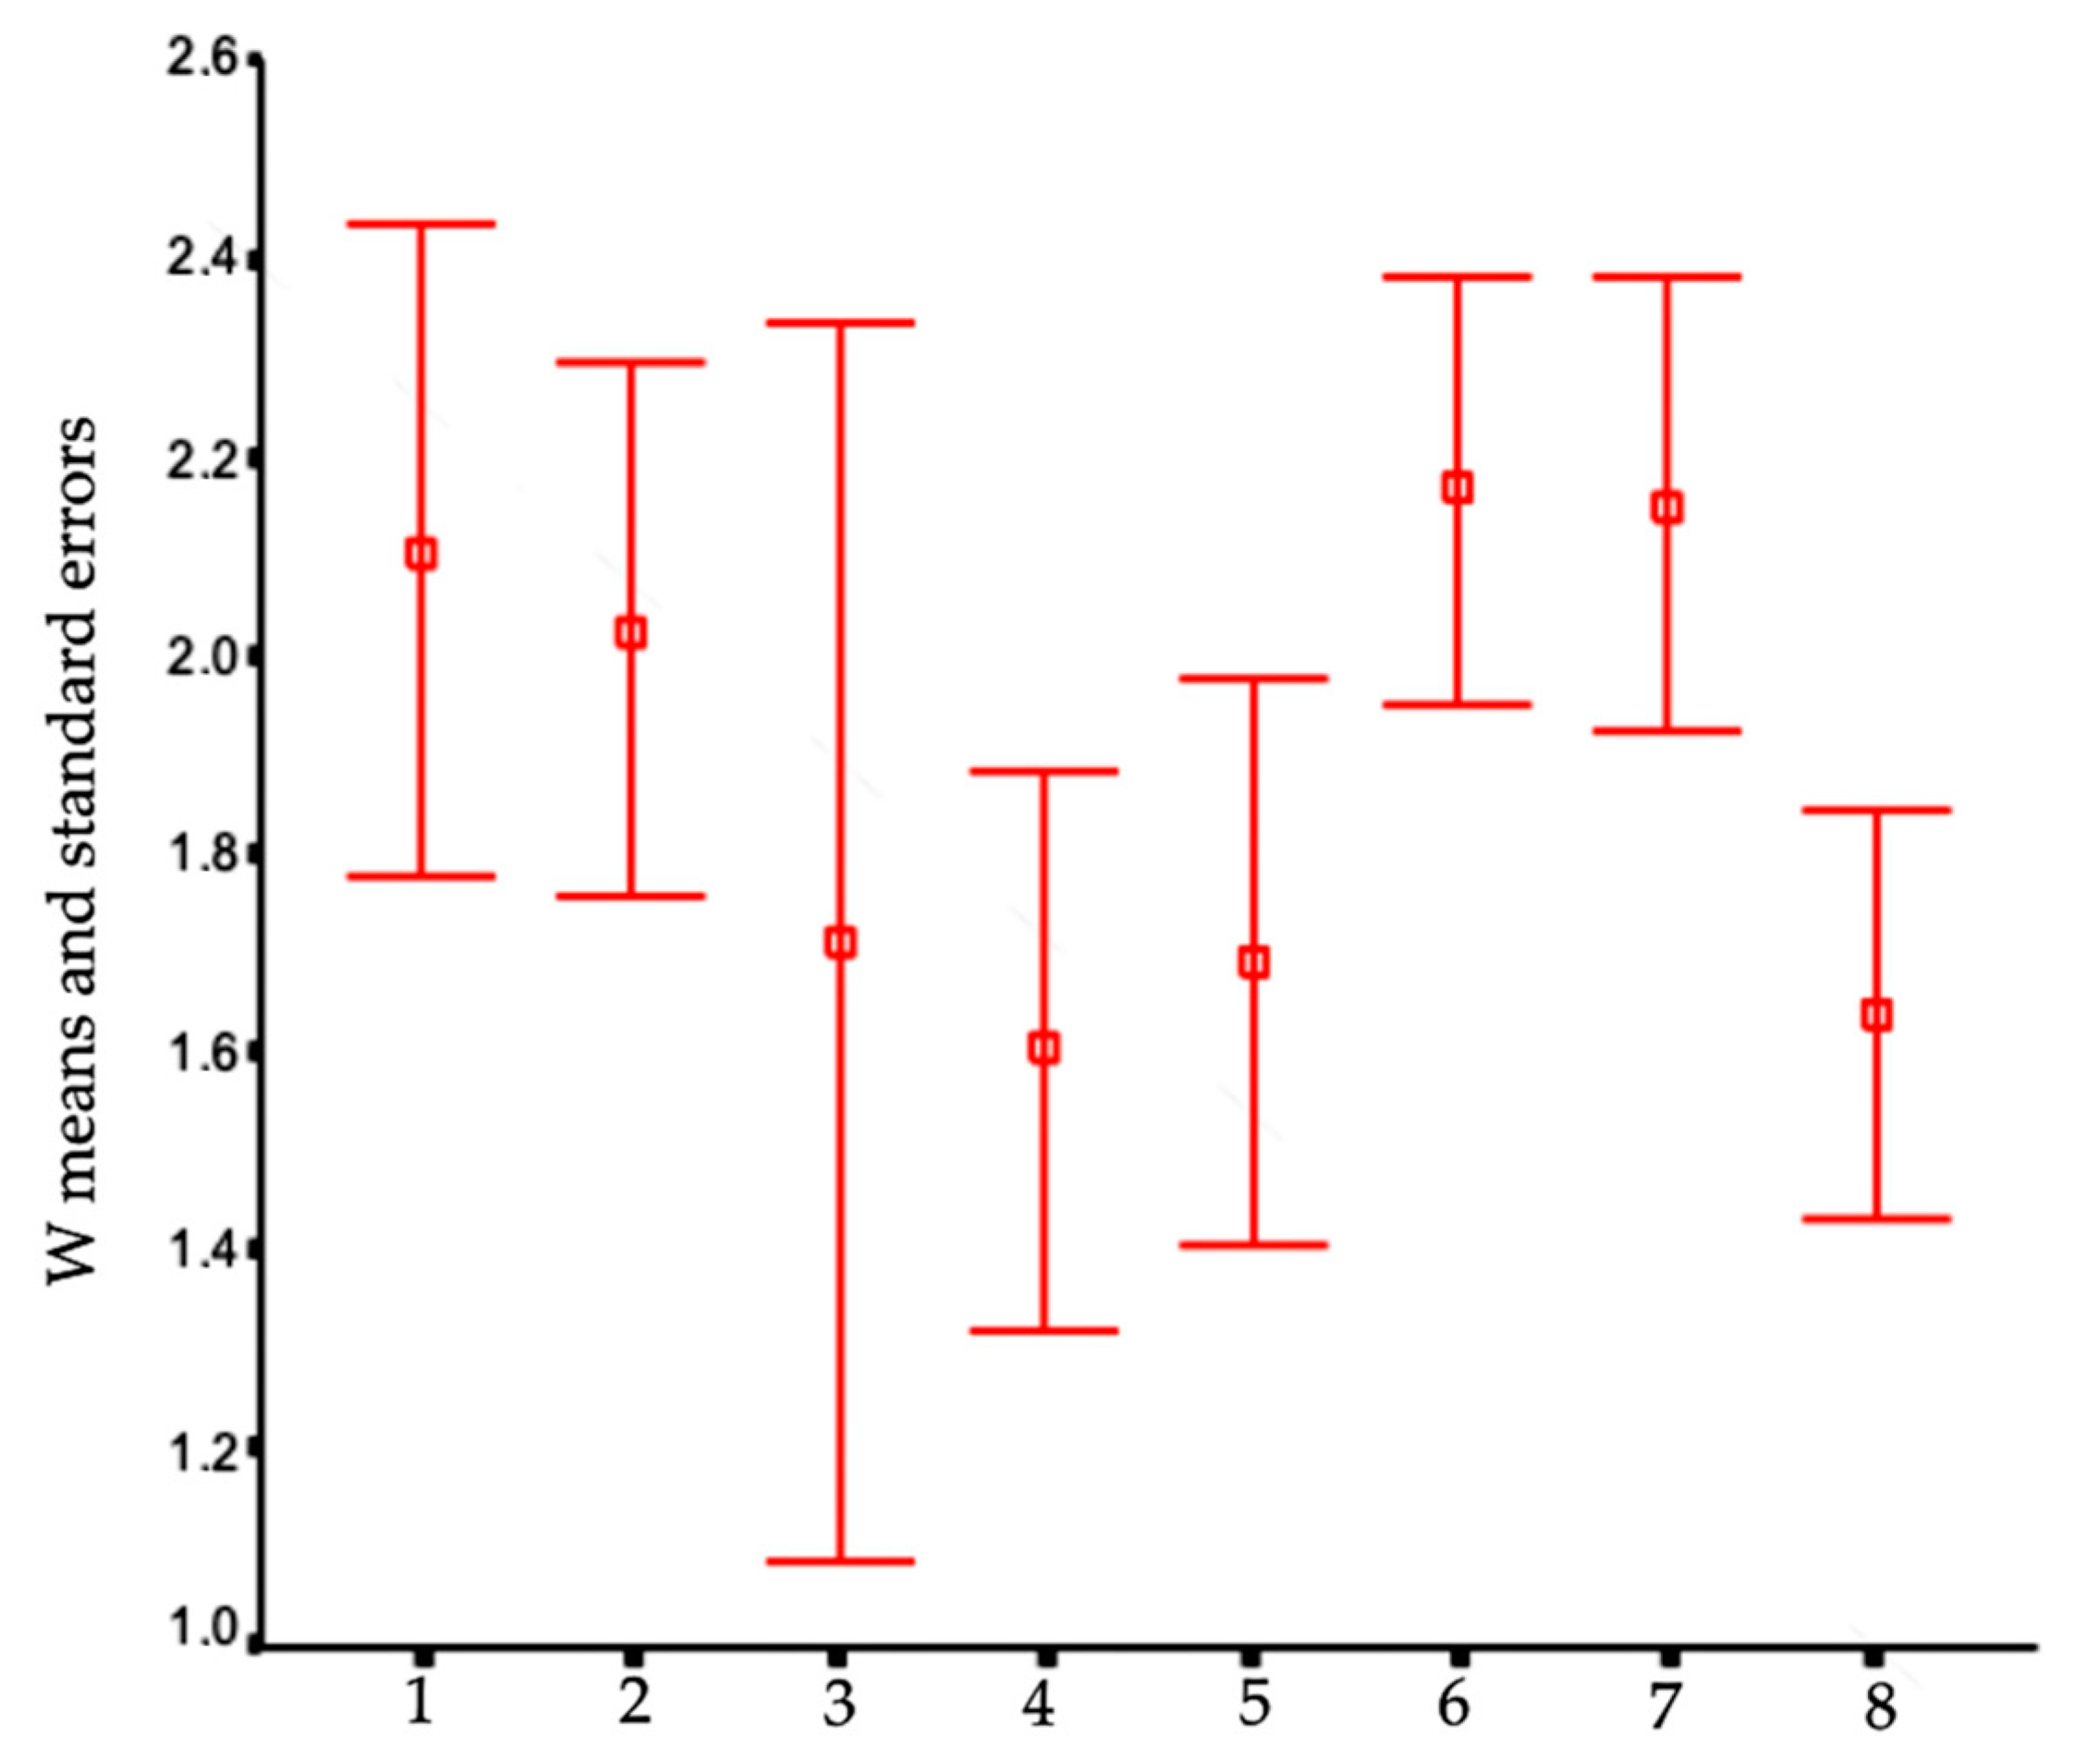
Means and standard deviations for standard lengths and weights for I. passensis are shown on Dice-Leeras diagrams presented in Figure 7 and Figure 8. For the standard lengths, we observed more than one mode on most occasions (Table 6): July 1999 (2), September 1999 (4), April 2000 (3), September 2000 (2), May 2001 (3), and August 2001, downstream from the sump (3). In July 2000 and August 2001 (upstream from the sump), we observed single modes. This demonstrates the absence of a clear pattern of recruitment throughout each year of study and may indicate multiple occasions of recruitment in the year. Multiple monthly modes were also observed for weight: July 1999 (2), September 1999 (3), April 2000 (4), and September 2000 (7). For July 2000, May 2001, and August 2001, we observed single modes.
The Dice-Leeras diagram shows an overlap of standard errors for the standard length means on most occasions (Figure 7), however, there was a slight trend for annual data grouping. The exception is for 2001 data, probably due to the influence of samplings downstream from the sump. In April 2000, we observed the greatest standard error interval, overlapping with all others, a reflection of the small size of the sample (n = 10). The small and heterogeneous samples in the occasions influenced the post-hoc tests, which did not detect any significant differences between the frequency classes. However, using t and U tests, we detected a significant difference for the standard lengths in August 2001, significantly greater downstream from the sump (t = −2.458, p = 0.017). There were no decreasing trends on lengths across the dry seasons, corroborated by the absence of significance on the statistical tests. In 2000, we recorded the lowest standard lengths, comparable to those recorded in August 2001 downstream from the sump (Figure 7). A visual analysis of the Dice-Leeras diagrams shows a partial overlap in weight for most occasions (Figure 8). Significantly greater values were recorded in July 1999 compared to those observed in July 2000 (U = 1046.5, p = 0.022). In contrast, significantly smaller weights were observed downstream from the sump in August 2001 in relation to upstream sump weights in May and August 2001 (U = 383.0, p = 0.002 and U = 469.0, p = 0.004, respectively).
We observed a decreasing trend in average weights during the dry season in 1999 (July to September). The smallest weights were recorded in 2000, as observed for standard lengths data; these weights were comparable with those recorded in August 2001 downstream from the sump (Figure 8).
The relationship between the logarithm of the standard length (SL) and the logarithm of the weight (W) for all captures of I. passensis revealed a value of b of 2.991 (y = 2.991x − 4.948), approaching 3, and indicating a growth near to the isometric. Considering the K distribution data, we observed more than one mode on most occasions (see Table 6): July 1999 (2), September 1999 (3), April 2000 (3), July 2000 (3), September 2000 (4), May 2001 (3), and August 2001 downstream from the sump (3). Single modes were observed only in August 2001, upstream from the sump.
Trends in condition factor (K) data for I. passensis are shown in Figure 9, where an overlap was found for most months, with the distinction of data blocks for the three years. We recorded a non-significant decrease in K values between July and September 1999, which could demonstrate a tendency of food restriction during the dry season. In July 1999, the body conditions were significantly greater than those of July 2000 (T = 1058.5, p = 0.014). In September 2000, the values were significantly lower compared to those of August 2001 (t = −2.953, p = 0.004), which shows food restriction in 2000, at least in July and September, compared to 1999 and 2001. In 2001, condition factor value for August (upstream from the sump) was significantly greater than those recorded downstream (t = 2.625, p = 0.011), probably reflecting a food restriction condition. Apparently, the sump represents a barrier for organic matter carried by floods, and the food restriction downstream must be worse than upstream.
For the standard length frequencies of I. bambui, we observed more than one mode on four occasions (Table 7): July 1999 (3), August 2000 (2), September 2000 (2), and April 2001 (3). In September 1999, May 2000, and August 2001 we observed single modes. These data evidenced recruitment events between April and August 2001. In contrast, multiple recruitment events occurred in 1999 and 2000.
We observed more than one mode in six of the seven occasions for weight data: July 1999 (2), September 1999 (2), May 2000 (2), August 2000 (2), September 2000 (2), and August 2001 (2), with one single mode only in April 2001.
The Dice-Leeras diagram showed an overlay of standard errors for the standard length means during each year of the study (Figure 10). The greatest standard error was registered in September 2000, reflecting the small size of the sample (n = 17). Significantly lower standard lengths were recorded in April 2000 compared with those observed in May 2001 (U = 1212.5, p = 0.028) and significantly greater in August 2000 compared with those observed in August 2001 (U = 2112.0, p < 0.001). Although differences among months were not significant, we noted a decrease in standard length values of I. bambui during the dry season.
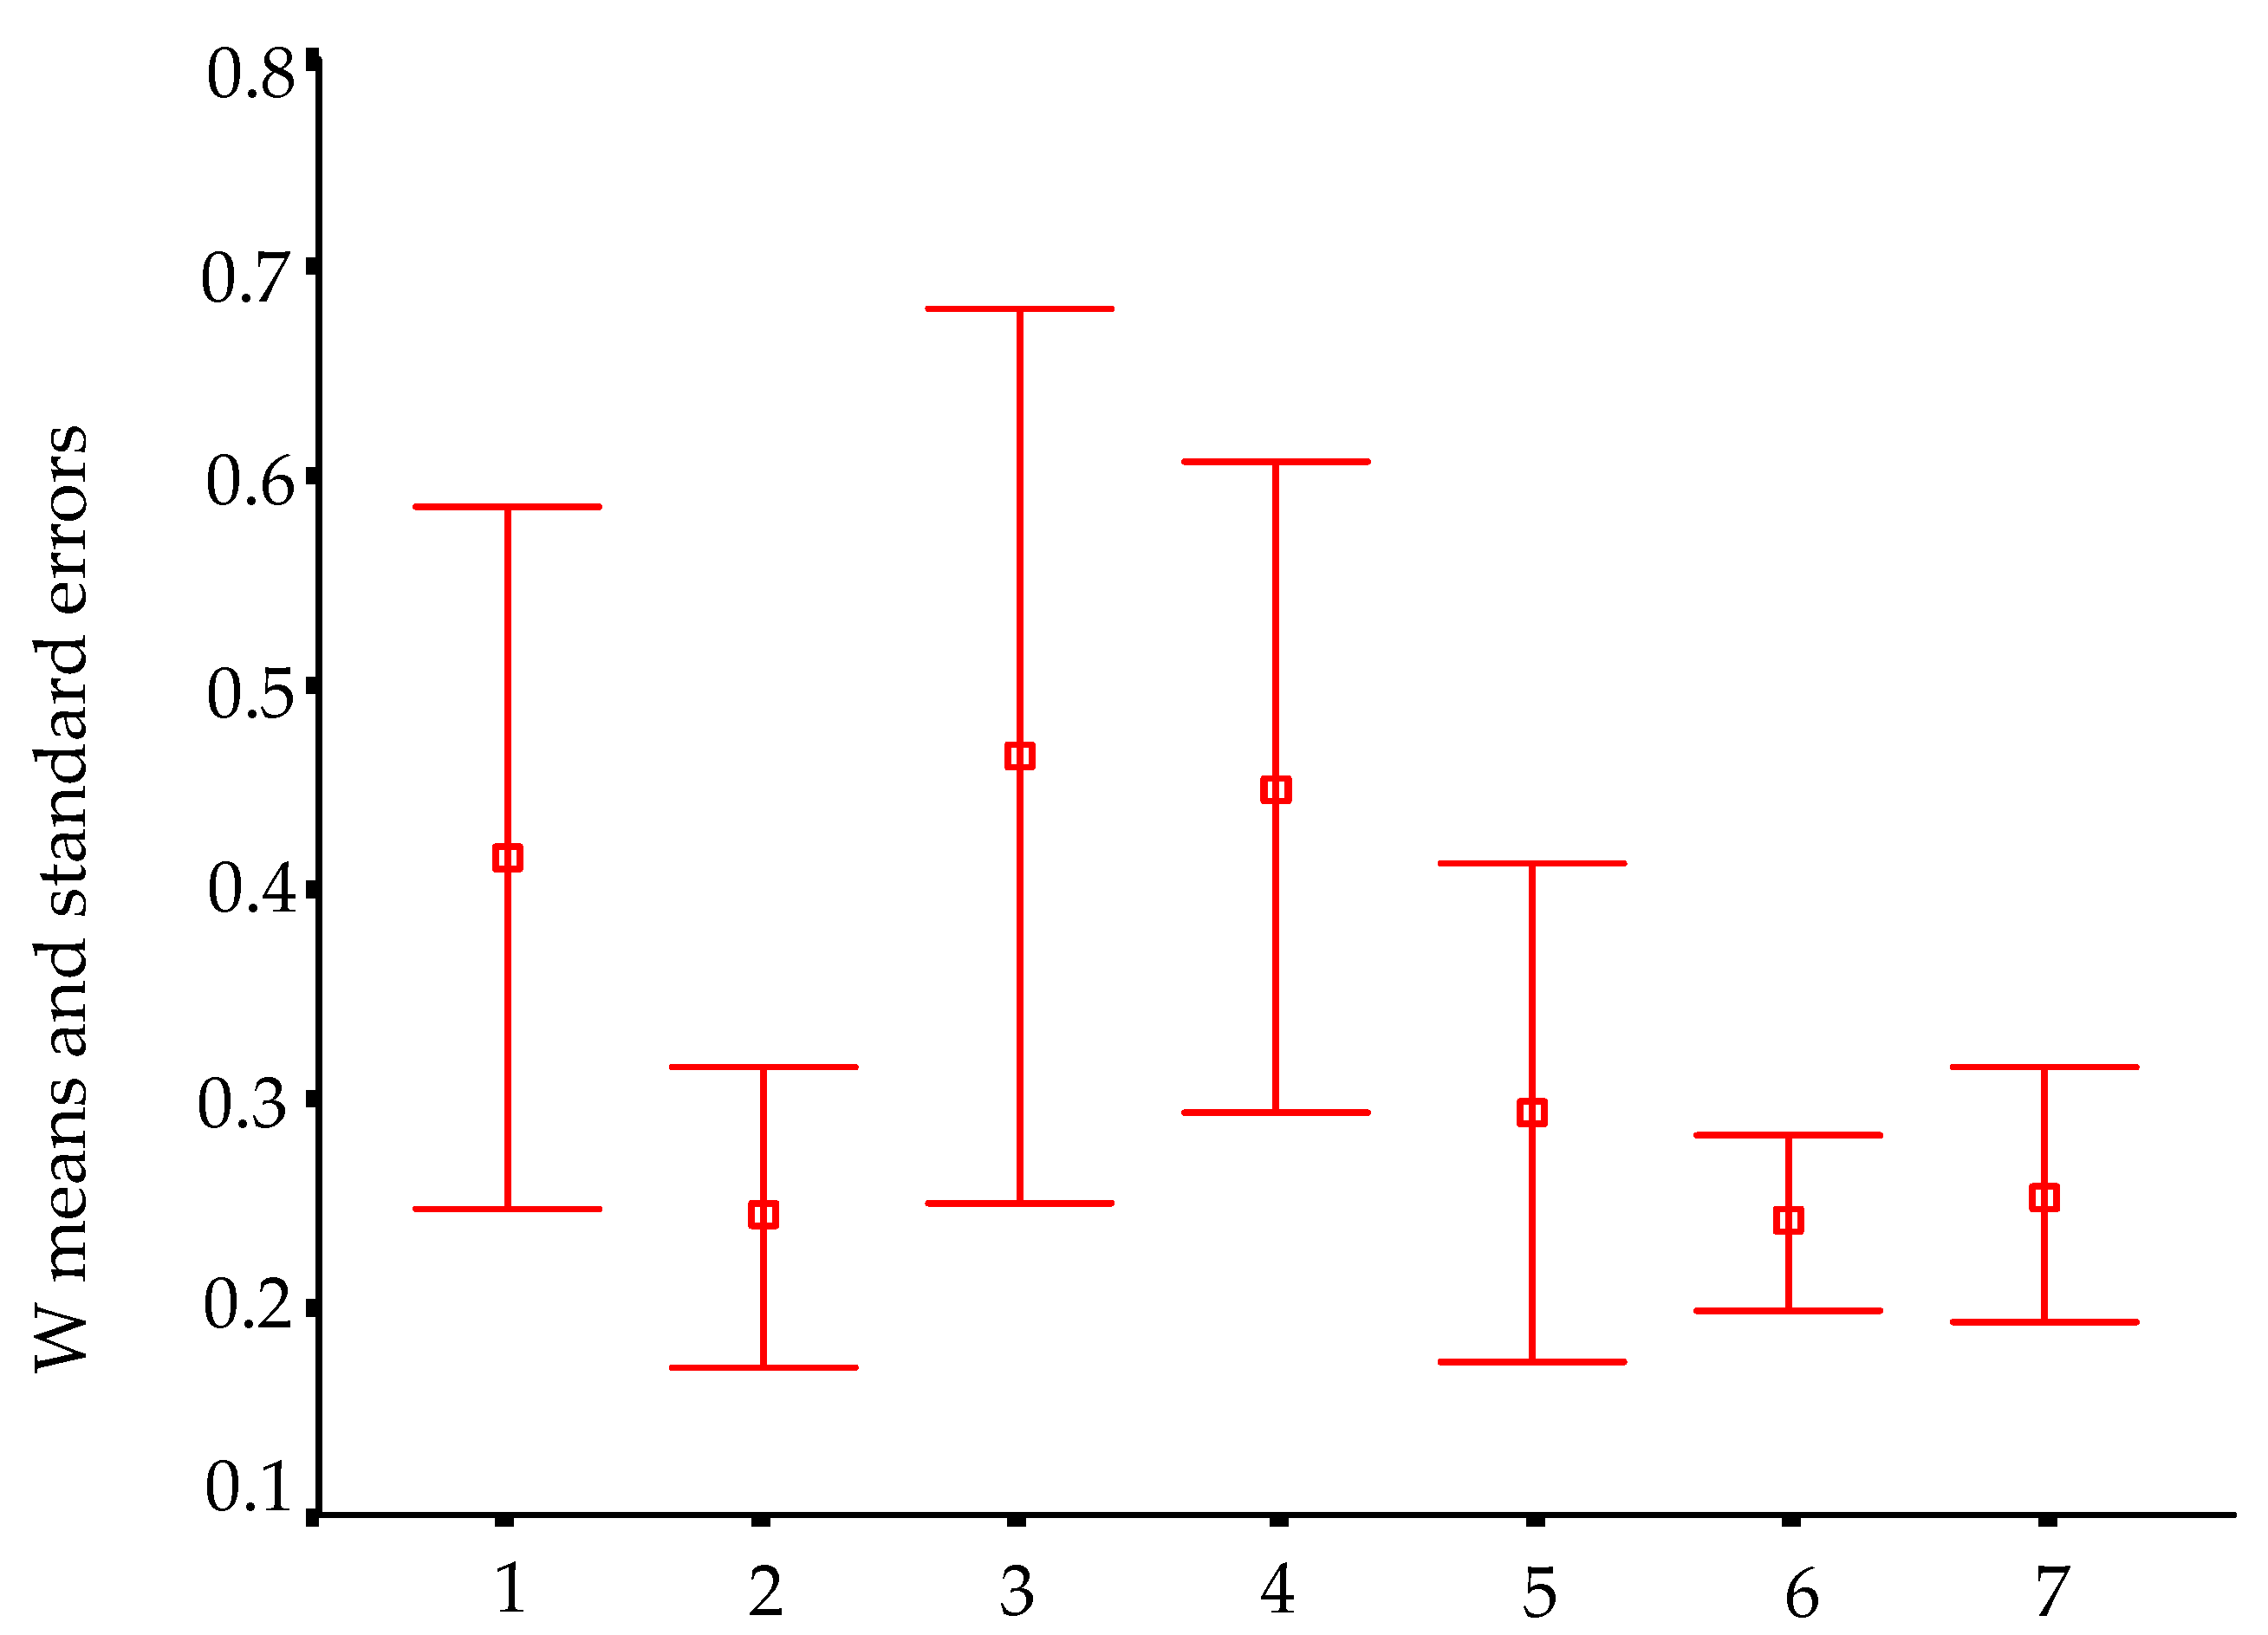
Several overlays for I. bambui weight values were recorded, with large standard errors (e.g., August 2000, n = 40) (Figure 11). We did not observe any significant differences in weight across the years, even during the dry seasons of 1999 and 2000, where sharp decreases were observed (Figure 11). Similarly, no significant differences were observed between similar months (and seasons) in different years.
The relationship between the logarithm of the standard length (SL) and the logarithm of the weight (W) for all captures of I. bambui revealed a value of b of 2.129 (y = 2.129x − 3.699), distancing 3, and indicating a growth near to the allometric. Considering the distribution data, we observed more than one mode for K data on three occasions (see Table 7): September 1999 (3), May 2000 (3), and September 2000 (2). Single modes were observed in July 1999, August 2000, April 2001, and August 2001.
We observed several overlays for K data (condition factor), with a clear declining trend in 1999 and 2000 (Figure 12), reflecting food restriction conditions during the dry season in these years (Figure 12). A significant difference recorded between July and September 1999 (T = 1085.0, p = 0.019) reinforces this hypothesis.

3.4. Environmental Variables

We observed marked dry and rainy seasons during the study in the São Domingos karst area, with absence of rain in the colder months (Figure 13). Total annual precipitation values in the region varied from 1376.8 mm in 1999, 1254.9 mm in 2000, and 1210.8 mm in 2001, indicating a sharp decrease of rainfall during this period. Compared to historical rainfall data for the municipality of Posse, which experienced average annual values of 1635 mm between 1974–1989 (source: National Department of Waters and Electrical Energy and INMET), the decrease seems historic.
For the four localities, we recorded high values of pH and conductivity and salinity values different from zero in most months (Table 8). The average pH values observed for Passa Três cave were lower compared to those of Angélica, São Bernardo, and São Mateus caves. The latter three caves are formed by epikarstic waters (the upper boundary of a karst system filled by percolating water), whereas, in the case of Passa Três cave, there is contact between the subterranean and the epigean drainages, which may slightly acidify the water. The same trend was observed for temperature; values recorded for Passa Três cave river were generally lower than those of Angélica, São Bernardo, and São Mateus cave drainages (with exception of September 2000). A small fluctuation was recorded in the subterranean drainages of Passa Três and Angélica caves throughout the study; conductivity, temperature, and dissolved oxygen exhibited greater fluctuation (Figure 14A,B). The minimum annual amplitude for temperature was similar for all caves (ca. 3.5 °C). Lower values of dissolved oxygen were recorded for Passa Três cave in the dry seasons of 2000 and 2001 when precipitation was lower (Figure 13).
We observed low amplitudes comparing the epigean and the subterranean stretches of Passa Três stream, even considering sites in the deeper zone (aphotic) of the cave. In contrast, we observed marked differences comparing the epigean stretches of the Angélica, São Bernardo, and São Mateus streams and their respective subterranean drainages, mainly for conductivity, temperature, and salinity values (Table 8).

4. Discussion

High pH, conductivity, and salinity values recorded for all caves from the São Domingos karst area are expected and typical of karstic drainages. Despite fluctuations of cave stream temperature during the study, their amplitudes were lower than those observed in the epigean drainages, according to the environmental stability of a hypogean environment [42]. The decline in dissolved oxygen values across the three years is probably related to a decrease in annual rainfall. We observed an accentuated decrease in the volume of watercourses of Angélica cave throughout the study. In the case of Angélica, São Mateus, and São Bernardo caves, the drainages where Ituglanis spp. occurs are isolated from the base level drainages (and principal), reducing the influence of surface drainages.
The low rates of recapture observed for I. passensis and I. bambui are probably related to the loss of marks. For I. bambui, which occurs in an upper vadose tributary of Angélica cave, recapture rates were markedly lower than rates recorded for I. passensis, which occurs in a base level stream. This difference is related to the fact that the population of I. bambui probably represents a small sample of a larger population distributed throughout the epikarst, since specimens morphologically similar were recorded in pools about 4 km away from the studied tributary. A population study of troglobitic amphipods in the U.S., which occurs in pools formed by infiltration water and base level rivers, also showed a similar pattern [43].
The estimated population size for I. passensis shows that this species has a relatively small population. Population sizes, based on mark-recapture studies as herein, also varied from very small to comparable to relatively small populations of epigean species. The population size of the troglobitic trichomycterid, Trichomycterus itacarambiensis, from eastern Brazil (5000 m of habitat extension) varied from 1500 to 2000 individuals. The cave catfish Pimelodella kronei from southeastern Brazil (5000 m of habitat extension) reached 900–1200 adults; the armored catfish Ancistrus cryptophthalmus from the same region (São Domingos karst area) reached 20,000 individuals in 8000 m of habitat extension at Angélica cave and 1000 individuals at Passa Três cave (2000 m of habitat extension) [4].
There is very little information about the population size of epigean trichomycterids, and most of that information was based on indirect observations. However, it is possible to see the amplitude of differences in relation to troglobitic populations. Shoals of 40,000 individuals were observed for T. migrans from Colombia, and more than 7000 individuals of Trichomycterus areolatus were captured across three years in two streams from Chile [44]. While small abundances were recorded for Trichomycterus sp. from southeastern Brazil (with 341 individuals in three sites of a small stream six-time sampled [45]), and for the benthonic catfish Pygidianops amphioxus from igarapé of northern Brazil (with 136 individuals in a 1150 m long sampled in 11 occasions [46]), its distribution is the broadest for the genus, reaching 900 km in a straight line [47]. One study used the capture-mark-recapture method for T. brasiliensis from southeastern Brazil, however, the population size estimated by Lincoln–Petersen was 38.5, and the absolute abundance was 148 individuals [48]. This study was conducted for a short period (two occasions in the same month), thus these discrepant values would be expected.
Densities recorded for the four Ituglanis species (Passa Três, Angélica, São Mateus, and São Bernardo caves) were always smaller than 0.7 ind/m2 and, in general, smaller than 0.11 ind/m2. According to [3], these values should be considered as medium-to-low. Low densities were recorded for other troglobitic trichomycterids, such as T. itacarambiensis from Brazil (between 0.15 and 0.20 ind/m2, mark-recapture method) [10] and T. conradi from Venezuela (0.01 ind/m2, visual census method) [49]. Medium to high densities were recorded for the armored catfish Ancistrus cryptophthalmus (Loricariidae) from the São Domingos karst area: 0.63 and 1.0 ind/m2 for Passa Três and Angélica caves [12] through the capture-mark-recapture method and for Aspidoras mephisto (Callichthyidae), 5–6 ind/m2 [50] through the visual census method. As expected, higher densities were recorded for epigean trichomycterids: 0.7 ind/m2 for Trichomycterus brasiliensis from streams of southeastern Brazil [48]; 3–12 ind/m2 and 18–25 ind/m2 for Trichogenes longipinnis in two coastal rainforest streams from southeastern Brazil [51].
The increase in population densities of I. passensis according to the distance to the epigean environment (sinkhole of Passa Três cave) may be related to the greater availability of organic matter (and substrate for aquatic invertebrates, food items of I. passensis) close to the sump or even due to the drastic floods that can carry the fish downstream. The higher abundance of I. passensis downstream from the sump corroborated this idea. Trajano (1997) also observed higher densities for T. itacarambiensis downstream in Olhos D’água cave, where the availability of food is apparently higher; in this case, the downstream stretches are closer to the epigean environment. Another factor that limits the distribution of I. passensis upstream (in sections 1 to 7) is the waterfall between sections 7 and 8, reaching 6 m high in the dry season when the water level is lower (Figure 4B).
For I. bambui from Angélica cave, we noted an increase in densities toward the deepest part of the cave; however, this increase is upstream from the drainage and does not seem to be related to the amount of food. There was a very low concentration of organic matter upstream. The higher number of rocky blocks observed in these places can offer shelters for catfish, although we did not observe any regular predator of I. bambui in the vadose tributary.
Small fluctuations observed in the population size and densities for both I. passensis and I. bambui throughout the dry season were also observed for the armored catfish from Passa Três and Angélica caves (Ancistrus cryptophthalmus) [12] but only in the year 2000. This was probably related to higher precipitation rates and consequently higher food input to caves.
Due to the quite different environmental conditions in which hypogean and epigean populations live, differences in the use of space, including individual movements, are expected. The low rates of recaptures recorded for I. passensis and I. bambui did not allow robust analysis of the movements, however, we can make some inferences. Ituglanis passensis and I. bambui showed movements in an extension of 80 and 60 m, respectively. Smaller fish tend to have limited movements [52], which would explain the limited movements observed for I. bambui. Similar results were observed for Trichomycterus itacarambiensis, who remained in an area of about 100 m along the river [10]; this species is under a marked food restriction in dry seasons. The absence of seasons with marked food restriction in Passa Três cave explains the existence of more limited movements of I. passensis compared to T. itacarambiensis. The heptapterid Pimelodella kronei is a mid-sized catfish, with SL reaching 150 mm (significantly greater than trichomycterids studied herein) and fewer and shorter movements than T. itacarambiensis, I. passensis, and I. bambui [9], suggesting that seasonality can be one of the main factors influencing home ranges. There are few studies about movements of epigean trichomycterids. A massive migration of juvenile Trichomycterus barbouri catfishes on floodplains from Bolívia was recorded and the authors considered that each individual could migrate upstream more than 300 km [53]. The reason for this migration seems unclear, and the authors suggest that sites more upstream would be more appropriate for survivorship and development to reach sexual maturity.
The slow growth rates observed for I. passensis, 0.89 mm/month on average, and I. bambui, 0.39 and 1.58 mm/month (for two recaptures), are higher than those observed for the troglobitic catfish Trichomycetrus itacarambiensis, 0.06 mm/month [10], and for the armored troglobitic catfish Ancistrus cryptophthalmus (0.35 to 0.7 mm/month on average) [12], and are close to those observed for the troglobitic catfish Pimelodella kronei, 1.0 mm/month on average [9]. Compared to the epigean trichomycterid catfish Trichomycterus chiltoni and Bullockia maldonadoi, which have high rates of growth [44], the rates registered for Ituglanis spp. feature low growth, which would imply high longevity. Laboratory data for I. bambui and I. passensis reinforces this hypothesis since two individuals of these species survived for 20 years in captivity (from May 1999 to December 2019) (M.E. Bichuette, pers. obs.). Although we did not quantify the food availability for Ituglanis cave catfish, it is quite clear that it is much lower than in epigean habitats. This explains the low growth rates and the high longevity expected for I. passensis and I. bambui, a precocial lifestyle.
Monthly distributions of frequencies of weight and condition factor suggest that, for I. passensis, there was no direct relationship with seasonality. However, those individuals that were located downstream from the sump were thinner than those living upstream. This fact reinforces the idea that the sump blocks organic matter. For I. bambui, we observed a decline in condition factor values during the two-year dry seasons. In contrast to the situation observed in Passa Três cave, food was scarcer in Angélica cave, with apparently decreased availability by the end of the dry season. This low condition factor across the study period indicates a regime of food restriction intensified during the dry season. Similar results were reported for the troglobitic catfishes Trichomycterus itacarambiensis [10] and Pimelodella spelaea [35] and for the armored troglobitic catfish Ancistrus cryptophthalmus [12].

Conservation Remarks

Considering these particularities of Ituglanis from the São Domingos karst area, we can discuss their conservation status. The caves where Ituglanis spp. are found are within the Terra Ronca State Park limits, which already offers some kind of protection. However, much of the area was not yet acquired, and the management plans for touristic use of the caves are under study. The four species studied herein are inserted in the Brazilian List of Threatened Fauna: vulnerable category (VU) includes I. passensis, I. epikarsticus, and I. ramiroi, and the critically endangered category (CR) includes I. bambui [33]. Ituglanis passensis is the least threatened of all, having once presented greater populations and with no touristic visitation in Passa Três cave. The threat to Ituglanis bambui is mainly from tourism, since Angélica cave is intensively visited and the upper vadose river gallery where the fish live is close to the cave entrance with easy access. Although I. bambui is probably distributed throughout the epikarst, it seems that the main population is distributed in the studied stretch; urgent actions are necessary to control and plan tourism, effectively applying a management plan for cave use. Ituglanis epikarsticus and I. ramiroi are also endangered species, and urgency is needed on population monitoring studies since they occur in specific microhabitats of epikarstic waters of São Mateus and São Bernardo caves. Tourists also intensively visit the locality of I. epikarsticus (São Mateus cave), and the place where this species lives (rimstone pools) represents the only passage to access other cave galleries. São Mateus is one of the most touristic caves of Terra Ronca State Park, which probably impacts these fish by carrying organic matter from the surface, muddying the water and trampling the dams. The pool where I. ramiroi occurs in the São Bernardo cave is out of the way of tourists, and, apparently, they are protected despite the very easy access. In addition to long term monitoring, we suggest urgency in the execution of the management plans for Terra Ronca State Park at São Domingos karst area, Central Brazil, mainly for the Angélica and the São Mateus caves, where visitation is relatively intense. More expressive supervision of governmental agencies is urgent at Terra Ronca State Park for effective protection of its cave fauna. Monitoring is fundamental for protective measures for cave organisms. We suggest that funds from environmental studies that affect caves and karst areas in Brazil be invested in long-term monitoring and conservation projects for cave fauna.

5. Conclusions

In conclusion, I. passensis and I. bambui populations are relatively small; population densities of the four studied Ituglanis species may be considered medium-to-low for troglobitic fish standards. I. passensis and I. bambui are sedentary species, with small home ranges; the low rates of individual growths recorded for I. passensis and I. bambui may indicate high longevity for these species. The pattern of recruitment and the trends in weight and condition factor decreasing for I. bambui during the dry season are probably related to progressive food depletion, which was not marked for I. passensis. I. bambui is under a more restrictive regime than I. passensis, probably due to isolation in an upper vadose tributary.

Author Contributions

Conceptualization, M.E.B., and E.T.; methodology, M.E.B., and E.T.; formal analysis, M.E.B.; writing—original draft preparation, M.E.B., and E.T.; writing—review and editing, M.E.B. and E.T. All authors have read and agreed to the published version of the manuscript.

Funding

This research was funded by Fundação de Amparo à Pesquisa do Estado de São Paulo (FAPESP), grant number 98/13858-1.

Institutional Review Board Statement

The study was conducted according to the guidelines of the Declaration of Helsinki, and approved by the Institutional Review Board of the Brazilian Environmental Federal Agency (IBAMA) and the Environmental Agency of Goiás (FEMAGO, SEMAD) protocols codes IBAMA 059/99 (25 October 1999) and FEMAGO 781/98 (8 December 1998).

Informed Consent Statement

Not applicable.

Data Availability Statement

Data from this study is available publicly.

Acknowledgments

We thank the Post-Graduation Program of Zoology from University of São Paulo (PPG- Zoology/IBUSP) for all infrastructure to develops this work; to colleagues who helped in the fieldwork, A. Chagas-Jr., M. R. Britto, F. D. Passos, S. Yaguiu, C. C. Aires, and E. A. Gimenez; to the local guides of Terra Ronca State Parka for all help in the fieldwork, R. H. Santos, G. L. de Souza, and D. L. Marques; to R. B. Schulz and A. V. Mello for providing all the necessary infrastructure for study at Terra Ronca; to Fundação de Amparo à Pesquisa do Estado de São Paulo (FAPESP) for the financial support to MEB, including Doctorate scholarship and grants (process 98/13858-1); to the Environmental Agency of Goiás (FEMAGO, SEMAD, process 781/98) and the Brazilian Environmental Federal Agency (IBAMA, process 059/99) for the collection and capture licenses; to D. M. Von Schimonsky for map of Figure 1A; to D. F. Torres (Figure 3D), D. Fenolio (Figure 2A–D), D. Menin (Figure 3A and part of Figure 4A), and A. Lobo (Figure 3B) for authorization to use the images; especially to Grupo Bambuí de Pesquisas Espeleológicas (GBPE) for the use permission of topographic maps of Angélica and Passa Três caves; to F. A. Bockmann, P. S. Santos, M. Toledo-Piza Ragazzo, J. Zuanon, J. E. Gallão, and E. Lunghi for critics and suggestions to the work. To two anonymous reviewers, for critics and suggestions to improve the work.

Conflicts of Interest

The authors declare no conflict of interest.

References

  1. Trajano, E.; Carvalho, M.R. Towards a biologically meaningful classification of subterranean organisms: A critical analysis of the schiner-racovitza system from a historical perspective, difficulties of its application and implications for conservation. Subterr. Biol. 2017, 22, 1–26. [Google Scholar] [CrossRef]
  2. Culver, D.C.; Pipan, T. The Biology of Caves and Other Subterranean Habitats; Oxford University Press: Oxford, UK, 2019. [Google Scholar]
  3. Trajano, E. Ecology of subterranean fishes: An overview. Environ. Biol. Fishes 2001, 62, 133–160. [Google Scholar] [CrossRef]
  4. Trajano, E.; Bichuette, M.E. Subterranean fishes of Brazil. In Biology of Subterranean Fishes; Trajano, E., Bichuette, M.E., Kapoor, B.G., Eds.; Science Publishers: Enfield, NH, USA, 2010; pp. 331–355. ISBN 9781439840481. [Google Scholar]
  5. Mitchell, R.W.; Russel, W.H.; Elliot, W.R. (Eds.) Mexican Eyeless Characin fishes, Genus Astyanax: Environment, Distribution, and Evolution; Texas Tech University Press: Lubbock, TX, USA, 1977; Volume 12. [Google Scholar]
  6. Bichuette, M.E.; Trajano, E. Population density and habitat of an endangered cave fish Eigenmannia vicentespelaea Triques, 1996 (Ostariophysi: Gymnotiformes) from a karst area in central Brazil. Neotrop. Ichthyol. 2015, 13, 113–122. [Google Scholar] [CrossRef] [Green Version]
  7. Balon, E.K. Epigenesis of an epigeneticist: The development of some alternative concepts on the early ontogeny and evolution of fishes. Guelph Ichthyol. Rev. 1990, 1, 1–42. [Google Scholar]
  8. Hüppop, K. How do cave animals cope with the food scarcity in caves? In Ecosystems of the World: Subterranean Ecosystems; Wilkens, H., Culver, D.C., Humphreys, W.F., Eds.; Elsevier Press: Amsterdam, The Netherlands, 2000; pp. 159–188. [Google Scholar]
  9. Trajano, E. Population ecology of Pimelodella kronei, troglobitic catfish from Southeastern Brazil (Siluriformes, Pimelodiae). Environ. Biol. Fishes 1991, 30, 407–421. [Google Scholar] [CrossRef]
  10. Trajano, E. Population ecology of Trichomycterus itacarambiensis, a cave catfish from eastern Brazil (Siluriformes, Trichomycteridae). Environ. Biol. Fishes 1997, 50, 357–369. [Google Scholar] [CrossRef]
  11. Trajano, E. Habitat and population data of troglobitic armoured cave catfishes, Ancistrus cryptophthalmus Reis 1987, from Central Brazil (Siluriformes: Loricariidae). In The biology of Hypogean Fishes; Springer: Berlin/Heidelberg, Germany, 2001; pp. 195–200. [Google Scholar]
  12. Trajano, E.; Bichuette, M.E. Population ecology of cave armoured catfish, Ancistrus cryptophthalmus Reis 1987, from central Brazil (Siluriformes: Loricariidae). Ecol. Freshw. Fish. 2007, 16, 105–115. [Google Scholar] [CrossRef]
  13. Means, M.L.; Johnson, J.E. Movement of Threatened Ozark Cavefish in Logan Cave National Wildlife Refuge, Arkansas. Southwest. Nat. 1995, 40, 308–313. [Google Scholar]
  14. Brown, J.Z.; Johnson, J.E. Population biology and growth of Ozark cavefish in Logan Cave national wildlife refuge, Arkansas. Environ. Biol. Fishes 2001, 62, 161–169. [Google Scholar] [CrossRef]
  15. Heuts, M.J. Ecology. Variation and Adaptation of the Blind African Cavefish Caecobarbus geertsii Blgr. Ann. La Soc. R. Zool. Belgique 1952, 82, 155–230. [Google Scholar] [CrossRef]
  16. Poulson, T.L. Cave Adaptation in Amblyopsid Fishes. Am. Midl. Nat. 1963, 70, 257–290. [Google Scholar] [CrossRef]
  17. Poulson, T.L. Population size, density, and regulation in cave fishes. In Proceedings of the 4th International Congress of Speleology; Bohinec, V., Gospodaric, R., Osole, F., Pretener, E., Eds.; Union Internationale de Spéléologie (UIS): Ljubljana, Slovenia, 1969; pp. 189–192. [Google Scholar]
  18. Fricke, R.; Eschmeyer, W.; Van der Laan, R. Eschmeyer’s Catalog of Fishes: Genera, Species, References; California Academy of Sciences: San Francisco, CA, USA, 2018. [Google Scholar]
  19. Bichuette, M.E.; De Pinna, M.C.C.; Trajano, E. A new species of Glaphyropoma: The first subterranean copionodontine catfish and the first occurrence of opercular odontodes in the subfamily (Siluriformes: Trichomycteridae). Neotrop. Ichthyol. 2008, 6, 301–306. [Google Scholar] [CrossRef] [Green Version]
  20. Fernández, L.; De Pinna, M.C.C. Phreatic catfish of the genus Silvinichthys from southern south America (Teleostei, Siluriformes, Trichomycteridae). Copeia 2005, 100–108. [Google Scholar] [CrossRef]
  21. Proudlove, G.S. Biodiversity and distribution of the subterranean fishes of the world. In Biology of Subterranean Fishes; Trajano, E., Bichuette, M.E., Kapoor, B.G., Eds.; Science Publishers: Enfield, NH, USA, 2010; pp. 41–64. [Google Scholar]
  22. Rizzato, P.P.; Costa, E.P.D.; Trajano, E.; Bichuette, M.E. Trichomycterus dali: A new highly troglomorphic catfish (Silurifomes: Trichomycteridae) from Serra da Bodoquena, Mato Grosso do sul state, central Brazil. Neotrop. Ichthyol. 2011, 9, 477–491. [Google Scholar] [CrossRef]
  23. Bichuette, M.E.; Rizzato, P.P. A new species of cave catfish from Brazil, Trichomycterus rubbioli sp. n., from Serra do Ramalho karstic area, São Francisco River basin, Bahia State (Silurifomes: Trichomycteridae). Zootaxa 2012, 48–66. [Google Scholar] [CrossRef] [Green Version]
  24. Castellanos-Morales, C.A. Trichomycterus santanderensis: A new species of troglomorphic catfish (Siluriformes, Trichomycteridae) from Colombia. Zootaxa 2007, 49–55. [Google Scholar] [CrossRef] [Green Version]
  25. Castellanos-Morales, C.A. A new species of cave catfish, genus Trichomycterus (Siluriformes: Trichomycteridae), from the Magdalena River system, Cordillera Oriental, Colombia. Biota Colomb. 2018, 19, 115–128. [Google Scholar] [CrossRef]
  26. Castellanos-Morales, C.A.; Galvis, F. Las Especies Del Género Trichomycterus (Siluriformes: Trichomycteridae) En Colombia. Boletín Científico. Cent. Museos. Mus. Hist. Nat. 2012, 16, 194–206. [Google Scholar]
  27. Mesa S, L.M.; Lasso, C.A.; Ochoa, L.E.; DoNascimiento, C. Trichomycterus rosablanca (Siluriformes, Trichomycteridae) a new species of hipogean catfish from the Colombian Andes. Biota Colomb. 2018, 19, 95–116. [Google Scholar] [CrossRef]
  28. Fernández, L.; Bichuette, M.E. A new cave dwelling species of Ituglanis from the São Domingos karst, central Brazil (Siluriformes: Trichomycteridae). Ichthyol. Explor. Freshw. 2002, 13, 273–278. [Google Scholar]
  29. Bichuette, M.E.; Trajano, E. Three new subterranean species of Ituglanis from Central Brazil (Siluriformes: Trichomycteridae). Ichthyol. Explor. Freshw. 2004, 15, 243–256. [Google Scholar]
  30. Bichuette, M.E.; Trajano, E. Ituglanis mambai, a new subterranean catfish from a karst area of Central Brazil, rio Tocantins basin (Siluriformes: Trichomycteridae). Neotrop. Ichthyol. 2008, 6, 9–15. [Google Scholar] [CrossRef] [Green Version]
  31. Rizzato, P.P.; Bichuette, M.E. Ituglanis boticario, a new troglomorphic catfish (Teleostei: Siluriformes: Trichomycteridae) from Mambaí karst area, central Brazil. Zoologia 2014, 31, 577–598. [Google Scholar] [CrossRef] [Green Version]
  32. Bichuette, M.E. Distribuição, Biologia, Ecologia Populacional e Comportamento de Peixes Subterrâneos, Gêneros Ituglanis (Siluriformes: Trichomycteridae) e Eigenmannia (Gymnotiformes: Sternopygidae) da área Cárstica de São Domingos, Nordeste de Goiás; Universidade de São Paulo: São Paulo, Brazil, 2003. Available online: https://dspace.icmbio.gov.br/jspui/handle/cecav/278 (accessed on 28 December 2020).
  33. Bichuette, M.E.; Trajano, E. Epigean and subterranean ichthyofauna from the São Domingos karst area, Upper Tocantins River basin, Central Brazil. J. Fish. Biol. 2003, 63, 1100–1121. [Google Scholar] [CrossRef] [Green Version]
  34. Gallão, J.E.; Bichuette, M.E. Brazilian obligatory subterranean fauna and threats to the hypogean environment. Zookeys 2018, 746, 1–23. [Google Scholar] [CrossRef] [PubMed] [Green Version]
  35. Trajano, E.; Reis, R.E.; Bichuette, M.E. Pimelodella spelaea: A new cave catfish from central Brazil, with data on ecology and evolutionary considerations (Siluriformes: Heptapteridae). Copeia 2004, 315–325. [Google Scholar] [CrossRef]
  36. Begon, M. Investigating Animal Abundance, 1st ed.; Edward Arnold: London, UK, 1979. [Google Scholar]
  37. Krebs, C.J. Ecological Methodology, 2nd ed.; Harper & Row: New York, NY, USA, 1989. [Google Scholar]
  38. Yamamura, P.; Watanabe, K. Manuais Didáticos de Física; Instituto de Física, Universidade de São Paulo: São Paulo, Brazil, 1992; p. 18. [Google Scholar]
  39. Bagenal, T.B.; Tesch, F.W. Age and growth. In Methods for the Assessment of Fish Production in Fresh Waters; Bagenal, T.B., Ed.; Blackwell Scientific: Oxford, UK, 1978; pp. 101–136. [Google Scholar]
  40. Dice, L.R.; Leraas, H.J. A Graphic Method for Comparing Several Sets of Measurements. Contrib. Lab. Vert. Biol. 1936, 3, 1–3. [Google Scholar]
  41. Zar, J.H. Biostatistical Analysis, 5th ed.; Pearson: London, UK, 2009. [Google Scholar]
  42. Moore, G.; Sullivan, N. Speleology: Caves and the Cave Environment, 3rd ed.; Moore, G., Sullivan, N., Eds.; Cave Books: Saint Louis, MI, USA, 1997. [Google Scholar]
  43. Knapp, S.M.; Fong, D.W. Estimates of population size of Stygobromus emarginatus (Amphipoda: Crangonyctidae) in a headwater stream in Organ Cave, west Virginia. J. Cave Karst Stud. 1999, 61, 3–6. [Google Scholar]
  44. Gloria, A.F. Preferencias de habitat de peces siluriformes de aguas continentales de Chile (Fam. Diplomystidae y Trichomycteridae). Stud. Neotrop. Fauna Environ. 1983, 18, 217–237. [Google Scholar] [CrossRef]
  45. Rondineli, G.R.; Carmassi, A.L.; Braga, F.M.S. Population biology of Trichomycterus sp. (Siluriformes, Trichomycteridae) in Passa Cinco stream, Corumbataí River sub-basin, São Paulo State, southeastern Brazil. Braz. J. Biol. 2009, 69, 925–934. [Google Scholar] [CrossRef] [Green Version]
  46. Carvalho, M.S.; Zuanon, J.; Ferreira, E.J.G. Diving in the sand: The natural history of Pygidianops amphioxus (Siluriformes: Trichomycteridae), a miniature catfish of Central Amazonian streams in Brazil. Environ. Biol. Fishes 2014, 97, 59–68. [Google Scholar] [CrossRef]
  47. de Pinna, M.C.C.; Kirovsky, A.L. A new species of sand-dwelling catfish, with a phylogenetic diagnosis of Pygidianops Myers (Siluriformes: Trichomycteridae: Glanapteryginae). Neotrop. Ichthyol. 2011, 9, 493–504. [Google Scholar] [CrossRef] [Green Version]
  48. Suzuki, F.; Zambaldi, L.; Pompeu, P.d. Uso de marcação e recaptura para estimar a abundância e densidade de Trichomycterus brasiliensis (Siluriformes, Trichomycteridae) em poções do córrego da Bexiga, Carrancas, Minas Gerais, Brasil. Bol. Mus. Biol. Mello Leitão. Nov. Série 2010, 28, 89–104. [Google Scholar]
  49. Romero, A., Jr. Observaciones preliminares sobre la conducta en individuos cavernícolas de Trichomycterus conradi (Pisces: Trichomycteridae). Boletín Soc. Venez. Ciencias Nat. 1987, 41, 205–216. [Google Scholar]
  50. Tencatt, L.F.C.; Bichuette, M.E. Aspidoras mephisto, new species: The first troglobitic Callichthyidae (Teleostei: Siluriformes) from South America. PLoS ONE 2017, 12, e0171309. [Google Scholar] [CrossRef]
  51. Zamudio, K.R.; Robertson, J.M.; Chan, L.M.; Sazima, I. Population structure in the catfish Trichogenes longipinnis: Drift offset by asymmetrical migration in a tiny geographic range. Biol. J. Linn. Soc. 2009, 97, 259–274. [Google Scholar] [CrossRef] [Green Version]
  52. Matthews, W.J. Patterns in Freshwater Fish Ecology, 1st ed.; Matthews, W.J., Ed.; Springer: Berlin/Heidelberg, Germany, 1998. [Google Scholar]
  53. Miranda-Chumacero, G.; Álvarez, G.; Luna, V.; Wallace, R.B.; Painter, L. First observations on annual massive upstream migration of juvenile catfish Trichomycterus in an Amazonian River. Environ. Biol. Fishes 2015, 98, 1913–1926. [Google Scholar] [CrossRef]
Figure 1. (A) Map of study area, São Domingos karst area, Central Brazil, upper Tocantins River basin, source: D. M. Von Schimonsky; (B) sinkhole of São Vicente cave system.
Diversity 13 00091 g001
Figure 2. Ituglanis species from São Domingos karst area, central Brazil. (A) Ituglanis passensis; (B) Ituglanis epikarsticus; (C) Ituglanis bambui; (D) Ituglanis ramiroi. Photos: D. Fenolio.
Diversity 13 00091 g002
Figure 3. Habitats of Ituglanis species from São Domingos karst area, Central Brazil. (A) Subterranean level-base stream at Passa Três cave, locality of I. passensis (photo: D. Menin); (B) rimstone pools at São Mateus cave, locality of I. epikarsticus (photo. A. Lobo); (C) upper vadose tributary from Angélica cave, locality of I. bambui; (D) pool formed by epikarstic water at São Bernardo cave, locality of I. ramiroi (photo: D. F. Torres).
Diversity 13 00091 g003
Figure 4. (A) Passa Três cave map and waterfall located between 7 and 8 sections. Map modified from Grupo Bambuí de Pesquisas Espeleológicas (GBPE), photo of waterfall: D. Menin. (B) Angélica cave map with detailed sections on upper vadose tributary. Map modified from Grupo Bambuí de Pesquisas Espeleológicas (GBPE).
Diversity 13 00091 g004aDiversity 13 00091 g004b
Figure 5. Population density means and SEM for I. passensis ((A), per samples, all sections: 1 July 1999; 2 September 1999; 3 April 2000; 4 July 2000; 5 September 2000; 6 May 2001; 7 August 2001; 8 August 2001 downstream from the sump; (B), per grouped sections: 1, 8–9; 2, 10–11; 3, 12–13; 4, 14–15; 5, 16–17; 6, 18–20) and I. bambui ((C), per samples, all sections: 1 July 1999; 2 September 1999; 3 May 2000; 4 August 2000; 5 September 2000; 6 April 2001; 7 August 2001; (D), per grouped sections: 1, 1–2; 2, 3–4; 3, 5–6; 4, 7–8; 5, 9–10; 6, 11–12; 7, 13–14; 8, 15–17).
Diversity 13 00091 g005
Figure 6. Population densities of I. epikarsticus and I. ramiroi based on visual census method.
Diversity 13 00091 g006
Figure 7. Dice-Leeras diagram showing the means and standard errors for I. passensis standard lengths (SL). 1 July 1999; 2 September 1999; 3 April 2000; 4 July 2000; 5 September 2000; 6 May 2001; 7 August 2001; 8 August 2001 downstream from the sump.
Diversity 13 00091 g007
Figure 8. Dice-Leeras diagram showing means and standard errors for I. passensis weights (W). 1 July 1999; 2 September 1999; 3 April 2000; 4 July 2000; 5 September 2000; 6 May 2001; 7 August 2001; 8 August 2001 downstream from the sump.
Diversity 13 00091 g008
Figure 9. Dice-Leeras diagram showing means and standard errors for I. passensis condition factor (K). 1 July 1999; 2 September 1999; 3 April 2000; 4 July 2000; 5 September 2000; 6 May 2001; 7 August 2001; 8 August 2001 downstream from the sump.
Diversity 13 00091 g009
Figure 10. Dice-Leeras diagram showing means and standard errors for I. bambui standard lengths (SL). 1 July 1999; 2 September 1999; 3 May 2000; 4 August 2000; 5 September 2000; 6 April 2001; 7 August 2001.
Diversity 13 00091 g010
Figure 11. Dice-Leeras diagram showing means and standard errors for I. bambui weights (W). 1 July 1999; 2 September 1999; 3 May 2000; 4 August 2000; 5 September 2000; 6 April 2001; 7 August 2001.
Diversity 13 00091 g011
Figure 12. Dice-Leeras diagram showing means and standard errors of I. bambui condition factor (K). 1 July 1999; 2 September 1999; 3 May 2000; 4 August 2000; 5 September 2000; 6 April 2001; 7 August 2001.
Diversity 13 00091 g012
Figure 13. Monthly rainfall recorded in 1999, 2000, and 2001 at the Meteorological Station of Posse, Goiás, Central Brazil (Source: National Institute of Meteorology (INMET)).
Diversity 13 00091 g013
Figure 14. Water physico-chemical variables. (A) Passa Três cave base level stream (point 1), between July 1999 and August 2001. (B) Angélica upper vadose tributary, between September 1999 and August 2001. The left axis represents the values of pH, dissolved oxygen (DO), and temperature; the right axis represents the values for conductivity (cond.) and salinity (sal.) variables.
Diversity 13 00091 g014
Table 1. Population data for I. passensis per capture-recapture events. R, number of recaptures; RR, rates of recapture; N, population size; SE, standard error; CI, confidence interval. Lincoln–Petersen method.
Total ObservedCapturesReleasedRRR (%)N (SE) (CI)
July 1999272727 -
September 1999333333 0-
April 2000111010 -
July 2000393434 0-
July 2000393434 152.0 (43.5)
September 20003734 720.6(94.7–342.1)
May 2001363131 719.0 (393.7)
August 200148444413.2(226.7–1369.1)
August 2001484444 83.8 (10.9)
August 20014848 2556.8(70.9–104.8)
Table 2. Population data for I. bambui per capture-recapture events. R, number of recaptures; RR, rates of recapture; N, population size; SE, standard error; CI, confidence interval. Lincoln–Petersen method.
Total ObservedCapturesReleasedRRR (%)N (SE) (CI)
July 1999271511 77.0 (37.9)
September199942121219.1(23.7–147.4)
May 2000451818 246.0 (129.8)
August 200064252215.6(77.1–469.0)
August 2000642522 -
September20002717 0-
April 2001891311 -
August 2001591716 0-
August 2001591716 61.3 (25.0)
August 20013110 212.5(30.3–446.5)
Table 3. Population densities (ind/m2) for I. passensis per sections of Passa Três cave between July 1999 and August 2001. No catfish records from 1 to 7 sections. SEM, standard error of the mean. 0, fish-free samples.
Sections
Date8–910–1112–1314–1516–1718–19–20MeanSEM
July 199900.020.070.050.10.230.0780.033
September 199900.070.050.070.170.270.1050.039
April 20000000.020.020.150.0320.024
July 200000.130.050.0500.480.1180.074
September 20000.10.070.050.050.020.450.1230.066
May 200100.10.0500.020.480.1080.075
August 200100.20.10.30.20.70.2500.099
Mean0.0140.0840.0530.0770.0760.394
SEM0.0140.0250.0110.0380.0310.071
Table 4. Population densities (ind/m2) for I. bambui per sections of Angélica cave between July 1999 and August 2001. SEM, standard error of the mean. 0, fish-free samples.
Sections
Date1–23–45–67–89–1011–1213–1415–16–17MeanSEM
July 19990.2300.0080.0250.130.230.0300.0820.035
September 19990.030.0250.020.0210.030.230.230.050.0800.033
April 20000.10.0160.0080.0130.060.30.2600.0950.042
August 20000.130.1160.020.01660.370.30.20.0660.1520.045
September 200000.0830.0040.0130.030.030.130.0380.0410.015
April 20010.230.050.0210.0710.40.570.230.0720.2060.068
August 20011.030.1160.0370.0460.030.230.10.0770.2080.119
Mean0.2500.0580.0170.0290.1500.2700.1690.043
SEM0.1340.0180.0040.0080.0620.0600.0310.012
Table 5. Individual growth for I. passensis and I. bambui. %, growth in relation to the initial standard length (ISL, in mm); i, time interval in days; FSL, final standard length (in mm); null, differences between initial and final standard lengths fell within the interval of the propagated final error (±0.14 mm).
I. passensis, Passa Três caveISLFSLIncrement%iGrowth Rate (mm/month)
Ind 1 54.957.72.85.1521.62
Ind 2 68.569.30.81.2520.46
Ind 3 40.443.22.86.9521.62
Ind 4 59.061.12.13.6521.21
Ind 5 60.062.12.13.5521.21
Ind 6 66.065.4−0.6−0.9152−0.35
Ind 7 64.865.60.81.2520.46
Ind 8 67.367.2−0.1−0.1498null
I. bambui, Angélica caveISLFSLincrement%iGrowth rate (mm/month)
Ind 132.735.73.09.2571.58
Ind 265.366.51.21.8920.39
Table 6. Distribution data (modes) for I. passensis considering standard length (SL, in mm), weight (W, in g), and condition factor (K).
DateSLWK
July 199945.0–47.5; 57.5–62.51.5–2.0; 2.0–2.52.25–2.5; 3.0–3.25
September 199947.5–50.0; 52.5–55.0; 55.0–57.5; 60.0–62.51.5–2.0; 2.0–2.5; 3.0–3.51.75–2.0; 2.0–2.25; 3.5–3.75
April 200045.0–50.0; 60.0–65.00.5–1.0; 1.0–1.5; 2.0–2.5; 3.0–3.52.0–2.5; 2.5–3.0; 3.5–4.0
July 200045.0–47.51.0–1.51.25–1.5; 1.5–1.75; 3.25–3.5
September 200042.5–45.0; 62.5–65.00.5–0.75; 0.75–1.0; 1.0–1.25; 1.25–1.5; 1.5–2.0; 2.25–2.5; 2.5–2.751.75–2.0; 2.0–2.25; 2.75–3.0; 3.0–3.25
May 200152.5–55.0; 55.0–57.5; 57.5–60.02.0–2.52.5–2.75; 2.75–3.0; 3.25–3.5
August 2001 upstream the sump57.5–60.02.0–2.52.5–3.0
August 2001 downstream the sump48.0–50.0; 52.0–54.0; 58.0–60.01.5–1.752.0–2.25; 2.25–2.5; 2.75–3.0
Table 7. Distribution data (modes) for I. bambui considering standard length (SL, in mm), weight (W, in g), and condition factor (K).
DateSLWK
July 199917.5–20.0; 20.0–22.5; 32.5-35.00–0.25; 0.5–0.750.50–1.0
September 199922.5–25.00–0.25; 0.25–0.50.38–0.50; 0.50–0.63; 0.63–0.75
May 200025.0–30.00–0.5; 0.5–1.00.25–0.50; 0.50–0.75; 1.0–1.25
August 200025.0–30.0; 45.0–50.00–0.5; 0.5–1.00.25–0.50
September 200022.5–25.0; 25.0–27.50–0.25; 0.5–0.750.25–0.50; 1.0–1.25
April 200122.0–24.0; 28.0–30.0; 30.0–32.00.25–0.380.56–0.63
August 200120.0–22.50.13–0.25; 0.25–0.380.38–0.50
Table 8. Physico-chemical variables of Passa Três cave base level stream, Angélica cave upper vadose tributary, and epigean stretches of Passa Três, Angélica, São Mateus, and São Bernardo streams. cond., conductivity (ms.cm−1); DO, dissolved oxygen (mg.L−1); T, temperature (°C); sal., salinity (%); 1, 50 m downstream the sinkhole of Passa Três cave; 2, 340 m downstream the sinkhole of Passa Três cave; , no records.
Passa Três CaveAngélica Cave
12
Date(pH/cond./DO/T/sal.)(pH/cond./DO/T/sal.)(pH/cond./DO/T/sal.)
July 19997.9/0.357/8.5/19.7/0.018.1/0.353/8.9/19.6/0.01
September 19997.9/0.350/8.3/19.2/0.017.5/0.367/8.0/20.0/08.4/0.339/7.5/20.4/0.01
April–May 20007.2/0.264/8.3/22.5/0.017.7/0.293/8.4/21.4/0.017.9/0.528/8.2/23.6/0.02
July–August 20008.2/0.327/8.3/20.5/0.018.3/0.336/6.9/19.3/0.018.6/0.431/7.7/19.9/0.01
September 20007.8/0.326/7.1/22.6/0.017.8/0.337/7.8/21.9/0.018.0/0.362/6.6/21.6/0,01
April–May 20018.2/0.435/5.7/22.7/0.017.7/0.316/7.9/21.3/07.6/0.487/6.6/23.2/0.02
August 20018.1/0.320/5.8/19.2/0.018.4/0.323/4.6/19.2/0.018.0/0.410/6.0/21.0/0.01
São Mateus cave (rimstone pools) São Bernardo cave
(epikarstic pool)
Date(pH/cond./DO/T/sal.) (pH/cond./DO/T/sal.)
May 19997.7/0.706/7.74/24.8/0.03 6.8/0.349/5.05/23.1/0.01
Epigean streams
Passa Três streamAngélica stream
Date(pH/cond./DO/T/sal.)(pH/cond./DO/T/sal.)
April–May 20007.9/0.262/6.9/22.6/0.017.7/0.041/8.4/24.4/0
July–August 20008.2/0.320/7.5/20.8/0.017.8/0.010/8.5/23.3/0
September 20007.7/0.326/6.2/22.8/0.017.2/0.010/8.0/25.6/0
April–May 20017.8/0.320/6.4/21.8/06.9/0.080/6.6/25.3/0
August 20017.7/0.307/5.8/19.2/0.01
São Mateus streamSão Bernardo stream
Date(pH/cond./DO/T/sal.)(pH/cond./DO/T/sal.)
May 19996.6/0.025/9.25/21.9/0 5.6/0.010/8.03/24.8/0
Publisher’s Note: MDPI stays neutral with regard to jurisdictional claims in published maps and institutional affiliations.