Abstract
Citizen science may offer a way to improve our knowledge of the spatial distribution of biodiversity and endemism, as the data collected by this method can be integrated into existing data sources to provide a more robust understanding of broad scale patterns of species richness. We explored whether data collected by citizen scientists agree on identifying regions of high avian species richness in a well-studied state. We compiled and examined the number of bird species detected in each of the 77 counties of Oklahoma based on published range maps, museum collections, and by five citizen science methods: the USGS Breeding Bird Survey, the Oklahoma Breeding Bird Atlas, eBird, the Oklahoma Winter Bird Atlas, and National Audubon Society Christmas Bird Counts. We also quantified the number of species of conservation concern recorded by each method in each county. A total of 460 species were reported across the state, with the total number of species detected by each method ranging from 40% of this total (Winter Bird Atlas) to 94% of this total (eBird). In general, species totals were poorly correlated across methods, with only six of 21 combinations (28.6%) showing significant correlations. Total species numbers recorded in each county were correlated with human population density and county area, but not with mean annual temperature or precipitation. The total number of species of conservation concern was correlated with the total number of species detected, county area, and precipitation. Most of the citizen science methods examined in this study were not explicitly designed to identify regions of high biodiversity and so efforts to use these methods for this purpose should be employed only cautiously and with a thorough understanding of potential biases.
1. Introduction
Citizen science has taken on an increasing role in data collection and species identification at a local scale. When networked, citizen science contributions facilitate a deeper understanding of broad scale biodiversity patterns [1,2]. In the ecological sciences, data collected by citizen scientists that pertains to species identification and location has the potential to provide a more thorough understanding of spatial and temporal patterns in species’ distributions [3] and potential shifts in migration pathways due to climate change [4]. Citizen science programs often have dual goals; engaging the public to collect data as well as helping participants become better educated about the scientific process and the organisms they are studying [5]. While large data sets have the potential of expanding the scientific understanding of the spatial and temporal scale of species’ distributions, authors have noted that the utility of citizen science projects may be limited by heterogeneity of effort, skill and spatial extent [6,7,8].
One of the strengths of citizen science is the documentation of biodiversity across a range of spatiotemporal scales. For example, citizen scientists have taken a leading role in recording bird diversity during the breeding season through Breeding Bird Surveys, during early winter through Christmas Bird Counts, and year-round through eBird [2,9,10]. Data collected by citizen scientists can also be useful in examining the status and distribution of species of conservation concern [11,12,13].
However, while citizen science projects can yield a wealth of valuable information that can be useful for education, research, and management [1,2,14], the design and implementation of these projects can be challenging (e.g., [15]). While there are several different citizen science methods that document bird species diversity, there are variabilities in sampling effort and methodologies that can limit the interpretation of the data [16]. For example, observers’ skill levels may change through time, influencing the number of species recorded [9]. Additionally, different methodologies may not report the same number of species and species of conservation concern in the same area [17].
The goal of this project was to examine whether museum collections and published range maps identify the same regions of high avian biodiversity as citizen science projects in Oklahoma. Avian diversity is generally greater in areas with mild, moist climates [18] as these regions typically have the greatest habitat heterogeneity [19]. Consequently, we hypothesized that all methods should identify eastern and southern Oklahoma as the region with the greatest avian biodiversity. We also predicted that the methods should show a strong correlation in the number of species of conservation concern detected. We hypothesized that there should be variability in the absolute number of species detected by each method, depending upon the season(s) that data are collected. Finally, we hypothesized that each method should record similar avian communities in each location.
2. Materials and Methods
The state of Oklahoma (USA) covers 177,660 km2 and ranges in elevation from 88 to 1516 m above sea level [20,21] Figure 1. Oklahoma consists of 12 Level III Ecoregions, including High Plains, Southwestern Tablelands, Central Great Plains, Flint Hills, Cross Timbers, East Central Texas Plains, South Central Plains, Ouachita Mountains, Arkansas Valley, Boston Mountains, Ozark Highlands, and the Central Irregular Plains [22,23].
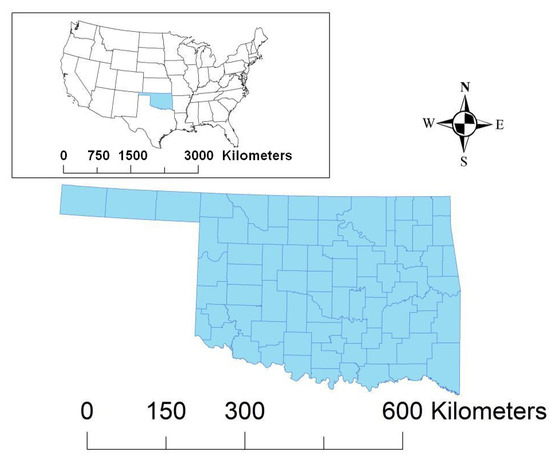
Figure 1.
The state of Oklahoma (shown in blue) is located in southern Great Plains of the United States of America, and contains 77 counties.
We used the VertNet portal to download all global museum records of birds from Oklahoma. VertNet is a free, publicly accessible database (http://www.vertnet.org/ accessed on 2 March 2015) that contains specimen information from museum collections for birds, mammals, reptiles, amphibians, and fish [24]. This project provides global specimen data for over 17,000,000 records from 203 data resources incorporating 270 collections [25,26].
The Sutton Center Oklahoma Breeding Bird Atlas (OBBA) was conducted from 1997–2001 [27]. A stratified random sampling approach was used to select 583 blocks, each covering approximately 25 km2, from U.S. Geological Survey 7.5-min quadrangle maps [27]. With the restriction that blocks could not share a border, one survey block was randomly selected within the area covered by every two adjacent USGS 7.5-min topographic maps for Oklahoma, resulting in relatively uniform statewide coverage. A minimum of ten hours of survey time was suggested for each block, and observers were instructed to visit as many habitat types as possible within each block. Bird observations were accomplished largely through roadside travel, supplemented with opportunistic driving or walking visits onto private lands when permission could be obtained. More than 100 volunteers participated in this project and recorded birds in each block as “Observed” (but not believed to breed), “Possible” breeders, “Probable” breeders, and “Confirmed” breeders [27].
The Breeding Bird Survey (BBS) is a joint collaboration between the United States Geological Survey, the Canada Wildlife Service, and the Mexican National Commission for the Knowledge and Use of Biodiversity [10]. Volunteers engage in roadside surveys of birds late May through early July [10]. Each route contains 50 stops spaced 800 m apart [10]. Surveys begin 30 min before sunrise and observers record all birds seen or heard within a 400 m radius seen and heard during a three-minute count [10]. The information gathered from the BBS has been used to calculate population trends for more than 400 species across North America [10]. There are 71 routes in Oklahoma, ranging from 0–5 routes per county.
In 2002, the Cornell Laboratory of Ornithology and the National Audubon Society created eBird with the goal of better understanding avian distribution in space and time [3,28]. A web interface (available in English, Spanish, and French) allows users to enter the number of birds observed at a given location, during either effort-based counting (e.g., traveling counts, stationary counts, and area counts) or through incidental observation [28]. We used the eBird portal to download all records of birds recorded in Oklahoma through 2014.
The Oklahoma Winter Bird Atlas (OWBA) involved surveying the same 583 blocks of land surveyed in the OBBA [29]. Bird surveys were conducted over five winters from 2003 to 2008, with each block surveyed during one of the five winters of the project period. Surveys took place between 1 December and 14 February each winter, and at least two visits to each block were required. The first visit was conducted on or before 7 January, while the second visit occurred after this date and at least two weeks after the first visit. A minimum of eight hours of survey time was required for each block, at least four hours in the early winter period and four in the late winter period, and observers were instructed to visit as many habitat types as possible within each block during each period. Bird observations were accomplished largely through roadside travel, supplemented with opportunistic driving or walking visits onto private lands when permission could be obtained. All species seen or heard were recorded, including abundance categorizations for the numbers of individuals observed: 1–9 birds, 10–99 birds, 100–999 birds, 1000–9999 birds, or more than 10,000 birds. Accomplishing the statewide scope and scale of the OWBA project relied on the participation of over 60 skilled volunteer birders in addition to project staff.
The National Audubon Society Christmas Bird Counts (CBC) have been performed in the US annually since 1900 [1]. Initially, only 25 locations were counted [27], but the number of counts has increased to 2434 counts completed in 2020 [30]. Each Christmas Bird Count is held on a single day between 14 December and 5 January [16]. All birds seen or heard in a count circle with a diameter of 24.1 km (15 miles) during the 24-h period are recorded [16]. The National Audubon Society maintains a database of all counts [30]. We downloaded Christmas Bird Count data for Oklahoma through the 115th count (2014–15). The number of Oklahoma counts has varied over the years, but is currently about 20 counts per year.
BirdLife International and NatureServe have jointly published maps of all the bird species in the world [31]. These maps were created by digitizing existing range maps [31]. We downloaded these maps and tallied the number of species breeding in each county.
In order to examine how well each method recorded rare species in each county, we also examined whether birds of conservation concern were noted, using the birds of conservation concern from U.S. Fish and Wildlife Service Region 2 (Table 1; [32]).

Table 1.
Bird species of conservation concern in US Fish and Wildlife Region 2, which includes Arizona, Oklahoma, New Mexico, and Texas. Only species that have been officially recorded in Oklahoma based on Oklahoma Bird Records Committee [33] are shown, and taxonomy follows the American Ornithological Society [34].
We compared all data sources against the official state bird list [33] and removed species not on the official list from the analysis. We likewise removed hybrid individuals. The names of several species of birds changed during the 20th and 21st centuries as taxonomy was updated [35], and so old synonyms were replaced with current names. In addition, individuals that were only identified to genus were removed.
We created maps of species totals by method using ARCGIS 10.4. We calculated correlations among methods using the Spearman rank correlation as the data were non-normally distributed. We calculated Bray–Curtis dissimilarities [36] and employed Mantel tests on the dissimilarities to determine whether richness varies based on temperature or precipitation. We used detrended correspondence analysis (DCA) on presence data to visualize the overlap in species communities sampled by each method and created 95% confidence intervals for each method. We used multi-response permutation probabilities (MRPP) to evaluate whether sampled communities differ significantly [37]. Statistical analyses were performed using R 3.3.2.
3. Results
A total of 459 bird species were detected by all seven methods combined. OBBA detected 210 species (46% of the total), BBS detected 196 species (43% of the total), CBC detected 307 species (67% of the total), the OWBA included 183 species (40% of the total), eBird included 432 species (94% of the total), museums included 400 species (87% of the total), and NatureServe included 197 species (43% of the total).
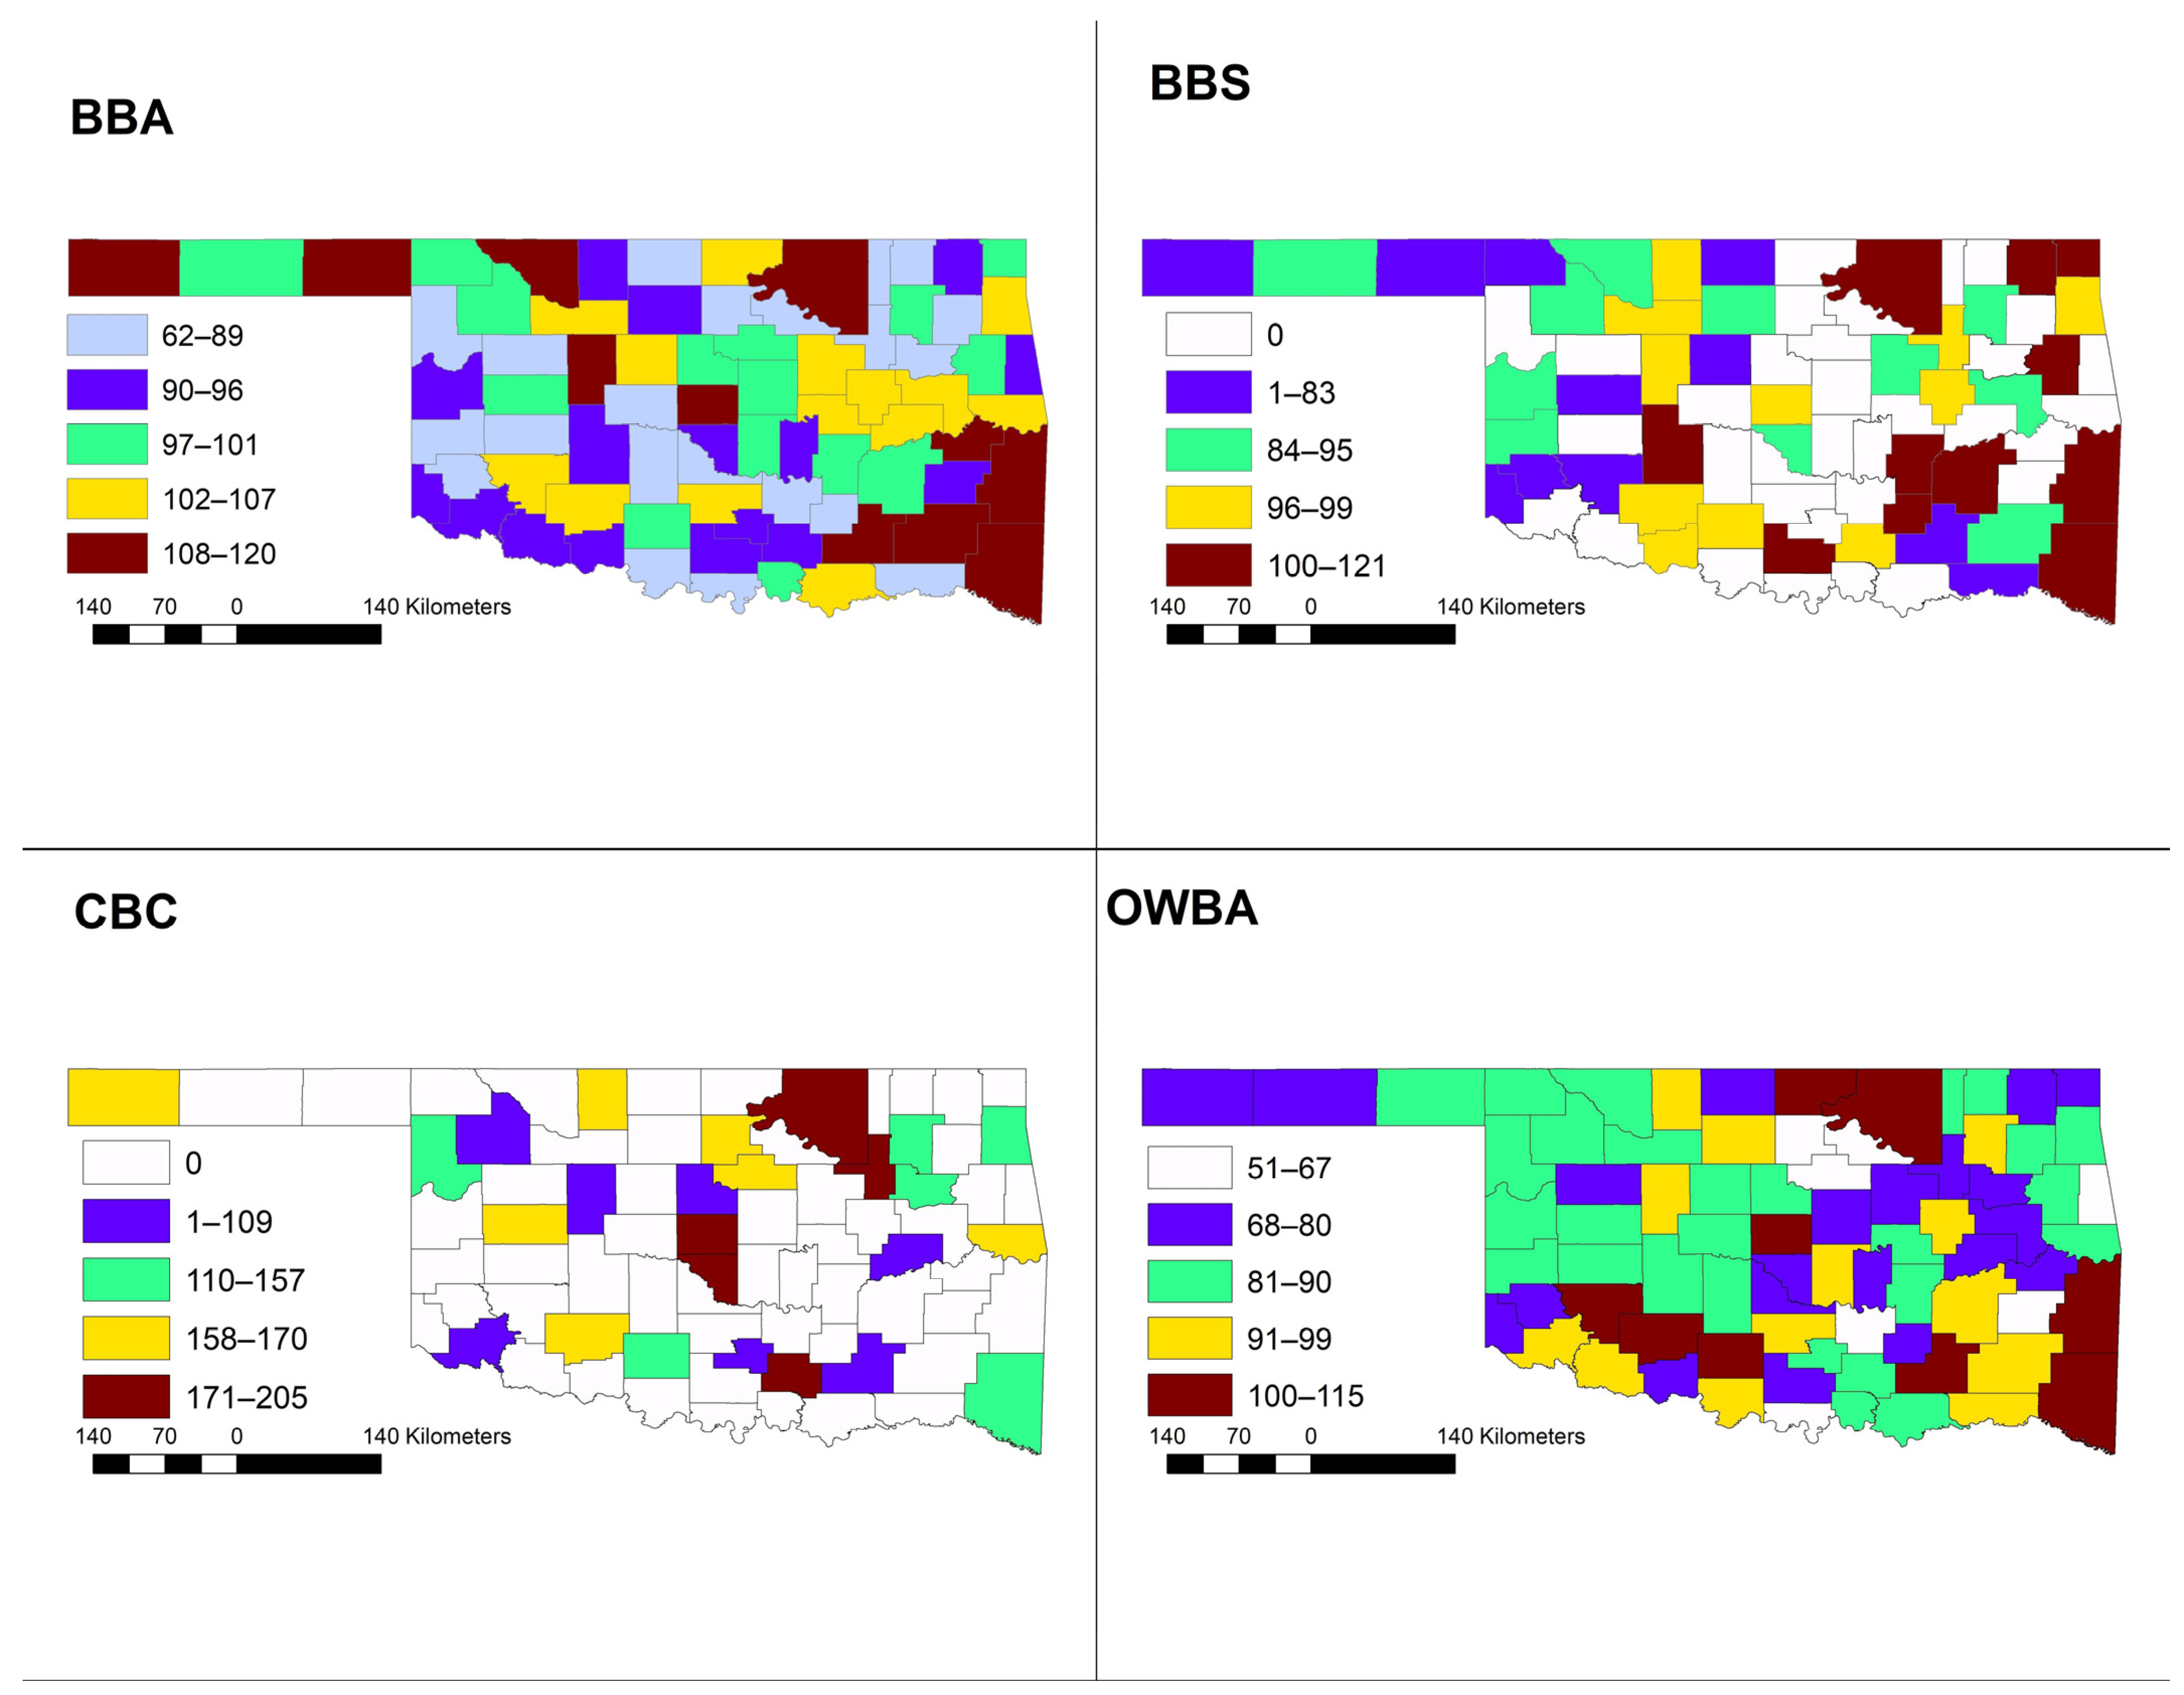
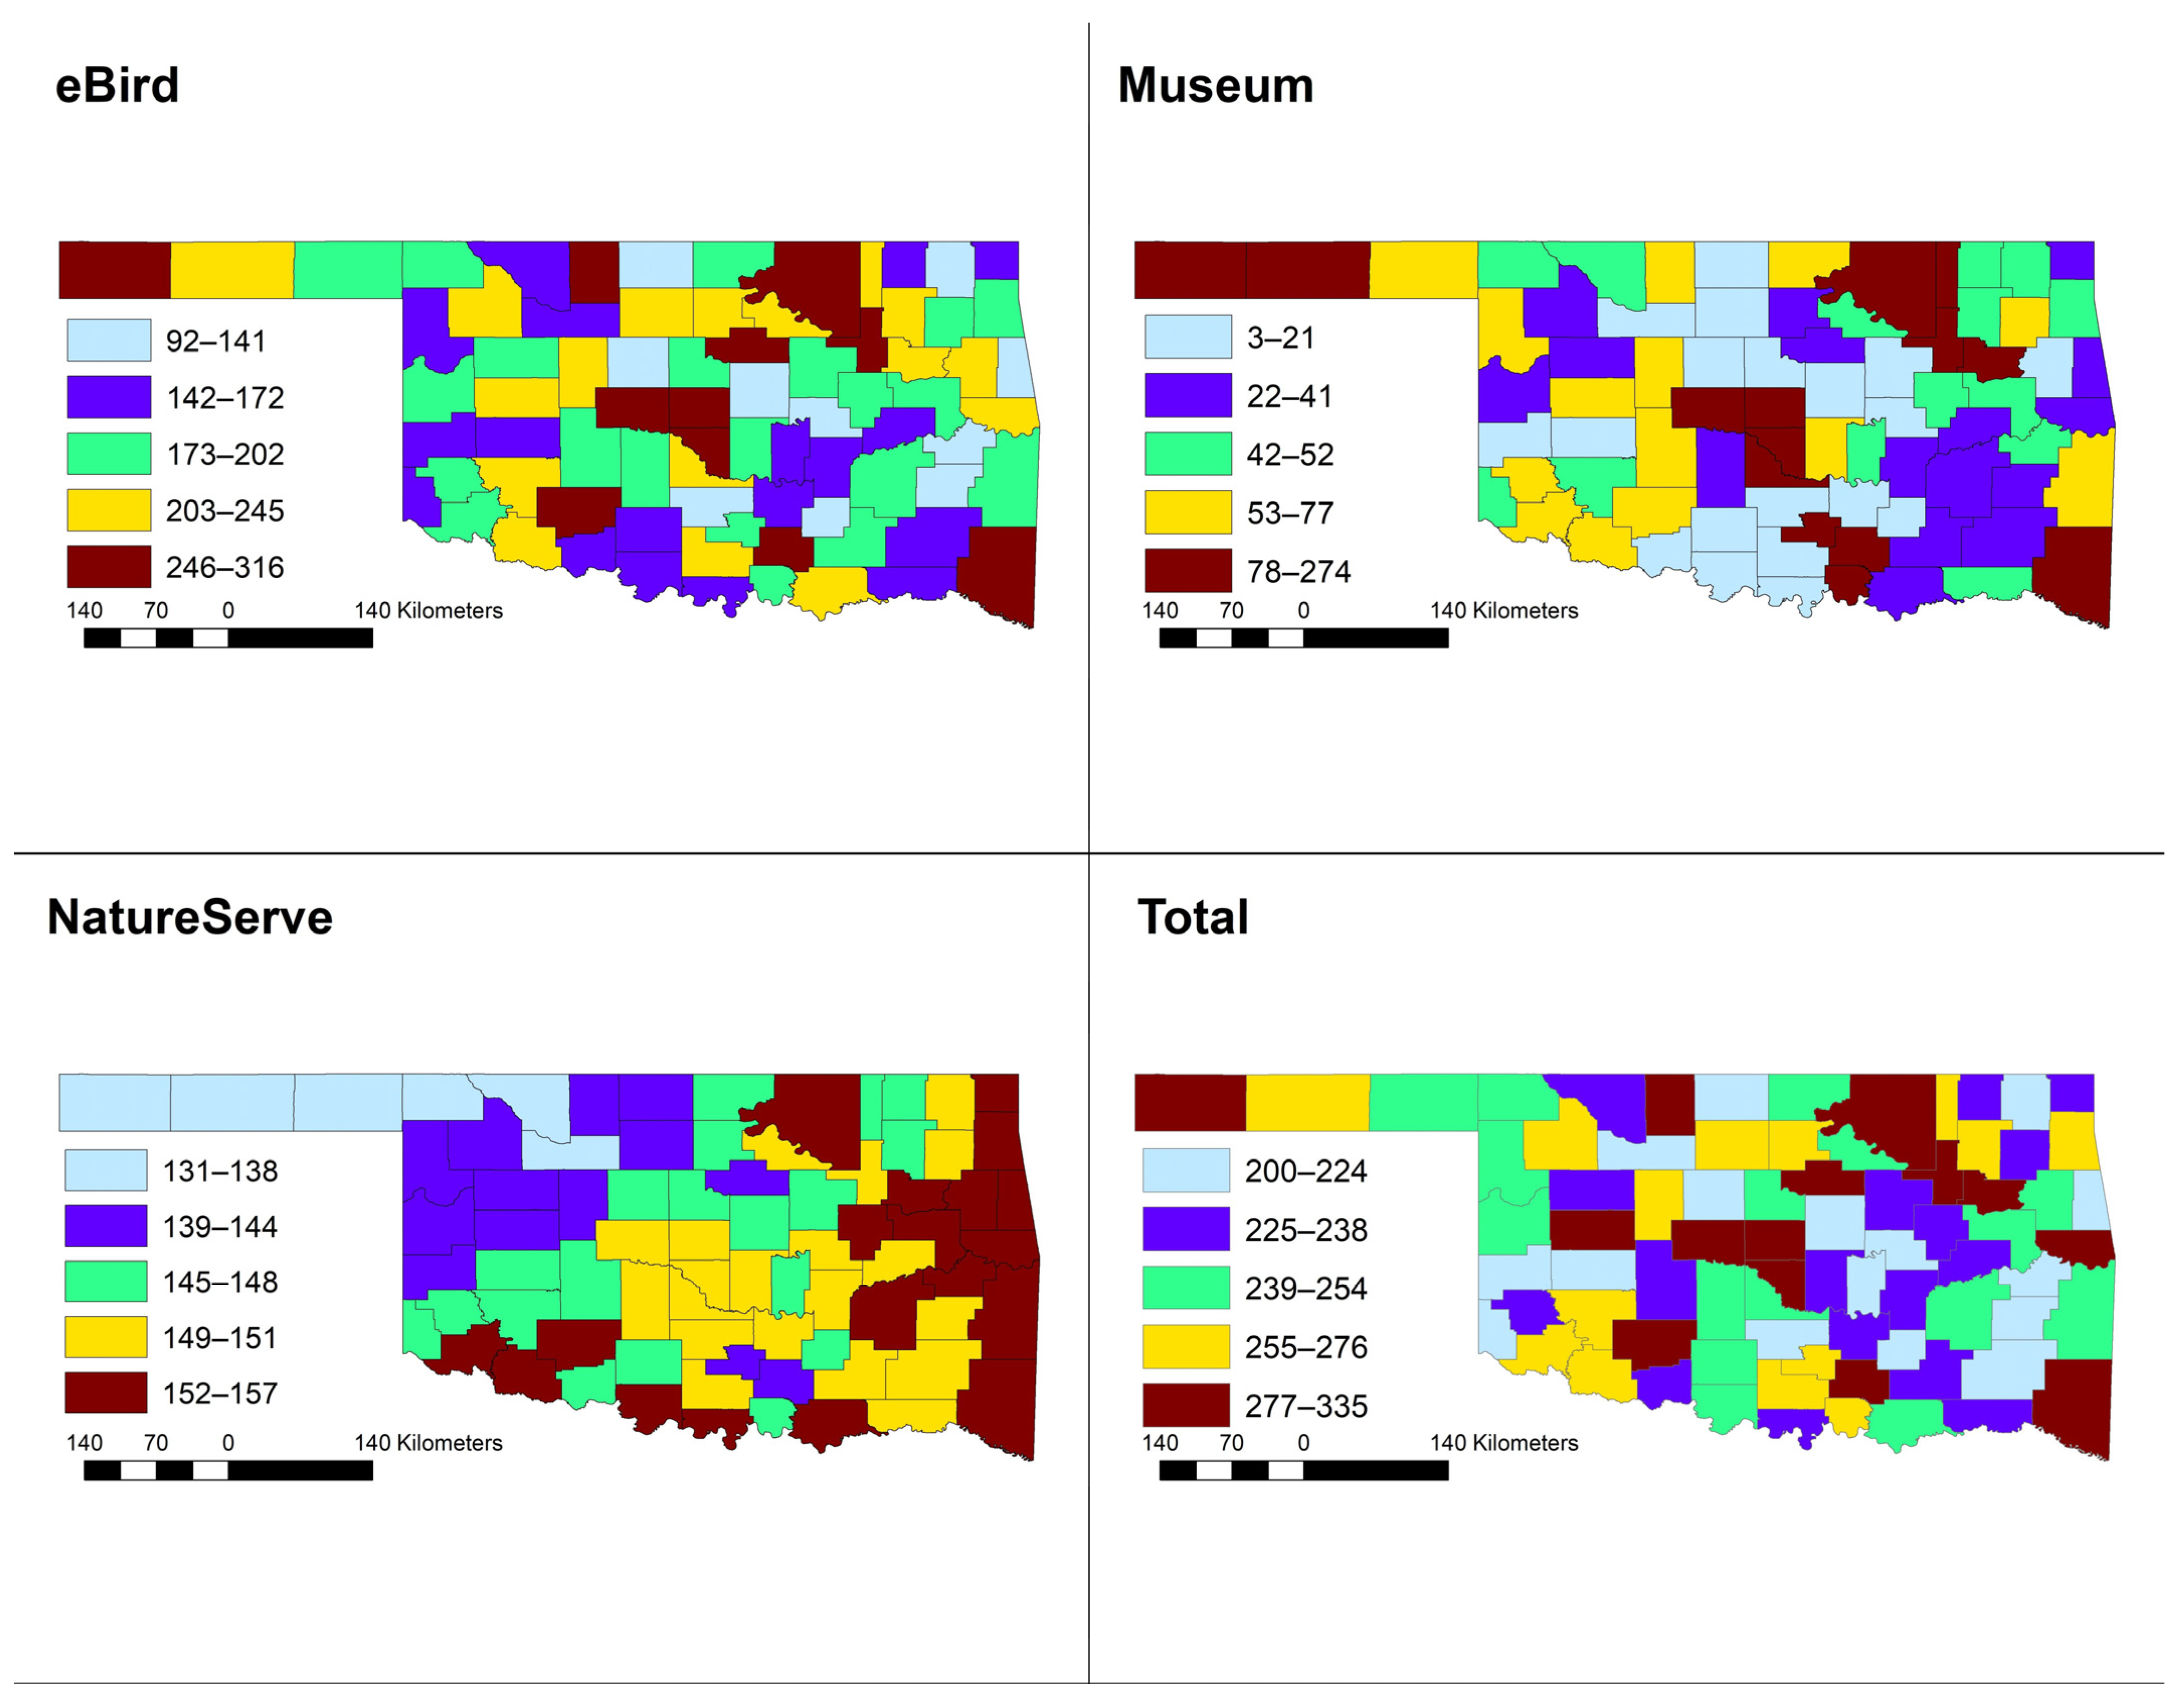
Table 2 summarizes the number of species recorded in each county. The five counties with the largest number of species recorded include Cleveland County (335 species), Oklahoma County (330 species), Cimarron County (328 species), McCurtain County (327 species), and Tulsa County (327 species). There was considerable variation by method in which counties record the greatest number of species. Figure 2 shows the spatial arrangement of the counties with the largest numbers of recorded species for the OBBA, BBS, CBC and OWBA. Figure 3 shows the spatial arrangement of the counties with the largest number of recorded species for museums, eBird, NatureServe and total. Osage County, the largest county in Oklahoma, was the only county that was in the highest quantile by each method (Figure 3).
Table 2.
Total number of species recorded by each method for the 77 counties in Oklahoma.

Figure 2.
Species richness of species identified arranged by quantiles, a statistical method to divide observations in a sample into approximately equal numbers of observations per group, for Breeding Bird Atlas (OBBA), Breeding Bird Survey (BBS), Christmas Bird Counts (CBC) and Winter Bird Atlas (OWBA).

Figure 3.
Species richness of species identified or collected grouped by quantiles for eBird, museum collections, composite maps created jointly by BirdLife International and NatureServe, and cumulative totals.
Table 3 shows the correlations in the number of species observed per county between the seven different methods examined. Out of 21 possible combinations, only six (29%) were significant. Of the three methods that focused solely on breeding birds (OBBA, BBS, and NatureServe), only BBS and NatureServe showed a significant correlation (Spearman’s r = 0.47, p = 0.001). However, OBBA did show a significant correlation with WBA (Spearman’s r = 0.48, p = 0.001). The two methods that focused on wintering birds, CBC and OWBA, did not show a significant correlation (Spearman’s r = −0.05, p = 0.799). The two methods that recorded species year-round, eBird and museums, did exhibit a significant correlation (Spearman’s r = 0.54, p < 0.001). Museums also exhibited a significant correlation with CBC (Spearman’s r = 0.44, p = 0.029), while eBird showed a significant correlation with WBA (Spearman’s r = 0.23, p = 0.047) and CBC (Spearman’s r = 0.74, p < 0.001).
Table 3.
Spearman rank correlation matrix for each method. Correlation coefficients (r) are shown and significant correlations (p < 0.05) are in bold with an asterisk (*).
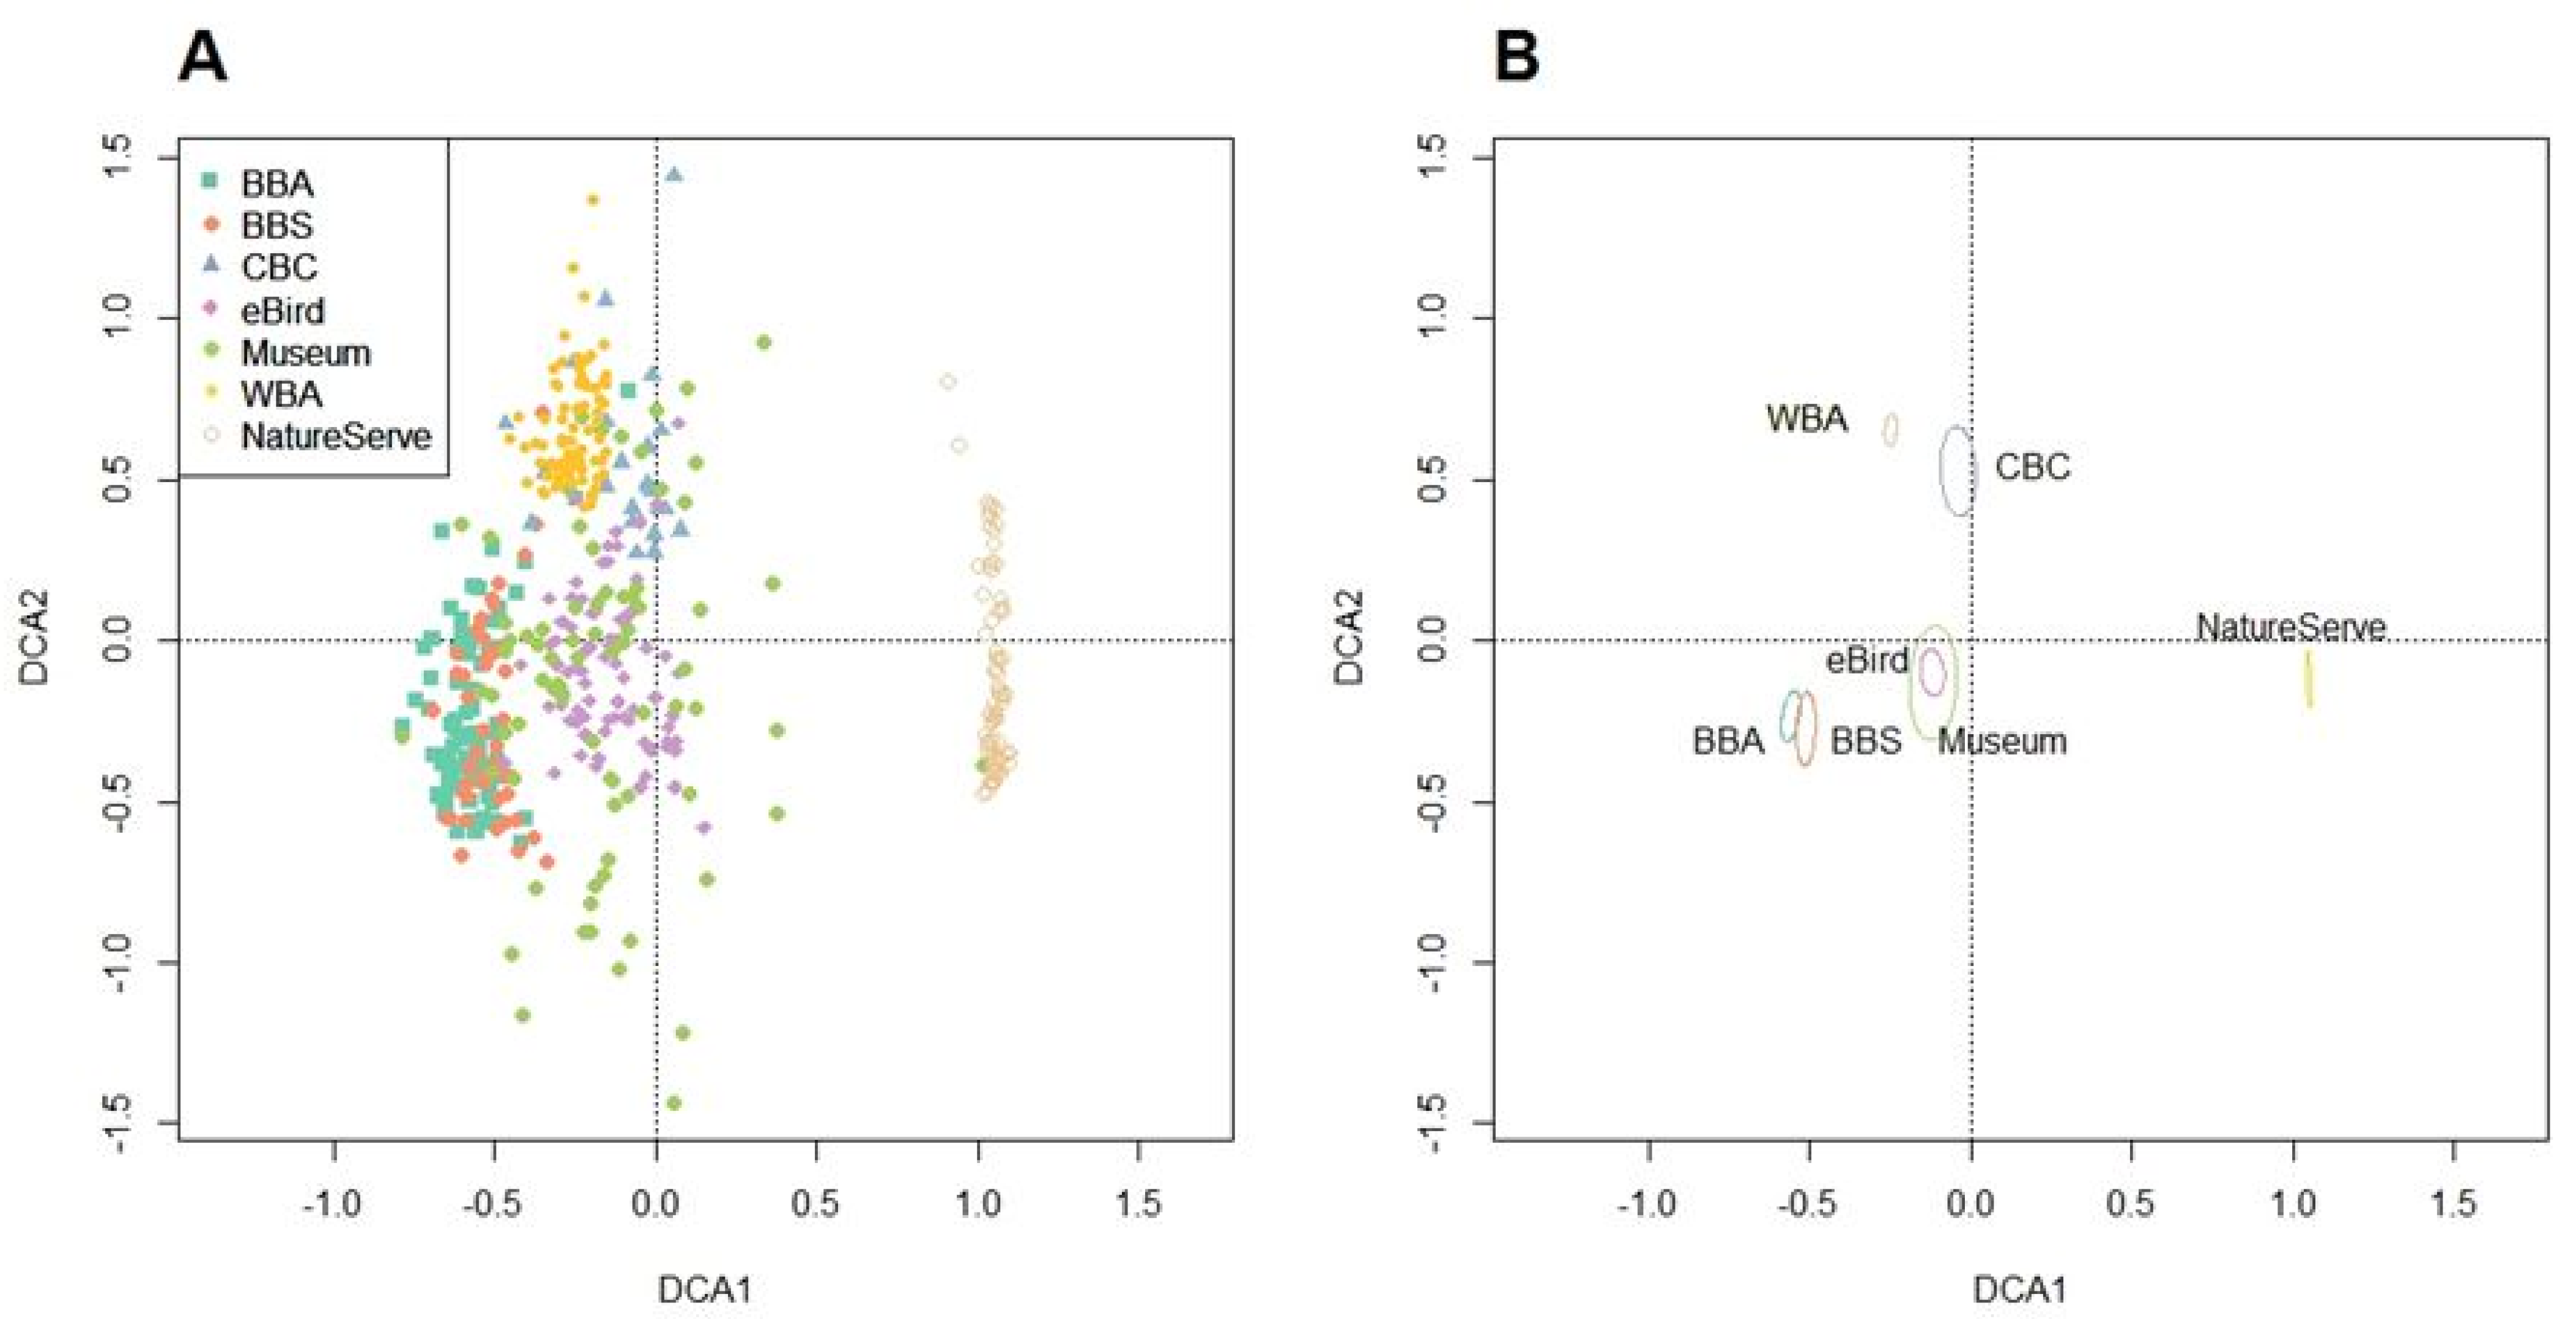
Species totals for each method were associated with county area (Mantel r = 0.193, p = 0.009) and human density (Mantel r = 0.239, p = 0.008) but not with mean annual temperature (Mantel r = 0.024, p = 0.307) or mean annual precipitation (Mantel r = 0.081, p = 0.056). The DCA revealed that avian communities present in each county according to NatureServe were significantly different from the avian communities by other methods (MRPP delta = 9.2, p = 0.001; Figure 4). Although communities sampled by OWBA and CBC were more similar to each other than to any other method (Figure 4), the sampled communities were significantly different (MRPP delta = 6.941, p = 0.001). In contrast, eBird and museums sampled similar communities, as did OBBA and BBS surveys (p > 0.05).
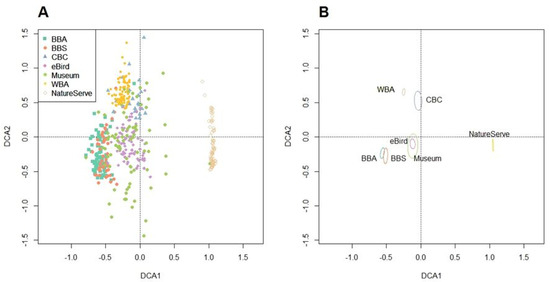
Figure 4.
The results of the Detrended Correspondence Analysis (DCA). The raw DCA scores for each method are shown in (A), while ellipses showing 95% confidence intervals for the DCA scores are shown in (B). Avian communities represented in museum and eBird databases overlap completely, showing that both approaches sample similar communities. In contrast WBA and CBC sample significantly different communities. Joint range maps created by BirdLife International and NatureServe sample significantly different communities from all other approaches.
Table 4 shows the number of species of conservation concern recorded by each method in each county. The five counties with the largest number of species recorded include Cleveland County (38 species), McCurtain County (37 species), Alfalfa County (32 species), Tulsa County (31 species), and Oklahoma County (30 species). Table 5 shows the correlations between the seven different methods examined. Only 16 of 49 possible combinations (33%) showed significant correlations. The number of species of conservation concern detected by each method was significantly correlated with the total number of species detected by each method (r ranged from 0.48 to 0.92) with the exception of museum collections (r = 0.15, p = 0.19). The total number of species of conservation concern for each method was associated with county area (Mantel r = 0.238, p = 0.001) and mean annual precipitation (Mantel r = 0.138, p = 0.005) but not with human density (Mantel r = 0.138, p = 0.058) or mean annual temperature (Mantel r = 0.051, p = 0.153).
Table 4.
Total number of species of conservation concern recorded by each method for the 77 counties in Oklahoma.
Table 5.
Spearman rank correlation matrix for the number of birds of conservation concern detected (column names) and the total detected by each method (shown by row names and denoted with the suffix ‘_c’). Correlation coefficients (r) are shown and significant correlations (p < 0.05) are in bold with an asterisk (*).
4. Discussion
Each method has potential strengths and weaknesses and some of the observed differences in species totals are due to obvious reasons. For example, OBBA, OWBA, BBS, and CBC are all limited to a single season in a temperate environment and therefore should not be expected to provide the largest percentage of the total species for a region. The results of this study show that number of species recorded by county varied depending upon the method used as well as the time of year. Unsurprisingly, the OWBA detected the lowest avian species richness as the Atlas was conducted when many species have left Oklahoma to overwinter further south, although this may be partially offset by Nearctic migrants arriving for the winter. In contrast, eBird, which samples birds year-round, recorded the greatest species richness, which is not surprising given that there is greater temporal and spatial coverage by birders using eBird.
Other differences are less obvious. For example, the OWBA used stratified random sampling including only 12% of the land area of Oklahoma, meaning that few large reservoirs were sampled. The large numbers of wintering waterfowl, grebes, loons, gulls and other aquatic species are therefore potentially underrepresented compared to CBCs, which are frequently non-randomly situated on the landscape to include water bodies. In addition, CBCs, museum collections, and BBS surveys have been conducted for decades, leading to larger species tallies, while targeted efforts such as OBBA and OWBA were conducted over a much shorter time period. An interesting exception to this is eBird, which although only created in 2002, allows users to retroactively add checklists.
Avian diversity is typically highest in regions with mild, moist, stable climates [18]. Consequently, we expected the greatest number of species to be found in southeastern Oklahoma, the region of warmest temperature and highest rainfall. However, the number of species recorded was not affected by these two variables but instead was significantly correlated with county size and human population density. This suggests that these methods record more species in large counties with relatively high population density, as these locations presumably have larger numbers of birders and ornithologists. Gillings [38] suggests that increasing time and area surveyed will increase the number of species recorded and it is likely that counties with more people will have higher sampling effort.
Only six of 21 possible combinations (29%) of methods showed significant correlations in species richness, suggesting that counties identified as having high species richness by one method were not necessarily identified as having high species richness by another method. There was considerable overlap in sampling between communities for both eBird and museum collections suggesting that both methods sample the same species from these communities. There was also some overlap between communities sampled by BBS routes and communities sampled during the OBBA. However, the communities derived from NatureServe breeding range maps were different than communities sampled by these two citizen science approaches, perhaps because the NatureServe communities included some species that were rarely recorded, or were present only on private lands that were not sampled under other methods.
The number of species of conservation concern recorded by each method were generally correlated with the species richness recorded by the same method, with the notable exception of museum collections. It is possible that museum collections may have exerted a disproportionate effort to include rare species in their collections. However, the number of species of conservation concern recorded by each method was only correlated with species richness of other methods for 33% of cases. Again, this suggests that there is not good agreement on the number of species of conservation concern by county among methods. The number of species of conservation concern was correlated with county area and mean annual precipitation, with larger counties with more precipitation hosting more rare bird species.
Devictor et al. [11] suggest that citizen science programs can play a valuable role in gathering data on species distributions and relative abundances across large spatiotemporal scales and others suggest that data gathered by citizen scientists may be particularly useful in managing residential ecosystems [39] and this study agrees with these assessments. However, our results suggest that the ability of citizen science to depict the number of species in a given region is scale-dependent. Larger areas are typically expected to host more species [40] and both species richness and the total number of species of conservation concern were correlated with county area. In this study, Osage County, which has the largest area of any county in Oklahoma, was the only county to be in the top quantile by all methods. However, the total species richness was also correlated with human population density, with counties that have larger numbers of people recording more species. This could potentially be due to differences in the total numbers of observers or the presence of larger numbers of skilled observers in areas with higher population density, and may be affected by heterogeneous species detections. Species detections are heterogeneous for several reasons. For example, the detection of a species during a survey is affected not only by whether the species is present, but also the relative abundance and whether the observer is skilled enough to detect it [1]. In addition, cryptic and rare species may not be detected, along with species that occur on non-surveyed, private lands [41].
Because species richness did not usually correlate among methods, efforts to identify counties with high biodiversity should combine as many datasets as possible. Lepczyk [41] stressed the importance of combining datasets when quantifying species richness, and also noted that individual landowners can aid in compiling comprehensive species lists for private lands. However, combined datasets may not necessarily provide a comprehensive overview of the spatial distribution of biodiversity due to potential biases of area size and human population density. The use of rarefaction curves may potentially overcome some of these issues, although the performance of rarefaction curves for datasets that have not yet begun approaching asymptotes will only provide lower bounds of estimate species richness [42].
These results also highlight some of the challenges inherent in examining patterns of species diversity at intermediate scales. At the statewide scale, there is an official list of bird species recorded in the state of Oklahoma maintained by the Oklahoma Ornithological Society [33]. There are also official checklists maintained by various agencies of public and some private lands. For example, there is a checklist by the US Department of Agriculture for Red Slough Wildlife Management Area in McCurtain County [43]. This checklist contains 321 species, which represents 98% of the species documented in this county and highlights the remarkable biodiversity of this location. However, official county-level lists of bird species do not appear to be maintained by any agency at this time.
It may be worth considering incorporating data collected by citizen science as inputs into ecological niche modeling (ENM) techniques such as Maxent [44] or occupancy models [45] to help overcome limitations of variable sampling effort and sampling intensity. Existing range maps rely upon experts creating maps based on the literature, their own experiences, citizen science data, museum collections and observed relationships with habitat [46]. If small counties far from urban areas are not adequately sampled under existing methodologies, the resulting range maps could conceivably show these counties as misleadingly depauperate. In addition, species ranges are not static, and range maps can potentially also overestimate species richness due to species range contractions.
This is important because synthesis maps that overlay multiple range maps can be particularly valuable for identifying conservation priorities. For example, Jenkins et al. [47] used global maps of species richness to identify geographical regions with large numbers of threatened birds, mammals, and amphibians as well as large numbers of species with small ranges. Synthesis maps of terrestrial vertebrates, freshwater fish, and tree species have also been used to examine patterns of endemism in the US and these maps demonstrate that, while the greatest area of protected lands was in the western US, endemism was particularly high in the southeastern US [47].
5. Conclusions
In conclusion, we suggest that citizen science projects play a valuable role in quantifying biodiversity, but that these projects possess inherent limitations and biases. In order to identify regions of high biodiversity, incorporating citizen science data is a logical first step, but further steps such as occupancy modeling or ecological niche modeling may be required to quantify species richness. For example, broad-scale citizen science studies are frequently combined with fine-scale, more targeted studies [3,4,5]. Pimm et al. [48] suggest that data collected by citizen scientists may be particularly useful in validating predictions of changes in species’ distributions. We also note that there may be a trade-off involved with obtaining good estimates of relative abundance and tracking population trends as opposed to simply identifying regions of high biodiversity. We recommend specific monitoring for single species (or species of concern) in areas of low human population density in order to increase the efficacy of richness estimates. Finally, we also recommend that further research be carried out with regard to how best to minimize the limitations and biases of incorporating citizen science data into range maps and synthesis maps.
Author Contributions
Conceptualization, C.J.B. and C.K.; Data curation, C.J.B. and D.L.R.; Formal analysis, C.J.B.; Investigation, D.L.R.; Methodology, C.K. and D.L.R.; Writing—original draft, C.J.B.; Writing—review and editing, C.K. and D.L.R. All authors have read and agreed to the published version of the manuscript.
Funding
This research was supported by a grant from the Office of Research and Grants at the University of Central Oklahoma (#2015-Butler).
Institutional Review Board Statement
Not applicable.
Data Availability Statement
Publicly available datasets were analyzed in this study. A shapefile of bird species richness for each county in Oklahoma can be found here: https://doi.org/10.7910/DVN/YW8LDJ.
Acknowledgments
We thank S. Laverty for his assistance with formatting data in R. We thank D. Wood and K. Hucks for their comments on the manuscript. We also thank the many citizen scientists who have for decades added to the collective understanding of animal distributions.
Conflicts of Interest
The authors declare no conflict of interest. The funders had no role in the design of the study; in the collection, analyses, or interpretation of data; in the writing of the manuscript, or in the decision to publish the results.
References
- Devictor, V.; Whittaker, R.; Beltrame, C. Beyond scarcity: Citizen science programmes as useful tools for conservation biogeography. Divers. Distrib. 2010, 16, 354–362. [Google Scholar] [CrossRef]
- Silvertown, J. A new dawn for citizen science. Trends Ecol. Evol. 2009, 24, 467–471. [Google Scholar] [CrossRef] [PubMed]
- Hochachka, W.; Fink, D.; Hutchinson, R.A.; Sheldon, D.; Wong, W.-K.; Kelling, S. Data-Intensive science applied to broad-scale citizen science. Trends Ecol. Evol. 2012, 27, 130–137. [Google Scholar] [CrossRef] [PubMed]
- Supp, S.R.; La Sorte, F.A.; Cormier, T.A.; Lim, M.C.; Powers, D.R.; Wethington, S.M.; Goetz, S.; Graham, C.H. Citizen-Science data provides new insight into annual and seasonal variation in migration patterns. Ecosphere 2015, 6, art15. [Google Scholar] [CrossRef]
- Bonney, R.; Cooper, C.B.; Dickinson, J.; Kelling, S.; Phillips, T.; Rosenberg, K.V.; Shirk, J. Citizen science: A developing tool for expanding science knowledge and scientific literacy. BioScience 2009, 59, 977–984. [Google Scholar] [CrossRef]
- Dickinson, J.L.; Zuckerberg, B.; Bonter, D.N. Citizen science as an ecological research tool: Challenges and benefits. Annu. Rev. Ecol. Evol. Syst. 2010, 41, 149–172. [Google Scholar] [CrossRef] [Green Version]
- Franzoni, C.; Sauermann, H. Crowd science: The organization of scientific research in open collaborative projects. Res. Policy 2014, 43, 1–20. [Google Scholar] [CrossRef] [Green Version]
- Yaukey, P.H. Citizen science and bird–distribution data: An opportunity for geographical research. Geogr. Rev. 2010, 100, 263–273. [Google Scholar] [CrossRef]
- Kelling, S.; Johnston, A.; Hochachka, W.M.; Iliff, M.; Fink, D.; Gerbracht, J.; Lagoze, C.; La Sorte, F.A.; Moore, T.; Wiggins, A.; et al. Can observation skills of citizen scientists be estimated using species accumulation curves? PLoS ONE 2015, 10, e0139600. [Google Scholar] [CrossRef] [PubMed] [Green Version]
- Sauer, J.R.; Link, W.A.; Fallon, J.E.; Pardieck, K.; Ziolkowski, D.J. The North American Breeding Bird Survey 1966–2011: Summary Analysis and Species Accounts. N. Am. Fauna 2013, 79, 1–32. [Google Scholar] [CrossRef] [Green Version]
- Hof, A.R.; Bright, P.W. Quantifying the long-term decline of the West European hedgehog in England by subsampling citizen-science datasets. Eur. J. Wildl. Res. 2016, 62, 407–413. [Google Scholar] [CrossRef]
- Lee, T.; Kahal, N.; Kinas, H.; Randall, L.; Baker, T.; Carney, V.; Kendell, K.; Sanderson, K.; Duke, D. Advancing Amphibian Conservation through Citizen Science in Urban Municipalities. Diversity 2021, 13, 211. [Google Scholar] [CrossRef]
- Soteropoulos, D.; De Bellis, C.; Witsell, T. Citizen Science Contributions to Address Biodiversity Loss and Conservation Planning in a Rapidly Developing Region. Diversity 2021, 13, 255. [Google Scholar] [CrossRef]
- Souther, S.; Randall, V.; Lyndon, N. The Use of Citizen Science to Achieve Multivariate Management Goals on Public Lands. Diversity 2021, 13, 293. [Google Scholar] [CrossRef]
- Falk, B.G.; Snow, R.W.; Reed, R.N. Prospects and Limitations of Citizen Science in Invasive Species Management: A Case Study with Burmese Pythons in Everglades National Park. Southeast. Nat. 2016, 15, 89–102. [Google Scholar] [CrossRef]
- Dunn, E.H.; Francis, C.M.; Blancher, P.J.; Drennan, S.R.; Howe, M.A.; Lepage, D.; Robbins, C.S.; Rosenberg, K.V.; Sauer, J.R.; Smith, K.G. Enhancing the scientific value of the Christmas Bird Count. Auk 2005, 122, 338–346. [Google Scholar] [CrossRef]
- Sánchez-Clavijo, L.M.; Martínez-Callejas, S.J.; Acevedo-Charry, O.; Diaz-Pulido, A.; Gómez-Valencia, B.; Ocampo-Peñuela, N.; Ocampo, D.; Olaya-Rodríguez, M.H.; Rey-Velasco, J.C.; Soto-Vargas, C.; et al. Differential reporting of biodiversity in two citizen science platforms during COVID-19 lockdown in Colombia. Biol. Conserv. 2021, 256, 109077. [Google Scholar] [CrossRef]
- Rotenberry, J.T. Components of avian diversity along a multifactorial gradient. Ecology 1978, 59, 693–699. [Google Scholar] [CrossRef]
- Tews, J.; Brose, U.; Grimm, V.; Tielbörger, K.; Wichmann, M.C.; Schwager, M.; Jeltsch, F. Animal species diversity driven by habitat heterogeneity/diversity: The importance of keystone structures. J. Biogeogr. 2004, 31, 79–92. [Google Scholar] [CrossRef] [Green Version]
- United States Geological Survey. Elevations and Distances in the United States. 2001. Available online: https://pubs.usgs.gov/gip/Elevations-Distances/elvadist.html (accessed on 29 August 2021).
- United States Census Bureau. 2010 Census: Oklahoma Profile. 2018. Available online: https://www2.census.gov/geo/pdfs/reference/guidestloc/40_Oklahoma.pdf (accessed on 29 August 2021).
- Omernik, J.M. Ecoregions of the conterminous United States. Ann. Am. Assoc. Geogr. 1987, 77, 118–125. [Google Scholar] [CrossRef]
- Woods, A.J.; Omernik, J.M.; Butler, D.R.; Ford, J.G.; Henley, J.E.; Hoagland, B.W.; Arndt, D.S.; Moran, B.C. Ecoregions of Oklahoma (Color Poster with Map, Descriptive Text, Summary Tables, and Photographs); U.S. Geological Survey: Reston, VA, USA, 2005; (map scale 1:1,250,000). [Google Scholar]
- Constable, H.; Guralnick, R.; Wieczorek, J.; Spencer, C.; Peterson, A.T. VertNet Steering Committee VertNet: A New Model for Biodiversity Data Sharing. PLoS Biol. 2010, 8, e1000309. [Google Scholar] [CrossRef]
- Gurlanick, R.; Constable, H. VertNet: Creating a data-sharing community. BioScience 2010, 60, 258–259. [Google Scholar] [CrossRef] [Green Version]
- Vertnet. 2016. VertNet© Version 2016-09-29. Available online: http://vertnet.org/ (accessed on 29 August 2021).
- Reinking, D.L. (Ed.) Oklahoma Breeding Bird Atlas; University of Oklahoma Press: Norman, OK, USA, 2004. [Google Scholar]
- Sullivan, B.L.; Wood, C.L.; Iliff, M.J.; Bonney, R.E.; Fink, D.; Kelling, S. eBird: A citizen-based bird observation network in the biological sciences. Biol. Conserv. 2009, 142, 2282–2292. [Google Scholar] [CrossRef]
- Reinking, D.L. (Ed.) Oklahoma Winter Bird Atlas; University of Oklahoma Press: Norman, OK, USA, 2017. [Google Scholar]
- National Audubon Society. Christmas Bird Count CBC Results. 2021. Available online: https://netapp.audubon.org/cbcobservation/ (accessed on 29 August 2021).
- Birdlife International and NatureServe. Digital Distribution Maps of the Birds of the Western Hemisphere. 2021. Available online: https://www.natureserve.org/products/digital-distribution-maps-birds-western-hemisphere (accessed on 29 August 2021).
- U.S. Fish and Wildlife Service. Birds of Conservation Concern 2008; United States Department of Interior, Fish and Wildlife Service, Division of Migratory Bird Management: Arlington, VA, USA, 2008. [Google Scholar]
- Oklahoma Bird Records Committee. The Oklahoma Ornithological Society Checklist of Oklahoma Birds, 4th ed.; Oklahoma Ornithological Society: Norman, OK, USA, 2011. [Google Scholar]
- Chesser, R.T.; Billerman, S.M.; Burns, K.J.; Cicero, C.; Dunn, J.L.; Hernández-Baños, B.E.; Kratter, A.W.; Lovette, I.J.; Mason, N.A.; Rasmussen, P.C.; et al. Check-List of North American Birds (Online). American Ornithological Society. 2021. Available online: http://checklist.aou.org/taxa (accessed on 26 November 2021).
- American Ornithologists’ Union. Check-List of North American Birds, 7th ed.; American Ornithologists’ Union: Washington, DC, USA, 1998. [Google Scholar]
- Bray, J.R.; Curtis, J.T. An Ordination of the Upland Forest Communities of Southern Wisconsin. Ecol. Monogr. 1957, 27, 325–349. [Google Scholar] [CrossRef]
- Haskell, D.G.; Evans, J.P.; Pelkey, N.W. Depauperate Avifauna in Plantations Compared to Forests and Exurban Areas. PLoS ONE 2006, 1, e63. [Google Scholar] [CrossRef]
- Gillings, S. Designing a winter bird atlas field methodology: Issues of time and space in sampling and interactions with habitat. J. Ornithol. 2008, 149, 345–355. [Google Scholar] [CrossRef]
- Cooper, C.B.; Dickinson, J.; Phillips, T.; Bonney, R. Citizen Science as a Tool for Conservation in Residential Ecosystems. Ecol. Soc. 2007, 12, 11. [Google Scholar] [CrossRef]
- Rosenzweig, M.L. Species Diversity in Space and Time; Cambridge University Press: Cambridge, UK, 1995. [Google Scholar]
- Lepczyk, C.A. Integrating published data and citizen science to describe bird diversity across a landscape. J. Appl. Ecol. 2005, 42, 672–677. [Google Scholar] [CrossRef]
- Gotelli, N.J.; Colwell, R.K. Quantifying biodiversity: Procedures and pitfalls in the measurement and comparison of species richness. Ecol. Lett. 2001, 4, 379–391. [Google Scholar] [CrossRef] [Green Version]
- United States Department of Agriculture—Forest Service. Bird Checklist: Red Slough Wildlife Management Area. 2019. Available online: https://www.fs.usda.gov/Internet/FSE_DOCUMENTS/stelprdb5163358.pdf (accessed on 27 November 2021).
- Phillips, S.J.; Anderson, R.P.; Schapire, R.E. Maximum entropy modeling of species geographic distributions. Ecol. Model. 2006, 190, 231–259. [Google Scholar] [CrossRef] [Green Version]
- Mackenzie, D.I.; Nichols, J.D.; Lachman, G.B.; Droege, S.; Royle, J.A.; Langtimm, C.L. Estimating site occupancy rates when detection probabilities are less than one. Ecology 2002, 83, 2248–2255. [Google Scholar] [CrossRef]
- Csuti, B.; O’Neil, T.A.; Shaughnessy, M.M.; Gaines, E.P.; Hak, J.C. Atlas of Oregon Wildlife: Distribution, Habitat, and Natural History, 2nd ed.; Oregon State University Press: Corvallis, OR, USA, 2001. [Google Scholar]
- Jenkins, C.N.; Van Houtan, K.S.; Pimm, S.L.; Sexton, J.O. US protected lands mismatch biodiversity priorities. Proc. Natl. Acad. Sci. USA 2015, 112, 5081–5086. [Google Scholar] [CrossRef] [PubMed] [Green Version]
- Pimm, S.L.; Jenkins, C.N.; Abell, R.; Brooks, T.M.; Gittleman, J.L.; Joppa, L.N.; Raven, P.H.; Roberts, C.M.; Sexton, J.O. The biodiversity of species and their rates of extinction, distribution, and protection. Science 2014, 344, 1246752. [Google Scholar] [CrossRef] [PubMed]

Publisher’s Note: MDPI stays neutral with regard to jurisdictional claims in published maps and institutional affiliations. |
© 2021 by the authors. Licensee MDPI, Basel, Switzerland. This article is an open access article distributed under the terms and conditions of the Creative Commons Attribution (CC BY) license (https://creativecommons.org/licenses/by/4.0/).