Article

Taxonomic and Functional Diversity and Composition of Bats in a Regenerating Neotropical Dry Forest

by
Sergio Ramón Martínez-Ferreira
1,
Mariana Yolotl Alvarez-Añorve
2,
Angel E. Bravo-Monzón
2,
Cristina Montiel-González
2,
Jose Israel Flores-Puerto
2,
Sharon Patricia Morales-Díaz
3,
Xavier Chiappa-Carrara
2,
Ken Oyama
4 and
Luis Daniel Avila-Cabadilla
2,*
1
Facultad de Biología, Universidad Michoacana de San Nicolás de Hidalgo, Avenida Francisco J. Mújica S/N Edificio “R”, Ciudad Universitaria, Morelia C.P. 58030, Mexico
2
Escuela Nacional de Estudios Superiores, Unidad Mérida, Universidad Nacional Autónoma de México, Carretera Mérida-Tetiz Km. 4.5, Ucú C.P. 97357, Mexico
3
Facultad de Estudios Superiores Zaragoza, Universidad Nacional Autónoma de México, Ciudad de México, México, Campus II Batalla 5 de mayo s/n esquina Fuerte de Loreto, Col. Ejército de Oriente, Iztapalapa, Ciudad de México C.P. 09230, Mexico
4
Escuela Nacional de Estudios Superiores, Unidad Morelia, Universidad Nacional Autónoma de México, Antigua Carretera a Pátzcuaro No. 8701, Col. Ex Hacienda de Sán José de la Huerta, Morelia C.P. 58190, Mexico
*
Author to whom correspondence should be addressed.
Diversity 2020, 12(9), 332; https://doi.org/10.3390/d12090332
Submission received: 21 May 2020 / Revised: 2 July 2020 / Accepted: 18 August 2020 / Published: 31 August 2020
(This article belongs to the Special Issue Land-Use Change Impacts on Tropical Vertebrates)

Abstract

:
This study evaluated the response of bat communities, from a taxonomic and functional perspective, to variation in the vegetation and landscape attributes produced by anthropogenic activities. We characterized the following: (1) the community of phyllostomid and mormoopid bats associated with the initial successional stages of a tropical dry forest, (2) the response of these communities to the variation in the attributes of the vegetation and the landscape, and (3) how the seasonality modulates such response. This allowed us to identify potential mechanisms underlying the response of bat communities to human disturbance. Our results showed that the species negatively affected by the anthropoghenic disturbance are those with greater body mass, larger nose-leaves, or a lower wing aspect ratio and relative wing loading, which perform low-speed flights and have high maneuverability and, potentially, a high directionality in their emissions. We also detected a greater sensitivity of bats to changes in the landscape attributes regarding the riparian than the dry forest, and that the effect of anthropic transformation on bats was intensified during the dry season. Then, the continued loss of the original vegetation can lead to a loss of certain groups of bat species in neotropical landscapes, reducing the resilience of the system.

1. Introduction

The study of faunal communities that occur in anthropic landscapes and, specifically, in regenerating sites, merit special attention because they can influence the process of ecological succession that underlies the recovery of ecosystems. Animals can have an effect on soil structure, litter decomposition, nutrient recycling, primary productivity, plant community composition and diversity, mycorrhizal dispersal, plant pollination, and seed dispersal [1]. Consequently, the fauna affects the course of the succession process, the resilience of ecosystems (the time it takes them to recover), and the ecosystem services they provide to us. However, to date, the study of pioneer faunal communities has generally received little scientific attention. Even the initial stage of succession has become recognized in the scientific literature as “the forgotten stage of forest succession” [2]. The study of early successional communities must be promptly addressed because the present high rates of deforestation of tropical forests and the change of land use in productive areas has caused an accelerated expansion of secondary vegetation, becoming dominant in various regions of the tropics [3]. Information on this topic is of great relevance for defining biodiversity conservation strategies in anthropic environments.
In general, the assembly of communities in regenerating areas could be determined by the joint action of four groups of processes [4]. The first group considers the role of the dispersal of individuals of different species between localities, which can determine the incorporation of new species into regenerating communities. In this case, the most conspicuous species would be those with the higher dispersal capacity, and the taxonomic composition would be a nested subset of the species present in preserved ecosystems (sources of species) [5,6,7]. The second group considers the role of selection, recognizing that the environmental conditions and the previous presence of certain species can determine the establishment of new species into regenerating communities, acting as environmental and biotic filters, respectively. While environmental filters can limit functional diversity because only species with certain functional attributes can be part of the community, the biotic filters (v.gr. species competition) may favor a high functional diversity owing to the limits imposed to less competitive species (competitive exclusion), favoring the presence of functionally divergent species in the communities [6,8,9]. The third group considers the role of ecological drift, generated by the effect of random fluctuations in the population size of species that comprise communities [10]. Finally, the fourth group considers the role of speciation, as the species composition of communities at the local scale depends on the composition of the regional “pool” of species, which, in turn, is determined by speciation processes [4].
These groups of ecological processes and, in particular, “dispersal” and “selection”, can be influenced by the high spatial heterogeneity in the conditions, resources, and distribution of biodiversity that characterizes tropical systems [11]. Indeed, the initial stages of tropical forest succession are characterized by a high spatial heterogeneity that can be determined by the following: (1) different land-use history (i.e., selective logging, fire frequency), which may define microclimatic and edaphic conditions and the initial floristic and faunal composition [12]; (2) random colonization processes of pioneer species, which may result in the presence of different sets of species in sites with similar environmental conditions [13]; (3) distance to the resources, which can complement, supplement, or compensate the ecological requirements of the species (i.e., water, nutrients) [14,15]; and (4) the geographical context, for example, the landscape composition and configuration surrounding the regenerating sites [7]. The geographical context can define both the source of species and the process of colonization itself, as it is associated to the presence of corridors that facilitate the movement of species through the anthropic matrix [7].
Particular consideration should be given to the study of bat communities in tropical systems, as they are a key group for ecosystem functioning as well as an adequate model for addressing fauna response to variation in habitat attributes. Among the main ecological processes they participate in are the following: (1) pollination (>570 neotropical species); (2) seed dispersal (>550 neotropical species), promoting natural regeneration; (3) control through predation of vertebrate and invertebrate populations, including pest species, indirectly controlling the composition and structure of plant communities through its effect on herbivory; and (4) recycling of nutrients and energy, being able to mobilize large volumes of nutrients [1,16,17,18]. In addition, bats are hosts of a wide diversity of parasites (i.e., fleas, bed bugs, mites, flies) and pathogens (i.e., virus, bacteria, fungus), and the variation in their diversity can have profound implications for the transmission of diseases in ecosystems, which can spill over to humans [19]. Finally, bats are considered good indicators of environmental changes because (1) they are relatively easy to capture and monitor, (2) they are abundant and rich in terms of both taxonomic and functional diversity, (3) they interact with and consume a large spectrum of organisms, (4) they show a low reproductive rate and consequently their populations decline rapidly in response to environmental changes, and (5) they participate in key ecological processes (mentioned above) [20].
Most studies that have evaluated the effect of anthropic disturbances on bats have focused on the taxonomic dimension of biodiversity and on their response to habitat variations at small spatial scales (i.e., at stand level), without considering how seasonality can modulate their response [5,21]. However, there is a growing number of studies considering the functional and phylogenetic dimensions of bat diversity, as well as addressing their response to variation in landscape attributes and considering the effect of seasonality [6,21,22,23,24,25]. To date, it has been found that anthropic disturbance can cause bat population reductions or loss of species with specialized trophic and roosting requirements, as well as low behavioral plasticity and small home ranges [26]. In addition, these findings suggest that the action of environmental filters plays a more decisive role in structuring bat communities in disturbed environments than the action of species competition and neutral processes, as most affected species by disturbance are those with (1) a high weight, (2) a low wing aspect ratio, (3) a low wing loading, and (4) a constant frequency echolocation calls [26,27,28]. Finally, it has also been found that the marked seasonal bat response to variation in habitat attributes can be largely determined by the seasonal changes in the abundance and distribution of trophic resources, the species mobility, and foraging strategies. This may determine that, in certain seasons, they are more susceptible to changes at stand level than at landscape level, or they respond more to changes in landscape composition than to changes in landscape configuration [23,29].
In this context, this study aimed to identify, in early successional sites, potential patterns on the response of bat communities to the variation in vegetation and landscape attributes in a tropical dry forest. Specifically, we evaluated the bat community’s response in terms of the overall bat abundance and in terms of their taxonomic and functional composition and diversity, while considering how seasonality modulates such response (by contrasting rainy versus dry seasons bat responses). In general, we expect that a greater vegetation complexity at the stand level, as well as a greater coverage and connectivity of the vegetation at the landscape level, would favor the overall bat abundance and diversity in both taxonomic and functional terms. We also expect a differential impact of habitat attributes among different bat species, being those whose foraging and flying strategies are more adapted to preserved vegetation/landscapes (i.e., bigger size, short, and rounded wings), the most affected by the changes in habitat attributes caused by anthropogenic disturbance. Finally, we expect that the vegetation and landscape attributes modulating bat response will strongly differ between seasons, as a result of changes in the environmental conditions, in the availability and distribution of resources, as well as in the physiological conditions of bats associated with seasonality. Specifically, we expect a higher bat response to changes in forest cover and connectivity during the dry season, when most of the regional vegetation loses its foliage and the availability of resources is significantly reduced.

2. Materials and Methods

2.1. Study Site

We carried out this work in a region dominated by tropical dry forest (TDF), where 13,200 ha of forest (92.1% corresponding to dry forest and 2% to riparian forest) are protected by the Chamela-Cuixmala Biosphere Reserve (CCBR), located on the west coast of Mexico (19°22′–19°35′ N, 104°56′–105°03′ O) [30]. This region has a highly seasonal rainfall pattern, where the dry season lasts from November to May. The average annual rainfall is around 763 ± 258 (S.D.) mm and the average annual temperature recorded is 24.6 °C (Chamela Biological Station: www.ibiologia.unam.mx). The landscape in the immediate vicinity of the CCBR is composed of patches in different successional stages owing to cattle raising and agriculture [5].
The present study used 13 permanent study sites previously established in the region. Of these, 11 sites represent the initial successional stages (they have suffered a considerable disturbance in the last 3–9 years) and two sites, located inside the CCBR, represented old growth forests (Figure 1, see Appendix A.1). The location and abandonment age of the sites was determined with the help of vegetation maps [31], satellite images obtained in Google Earth (http://earth.google.com), and interviews with the owners of the land [32]. The sites selected for the study had the following characteristics: (1) they were accessible through roads; (2) they had an area of at least 200 × 200 m, useful to reduce the edge effect and to properly distribute the mist nets; (3) they had a slope of less than 20°, which is characteristic of the region and allowed the correct installation of the mist nets; and (4) they had a minimum distance of 6000 m from the rest of the sites, with the purpose of minimizing the effect of spatial autocorrelation in the statistical analyses and also to avoid the type I error in the hypothesis tests. The study sites were located along gradients of landscapes, ranging from landscapes where the original coverage of the dry forest and riparian vegetation has been little altered, to landscapes where productive activities left virtually no remnants of the original vegetation.

2.2. Sampling and Taxonomic and Functional Characterization of Bat Communities

The present study focuses on bats of the Noctilionoidea superfamily and, specifically, on those belonging to the Phyllostomidae family and their sister taxon Moormopidae, whose distribution is restricted to the Neotropic [33]. Together, these bat families comprise most of the species and trophic guilds reported for the study region, including aerial insectivores, gleaning insectivores, frugivores, nectarivores, sanguinivores, and omnivores [34].
To effectively sample this group of bats, in each study site, we used a standardized sampling unit composed of six mist nets (12 × 2.6 m and 30 mm mesh size) covering a total sampling area of 187 m2. The nets were arranged at ground level within each plot, across potential flight corridors (i.e., temporary streams, paths delimited by vegetation) and separated from each other by at least 50 m. All nets were activated one hour before sunset and remained open for six consecutive hours, in order to cover the main peak of bat activity [35]. Sampling was avoided during full moon and rainy and windy nights, in order to avoid variations in capture success associated with environmental conditions [36]. Each study site was sampled approximately every 96 ± 4 (S.D.) nights, from July 2013 to February 2015, with a total of eight sampling sessions per site (four samplings during dry season and four samplings during rainy season). We sampled every site only once during each sampling period to avoid capture variations derived from bat trap-shy behavior [37].
During sampling sessions, the nets were checked every 15–30 min and the captured individuals were deposited in cloth bags and processed in situ afterwards. For each captured bat, we determined the species (with the field guide by Medellín et al. [38]), the sex, the relative age (following the method of Brunet-Rossinni and Wilkinson [39]), and the reproductive condition (following the method of Racey [40]). Additionally, we measured morphological features from captured individuals that allowed us to estimate nine functional traits corresponding to three trait complexes (size, wing, and leaf-nose) (Table 1). The considered wing and nose-leaf traits characterize flight and echolocation functions, which can be considered part of the same adaptative complex, and are linked to foraging strategies, type of feeding, and habitat preference of the species [27,41,42]. Specifically, the considered nose-leaf traits effectively describe most of the variation in nose-leaf morphology and are associated with the frequency of emission and sound directionality [41]. All parameters were estimated only for adult males and adult non-reproductive females.
Furthermore, we characterized bat communities using the following parameters: (1) total bats captured, as a measure of abundance; (2) the estimated species richness (Chao1); (3) the exponential of the Shannon index (eH′, true diversity index of order 1), as a measure of heterogeneity; (4) the community-weighted mean (CWM) for each of the functional attributes (weight (W), arm-wing length (Law), wing loading (WL), aspect-ratio (AR), wing tip index (I), length of the spear (LOS), breadth of the spear (BOS), length of the horseshoe (LOH), breadth of the horseshoe (BOH)) as a measure of the functional composition; (5) the functional richness index (FRic) as a measure of the functional space occupied by the species of a community, which is independent of their abundance; (6) the functional dispersion index (FDis) as a measure of the dispersion of the species in the functional space, weighted by their relative abundance; (7) the functional evenness index (FEve) as a measure of the degree of homogenization of species abundance in the functional space; and (8) the functional divergence index (FDiv) as a measure of the degree of functional similarity among the dominant species of a community [43,44,45,46]. The functional diversity indices (5–8) characterize the dispersion (5 and 6) and distribution (7 and 8) of the species in a multivariated functional space, defined by the set of functional attributes analyzed. These indices also represent different components of functional diversity and do not depend on the taxonomic diversity [47]. The composition and functional diversity indices were calculated using the FD package in R [48]. Specifically, for the calculation of functional diversity indices, we used the dbFD function based on the flexible methodology proposed by Laliberté and Legendre [46]. The calculations of the Chao1 and eH′ indices were performed with the EstimateS v.9 software [49].
Bat capture and handling were in accordance with the Mexican law, having the authorization of the “Dirección General de Vida Silvestre” (SGPA/DGVS Permit 03288/13 to LDAC), of the “Secretaría de Medio Ambiente y Recursos Naturales”. The sampling protocol was also approved by the “Commité de Ética en Investigación” of the “Escuela Nacional de Estudios Superiores, Unidad Morelia, UNAM” at the “Universidad Nacional Autónoma de México” (UNAM). No animal was anesthetized or sacrificed as part of this study.

2.3. Sampling and Characterization of the Structure and Composition of the Vegetation

For the characterization of the vegetation, we established in each study site five 2 × 100 m (1000 m2) transects, separated from each other by 25 m in order to maximize the representability of the sampling. In each transect, we selected the woody plants with a diameter at breast height (DBH, measured at 1.30 m above ground) higher than or equal to 2.5 cm, and measured the following vegetation attributes: number of species, number of individuals, number of branches, total basal area, and average height of the tallest trees (considering the 10 tallest trees in each transect). Additionally, we estimated the plant area index (PAI) using a LAI-2000 Plant Canopy Analyzer (LI-COR, Lincoln, NE, USA), and the understory density by adapting the method proposed by Marsden et al. [50], which is based on the estimation of the coverage percentage of the vegetation in images generated against a white background (3 × 3 m). A detailed description of the estimation of these two parameters in the study sites can be found in Fraga-Ramírez et al. [32]. The PAI, which is the projected area of plants per unit of ground area in the horizontal plane, is a good indicator of the structure of the vegetation and specifically of the canopy structure; its value increases in sites with a high number of strata [51].
Finally, we evaluated the study sites’ variation in structural complexity and taxonomic composition of the vegetation through non-metric multidimensional scaling (NMDS) ordinations, based on dissimilarities matrices calculated with the Euclidean distance and the Bray–Curtis coefficient, respectively [52]. The matrix for the analysis of the taxonomic composition (sites × species matrix with abundance data) was square-root transformed to avoid a bias towards the species with the greatest variation in their abundances. The scores of sites in the resulting ordinations were used as synthetic variables summarizing the variation on vegetation attributes and were then used as explanatory variables to evaluate the response of bats to such changes in vegetation (Table S1).

2.4. Landscape Characterization

The characterization of the landscape around each study site was achieved following two steps. First, we classified the ground cover in SPOT-5 images (Earth Observation Satellite) with the following characteristics: free of clouds, with a nominal spatial resolution of 10 m, with atmospheric correction, projected on the WGS84/UTM coordinate system, and made up of the first four bands of the SPOT-5 sensor plus two additional bands resulting from the calculation of the normalized difference vegetation index (NDVI) and single ratio (SR) spectra, both increasing the discriminant power of the main types of vegetation [31]. The images were acquired during the dry season, as it helps in discriminating between the main types of vegetation in the region (dry forest and riparian forest). For the land cover classification, we combined two classification algorithms, image segmentation and unsupervised classification. This allowed us to define three types of land cover: dry forest (DF), including structurally complex secondary forests; riparian forests (RF); and other types of cover (grasslands, crop fields, bare soil, and water) [7,32]. Second, we calculated two indices that characterize the composition (PLAND, percentage of landscape) and configuration (meff, effective mesh size) of the landscape, considering six different spatial scales [53]. For the calculation of these indices, we considered the patches of the original vegetation (DF and RF) in the region, to which the species have a close evolutionary relationship. The indices were calculated as PLAND = (A1 + A2 + … Ai + An)/Atotal, and meff = 1/Atotal (A12 + A22 + … Ai2 + An2), where n = number of patches, Atotal = total landscape area, and Ai = patch I size (i = 1, …, n). We used PLAND to quantify the amount of habitat available, while meff was used to quantify the existing fragmentation grade. In particular, meff can be seen from an ecological perspective as the ability of two animals, randomly located in the region, to find each other when moving through a certain type of cover—in this case, through patches of dry or riparian forest [53]. Spatial scales were defined using ring-based buffers and disc-based buffers—the latter for the smallest scale—centered in each study plot. Specifically, the analyzed spatial scales were of 500, 1000, 1500, 2000, 2500, and 3000 m radius. This combination of spatial scales allowed us to encompass the expected home range of the studied species, to evaluate the bats’ response to the variation of landscape attributes at different spatial scales, and to avoid overlap between neighboring buffers, which minimizes the probability of incurring in type I errors owing to the effect of pseudoreplication [31]. The classification of the images, as well as the calculation of the landscape indices, were carried out using the QGIS software, v.2.6.1, with the Orfeo, SAGA, and GRASS modules, as well as the complement LecoS [54].

2.5. Data Analysis

2.5.1. Sample Representability

We evaluated the sampling completeness by calculating the percentage of sampled species in relation to the number of expected species in each community, estimated with the Chao1 index (explained above), which is based on abundance data and, for our data set, showed a low sensitivity to variation in sampling effort [55].

2.5.2. Comparison among Bat Communities

First, we visualized the main variations among bat communities, in both taxonomic and functional terms, using NMDSs based on dissimilarities matrices calculated with the Bray–Curtis coefficients and Gower distance, respectively. The matrix for taxonomic analysis was also square-root transformed (as explained above). For the functional analysis, a matrix of sites × functional attributes (Trophic Guild, W, Law, WL, AR, I, LOS, BOS, LOH, BOH) was created, using “dummy” variables for qualitative attributes, and the community-weighted mean (CWM) for quantitative attributes. The CWM was calculated using the following formula: CWM = (W1 × X1) (W2 × X2) … (Wi × Xi) (Wn × Xn), where n = number of species, W = relative abundance of the ith species, and X = the average of the attribute value in the ith species. Prior to calculation, we normalized the values of the quantitative attributes by estimating their Z-value. We used the stress value as a measure of the goodness of fit of the ordinations, with a lower stress value indicating that the ordinations are more efficient in reflecting the distance between communities in the original distance matrix [52].
Second, we built the rank-abundance graphs to evaluate the variation between communities in relation to attributes such as species composition, species richness, evenness and identity of dominant, and moderately abundant and rare species [14]. To facilitate comparison among communities with different total abundance, as well as the representation of species that differ in orders of magnitude in terms of their abundance, we use the log10 pi as a measure of species abundance (where pi is the abundance of each species in relation to all captured individuals). Third, we compared communities in terms of species richness using the Chao1 index and their corresponding confidence intervals. The 84% confidence intervals were calculated from the standard deviation values estimated using EstimateS v.9 [49], following the recommendations of MacGregor-Fors and Payton [56].
In order to take into account the effect of seasonal variations in bat communities, all comparisons between communities were made separately for the dry and the rainy season captures.

2.5.3. Response of Bats to Variation in Vegetation and Landscape Attributes

We used generalized linear models (GLMs) to test the hypothesis that variations in bat community attributes (e.g., species richness, taxonomic composition and diversity, functional composition and diversity, overall bat abundance) were associated with variations in the vegetation composition and structural complexity and in the landscape composition and configuration. We considered three sets of predictors as independent variables: (1) set of synthetic variables (“scores” resulting from the ordinations) reflecting the variation in the vegetation taxonomic composition (Composition1, Composition2, and Composition3) and structural complexity (Structure1,…,3); (2) PLAND and meff regarding dry forest, estimated at different spatial scales as a measure of landscape composition (Composition1,…,3) and connectivity (Connecctivity1,…,3); and (3) PLAND and meff regarding riparian forest, also estimated at different spatial scales. The response variables were modeled using two error distributions and link functions: Gaussian distribution with the identity link function to model diversity indices, and Poisson distribution with the log function to model the abundance data and the estimated species richness. When needed, we transformed response variables for normality. We used a multi-model inference approach to identify the independent variables most strongly associated with response variables after testing whether variations in response variables were spatially structured (see Appendix A.3) [57]. The selection of the most plausible models (those that include the best predictors) was identified after estimating the following parameters: (1) the Akaike’s information criterion, corrected for small sample size (AICc); (2) the AICc delta (ΔAICc), which is the difference between the AICc of a certain model and the AICc of the best model (the one with the lowest value of AICc); and (3) the AICc weight (Wi), which represents the weight of evidence that a specific model is the best, considering the data set and the set of candidate models. The most plausible models were those that presented a ΔAICc < 2, and that are included in the set of models whose sequential sum of Wi reaches 0.95 [57]. We also confirmed that all selected predictors have a significant relationship with response variables (associated p-value ≤ 0.05). Finally, we estimated model-averaged parameters for such predictors associated with the variation in bat assemblages, such as the estimate (ß), and their corresponding unconditional variance (UV) and importance value (IV). Specifically, the IV was quantified for a determined predictor by summing the Wi values among all models that include such a predictor.
All statistical analyses were carried out separately for the dry and rainy seasons. The seasonal consistency in the relationship between the response variables and the predictors was quantified as the percentage of predictors with the same direction of effect in the two seasons, divided by the total number of predictors included in the set of most plausible models corresponding to the dry and rainy season together [58]. All analyses were carried out in R [48] using the “glmulti” package [59].

3. Results

During the 104 sampling nights (116,812.8 m h−1 of sampling effort), we captured 987 individuals representing 15 species, 11 genera, 2 families, and 6 trophic guilds, including frugivores, nectarivores, sanguinivores, omnivores, and insectivores (Table S1). The family Phyllostomidae was represented by the highest number of species (12 species, 80% of the total species) and individuals (771 individuals, 78% of the total captures). The frugivorous Artibeus jamaicensis was the most abundant species (236 individuals, 24% of total captures). For the Mormoopidae family, the most abundant species was the insectivore Pteronotus parnellii (213 individuals, 22% of total captures). We captured 70% of the phyllostomids and 75% of the moormopids reported for the study region [34]. The degree of sampling completeness during the rainy seasons (average 92%) and the dry seasons (average 82%) did not differ significantly (“Wilcoxon rank-sum test,” W = 109, p = 0.21).

3.1. Characterization of Early Successional Bat Communities

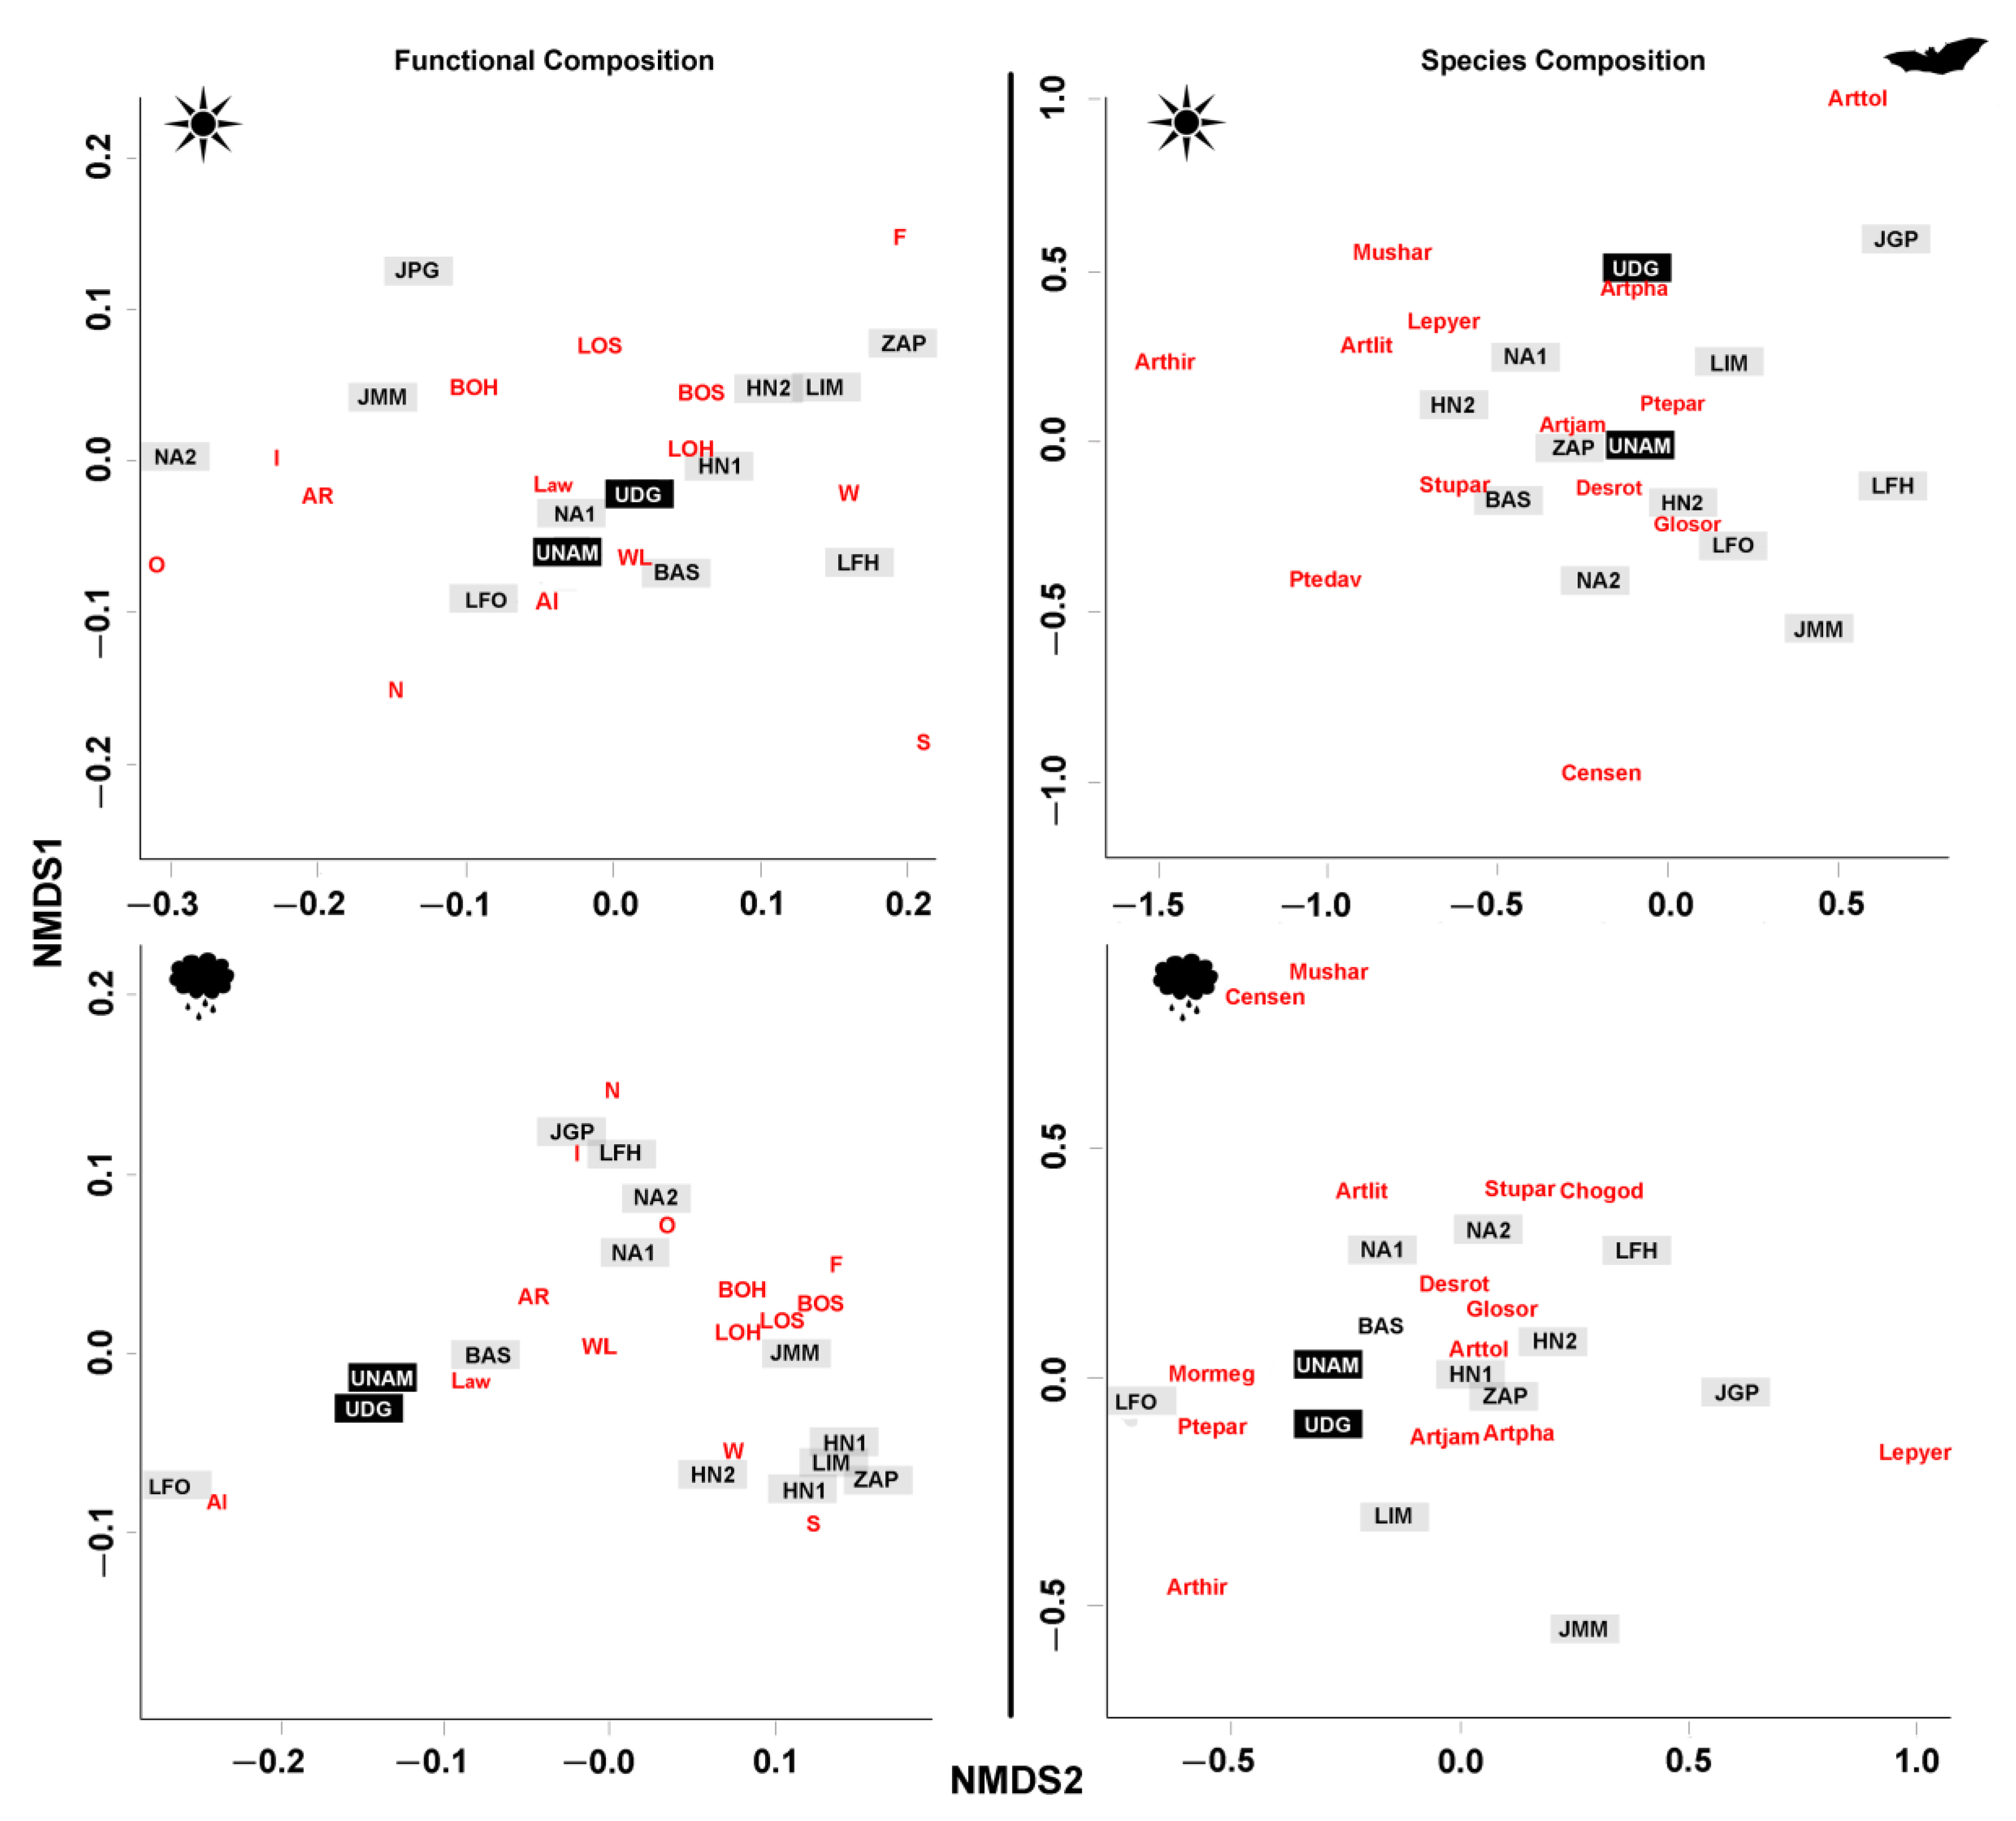
To map the variation in the taxonomic and functional composition, we used four and two axes, respectively, because including more axes did not substantially reduce the stress value of the resulting ordinations. On a scale of 0 to 100, we obtained stress values of 5.38 and 5.67 for the ordinations corresponding to the taxonomic composition, and of 1.17 and 1.79 for the ordinations corresponding to the functional composition during the rainy and dry seasons, respectively.
In general, we found a great variation in the taxonomic and functional composition among the bat communities of the initial stages of succession. These communities tended to differ from the communities of old growth forests during the rainy season (Figure 2). The differentiation in species composition was mainly influenced by the insectivorous species and by the bats’ size as well as shape of the wing and nasal leaf. For example, the old growth forest communities showed a tendency towards a higher abundance of insectivores and species of higher size (i.e., A. lituratus) (Figure 2 and Figure S1). During the rainy season, we also observed a higher tendency towards homogenization in the taxonomic and functional composition of the nearby bat communities, as communities located in the same areas (e.g., HN1 and HN2; NA1 and NA2) tended to be more similar to each other.
Both the old growth forests and the initial stages of the succession had a large proportion of the bat species registered in this study. The vast majority of the communities were dominated by a few species: by the frugivorous A. jamaicensis (5 communities) and the omnivorous Glossophaga soricina (4 communities) during the dry season; and by the insectivorous Pteronotus parnelli (four communities), A. jamaicensis (four communities), and Glossophaga soricina (three communities) during the rainy season (Figure S1). The hematophagous Desmodus rotundus and the nectarivorous Leptonycteris yerbabuenae only dominated some communities at the initial stages of succession in both seasons.
While the communities of the initial successional stages had a higher degree of dominance during the dry season, the communities in the conserved forest showed a higher degree of dominance during the rainy season, largely determined by the great abundance of P. parnelli. Finally, although we did not detect clear differences in species richness between the communities of both habitats (Figure S2), we detected a tendency towards a higher overall abundance of bats in the conserved forests, especially during the rainy season (Figure S3).

3.2. Early Successional Bat Community Response to Vegetation and Landscape Attributes

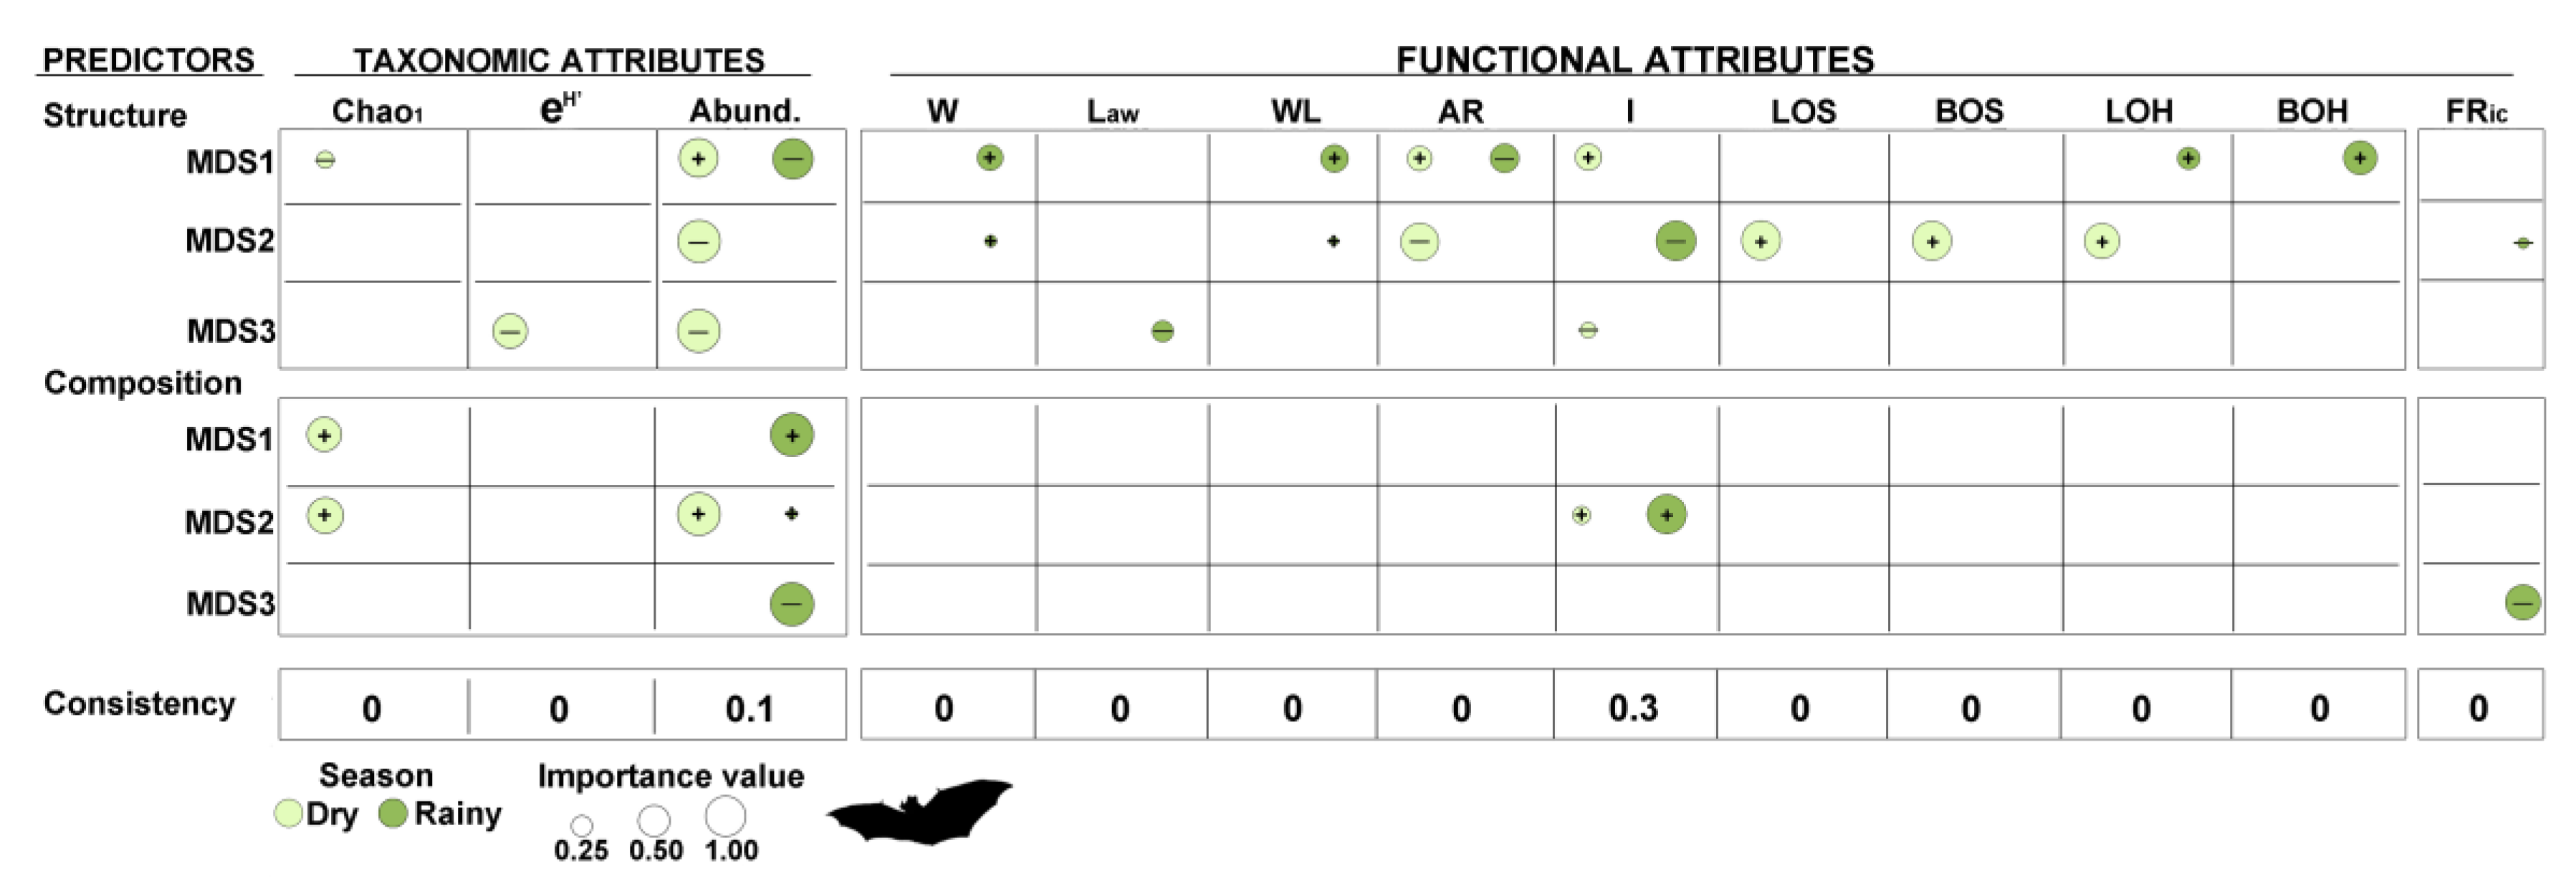
Regarding bat response to vegetation attributes, we found that, while the variation in species richness was mainly associated with changes in the vegetation composition, changes in taxonomic diversity (Shannon) were marginally associated with changes in the vegetation structure. A high diversity of bats would then be associated, during the dry season, with vegetation stands characterized by a high number of branches, potentially representing a habitat with greater structural complexity, trophic resources, and refuges during a critical period of time (Figure 3, Tables S3 and S4). In relation to the bats’ total abundance, we found that, during the dry season, the greatest abundance was observed in plots where the vegetation is structurally more complex (high number of species, individuals, basal area, height and low density in the understory), while in the rainy season, when dense vegetation can hamper flight, we detected a trend in the opposite direction (Figure 3). During the rainy season, the variation in bats abundance was more associated with the variation in the vegetation composition.
In relation to bat community response in functional terms, we found that the variation in functional diversity, and specifically in FRic (e.g., spanning volume), showed a higher relationship with changes in vegetation composition than with changes in vegetation structure (Figure 3). In contrast, the variation in bat functional composition responded more to the structure than to the composition of the vegetation. FEve and FDiv indices were not associated with the variation in any of the analyzed predictors. In general, we observed that, during the rainy season, individuals with high weight, WL, LOH, and BOH (more developed horseshoes), as well as with low values of AR, were associated with sites with high structural complexity of the vegetation (i.e., high species richness, basal area, height, number of branches). Meanwhile, individuals with low I values were associated with sites with a high canopy density (PAI). During the dry season, it was mostly individuals with low AR, high I values, long horseshoes, as well as long and wide lancets—attributes that improve the navigation capacity—that were associated with sites with high vegetation structural complexity (see also Table S1b).
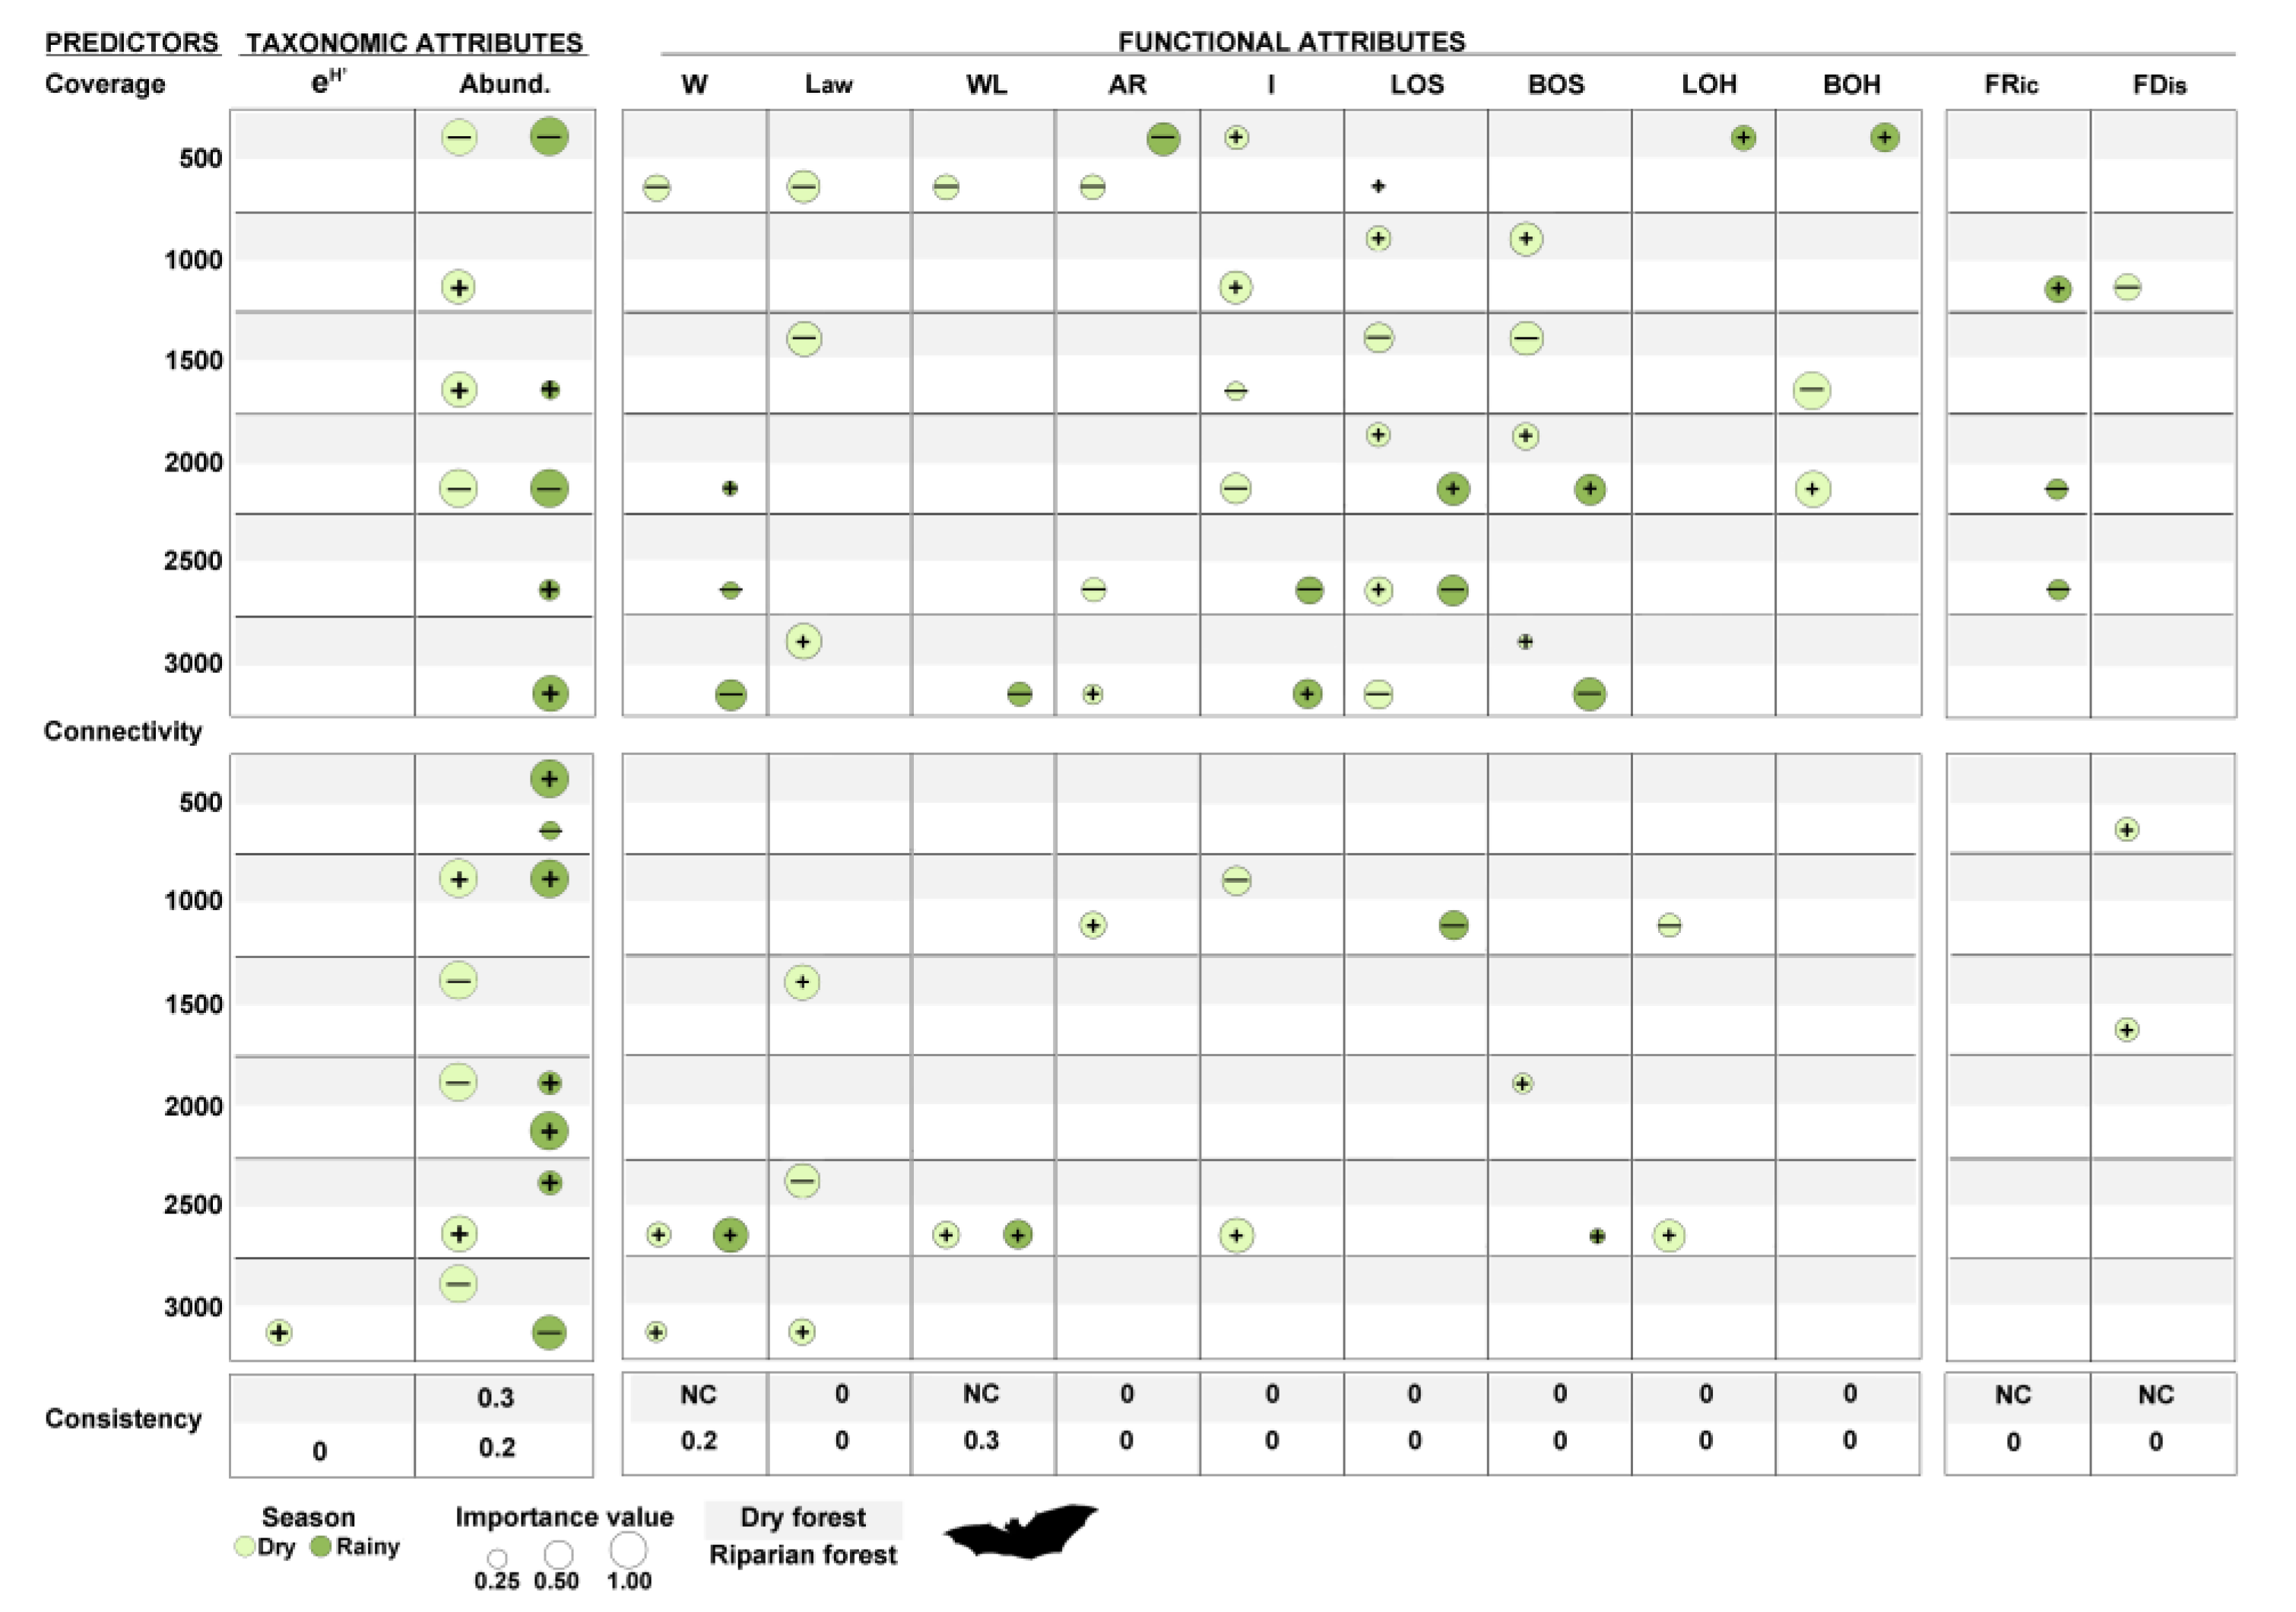
Regarding the response of bats to landscape attributes, while their taxonomic diversity showed virtually no relation to landscape coverage or connectivity, their abundance showed significant associations with both attributes (Figure 4). During the rainy season, the abundance of bats was positively associated with the connectivity regarding the remnants of riparian forest (mainly at a radius of 2000 m) and dry forest (at different spatial scales). Abundance was also related to riparian forest cover. In contrast, during the dry season, the abundance of bats was mostly associated with the dry forest connectivity and with riparian forest cover.
Additionally, we found that the degree of dispersion of the species in the functional space (FRic) responded to the landscape attributes of the riparian forest during the dry season; it was low in sites surrounded by a higher coverage of this forest and increased in sites where it shows high connectivity, which could enable bats’ movement while searching for resources that are limited in this season (Figure 4). We also found that the functional attributes of the bat communities responded more to the attributes of the riparian forest than to those of the dry forest, and responded more to coverage than to forest connectivity. The response was most noticeable during the dry season, when the remnants of riparian forest play a fundamental role in the survival of fauna (Figure 4). Specifically, during the dry season, species with rounded wings (high I index) were predominantly associated with a higher coverage and connectivity of the riparian forest. Likewise, individuals with less weight and smaller size were associated with sites with higher coverage of this vegetation type (at small spatial scales), which are more structurally complex. Both the LOS and BOS were associated, largely in a positive way (longer lancets), to the dry forest coverage. However, during the rainy season, LOS and BOS were associated with the riparian forest coverage (at intermediate and large spatial scales), while larger individuals were associated with sites with high connectivity of this type of vegetation. Concerning the dry forest, during the rainy season, individuals with compact bodies and with long and wide horseshoes were associated with sites with a high dry forest coverage. Finally, it should be noted that, during both seasons, the presence of species with higher W, Law, and WL (larger sizes), as well as with higher development of the horseshoe (LOH), was recorded in landscapes with high connectivity among the remnants of riparian vegetation, which can be useful as flight corridors, especially at large spatial scales (2000–2500 m).
In general, the seasonal consistency in the bat community’s response to variations in vegetation and landscape attributes was low (Figure 3 and Figure 4). Besides, most of the relationships found when analyzing the effect of landscape attributes variation were specific to a particular spatial scale.

4. Discussion

4.1. Characterization of Early Successional Bat Communities

The high variation in bat communities, in terms of both taxonomic and functional composition, might be a reflection of the high heterogeneity in the taxonomic composition of the vegetation that has been described for the early successional stages of this system [13]. Moreover, this heterogeneity emerges as a higher difference in terms of composition between initial successional sites than between conserved sites (Figure 2). Furthermore, the dissimilitude between conserved and disturbed communities was greater during the rainy season, when differences in the structural complexity of the canopy became more noticeable because the foliage is present. This differential complexity would explain why the size of the bats, the shape of the wing, and the features of the nasal leaf, which determine the accuracy of the information received through echolocation, tend to differ between preserved and early successional sites during the rainy season, and also why insectivorous bats appear to drive this differentiation, as they require great maneuverability and precision to locate their prey (Figure 2a,b).
Another important finding was the greater difference in taxonomic composition that some nearby sites showed during the dry season compared with the rainy season (UNAM and UDG, NA1 and NA2, HN1 and HN2) (Figure 2a). This difference may be owing to landscape attributes because there is a loss of connectivity among sites during the dry season. It is likely that the anthropic matrix the bats must move through does not offer enough resources during this time, and the probability of exchanging individuals reduces with the decline of available corridors (“stepping-stones”), accentuating the differences in species composition between sites. Additionally, some bat species begin to reproduce in the dry season, which implies less displacement for females and sometimes for males that become territorial [60]. Specifically, in the case of females, a reduction in their mobility can occur as a result of (1) an increase in the relative wing loading; (2) a reduction in the ability to maneuver; and (3) an increment in the energy expenditure associated with the weight of the fetus, the high metabolic cost of milk production, and the transport of juveniles [29]. In the case of males, a decrease of energy expenditure on mobility and a reduction of home range may occur because of an increase in the energy demand for activities associated with reproduction, such as an increase in the frequency of shelter defense behaviors [23].
Regarding the most abundant species in the different communities (Figure S1), it should be noted that the dominance of Artibeus jamaicensis and Glossophaga soricina in sites of initial succession has been reported in previous studies of this system [5]. A. jamaicensis is usually abundant in this and other tropical systems, while G. soricina tends to increase its abundance in the disturbed forests of the TDF, where there are chiropterophilic species [31]. The dominance of the insectivore Pteronotus parnelli in the rainy season is expected owing to the associated increase in insect availability. The case of Desmodus rotundus, on the other hand, is interesting because the two sites in which it is dominant are highly contrasting in the type of vegetation in which they are embedded. One of them (BAS) is surrounded by riparian and dry forest that offers both food and a refuge for the species, while the JMM site is immersed in a grassland landscape where a high concentration of cattle would be a source of food (Figure 1). This indicates that its specialized diet determines its presence more than the type of forest. Finally, the trend toward a higher abundance observed in the conserved sites was expected considering these forests concentrate the highest diversity of food and shelters (with the exception of caves) for this group [5,14].
The higher abundance and lower diversity of bats during the dry season (Figures S2 and S3), as well as the differences between several early sites and conserved forests during this time, can be explained by the fact that the initial stages have even more adverse conditions than the conserved forests in this season: less availability of trophic resources, less protection from predation (the canopy is more open), and more stressful microclimatic conditions [14]. This would promote that most bat species reduce their presence/visits to the initial stages, and only those able to deal with these conditions would prevail in these communities. The increase in the abundance of these species would decrease the diversity of the community. This would also explain the lower richness recorded in some places during the dry season (Figure S2).
In fact, in tropical systems, it has been observed that the impact of seasonal fluctuations in precipitation on the structure of vegetation, climatic conditions, and the resources used by bats (e.g., shelters and food) can be intensified by the anthropic disturbance. Thus, fragmentation and loss of original habitat can affect the species movement through the landscape, hindering access to key resources, especially for species adapted to dense vegetation areas and incapable of overcoming the ecological barriers imposed by the anthropic matrix [23]. In this sense, the sites with the lowest species richness (JMM and LFO, Figure S2) also showed a high degree of landscape transformation, and thus a low proportion of both dry and riparian forest (Figure 1). However, the differences in richness between sites were few probably because there are still large conserved continuous forests in the region that bats can exploit, as they are highly vagile species that can extract resources from distant sites. These findings illustrate the influence of landscape attributes on faunal communities’ structures.

4.2. Early Successional Bat Community Response to Vegetation and Landscape Attributes

In general, the low seasonal consistency in the response of bats to the variation of vegetation and landscape attributes underlines the important role of the TDF seasonality. Accordingly, fluctuations in environmental conditions and in the availability of resources were reflected as seasonal changes in the taxonomic and functional composition of bat communities. The response of bats to the seasonal change in this study confirms the idea that these communities are vulnerable to climate change and that their seasonal response should be regularly considered in studies.
From the response of bat communities to the attributes of vegetation, we discovered that the communities’ richness was more regulated by the plant species composition than by their structural characteristics (Figure 3). Because the identity of plant species determines the availability of trophic resources, it is expected that plant species composition will determine the bat communities’ richness, particularly at the dry season. Moreover, a higher diversity of bats was associated with a higher structural complexity of the vegetation (number of branches) during the dry season. This has been reported, for example, in gleaning insectivorous bats that depend on the structural complexity of the forage vegetation, or in those bats that depend on highly specialized shelters (e.g., termite nests), such as the case of some members of the Phylostominae family [61]. In our study, the nectarivorous and the hematophagous species tend to be more abundant in sites containing a high number of branches, a fact that suggests the presence of shrub species that constitute chiropterophilic resources, as well as a refuge for fauna from which sanguinivores feed [31]. It should be noted that shrub species are abundant in the early stages of the succession where certain nectarivores may be favored by their ability to forage in open spaces, as well as by the presence of the aforementioned chiropterophilic species [14]. These reasons would also explain why, during the dry season, the overall abundance of bats was elevated in sites with high vegetation structural complexity.
During the rainy season, in contrast, the overall abundance was more associated with the taxonomic composition, probably because, at this time, flowering and fruiting peaks occur and the vegetation composition determines the type of trophic resources available. Nevertheless, we observed a tendency toward a high abundance of frugivores in sites with a low understory density during the rainy season, when vegetation is denser and could hinder flight.
In general we found that the functional attributes of bat communities, mainly related to foraging and feeding, responded more to the vegetation structure as the biophysical environment modulates the possibility of performing such activities [41,42]. Evidence of the latter is that bat species with short, broad, and rounded wings (low values of AR and high values of I) dominated in structurally complex sites. These morphological characteristics constitute adaptations to perform slow flights with a high maneuverability in narrow spaces, allowing them to navigate and forage under these conditions [27,62]. However, the presence of species with lower values of I at sites with a greater number of strata (higher PAI) during the rainy season may be linked to the presence of defined flight corridors at different heights caused by the high degree of stratification of the vegetation, as well as to a greater availability of food. This would allow bats to forage in food-rich areas, while also performing high-speed flights. Among the species with lower values of I, which are very well represented in sites with more developed vegetation, are the insectivorous M. megalophylla (I = 0.34) and the hematophagous D. rotundus (I = 0.79), which are capable of flying at an average speed of 15.3–20.91 km/h and 13.59–18.0 km/h, respectively [63,64]. These can be categorized as fast flights, considering the speed range at which bats generally fly (8.0 to 16.0 k/h) [65]. In the case of M. megalophylla, the areas with more developed vegetation may have higher food availability owing to the possible presence of large moths or other insects [66,67]. In the case of D. rotundus, its association with sites with more developed vegetation may be owing to the high concentration of medium and large-sized mammals on which it feeds, as well as to a great availability of shelters [14,31]. The fast flights in this species are an important adaptation to cover long routes in a short time, which may compensate their slow feeding process [68].
Additionally, the fact that bat species with longer lancets and more developed horseshoes, such as Artibeus species, are in sites where vegetation shows a higher structural complexity regarding its vertical axis (e.g., more strata), can be explained by two non-exclusive hypotheses: (1) these sites provide more and better resources for frugivorous bats, which, among the studied species, are those with the highest nose-leaf; and (2) in nasal-emitting bats (as phyllostomids), more developed nasal leaves and, specifically, more developed spears favor a higher directionality of the sonar beam in the vertical plane (narrower sound beam), which allows a more precise detection of food in the dense foliage (e.g., fruits, nectar, insects) [69,70]. A higher sound directionality gives the species the following advantages: (1) a reduction in the echo returns to the periphery and the back area of the bats, reducing the amount of information they must process to detect objects; and (2) a longer detection range, achieved by focusing the sound energy into a narrower cone [71]. In fact, it has been suggested that these bats could manipulate the nose-leaf to modulate the shape of the sound beam, adjusting the directionality in response to environmental changes [72,73]. In the same sense, bats with more developed horseshoes can be associated with sites with structurally complex vegetation when the canopy is denser (rainy season), because the horseshoe could modify the sound frequency and intensity [41], allowing most bats to adjust the search volume (the space where they can detect an object) and their perception of the vegetation structure; this would facilitate its navigation and food acquisition [69,73]. As the directionality of the sound is determined by the combined effect of echolocation frequency, effective emitter size, nostril separation, capacity to simultaneously emit through the nose and mouth, and the nose-leaf dimensions, more studies are needed in order to support this hypothesis. Today, there are directionality measurements from approximately 17 out of more than 1000 species of echolocating bats, from which 300 are nose-emitting bats [69].
The relationship between bat functional richness and the vegetation species composition during the rainy season could also be explained by the high abundance of resources during this season and by the diversity of resources derived of the vegetation. All these results confirm the idea that the availability of food and shelter are among the main factors determining the bats’ colonization or use of areas transformed by human activity [6,26,74]. To this respect, it has been hypothesized that competition for these resources is one of the mechanisms structuring bat communities in anthropic landscapes and that, for some bats, dependent on forest areas, the variation of vegetation attributes may have a higher influence on their distribution and abundance than the variation of landscape attributes [6,23].
Nevertheless, we found that the overall abundance did also show changes associated with the variation of landscape attributes, and was positively associated with the following: (1) a high degree of connectivity between the remnants of riparian forest during the rainy season, probably because high connectivity minimizes the energy expenditure associated with visiting dispersed patches, and allows to avoid open areas decreasing the susceptibility to predation [29]. In fact, the gradual loss of connectivity between vegetation fragments can constitute a filter to the mobility of certain species, especially those of small and medium size with reduced home ranges (e.g., species of the genera Glossophaga and Sturnira with home ranges around 500 m and 600 m radius, respectively), or those whose foraging strategy depends on the vegetation structural complexity (e.g., gleaning insectivorous hunting directly from the foliage or understory frugivores that feed on low-abundant fruits) [6,25,31,62]; (2) the coverage of the riparian forest at intermediate spatial scales, in both seasons, perhaps owing to the higher availability of trophic resources and shelters found in this type of vegetation, in addition to the presence of a higher number of natural flight corridors than in the dry forest (i.e., courses of rivers and temporary streams), which facilitate the movement of bats through the anthropic matrix; and (3) a low coverage and connectivity of the dry forest as well as high riparian forest cover during the dry season, suggesting less use of dry forest at a time when resources are scarce in there. In consequence, the conditions and resources offered by riparian vegetation to bats would be more critical during the dry season [31,75].
The influence of the high structural complexity and variety of resources in the riparian forest was also evident in the positive relationship between their coverage with the functional dispersion and functional richness of bat communities, attributes that reflect the amplitude of flight, echolocation, and foraging strategies in such communities. In the same sense, during the dry season, the functional dispersion was higher in sites surrounded by high riparian forest connectivity, which reflects the influence of a greater number of natural flight corridors, allowing movement in a landscape dominated by a dry forest that has lost most of its foliage and offers a reduced amount of resources.
Furthermore, a higher degree of preservation of the riparian forest (high coverage and connectivity) favored the presence of species with rounded wings (low I index values), adapted to foraging on sites where the vegetation structure is complex. Likewise, the smaller species might be favored to forage in these sites, especially if they have reduced mobility, while the larger species with wide ranges of mobility (e.g., A. lituratus, A. jamaicensis, and A. hirsutus) would benefit from high connectivity in their search for the tree species that constitute its main source of food (e.g., trees of the Moraceae family), which generally have low density, produce massive fructifications, and are concentrated in this type of vegetation [13]. Thus, high connectivity of riparian forest can favor the presence of large frugivorous bats in regenerating sites and, in general, large bats with high-precision echolocation systems.
Finally, the landscape attributes of the dry forest showed important relationships with functional attributes such as the size of the spear and the horseshoe, which were mostly positively associated with their coverage during the dry and rainy seasons, respectively. Among the species captured, those with the most developed spears belong to the frugivorous guild (A. hirsutus: 9.10 mm, A. lituratus: 8.64 mm, and A. jamaicensis: 8.38 mm), and prefer to take shelter in large-diameter trees, which are abundant in forested and conserved areas [75]. During the dry season, when foliage is scarce, bats depend almost exclusively on the shelters available on tree trunks as there is a scarce availability of caves in the region. On the other hand, the presence of species with more developed horseshoes in areas with greater coverage of dry forest during the rainy season might indicate that this feature can favor navigation and foraging in cluttered areas with a lot of foliage. Other characteristics of the species foraging in small spaces are the shortest, widest, and rounded wings, attributes that dominated in the early successional sites embedded in a matrix with a preserved dry forest coverage, at small spatial scales.

4.3. Concluding Remarks

Our results showed that the analysis of the communities from the taxonomic and functional perspectives, covering multiple scales as well as different factors that modulate bat response (type of vegetation, seasonality), can reveal potential mechanisms that underlie the response to the transformation of natural habitats.
The resulting lessons from these findings include, first, that the species negatively affected by the fragmentation and loss of their natural habitats are those with greater body mass, larger nose-leaves, or a lower wing-aspect ratio (suggesting short and wide wings) and relative wing loading. These species could be limited to fly long distances through open spaces and to exploit the resources of anthropic landscapes, owing to the shortage of food and sites for temporary shelters, and also because their flight is energetically expensive [68]. Thus, the gradual loss of the coverage of the original vegetation and its transformation to grassland for cattle can lead to a loss of certain species, with specific functions in the system, specialized requirements, low behavioral plasticity, and small home ranges, as well as of those that require forest corridors [26,76].
Second, the fact that the areas of preserved dry and riparian forest offer the highest availability of food and shelter for bats. We need to understand that, although several species can find resources in secondary forests, they continue to depend on the resources available in old growth forests, which favor a great diversity and abundance of bats. Then, we must preserve large continuums of both vegetation types, emulating the original composition and connectivity of the landscape in dry forest regions, in order to preserve the taxonomic and functional diversity of bat communities and their functions in ecosystems.
Third, the greater sensitivity of bats to changes in the landscape of riparian vegetation, although its coverage is much smaller than that of dry forest (3.7% vs. 56.1%) [30]. Naturally, the conditions and resources offered by riparian vegetation can be more critical during the dry season, owing to the high reduction in available resources in the dry forest [31,75]. Thus, the loss of coverage and connectivity of the riparian forest can trigger the extinction of some species at the regional level, or would reduce the ability of several species of bats to move, diminishing the actions (e.g., seed dispersal, pollination, nutrient re-translocation) that favor ecological succession in sites under regeneration.
Fourth, the fact that, even in regions where large areas of continuum conserved vegetation still persist, variations in the coverage and connectivity of the remnants that occur at small (e.g., 500, 1000 m) and intermediate spatial scales (e.g., 3000 m) could affect communities of organisms with high vagility such as bats. This multiscale response may be determined by the scale at which species perceive environmental variation, which is a consequence of the resource distribution patterns and of the species ecological attributes and requirements [21]. These results emphasize the need for a multi-scale and multi-coverage approach on bat studies and habitat management [31].
Fifth, the fact that, in the case of the dry forest, the effect of anthropic transformation on fauna is intensified with the seasonality, particularly in the early successional stages that present extreme climatic conditions, reducing the diversity of the resources provided by the vegetation. Thus, the combined effect of habitat transformation and seasonality can cause, in the early stages of succession, a reduction in bat diversity and an increase in the dominance of the few species that can thrive in these conditions.
Finally, the results obtained in our study show that, when we only analyze the taxonomic dimension of diversity, it is very difficult to identify general patterns of the bat response, and this is facilitated by addressing in detail the functional dimension of diversity. Furthermore, the analysis of a relevant set of functional attributes will allow us to better understand such a response, as it can be defined by a combination of several attributes, rather than by a single attribute [77]. Nevertheless, the high natural heterogeneity of tropical landscapes, coupled with a high heterogeneity in the type and intensity of human activities conducted in them, hinder in most cases our ability to identify clear patterns that extend to a whole group across its distribution, or otherwise, contribute to the absence of such patterns, which is an infrequently admitted fact on the subject.

Supplementary Materials

The following are available online at https://www.mdpi.com/1424-2818/12/9/332/s1, Figure S1. Rank-abundance curves for each bat assemblage, per season. Species: Mormoops megalophylla (mormeg), Pteronotus davii (ptedav), Pteronotus parnellii (ptepar), Glossophaga soricina (glosor), Leptonycteris yerbabuenae (lepyer), Choeroniscus godmani (chogod), Musonycteris harrisoni (mushar), Artibeus hirsutus (arthir), Artibeus jamaicensis (artjam), Artibeus lituratus (artlit), Artibeus phaeotis (artpha), Artibeus toltecus (arttol), Sturnira parvidens (stupar), Centurio senex (censen), and Desmodus rotundus (desrot); Figure S2. Differences among early successional sites and old growth forest sites in relation to the overall bat abundance. Each point represents the mean of the differences between the bat abundance (Ab) of an early successional site (ESS) and the bat abundance of an old growth forest site (UNAM: circle and UDG: square). The error bars represent the confidence intervals (CIs). Significant differences are identified when the CIs do not overlap the zero line. Seasons: dry season (above charts) and rainy season (below charts); Figure S3. Estimated species richness (Chao1) per site and per season. Season: dry season (circle) and rainy season (squares); Table S1. Vegetation structure and composition, Table S1a Plant communities scores in non-metric multidimensional scaling axis summarizing site variations in vegetation structural complexity and species composition, Table S1b Pearson correlation coefficients among vegetation structural parameters and the scores corresponding to the vegetation structural complexity ordination; Table S2. Species and number of individuals captured per season (dry season/rainy season), and summary of species richness and sampling completeness at each study sites; Table S3. Most plausible models explaining variations in bat assemblages’ attributes; and Table S4. Model-averaged estimates of different parameters for predictors associated with variation in bat assemblages’ attributes.

Author Contributions

Conceptualization, M.Y.A.-A., K.O., and L.D.A.-C.; data curation, S.R.M.-F., J.I.F.-P., and S.P.M.-D.; formal analysis, S.R.M.-F., J.I.F.-P., S.P.M.-D., and L.D.A.-C.; funding adquisition, M.Y.A.-A., K.O., and L.D.A.-C.; investigation, S.R.M.-F., M.Y.A.-A., and L.D.A.-C.; methodology, M.Y.A.-A. and L.D.A.-C.; project administration, L.D.A.-C.; supervision, L.D.A.-C.; writing—original draft, S.R.M.-F., M.Y.A.-A., A.E.B.-M., C.M.-G., X.C.-C., and L.D.A.-C.; writing—review and editing, M.Y.A.-A., A.E.B.-M., C.M.-G., X.C.-C., K.O., and L.D.A.-C. All authors have read and agreed to the published version of the manuscript.

Funding

This research was funded by the “Programa de Apoyo a Proyectos de Investigación e Innovación Tecnológica” (PAPIIT) of the “Universidad Nacional Autónoma de México” (UNAM) [IA-203413 to L.D.A.-C.]; and the “Consejo Nacional de Ciencia y Tecnología” (CONACyT), Mexico [CB-222202 to L.D.A.-C].

Acknowledgments

Technical support was also provided by the Engs. S. Sauza and E. Canales of the “Escuela Nacional de Estudios Superiores, Unidad Mérida” (ENES-Mérida); and by the Eng. J. Morales of the “Unidad Académica de Ciencias y Tecnología de la Facultad de Ciencias en Yucatán”, UNAM. Logistical support was offered by the ENES-Mérida, the ENES-Morelia, and the “Estación de Biología Chamela” of the UNAM. Fieldwork was largely performed with the help of S. Amador, M. Zamora, P. Zarate, KI. Torres, M. Pineda, A. Lopez, S. Ruiz, and J. Ruiz. Image processing for the bat wing metrics was largely performed with the help of I. Perez-Baltazar and J. Hernández-Martínez. Finally, we appreciate the valuable contributions of three anonymous reviewers and the academic editor, which significantly improved the manuscript. The results of this study are part of the thesis of the first author, under the supervision of Luis Daniel Avila-Cabadilla and Mariana Yolotl Alvarez-Añorve.

Conflicts of Interest

The authors declare no conflict of interest. The funders had no role in the design of the study; in the collection, analyses, or interpretation of data; in the writing of the manuscript; or in the decision to publish the results.

Appendix A. Details on Methodology

Appendix A.1. Land-Use History and General Characteristic of Vegetation in Study Sites

The sites representing the initial stages of the succession were cleared using the slash-and-burn method, subsequently used for agriculture (for two or three years) and livestock and abandoned by the farmers as a consequence of changes in their productive activities [7,32]. This is why the vegetation in these sites is composed of introduced pastures, shrubs, and some emerging trees, which have an average height ranging from 4.30 to 7.80 m. The dominant species on most sites are Acacia cochliacantha, Cordia alliodora, Bonellia nervosa, Caesalpinia eriostachys, Piptadenia obliqua, Caesalpinia coriaria, Acacia farnesiana, Lonchocarpus eriocarinalis, Guazuma ulmifolia, and Croton pseudoniveus. In contrast, the vegetation in the better-conserved sites has two well-defined strata (shrub and tree strata), where the average canopy height ranges on average between 9.50 and 11 m. In these sites, the dominant species are Piptadenia obliqua, Apoplanesia paniculata, Casearia corymbosa, Thouinia paucidentata, Randia aculeata, and Guapira petenensis.

Appendix A.2. Body Mass and Morphometric Measurements

The body mass (M) was measured with a Pesola® Spring balance, while the arm-wing length (Law) and the hand-wing length (Lhw) were measured using a vernier caliper (0.001 mm accuracy). The estimation of the other parameters was carried out processing images of the bats lying in dorsal position, with the right wing completely extended on millimeter paper [78]. All images were obtained in a standardized manner with a Fujifilm S8350 camera (16 MP, 42X Zoom, Full HD), arranged at a fixed height. The images were analyzed with the ImageJ v.1.47 program (http://imagej.nih.gov/ij/).

Appendix A.3. Spatial Structure Evaluation on Response Variables

Before analyzing the relationship between the response variables and variations in vegetation and landscape attributes, we evaluated whether variations in response variables were spatially structured. For this purpose, we analyzed the semivariograms of each of these variables with the help of generalized linear mixed models with penalized quasi-likelihood (glmmPQL), using five different correlation structures: (1) corRatio; (2) corSpher; (3) corExp; (4) corGaus; and (5) corLin. Because none of the variables showed evidence of spatial structuring, we decided to perform the described GLMs using the nlme package [79].

References

  1. Muscarella, R.; Fleming, T.H. The Role of Frugivorous Bats in Tropical Forest Succession. Biol. Rev. 2007, 82, 573–590. [Google Scholar] [CrossRef] [PubMed]
  2. Swanson, M.E.; Franklin, J.F.; Beschta, R.L.; Crisafulli, C.M.; DellaSala, D.A.; Hutto, R.L.; Lindenmayer, D.B.; Swanson, F.J. The forgotten stage of forest succession: Early-successional ecosystems on forest sites. Front. Ecol. Environ. 2011, 9, 117–125. [Google Scholar] [CrossRef] [Green Version]
  3. Chazdon, R.L.; Peres, C.A.; Dent, D.; Sheil, D.; Lugo, A.E.; Lamb, D.; Stork, N.E.; Miller, S.E. The Potential for Species Conservation in Tropical Secondary Forests. Conserv. Biol. 2009, 23, 1406–1417. [Google Scholar] [CrossRef] [PubMed]
  4. Vellend, M. Conceptual Synthesis in Community Ecology. Q. Rev. Biol. 2010, 85, 183–206. [Google Scholar] [CrossRef] [Green Version]
  5. Avila-Cabadilla, L.D.; Stoner, K.E.; Henry, M.; Añorve, M.Y.A. Composition, structure and diversity of phyllostomid bat assemblages in different successional stages of a tropical dry forest. For. Ecol. Manag. 2009, 258, 986–996. [Google Scholar] [CrossRef]
  6. Herrera, J.P.; Duncan, N.; Clare, E.; Fenton, M.B.; Simmons, N. Disassembly of Fragmented Bat Communities in Orange Walk District, Belize. Acta Chiropterologica 2018, 20, 147. [Google Scholar] [CrossRef]
  7. Morales-Díaz, S.P.; Alvarez-Añorve, M.Y.; Zamora-Espinoza, M.E.; Dirzo, R.; Oyama, K.; Avila-Cabadilla, L.D. Rodent community responses to vegetation and landscape changes in early successional stages of tropical dry forest. For. Ecol. Manag. 2019, 433, 633–644. [Google Scholar] [CrossRef]
  8. Cavender-Bares, J.; Kozak, K.H.; Fine, P.V.A.; Kembel, S.W. The merging of community ecology and phylogenetic biology. Ecol. Lett. 2009, 12, 693–715. [Google Scholar] [CrossRef]
  9. Macarthur, R.; Levins, R. The limiting similarity, convergence, and divergence of coexisting species. Am. Nat. 1967, 101, 377–385. [Google Scholar] [CrossRef]
  10. Hubbell, S.P. The Unified Neutral Theory of Biodiversity and Biogeography (Mpb-32); Princeton University Press: Princeton, NJ, USA, 2001; ISBN 9780691021287. [Google Scholar]
  11. Givnish, T.J. On the causes of gradients in tropical tree diversity. J. Ecol. 1999, 87, 193–210. [Google Scholar] [CrossRef]
  12. Miller, P.M.; Kauffman, J.B. Effects of slash and burn agriculture on species abundance and composition of a tropical deciduous forest. For. Ecol. Manag. 1998, 103, 191–201. [Google Scholar] [CrossRef]
  13. Alvarez-Añorve, M.Y.; Quesada, M.; Arturo Sánchez-Azofeifa, G.; Avila-Cabadilla, L.D.; Gamon, J.A. Functional regeneration and spectral reflectance of trees during succession in a highly diverse tropical dry forest ecosystem. Am. J. Bot. 2012, 99, 816–826. [Google Scholar] [CrossRef] [PubMed]
  14. Avila-Cabadilla, L.D.; Stoner, K.E.; Nassar, J.M.; Espírito-Santo, M.M.; Alvarez-Añorve, M.Y.; Aranguren, C.I.; Henry, M.; González-Carcacía, J.A.; Falcão, L.A.D.; Sanchez-Azofeifa, G.A. Phyllostomid Bat Occurrence in Successional Stages of Neotropical Dry Forests. PLoS ONE 2014, 9, e84572. [Google Scholar] [CrossRef] [PubMed]
  15. Norton, M.R.; Hannon, S.J.; Schmiegelow, F.K.A. Fragments are not islands: Patch vs landscape perspectives on songbird presence and abundance in a harvested boreal forest. Ecography 2000, 23, 209–223. [Google Scholar] [CrossRef]
  16. Fleming, T.H.; Muchhala, N. Nectar-feeding bird and bat niches in two worlds: Pantropical comparisons of vertebrate pollination systems. J. Biogeogr. 2008, 35, 764–780. [Google Scholar] [CrossRef]
  17. Kalka, M.B.; Smith, A.R.; Kalko, E.K.V. Bats Limit Arthropods and Herbivory in a Tropical Forest. Science 2008, 320, 71. [Google Scholar] [CrossRef] [PubMed] [Green Version]
  18. Lobova, T.A.; Geiselman, C.K.; Mori, S.A. Seed Dispersal by Bats in the Neotropics; New York Botanical Garden: New York, NY, USA, 2009. [Google Scholar]
  19. Kuzmin, I.V.; Bozick, B.; Guagliardo, S.A.; Kunkel, R.; Shak, J.R.; Tong, S.; Rupprecht, C.E. Bats, emerging infectious diseases, and the rabies paradigm revisited. Emerg. Health Threats J. 2011, 4, 7159. [Google Scholar] [CrossRef] [Green Version]
  20. Jones, G.; Jacobs, D.; Kunz, T.; Willig, M.; Racey, P. Carpe noctem: The importance of bats as bioindicators. Endanger. Species Res. 2009, 8, 93–115. [Google Scholar] [CrossRef] [Green Version]
  21. Meyer, C.F.J.; Struebig, M.J.; Willig, M.R. Responses of tropical bats to habitat fragmentation, logging, and deforestation. In Bats in the Anthropocene: Conservation of Bats in a Changing World; Springer International Publishing: Cham, Switzerland, 2016; pp. 63–103. [Google Scholar]
  22. Rocha, R.; López-Baucells, A.; Farneda, F.Z.; Groenenberg, M.; Bobrowiec, P.E.D.; Cabeza, M.; Palmeirim, J.M.; Meyer, C.F.J. Consequences of a large-scale fragmentation experiment for Neotropical bats: Disentangling the relative importance of local and landscape-scale effects. Landsc. Ecol. 2017, 32, 31–45. [Google Scholar] [CrossRef] [Green Version]
  23. Ferreira, D.F.; Rocha, R.; López-Baucells, A.; Farneda, F.Z.; Carreiras, J.M.B.; Palmeirim, J.M.; Meyer, C.F.J. Season-modulated responses of Neotropical bats to forest fragmentation. Ecol. Evol. 2017, 7, 4059–4071. [Google Scholar] [CrossRef]
  24. Cisneros, L.M.; Fagan, M.E.; Willig, M.R. Effects of human-modified landscapes on taxonomic, functional and phylogenetic dimensions of bat biodiversity. Divers. Distrib. 2015, 21, 523–533. [Google Scholar] [CrossRef]
  25. Klingbeil, B.T.; Willig, M.R. Guild-specific responses of bats to landscape composition and configuration in fragmented Amazonian rainforest. J. Appl. Ecol. 2009, 46, 203–213. [Google Scholar] [CrossRef]
  26. Gonçalves, F.; Fischer, E.; Dirzo, R. Forest conversion to cattle ranching differentially affects taxonomic and functional groups of Neotropical bats. Biol. Conserv. 2017, 210, 343–348. [Google Scholar] [CrossRef]
  27. Norberg, U.M.; Rayner, J.M.V. Ecological morphology and flight in bats (Mammalia; Chiroptera): Wing adaptations, flight performance, foraging strategy and echolocation. Philos. Trans. R. Soc. B Biol. Sci. 1987, 316, 335–427. [Google Scholar] [CrossRef]
  28. Wordley, C.F.R.; Sankaran, M.; Mudappa, D.; Altringham, J.D. Bats in the Ghats: Agricultural intensification reduces functional diversity and increases trait filtering in a biodiversity hotspot in India. Biol. Conserv. 2017, 210, 48–55. [Google Scholar] [CrossRef]
  29. Klingbeil, B.T.; Willig, M.R. Seasonal differences in population-, ensemble- and community-level responses of bats to landscape structure in Amazonia. Oikos 2010, 119, 1654–1664. [Google Scholar] [CrossRef]
  30. Sánchez-Azofeifa, G.A.; Quesada, M.; Cuevas-Reyes, P.; Castillo, A.; Sánchez-Montoya, G. Land cover and conservation in the area of influence of the Chamela-Cuixmala Biosphere Reserve, Mexico. For. Ecol. Manag. 2009, 258, 907–912. [Google Scholar] [CrossRef]
  31. Avila-Cabadilla, L.D.; Sanchez-Azofeifa, G.A.; Stoner, K.E.; Alvarez-Añorve, M.Y.; Quesada, M.; Portillo-Quintero, C.A. Local and landscape factors determining occurrence of phyllostomid bats in tropical secondary forests. PLoS ONE 2012, 7, e35228. [Google Scholar] [CrossRef] [Green Version]
  32. Fraga-Ramírez, Y.; Suazo-Ortuño, I.; Avila-Cabadilla, L.D.; Alvarez-Añorve, M.; Alvarado-Díaz, J. Multiscale analysis of factors influencing herpetofaunal assemblages in early successional stages of a tropical dry forest in western Mexico. Biol. Conserv. 2017, 209, 196–210. [Google Scholar] [CrossRef]
  33. Jones, K.E.; Purvis, A.; Maclarnon, A.; Bininda-Emonds, O.R.P.; Simmons, N.B. A phylogenetic supertree of the bats (Mammalia: Chiroptera). Biol. Rev. Camb. Philos. Soc. 2002, 77, S1464793101005899. [Google Scholar] [CrossRef]
  34. Ceballos, G.; Miranda, A. Guía de Campo de Los Mamíferos de la Costa de Jalisco, México; No. QL722; Fundación Ecológica de Cuixmala A.C.: Jalisco, Mexico, 2000. [Google Scholar]
  35. Fenton, M.B.; Kunz, T. Movements and behavior. In Biology of Bats of the New World Family Phyllosto-Matidae; Baker, R.J., Jones, J.K., Jr., Carter, D.C., Eds.; University Press: Lubbock, TX, USA, 1977; pp. 351–364. [Google Scholar]
  36. Saldaña-Vázquez, R.A.; Munguía-Rosas, M.A. Lunar phobia in bats and its ecological correlates: A meta-analysis. Mamm. Biol. 2013, 78, 216–219. [Google Scholar] [CrossRef]
  37. Marques, J.T.; Pereira, M.J.R.; Marques, T.A.; Santos, C.D.; Santana, J.; Beja, P.; Palmeirim, J.M. Optimizing sampling design to deal with mist-net avoidance in Amazonian birds and bats. PLoS ONE 2013, 8, e74505. [Google Scholar] [CrossRef] [PubMed] [Green Version]
  38. Medellín, R.A.; Arita, H.T.; Sanchez, O. Identificación de los Murciélagos de México, 2nd ed.; Instituto de Ecología de la UNAM: Mexico City, Mexico, 2007. [Google Scholar]
  39. Brunet-Rossinni, A.K.; Wilkinson, G.S. Methods for age estimation and the study of senescence in bats. In Ecological and Behavioral Methods for the Study of Bats; Kunz, T.H., Parsons, S., Eds.; Johns Hopkins University Press: Baltimore, MD, USA, 2009; pp. 315–325. [Google Scholar]
  40. Racey, P.A. Reproductive assessment of bats. In Ecological and Behavioral Methods for the Study of Bats; Kunz, T.H., Parsons, S., Eds.; Johns Hopkins University Press: Baltimore, MD, USA, 2009; pp. 249–264. [Google Scholar]
  41. Arita, H.T. Noseleaf morphology and ecological correlates in phyllostomid bats. J. Mammal. 1990, 71, 36–47. [Google Scholar] [CrossRef]
  42. Arita, H.T.; Fenton, M.B. Flight and echlocation in the ecology and evolution of bats. Trends Ecol. Evol. 1997, 12, 53–58. [Google Scholar] [CrossRef]
  43. Cornwell, W.K.; Schwilk, D.W.; Ackerly, D.D. A trait-based test for habitat filtering: Convex hull volume. Ecology 2006, 87, 1465–1471. [Google Scholar] [CrossRef]
  44. Jost, L. Entropy and diversity. Oikos 2006, 113, 363–375. [Google Scholar] [CrossRef]
  45. Villéger, S.; Mason, N.W.H.; Mouillot, D. New multidimensional functional diversity indices for a multifaceted framework in functional ecology. Ecology 2008, 89, 2290–2301. [Google Scholar] [CrossRef] [Green Version]
  46. Laliberté, E.; Legendre, P. A distance-based framework for measuring functional diversity from multiple traits. Ecology 2010, 91, 299–305. [Google Scholar] [CrossRef]
  47. Mason, N.W.H.; Mouillot, D.; Lee, W.G.; Wilson, J.B. Functional richness, functional evenness and functional divergence: The primary components of functional diversity. Oikos 2005, 111, 112–118. [Google Scholar] [CrossRef]
  48. Team, R.C. R: A Language and Environment for Statistical Computing [Computer Software Manual]; R Core Team: Viena, Austria, 2016; ISBN 3-900051-07-0. [Google Scholar]
  49. Colwell, R.K. EstimateS (Statistical Estimation of Species Richness and Shared Species from Samples). V 9. Available online: http://purl.oclc.org/estimates (accessed on 9 May 2019).
  50. Marsden, S.J.; Fielding, A.H.; Mead, C.; Hussin, M.Z. A technique for measuring the density and complexity of understorey vegetation in tropical forests. For. Ecol. Manag. 2002, 165, 117–123. [Google Scholar] [CrossRef]
  51. Fournier, R.A.; Mailly, D.; Walter, J.M.N.; Soudani, K. Indirect measurements of forest canopy structure from in situ optical sensors. In Remote Sensing of Forest Environments; Wulder, M.A., Franklin, S.E., Eds.; Springer: Boston, MA, USA, 2003; pp. 78–114. ISBN 978-1-4613-5014-9. [Google Scholar]
  52. Mc Cune, B.; Grace, J.B.; Urban, D.L. Analysis of Ecological Communities; Mjm Software Design: Gleneden Beach, OR, USA, 2002; Volume 28, ISBN 0972129006. [Google Scholar]
  53. Jaeger, J.A.G. Landscape division, splitting index, and effective mesh size: New measures of landscape fragmentation. Landsc. Ecol. 2000, 15, 115–130. [Google Scholar] [CrossRef]
  54. Jung, M. LecoS—A python plugin for automated landscape ecology analysis. Ecol. Inform. 2016, 31, 18–21. [Google Scholar] [CrossRef]
  55. Colwell, R.K.; Coddington, J.A. Estimating terrestrial biodiversity through extrapolation. Philos. Trans. R. Soc. Lond. Ser. B Biol. Sci. 1994, 345, 101–118. [Google Scholar] [CrossRef] [Green Version]
  56. MacGregor-Fors, I.; Payton, M.E. Contrasting Diversity Values: Statistical Inferences Based on Overlapping Confidence Intervals. PLoS ONE 2013, 8, e56794. [Google Scholar] [CrossRef] [PubMed] [Green Version]
  57. Burnham, K.P.; Anderson, D.R. Model Selection and Multimodel Inference, 2nd ed.; Springer: New York, NY, USA, 2002; ISBN 978-0-387-95364-9. [Google Scholar]
  58. Bonthoux, S.; Barnagaud, J.-Y.; Goulard, M.; Balent, G. Contrasting spatial and temporal responses of bird communities to landscape changes. Oecologia 2013, 172, 563–574. [Google Scholar] [CrossRef]
  59. Calcagno, V. Glmulti: Model Selection and Multimodel Inference Made Easy. Available online: https://cran.r-project.org/web/packages/glmulti/glmulti.pdf (accessed on 26 May 2020).
  60. Stoner, K.E.; Timm, R.M. Seasonally dry tropical forest mammals: Adaptations and seasonal patterns. In Seasonally Dry Tropical Forests; Dirzo, R., Young, H.S., Mooney, H.A., Ceballos, G., Eds.; Island Press: Washington, DC, USA, 2011; pp. 85–106. [Google Scholar]
  61. Medellín, R.A.; Equihua, M.; Amin, M.A. Bat diversity and abundance as indicators of disturbance in neotropical rainforests. Conserv. Biol. 2000, 14, 1666–1675. [Google Scholar] [CrossRef]
  62. Denzinger, A.; Schnitzler, H.-U. Bat guilds, a concept to classify the highly diverse foraging and echolocation behaviors of microchiropteran bats. Front. Physiol. 2013, 4, 164. [Google Scholar] [CrossRef] [Green Version]
  63. Hopkins, H.L.; Sánchez-Hernández, C.; Romero-Almaraz, M.D.L.; Gilley, L.M.; Schnell, G.D.; Kennedy, M.L. Flight speeds of four species of neotropical bats. Southwest. Nat. 2003, 48, 711–714. [Google Scholar] [CrossRef]
  64. Sánchez-Hernández, C.; Romero-Almaraz, M.D.L.; Wooten, M.C.; Schnell, G.D.; Kennedy, M.L. Speed in flight of common vampire bats (Desmodus rotundus). Southwest. Nat. 2006, 51, 422–426. [Google Scholar] [CrossRef]
  65. Wilson, D.E. Bats in Question: The Smithsonian Answer Book; Smithsonian Books: Whasinhgton, DC, USA, 1997; ISBN 978-1560987390. [Google Scholar]
  66. Haber, W.A.; Frankie, G.W. A Tropical Hawkmoth Community: Costa Rican Dry Forest Sphingidae. Biotropica 1989, 21, 155. [Google Scholar] [CrossRef]
  67. Rezsutek, M.; Cameron, G.N. Mormoops megalophylla. Mamm. Species 1993, 1–5. [Google Scholar] [CrossRef]
  68. Medina, A.; Harvey, C.A.; Merlo, D.S.; Vílchez, S.; Hernández, B. Bat diversity and movement in an agricultural landscape in Matiguás, Nicaragua. Biotropica 2007, 39, 120–128. [Google Scholar] [CrossRef]
  69. Jakobsen, L.; Brinkløv, S.; Surlykke, A. Intensity and directionality of bat echolocation signals. Front. Physiol. 2013, 4, 89. [Google Scholar] [CrossRef] [PubMed] [Green Version]
  70. Vanderelst, D.; De Mey, F.; Peremans, H.; Geipel, I.; Kalko, E.; Firzlaff, U. What noseleaves do for fm bats depends on their degree of sensorial specialization. PLoS ONE 2010, 5, e11893. [Google Scholar] [CrossRef] [PubMed]
  71. Jakobsen, L.; Hallam, J.; Moss, C.F.; Hedenström, A. Directionality of nose-emitted echolocation calls from bats without a nose leaf (Plecotus auritus). J. Exp. Biol. 2018, 221, jeb171926. [Google Scholar] [CrossRef] [PubMed] [Green Version]
  72. Brinkløv, S.; Kalko, E.K.V.; Surlykke, A. Dynamic adjustment of biosonar intensity to habitat clutter in the bat Macrophyllum macrophyllum (Phyllostomidae). Behav. Ecol. Sociobiol. 2010, 64, 1867–1874. [Google Scholar] [CrossRef]
  73. Feng, L.; Gao, L.; Lu, H.; Müller, R. Noseleaf Dynamics during Pulse Emission in Horseshoe Bats. PLoS ONE 2012, 7, e34685. [Google Scholar] [CrossRef] [Green Version]
  74. Voss, R.S.; Fleck, D.W.; Strauss, R.E.; Velazco, P.M.; Simmons, N.B. Roosting ecology of Amazonian bats: Evidence for guild structure in hyperdiverse mammalian communities. Am. Mus. Novit. 2016, 3870, 1–43. [Google Scholar] [CrossRef] [Green Version]
  75. Zarazúa-Carbajal, M.; Avila-Cabadilla, L.D.; Alvarez-Añorve, M.Y.; Benítez-Malvido, J.; Stoner, K.E. Importance of riparian habitat for frugivorous bats in a tropical dry forest in western Mexico. J. Trop. Ecol. 2017, 33, 74–82. [Google Scholar] [CrossRef]
  76. García-Morales, R.; Moreno, C.E.; Badano, E.I.; Zuria, I.; Galindo-González, J.; Rojas-Martínez, A.E.; Ávila-Gómez, E.S. Deforestation impacts on bat functional diversity in tropical landscapes. PLoS ONE 2016, 11, e0166765. [Google Scholar] [CrossRef]
  77. Farneda, F.Z.; Rocha, R.; López-Baucells, A.; Groenenberg, M.; Silva, I.; Palmeirim, J.M.; Bobrowiec, P.E.D.; Meyer, C.F.J. Trait-related responses to habitat fragmentation in Amazonian bats. J. Appl. Ecol. 2015, 52, 1381–1391. [Google Scholar] [CrossRef]
  78. Marinello, M.M.; Bernard, E. Wing morphology of Neotropical bats: A quantitative and qualitative analysis with implications for habitat use. Can. J. Zool. 2014, 92, 141–147. [Google Scholar] [CrossRef]
  79. Pinheiro, J.; Bates, D.; DebRoy, S.; Sarkar, D.; Team, R.C. Linear and Nonlinear Mixed Effects Models. Available online: https://cran.r-project.org/web/packages/nlme/index.html (accessed on 24 May 2020).
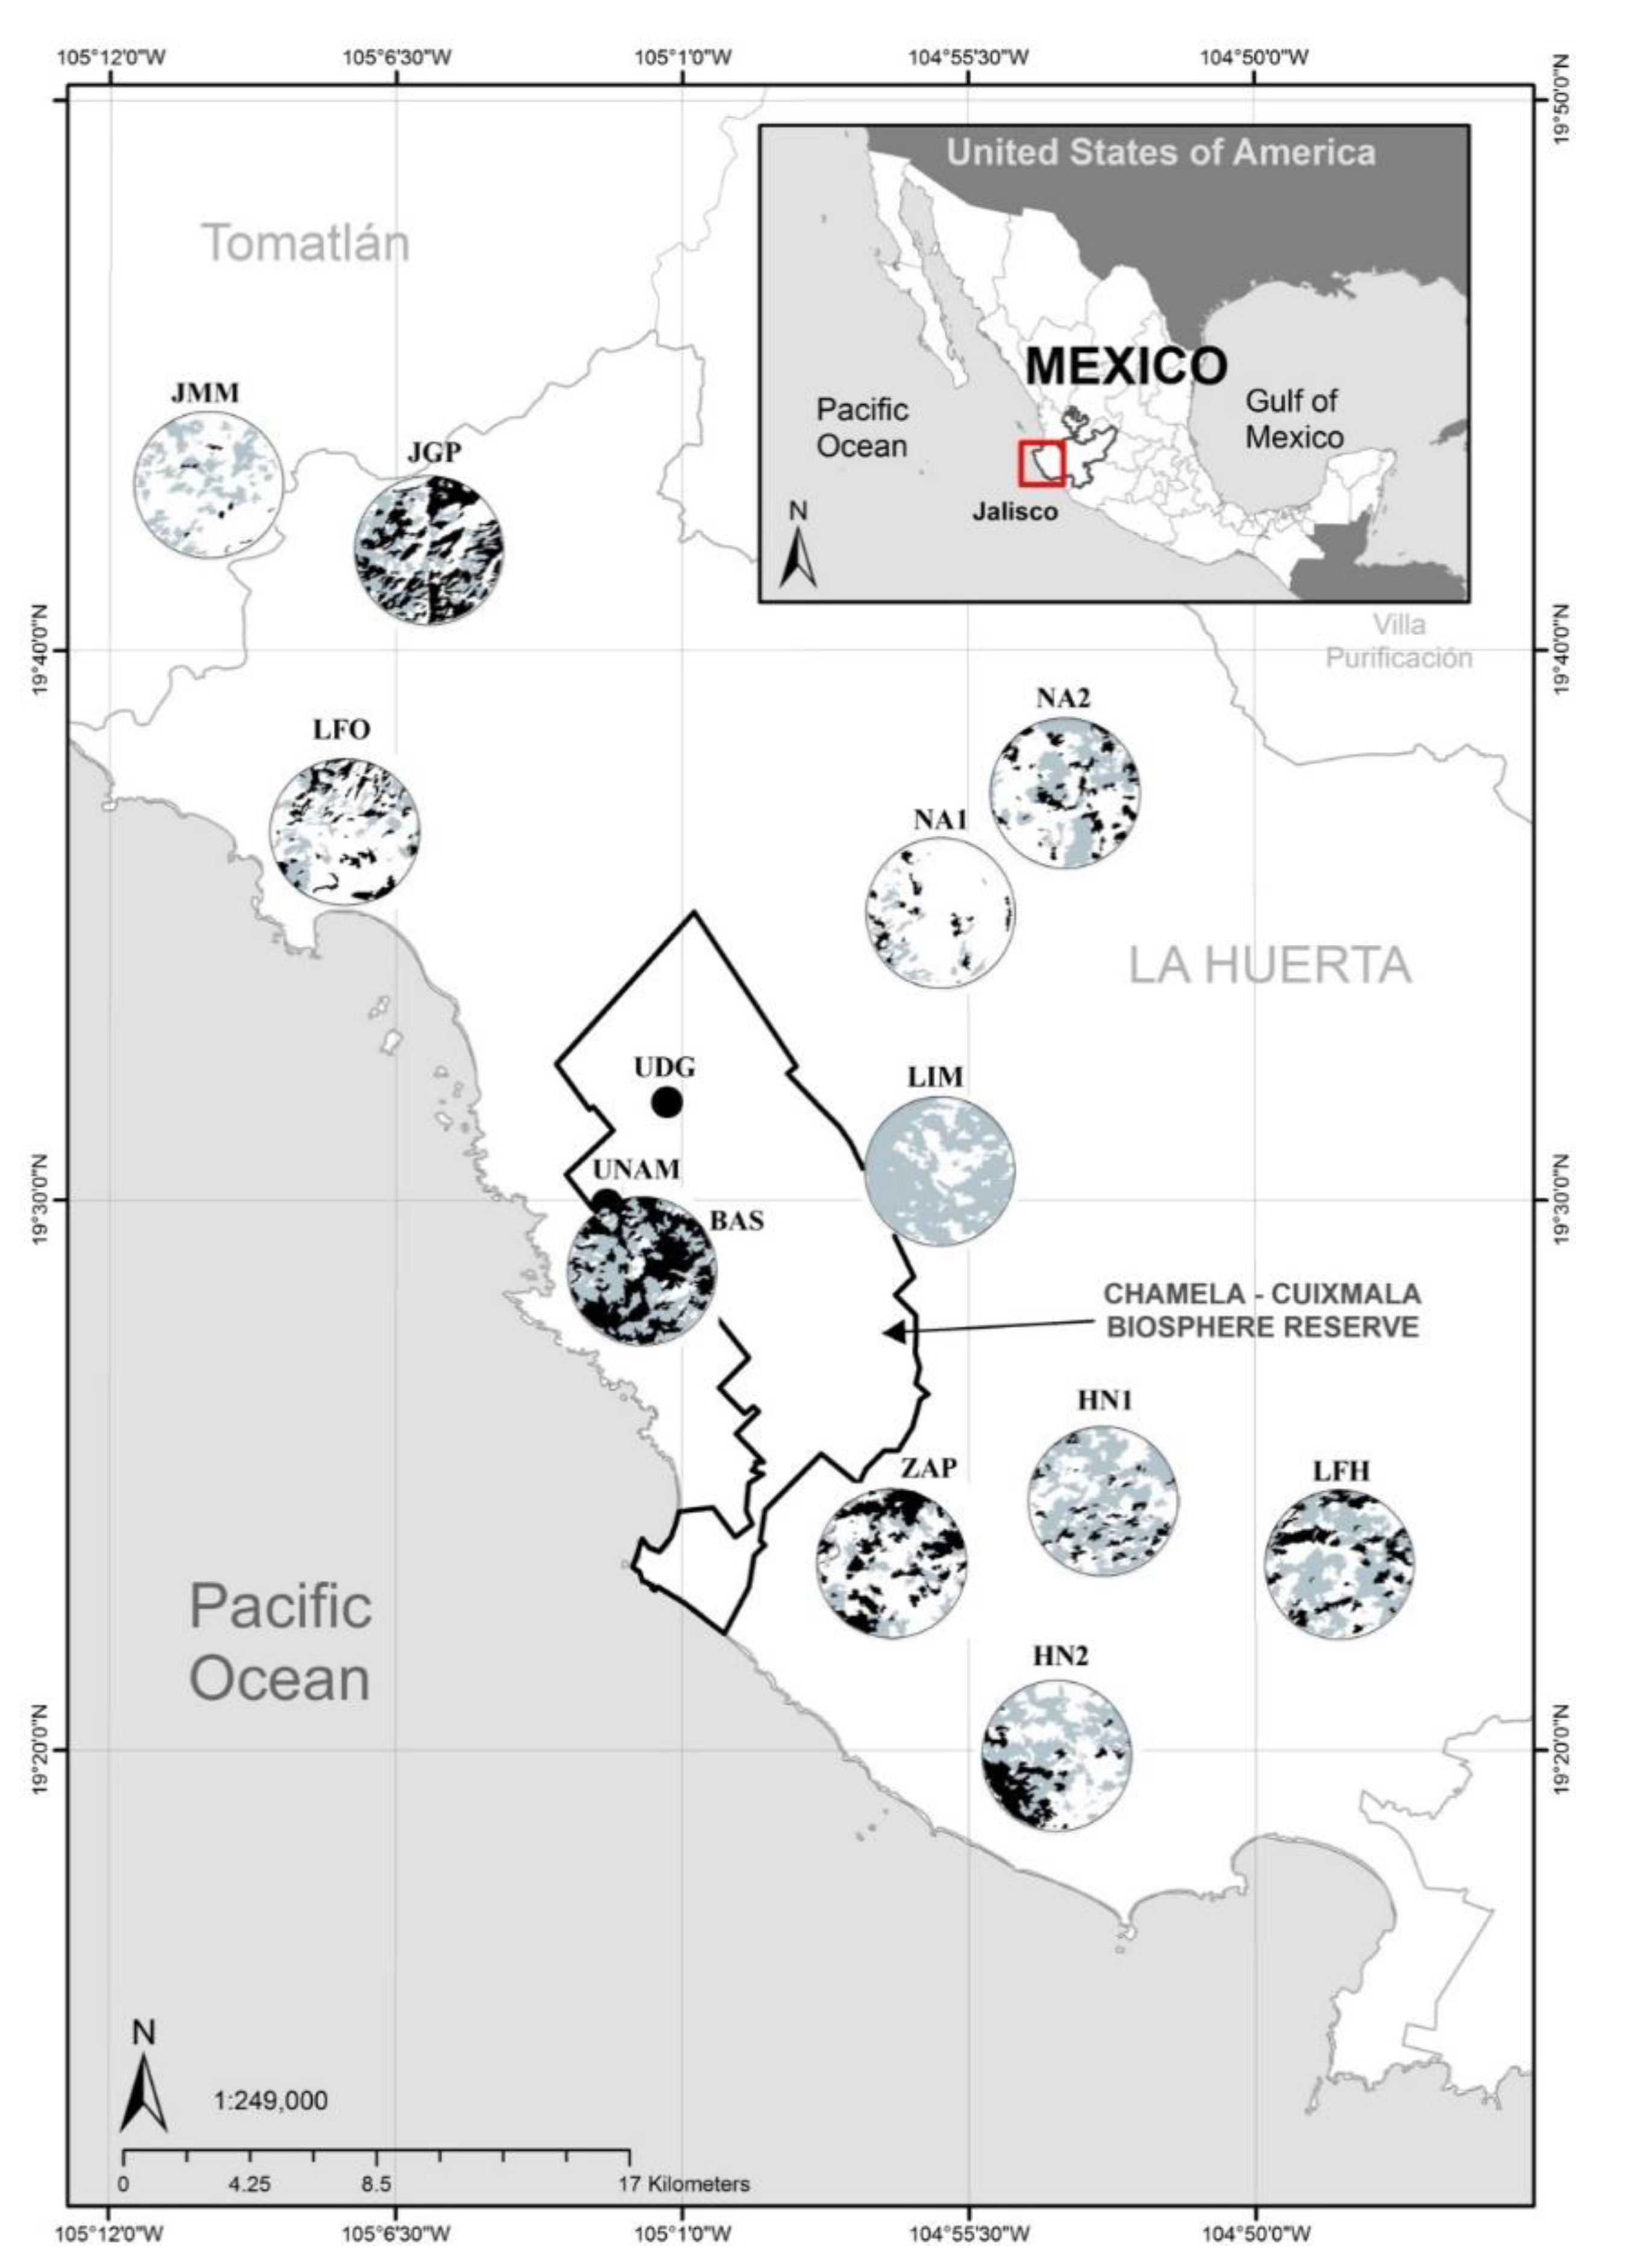
Figure 1. Study sites distribution along the pacific coast of Mexico. UNAM and UDG correspond to old growth forest, while other sites (JMM, JGP, LFO, NA2, NA1, LIM, BAS, HN1, ZAP, LFH, and HN2) correspond to early successional stages of the dry forest. The black polygon represents the Chamela-Cuixmala Biosphere Reserve limits and circles represent the maximum focal scale (3000 m) used for landscape characterization. Land-cover classes inside circles are as follows: (1) dry forest (gray), (2) riparian forest (black), and (3) other types of coverage (white).
Diversity 12 00332 g001
Figure 2. Ordinations (non-metric multidimensional scaling, NMDS) of bat assemblages based on its functional (left charts) and species composition (right charts) during the dry (above charts) and rainy season (below charts). The squares correspond to study sites, showing in gray the early successional sites and in black the old growth forest sites. In the left charts, functional traits are shown in red and capital letters. In the right charts, the species are shown in red and lowercase letters. Functional attributes: weight (W), arm-wing length (Law), wing loading (WL), aspect-ratio (AR), wing tip index (I), length of the spear (LOS), breadth of the spear (BOS), length of the horseshoe (LOH), and breadth of the horseshoe (BOH). Guilds: aerial insectivores (AI), omnivores (O), nectarivores (N), frugivores (F), and sanguivores (S). Species: Mormoops megalophylla (mormeg), Pteronotus davii (ptedav), Pteronotus parnellii (ptepar), Glossophaga soricina (glosor), Leptonycteris yerbabuenae (lepyer), Choeroniscus godmani (chogod), Musonycteris harrisoni (mushar), Artibeus hirsutus (arthir), Artibeus jamaicensis (artjam), Artibeus lituratus (artlit), Artibeus phaeotis (artpha), Artibeus toltecus (arttol), Sturnira parvidens (stupar), Centurio senex (censen), and Desmodus rotundus (desrot).
Diversity 12 00332 g002
Figure 3. Vegetation attributes associated with variations on bat taxonomic and functional diversity during dry and rainy season. Bubble size corresponds to the degree of importance (importance value) of each predictor and bubble color corresponds to the season. The direction of each predictor effect is also shown on bubbles. The value quantifying seasonal consistency for variables associations is shown at the bottom of the chart. The chart only shows the information regarding those predictors included in the set of most plausible models. Response variables regarding taxonomic attributes of communities: the estimated species richness (Chao1), the exponential of Shannon index (eH′), and the overall abundance of bats (Abund.). Response variables regarding functional attributes of communities: the community-weighted mean value for the weight (W), the arm-wing length (Law), the wing loading (WL), the aspect-ratio (AR), the wing tip index (I), the length of the spear (LOS), the breadth of the spear (BOS), the length of the horseshoe (LOH), the breadth of the horseshoe (BOH), and the functional richness index (FRic). Vegetation predictors: scores of NMDS axis summarizing site variation on vegetation structural complexity (Structure) and on species composition (Composition).
Diversity 12 00332 g003
Figure 4. Landscape attributes associated with variations in bat taxonomic and functional diversity during the dry and the rainy season. Bubble size corresponds to the degree of importance (importance value) of each predictor and bubble color corresponds to the season. The direction of each predictor effect is also shown on bubbles. The value quantifying seasonal consistency for variables associations is shown at the bottom of the chart. The chart only shows the information regarding those predictors included in the set of most plausible models. Response variables regarding taxonomic attributes of communities: the exponential of Shannon index (eH′) and the overall abundance of bats (Abund.). Response variables regarding functional attributes of communities: the community-weighted mean value for the weight (W), the arm-wing length (Law), the wing loading (WL), the aspect-ratio (AR), the wing tip index (I), the length of the spear (LOS), the breadth of the spear (BOS), the length of the horseshoe (LOH), the breadth of the horseshoe (BOH), as well as the functional richness index (FRic) and the functional dispersion index (FDis). Landscape predictors: the percentage of forest cover (Coverage) and the effective mesh size as a measure of connectivity (Connectivity), estimated at different spatial scales (from 500 to 3000 m) regarding the dry and riparian forest.
Diversity 12 00332 g004
Table 1. Functional traits measured or calculated for captured individuals.
Trait ComplexAbbreviation/TraitMeasure/CalculusInterpretation
SizeW/weightW = M × 9.81 m/s2 (gravity)Larger species tend to have smaller populations, slower life histories, and larger home ranges owing to greater energy requirements.
Law/arm-wing lengthDirectly measuredLarger species tend to have smaller populations, slower life histories, and larger home ranges owing to greater energy requirements.
WingWL/wing loadingWL = W/SIt is a measure of the required pressure to sustain the flight. Flight speed is proportional to the square root of wing loading.
AR/aspect-ratioAR = Lws2/SIt is a measure of the general bat’s body shape. Lower values correspond to lower aerodynamic efficiency and higher energy losses in flight (short and wide wings).
I/wing tip indexI = Ts/Tl-TsIt provides a measure of the wing tip angle, and hence of wingtip shape. Lower values correspond to more acute wingtips.
Leaf-noseLOS/length of the spearDirectly measuredLarger dimensions can be potentially associated with an increased ability to direct sound.
BOS/breadth of the spearDirectly measuredLarger dimensions can be potentially associated with an increased ability to direct sound.
LOH/length of the horseshoeDirectly measuredLarger dimensions can be potentially associated with an increased ability to direct sound and also to the frequency of emission.
BOH/breadth of the horseshoeDirectly measuredLarger dimensions can be potentially associated with an increased ability to direct sound as well as with the frequency of emission.
Morphometric parameters measured on bats to quantify functional traits: M, body mass; S, body area (the sum of the area of the body, the wing, and the uropatagium to the central axis of the body, multiplied by 2); Lhw, hand-wing length; Lws, wingspan, estimated as the distance from the tip of the wing to the central axis of the body multiplied by 2; Shw, the hand-wing area; and Saw, the arm-wing area (see Appendix A.2). Other quantified parameters for the calculation of I (wing tip index) are as follows: Ts = Shw/Saw and Tl = Lhw/Law. The measures of M is expressed in kg, whereas linear measurements were scaled up to meters and area measurements to m2.