Article

Exotic Prey Facilitate Coexistence between Pumas and Culpeo Foxes in the Andes of Central Chile

1
Wildlife Habitat and Population Analysis Lab, Department of Fish and Wildlife Conservation, Virginia Tech, Blacksburg, VA 24061, USA
2
Department of Ecology, Proyecto Carnívoros Australes, Constitución 3560000, Región del Maule, Chile
3
Fauna Australis Wildlife Laboratory, Department of Ecosystems and The Environment, Pontifical Catholic University of Chile, Santiago 7820244, Chile
4
School of Veterinary Medicine, Pontifical Catholic University of Chile, Santiago 7820244, Chile
*
Author to whom correspondence should be addressed.
Diversity 2020, 12(9), 317; https://doi.org/10.3390/d12090317
Submission received: 19 July 2020 / Revised: 15 August 2020 / Accepted: 18 August 2020 / Published: 20 August 2020

Abstract

:
Coexistence between species with similar ecological niches implies species must segregate along one or more niche axes to survive. Space, time, and trophic resources are regarded as the principal axes upon which species segregate. We examined segregation along these niche axes to determine mechanisms underlying coexistence between the two main predators, puma (Puma concolor) and culpeo foxes (Lycalopex culpaeus) in the Andes of Central Chile. We used occupancy modeling to examine space use and overlap, Kernel Density Estimation to determine temporal activity patterns and overlap, and analysis of prey remains in feces to assess diet breadth and similarity. We found high spatial overlap and positive associations between detection of the carnivores lending little support for spatial segregation. Similarly, we found high nocturnal, temporal overlap between pumas and foxes that matched peaks in activity of prey. In contrast, we found relatively low dietary overlap indicating niche segregation likely occurs along the dietary axis. The Puma diet was dominated by introduced, exotic hares and foxes appeared to shift away from hares to rabbits, small mammals, and seeds. Given that lagomorphs are the main dietary resource for pumas in particular, management decisions regarding the control or eradication of such exotic species could negatively affected puma survival.

1. Introduction

Coexistence between species with similar ecological niches is of broad interest to ecologists (e.g., [1,2,3,4]). For carnivores, coexistence between sympatric species is subject to ecological constraints either through direct (e.g., interference competition, intraguild predation) or indirect means (e.g., exploitative competition, trophic cascades [5,6,7,8]). The competitive exclusion principle predicts that competing species must segregate, at least partially, along one or more dimensions of their ecological niches in order to coexist [5,9]. The three main niche axes are described as spatial (where species occur on a landscape), temporal (timing of activity throughout the day), and trophic resources (i.e., diet) [10,11].
Previous studies on spatial associations between carnivores have reported spatial segregation. For instance, red foxes (Vulpes vulpes) and Iberian lynxes (Lynx pardinus) show habitat segregation in Europe and are sensitive to prey abundance, suggesting that, when active, foxes avoided Iberian lynxes using habitats not used by them [12]. Others found that carnivores co-occur to a high degree, suggesting that the spatial distribution of shared resources is the key determinant of carnivores’ spatial distributions, rather than negative interactions like competition and predation [13,14], and that coexistence might be mediated by fine-scale spatio-temporal segregation or diet partitioning [15].
The temporal niche axis may be particularly relevant for carnivores, as many studies have reported that temporal segregation has an important role in facilitating their coexistence [1,9,16,17,18,19,20,21]. Reducing intra-guild competition could be achieved by a subordinate competitor adjusting activity temporally to reduce temporal overlap with a dominant competitor [9]. Several studies have noted temporal shifts among carnivores including pumas (Puma concolor) with jaguars (Panthera onca) [17,22]; tigers (Panthera tigris) and other Asian cats [20]; native and exotic carnivores in Madagascar [19]; and pumas, pampas cats (Leopardus colocolo), and Andean mountain cats (Leopardus jacobita) [1].
Regarding trophic or dietary resources, trophic niche partitioning has been reported between large, top-predators and mesocarnivores (e.g., [23,24,25]). These studies report prey segregation, often associated with body size. For example, in central Mexico, pumas and jaguars (Panthera onca) consume mainly large mammals, whereas smaller mesocarnivores such as ocelots (Leopardus pardalis), margays (Leopardus wiedii), jaguarundis (Puma yagouaroundi), white-nosed coatis (Nasua narica), and gray foxes (Urocyon cinereoargenteus) feed mainly on a range of small mammals and birds [23].
Furthermore, few studies have explored the activity patterns and diets of carnivores in relation to their main prey [17,26] in ecosystems where native prey have been mostly extirpated and replaced by exotic and domestic animals (e.g., [9]). Additionally, to our knowledge, no study has examined all three niche dimensions simultaneously in areas with both native and exotic prey.
Our study system offers a fairly simple food web compared to other areas (e.g., tropical forests), and thus provides a valuable opportunity to evaluate niche partitioning and community interactions. There is one large carnivore (the puma) and one mesocarnivore (the culpeo fox—Lycalopex culpaeus). The puma is the top predator and is expected to exert significant influence on the function and structure of ecosystems including distribution and abundance of other smaller carnivores and prey. The culpeo fox is the largest native wild canid in Chile and the second largest wild carnivore in Chile after pumas. Additionally, interactions between pumas and culpeo foxes have not been assessed, which is especially relevant given mesocarnivores are key to ecosystem functionality and other studies highlight the need to understand their trophic role and ecological interactions [27]. The few puma studies that do exist in South America mostly have been on puma prey preference [28] and, in Chile, most research has been conducted in southernmost areas (e.g., Torres del Paine National Park and surrounding areas). There is a notable lack of knowledge about pumas specifically, and about species interactions or community structure in general, in the Chilean Andean ecoregion [29].
In this study, we aim to determine factors allowing co-existence between the top predator (puma) and the largest subordinate one (culpeo fox), in a central Chilean biodiversity hotspot by examining three important niche axes simultaneously: spatial, temporal, and diet. Given that several studies have found that carnivores tend to co-occur due to shared habitat or resource needs [1,2,3,4,9,15,16,17,18,19,20,21]), we did not necessarily expect avoidance of pumas by foxes, but we did expect that foxes may be more wary and thus less detectable in areas with pumas. Additionally, other studies have shown that carnivores synchronize activity patterns with their prey [17,18,22], therefore we expected to find that pumas and foxes would exhibit high temporal overlap with their main prey, but the two carnivores might avoid each other temporally either to prevent potentially aggressive encounters or due to hunting different prey that is active at different times. Trophic niche partitioning has been reported as a mechanism promoting coexistence between large felids (i.e., jaguars and pumas [17,22]), but previous studies have not found evidence on trophic shift between pumas and culpeo foxes [30,31]. We predict that pumas and foxes will segregate, at least, over one of the three main dimensions of the ecological niche (space, time, and trophic resources) in order to coexist. Based on the available knowledge of the species and niche theory, we expect to observe segregation mostly likely to occur along the trophic and temporal niche axes.

2. Materials and Methods
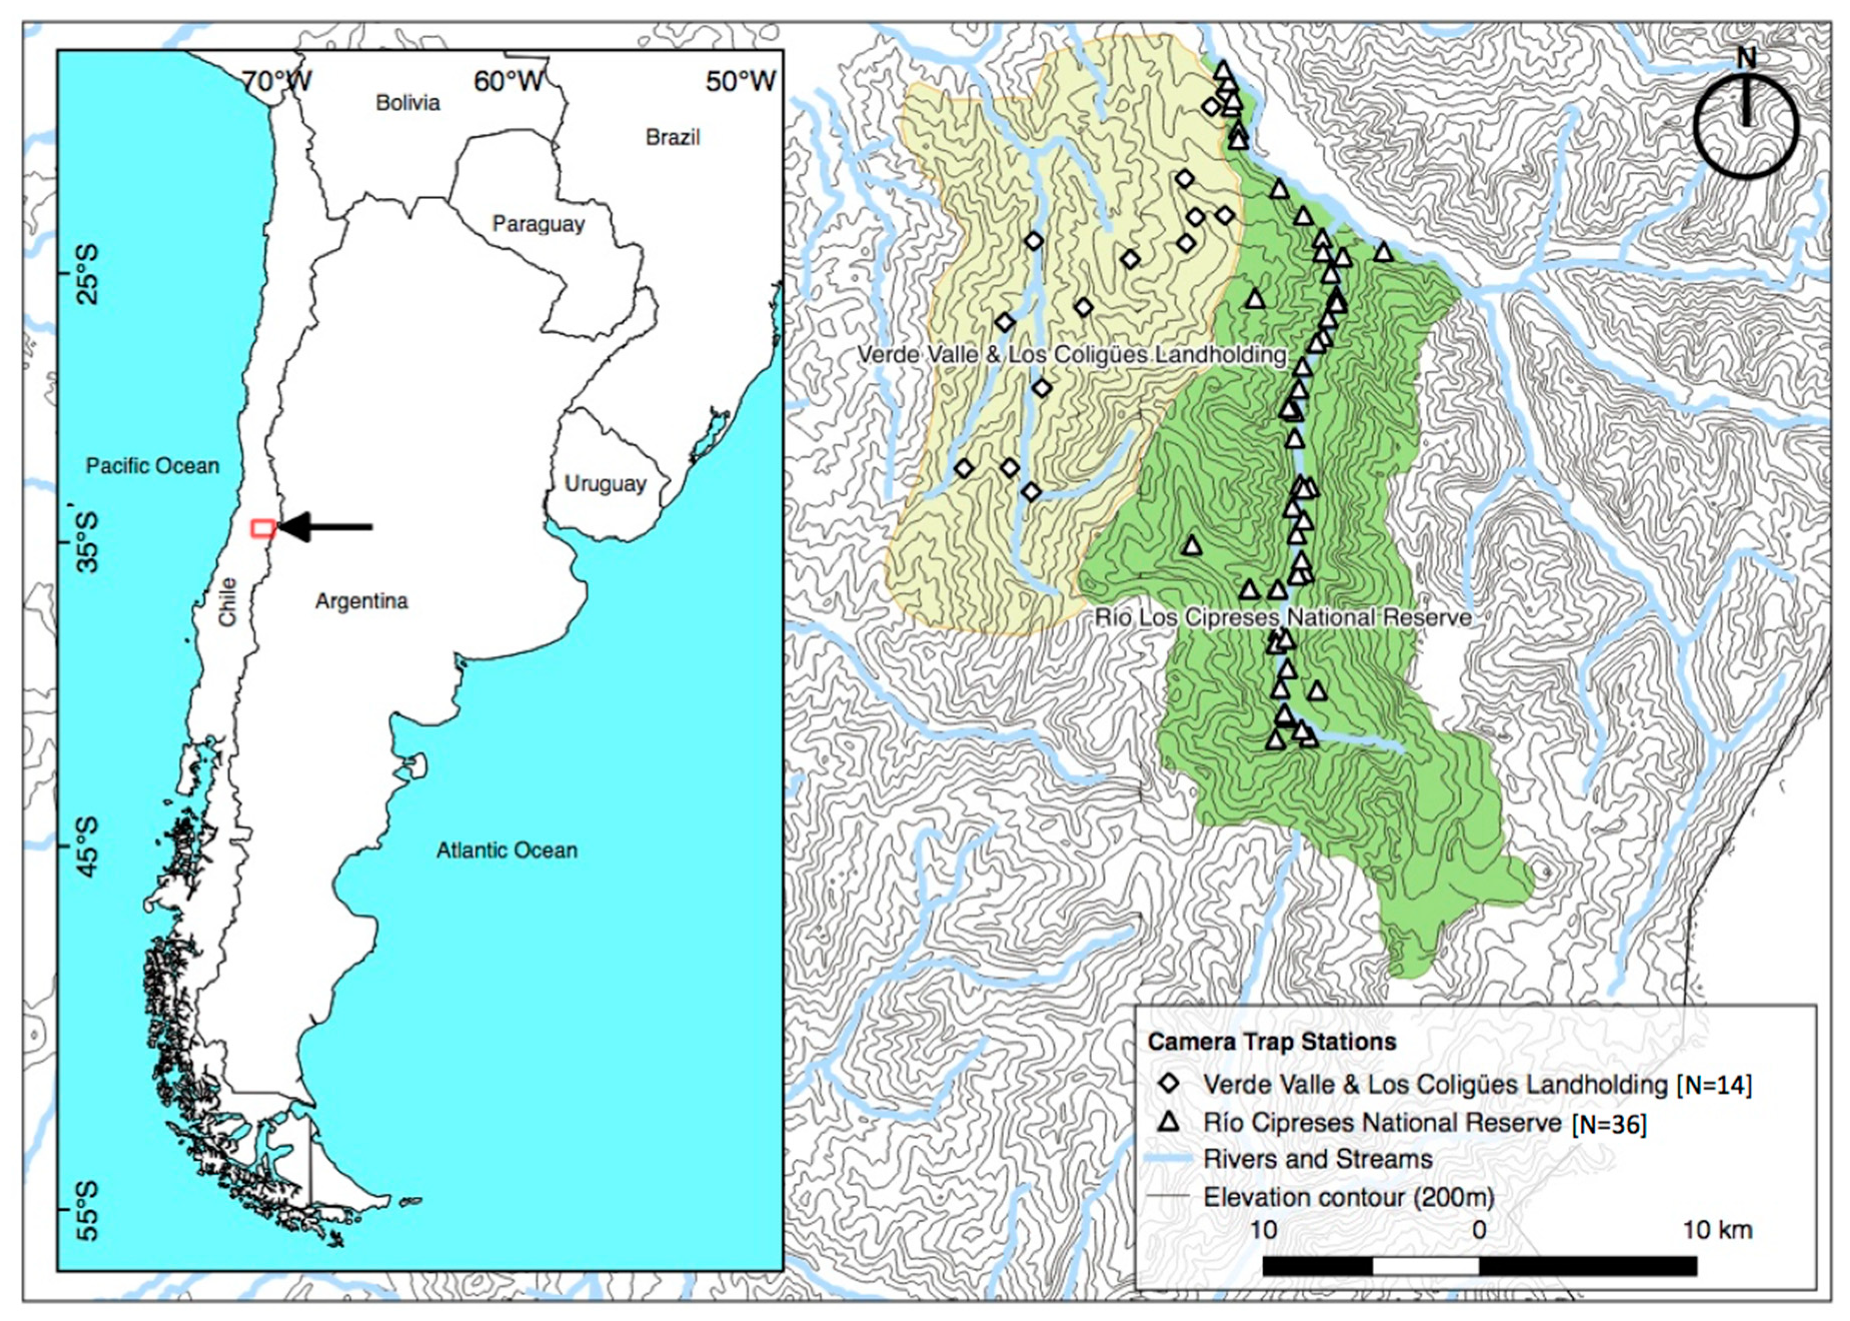
2.1. Study Site

This study was conducted in the Andean Mediterranean Region of central Chile [32], specifically, Río Cipreses National Reserve (RCNR), a 36,882 ha protected area without livestock and Verde Valle-Los Coligües Landholdings (VV&LC), two private landholdings where cattle and horses are raised, comprising 30,949 ha [33] (Figure 1).
The study area is located in the mountain range of the Andes, in the Mediterranean-steppe transition that belongs to the Chilean Winter Rainfall Mediterranean region-Valdivian Forests Biodiversity Hotspot [34]. Weather corresponds to a Mediterranean climate, with cold rainy winters (June–September) and a summer dry season (December–March) [35]. DiCastri and Hajek [36] reported that the annual averages for maximum, mean, and minimum temperatures recorded in a climate station near the study area (i.e., the town of Sewell) are 14.5 °C, 9.5 °C, and 5.0 °C, respectively. The relative humidity (annual mean) is 50% with a precipitation annual mean of 1052 mm.
Topography is dominated by glacier basins embedded in steep mountain chains [32]. Vegetation comprises three broad types forming an altitudinal gradient between a dense sclerophyllous forest dominated by litre (Lithrea caustica), bollén (Kageneckia oblonga), and soap bark (Quillaja saponaria) trees at lower altitudes (900–1300 m.a.s.l.), a transitional thorny shrub dominated by colliguay (Colliguaja sp.), barba de tigre—tiger’s beard—(Colletia sp.), romerillo (Baccharis sp.), and retanilla (Retanilla sp.) genera and occasional patches of frangel (Kageneckia angustifolia), Chilean cedar (Austrocedrus chilensis) and Escallonia revoluta at medium elevations (1300–1800 m.a.s.l.); and an Andean Steppe with the presence of herbaceous plants and grasses like cadillo (Acaena sp.), clavel del campo (Mutisia sp.), and paja brava (Festuca sp.) over 2000 m.a.s.l. [29,33,35,37].
RCNR belongs to the national protected area system of Chile, was created in 1985, and protects recovering Mediterranean vegetation and diverse wildlife including the puma, the culpeo fox, and a few remaining guanacos (about 100 individuals, and decreasing, N. Guarda, comm. pers. 2020), which are the largest native herbivore of Chile (Figure A2).
Native prey at our study site include guanacos (Lama guanicoe) and plain viscachas (Lagidium viscacia) [38,39,40], (which occur at very low abundances at the study area [32]) and small mammals (mostly rodents). European hares (Lepus europaeus) and rabbits (Oryctolagus cuniculus) are both exotic lagomorphs well adapted to the Mediterranean ecosystems of central Chile, introduced at the end of the 19th century [41,42]. European hares reach 3–5 kg while rabbits are smaller (1.5–2.5 kg) [43,44,45]. Hares are an important prey item for both pumas and culpeo foxes at other sites in Chile and Argentina [38,39,40,46,47], whereas rabbits are an important prey item for culpeo foxes [48,49,50]. Previous studies have assessed the contribution of exotic species as prey for pumas in other biomes of Chile [38,39,51,52]. However, the ecological and trophic relationships between pumas and culpeo foxes, and the contribution of exotic lagomorphs to their diets, have not been assessed in the Chilean Andean ecoregion.
The viscacha is a medium size rodent that was previously extant but now is extremely rare in the study area. Introduced rabbits and hares are abundant at the study site (Figure A2). A rich biodiversity of small mammals from central Chile is well represented. A minimum puma density between 0.3 and 0.75 adult individuals/100 km2 has been estimated based on individual recognition from camera trap records in RCNR and VV&LC [29] and culpeo fox density remains unknown. VV&LC are used as summer ranges for livestock with the animals arriving in spring and leaving in the early autumn. Although cattle and horses are grazed in the area with little supervision, sheep and goats are managed more intensively (i.e., goats are milked daily and spend the night in enclosures near houses) [33].

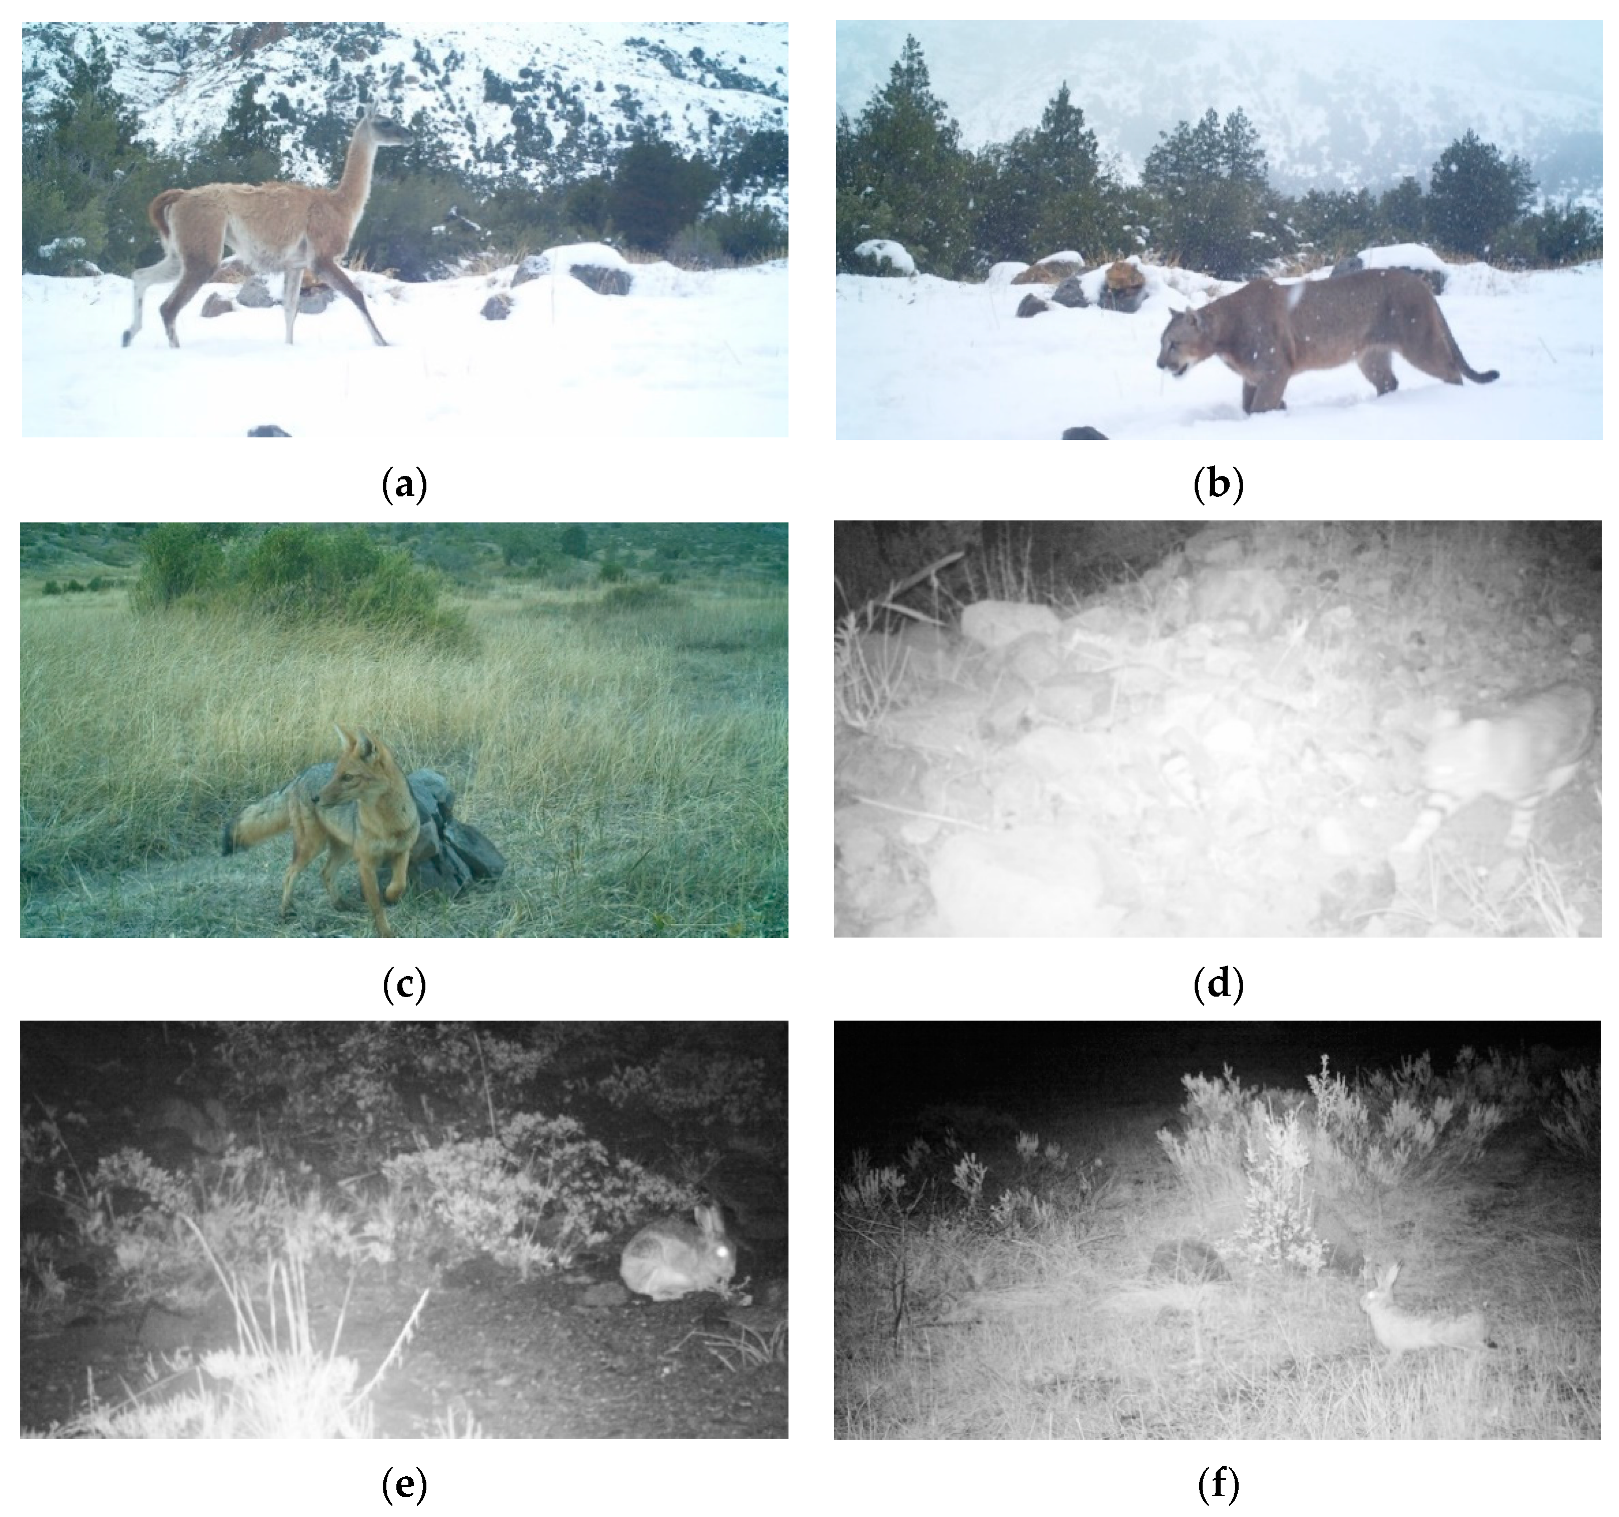
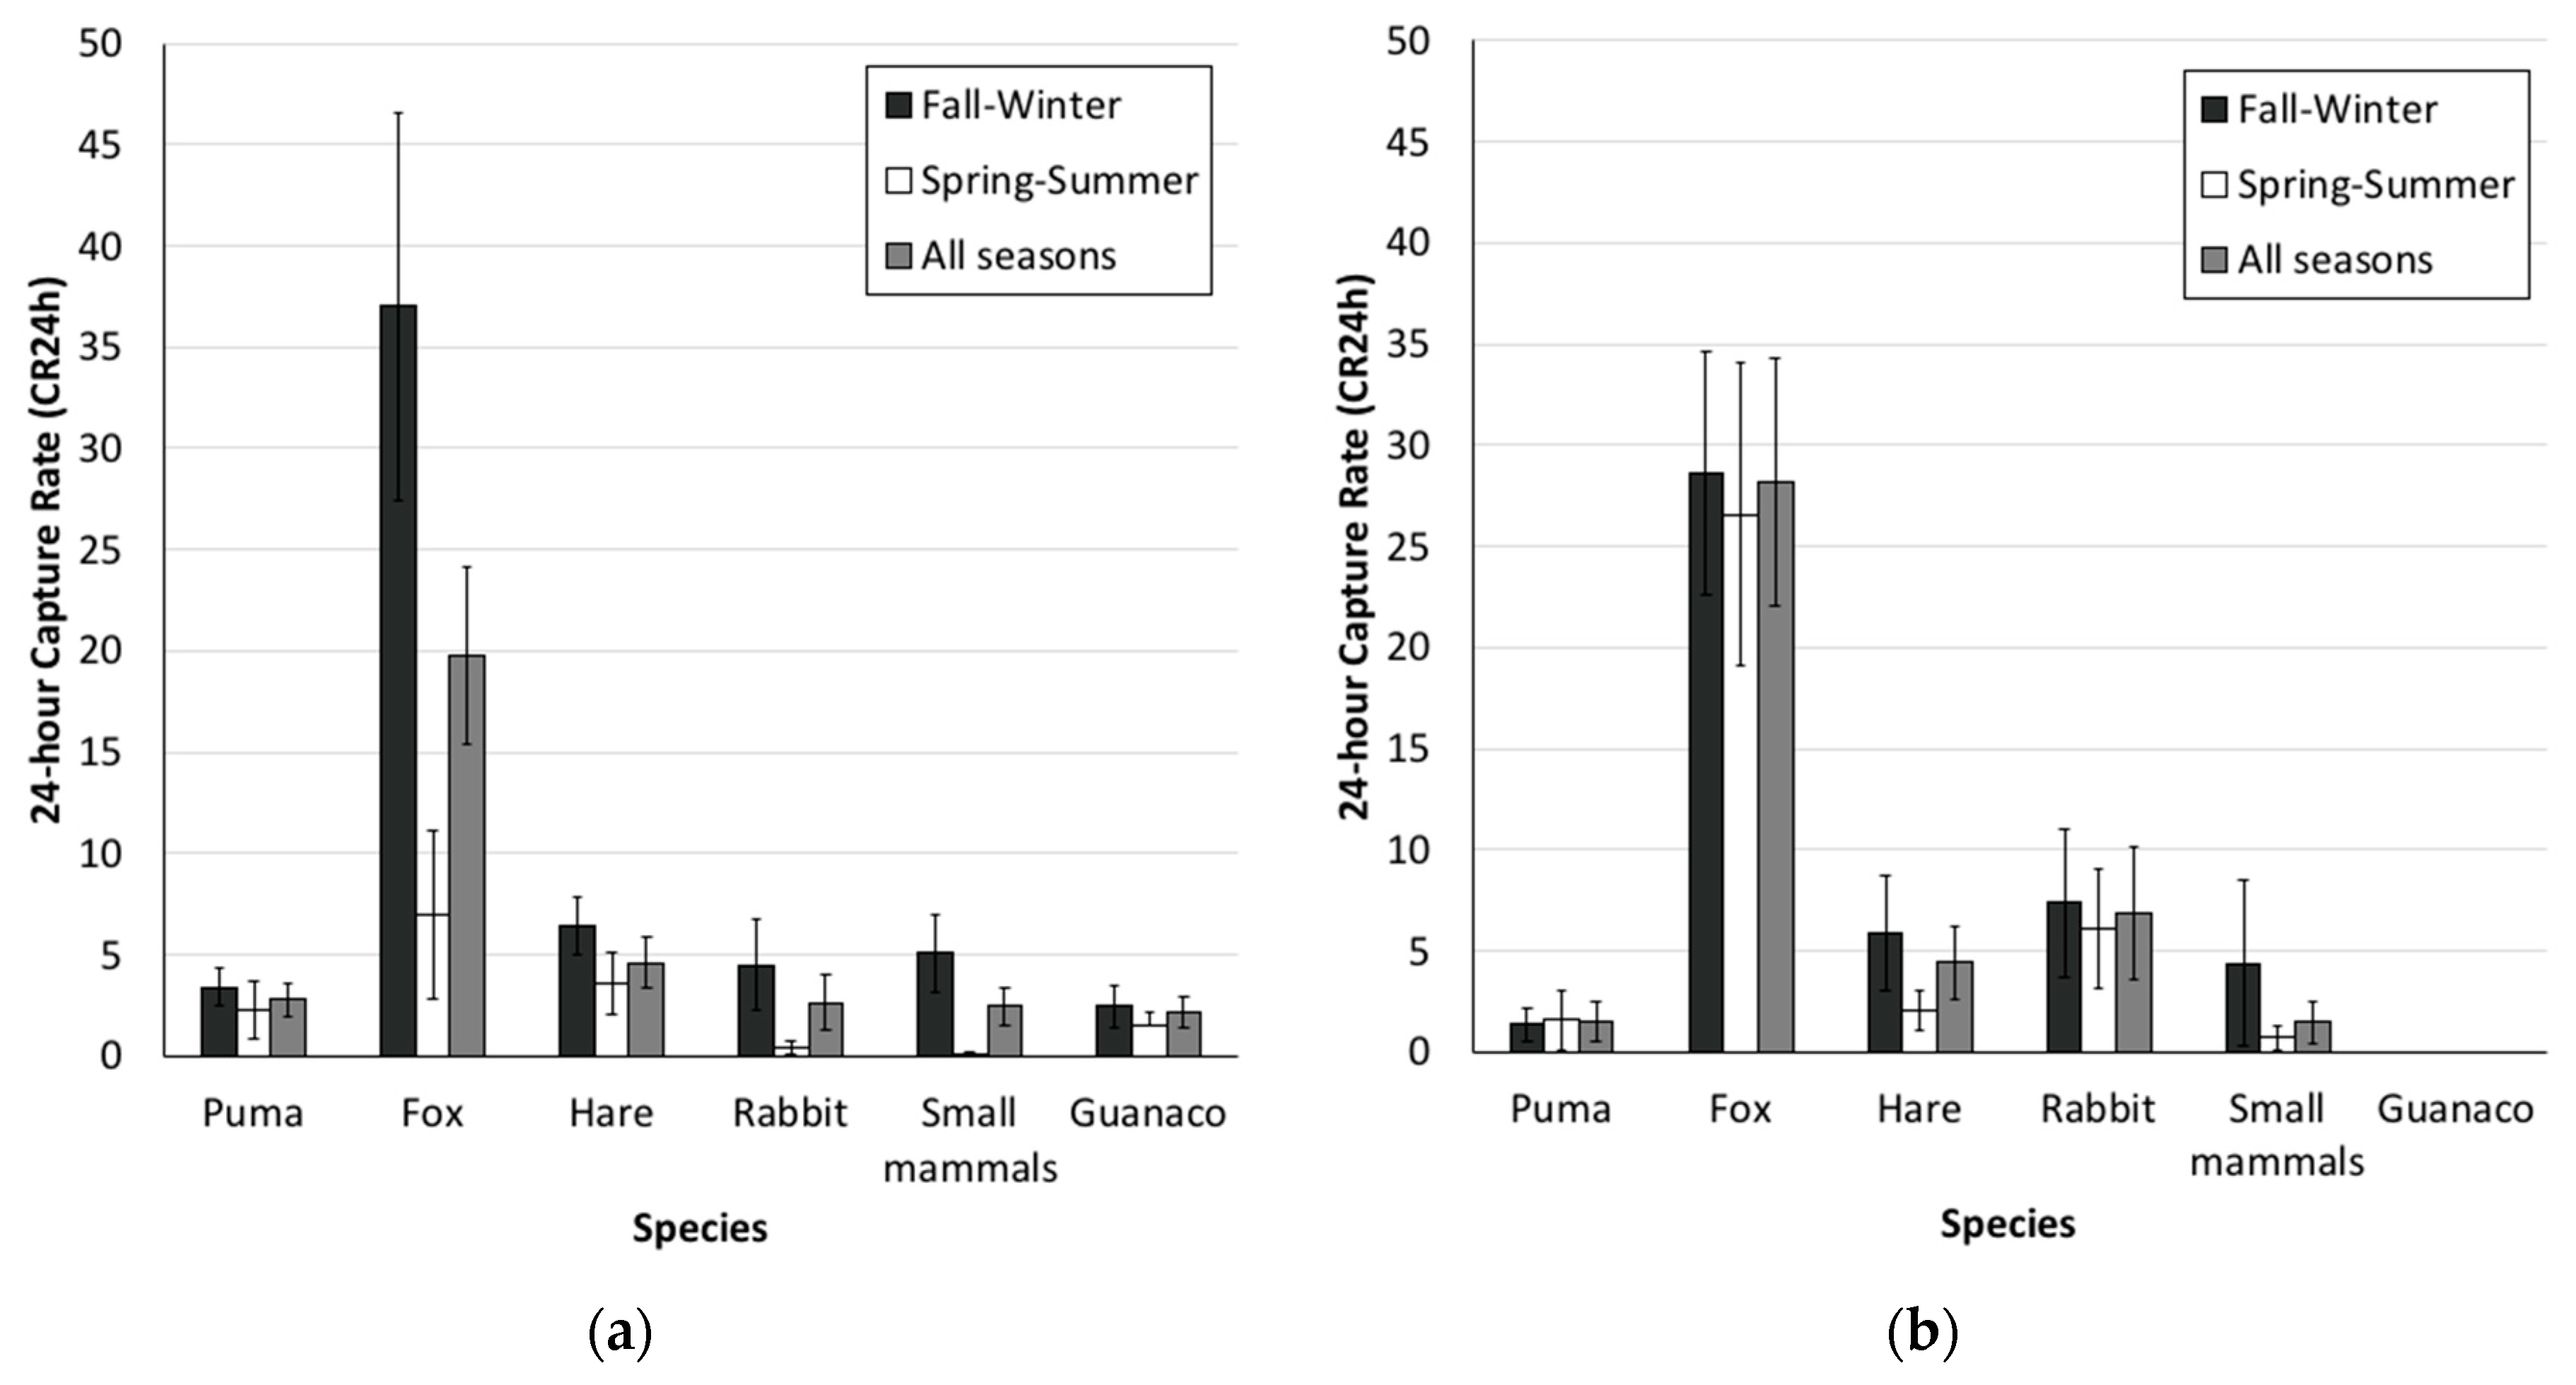
2.2. Camera-Trap Surveys and Trap Rates

We deployed a total of 50 single-camera stations in the study area: 36 in RCNR in 2015, and 14 in VV&LC in 2012–2013 (Figure 1). We set cameras along valley bottoms and occasionally on ridges, using a line-sampling scheme [29] that has been reported as a successful approach for snow leopards (Panthera uncia) in mountainous environments [53]. Cameras were deployed along pathways separated 1 to 1.5 km apart [7,9,54], prioritizing local placement where pumas were more likely to be detected [29]. Cameras were mounted on the base of trees or rocks approximately 0.4–0.6 m above ground and were programmed to capture three photos when triggered, with 5-s delay between triggers. Cameras were active 24 h/day and set to record local (GMT minus 4:00) date and time when triggered. We used two camera-trap models: UNIT (Stealth Cam LLC® Digital Scouting Cameras, Grand Prairie, TX, USA) and Trophy Cam HD (Bushnell® Outdoor Products, Kansas, MO, USA), with trigger times of 0.8 and 0.7 s, respectively.
To increase detection probability, especially in open areas without an obvious trail, camera-stations were baited with a combination of wildcat urine and wildcat lure (e.g., Hawbakers Wild Cat Lure No. 2 and No. 1; Calvin Klein Obsession perfume [55]) placed 2–3 m from the camera in perforated plastic containers, at approximately 30 cm above ground. Understory growth in front of cameras was cleared to avoid false triggering and provide clear view of detected animals [56]. Camera-traps were in the field for 113 ± 38 (Mean ± SD) days and were inspected monthly to replace batteries and memory cards and re-bait sites.
To gain understanding of whether activity rates of each species varied seasonally or across the two study areas, we calculated 30-min capture rates (CR30min) and 24-h capture rates (CR24h) for each species, divided by the number of traps nights at each station, multiplied by 100 camera-nights. We considered the total period elapsed between the camera setting date and the last record (usually camera retrieval date) as the effective sampling period (i.e., number of trap-nights). Photographs of the same species within a 30-min interval were considered as a single event, unless animals were clearly different individuals based on sex, scars, tail color patterns, or other permanent or transitory marks [7,9,54,56]. A 24-h capture rate is considered a low biased estimator of trap rates [57], and thus we also tallied photographic events on a 24-h time-frame. Due to the difficulty in determining small mammal species (e.g., rodents, marsupials, and insectivores) from camera-trap images, we pooled independent detections of these species into the category of small mammals. We calculated CR24h for each species or grouping and compared them between study sites and between seasons (fall–winter vs. spring–summer) using Student’s t-tests to determine whether study area or weather might influence capture rates.

2.3. Single-Species, Single-Season Models, and Co-Occurrence Modeling

We used single-season occupancy modeling in Program PRESENCE [58], incorporating covariates we thought would influence distribution and detection of pumas and culpeo foxes [59,60]. It should be noted that, due to the large home range size of our carnivores relative to camera spacing, we consider occupancy to be equivalent to site use [61]. We created detection histories for both carnivores using data from the 36 camera-stations within RCNR only, because the VV&LC site was surveyed two years before RCNR, with most of the sampling effort focused on the opposite climate season. To obtain fine-scale information on detection probabilities for the carnivores, each encounter occasion was represented by three days of sampling (~10 occasions per month), yielding a total of 42 sampling occasions over the 4-month survey (May–August 2015).
We used a small number of habitat and biotic variables—due to our small sample size once we removed VV&LC stations—we thought it to be most influential in this system and likely explain carnivores site use and detection probabilities [62]: habitat (forest, shrubland, or Andean steppe), elevation, distance to the main river (Cipreses river), distance to the border of the reserve, capture rates (both CR30min and CR24h) of prey (hares, rabbits, small mammals, and guanacos) and of the competing carnivore at each camera-site. We expected occupancy probability for both species to be negatively influenced by elevation because topography is extremely rugged at higher elevations and elevation has been regarded as an influential variable to carnivore spatial distribution elsewhere [63,64]. We also expected that detection would increase for both species closer to rivers because water can be scarce, and we expected carnivores to seek out water in areas they already occupied, as found elsewhere [65]. Since human disturbance (e.g., livestock grazing and tourism) increases near the edges of the reserve, we expected occupancy for pumas to increase farther away from the reserve boundary, which would limit contact with livestock ranches and tourism activities. In contrast, foxes might be more tolerant of disturbance due to their smaller size and may not be affected by distance to border, especially considering the reserve borders are somewhat “soft” containing a gradient marginal habitat. Additionally, foxes might take advantage of puma absence near the border and have higher hunting rates. In addition, we expected occupancy and detection of both species to be positively influenced by hare capture rate since hares occur in the diets of both carnivores, but that only rabbits and small mammals would positively influence fox occupancy and detection because these prey items occur in the fox diet but only have a marginal contribution to puma diet [38,39,40,66]. Finally, we did not expect puma occupancy or detection to be influenced by fox capture rate, but that fox occupancy and particularly detection could be negatively influenced by puma capture rate.
We tested variables for correlation (|rs| ≥ 0.7) and did not include correlated variables in the same model. We also standardized continuous variables to center them on zero so that the beta values were comparable [20,61]. Vegetation GIS-layers were obtained from Luebert and Pliscoff [35], and elevation data were obtained from Digital Elevation Models (DEMs) available online from the US Geological Survey (USGS) and the National Aeronautics and Space Agency (NASA) [67].
We first modeled detection while holding occupancy constant to find the best detection model, we then modeled occupancy while holding detection constant. We then combined our best detection and occupancy models to find the best model as determined by Akaike Information Criterion corrected for small sample size (AICc) with ΔAICc < 2.0 denoting competing models [68,69].
To further examine potential species interactions between pumas and foxes, we fit two species co-occurrence models using the psiBa parameterization [58,61,70] within program PRESENCE [58], which requires designating a dominant and subordinate species. Due to their larger size, we considered pumas as the dominant species (A) and the smaller culpeo foxes as subordinate (B). We estimated eight parameters: ΨP—probability that a site is occupied by puma, the dominant species, ΨFP—the probability that area is occupied by foxes (subordinate species) given pumas are present; ΨFp—the probability that area is occupied by foxes given pumas are not present; pP—probability of detecting pumas given foxes are not present; pF—probability of detecting foxes given pumas are not present; rP—probability of detecting pumas given both are present; rFP—probability of detecting foxes given both are present and pumas were detected; and rFp—probability of detecting foxes given both are present and pumas were not detected [61].
We tested eight types of different candidate models, representing different hypotheses regarding the dependence/independence of occupancy and detection parameters and between species (Table A1 in Appendix A).
We estimated the Species Interaction Factor ( Φ ) as follows:
Φ = ψ P ψ F P ψ P ( ψ P ψ F P + ( 1 ψ P ) ψ F p ) ,
which measures spatial interaction between two species [70] to determine if they use habitat independently (Φ equal to 1.0 or 95% CIs overlaps 1.0), if they co-occur more than expected by chance (Φ > 1.0 and 95% CIs do not overlap 1.0), or co-occur less than expected by chance (Φ < 1.0 and 95% CIs do not overlap 1.0) [71]. We used the ‘deltamethod’ [61,72] in program R [73] to calculate the SIF and its standard error from the occupancy estimates using the variance–covariance matrix from the top model [61].
We also used the derived Detection Interaction Factor (δ) to evaluate if detection probability for both species was independent (δ = 1.0 or 95% CIs overlap 1.0) or not (δ ≠ 1.0 and 95% CIs do not overlap 1.0) [74]:
δ = r P F r P · r F
To determine the relative importance of habitat features versus species interactions, we included the important habitat variables from the single season models for pumas and foxes in our co-occurrence models. We compared models with and without these predictor variables. If models with habitat or biotic covariates rose to the top while species interactions were deemed independent, then habitat or biotic factors are more important in influencing occupancy and detection. If species interactions without habitat rose to the top, then species interactions drive state variables. If both are included in the top model, then species interactions occur, but are mediated by habitat or biotic features.
We ranked models according to AICc denoting competing models as those with ΔAICc < 2.0 [68] and report top models and the constant model.

2.4. Temporal Activity Overlap Estimation

Because there is little quantitative information on timing of activity of predators and prey in central Chile, we used data from all 50 camera stations to assess strength of selection for a certain diel period. We classified all 30 min independent events into four periods of the diel cycle: dawn—from 1 h before sunrise to 1 h after sunrise; day—from 1 h after sunrise to 1 h before sunset; dusk—from 1 h before sunset to 1 h after sunset; and night—from 1 h after sunset and 1 h before sunrise [9]. Species that chose dawn and dusk were considered crepuscular, those that chose daylight hours were diurnal, nighttime hours were nocturnal, and those that occurred evenly throughout the day and night were consider cathemeral. Each event was classified considering the sunrise and sunset times on the study area for each record’s date. Only species with 10 or more independent events were considered for the activity pattern diel period selectivity analysis. We calculated a ‘density of detections’ [9] by dividing the total number of independent detections in each diel period by the duration of that period per 100 camera nights. Species preference/strength of selection for each diel period was assessed using a modified Ivlev’s selectivity index [75] proposed by Jacobs [76]; hereafter, JSI, broadly used in ecological studies to evaluate selection over many types of resources (e.g., [6,77]). JSI is formulated as follows [76]:
D = u a u + a 2 u a
where:
D is the Jacob’s Selectivity Index (JSI),
u indicates the used proportion of the resource, and
a indicates the available proportion of the resource.
A 5000-replicates bootstrap resampling was performed and JSI was calculated for each bootstrap sample to determine the mean JSI and 95% confidence intervals [78]. We considered that each diel period was positively or negatively selected when the 95% CI was positive or negative, respectively, and did not overlap zero. JSI formula was coded in R software [73], and bootstrap resamples were run using boot package [79] in R [73]. This analysis was conducted by pooling all records for each species and each species was considered as diurnal (JSIday ≥ 0.8), strictly nocturnal (JSInight ≥ 0.8), or facultative nocturnal (0.4 ≥ JSInight > 0.8) [9], crepuscular (JSIdusk ≥ 0.8; JSIdawn ≥ 0.8). We expect both pumas, foxes, and their main prey (lagomorphs and small mammals) to show nocturnal activity, but lagomorphs could exhibit a diurnal to near-cathemeral activity pattern, as it has been reported by previous studies [8,18].
Each species’ independent events are considered a random sample of the underlying continuous temporal distribution describing the probability of detecting that species within a particular interval of the day [4,80]. We used a chi-square to evaluate whether the observed differences at RCNR and VV&LC were explained by differences in sampling effort under random conditions, or not (α = 0.05). We also used a two-way, circular ANOVA [81,82] to assess significant differences (α = 0.05) in each species’ activity patterns between seasons (spring–summer vs. fall–winter) or areas (RCNR vs. VV&LC). This analysis was performed using CircStats Toolbox [83] for MATLAB Release 2016a (The MathWorks, Inc., Natick, MA, USA).
We also estimated overlap in temporal activity patterns between pairs of species non-parametrically using Kernel Density Estimates (KDE) [80], only when ≥10 independent records per species were obtained [84]. We estimated the coefficient of overlap (Δ) between species pairs using the Δ1 estimator when the smallest sample was under 50 detections, and Δ4 estimator otherwise [4,80,84]. Δ ranges between 0 (no temporal overlap) to 1 (full overlap). We conducted a 10,000 sample smoothed bootstrap to generate confidence intervals for Δ [85]. Activity pattern analysis and estimation of coefficients of overlap were performed using Overlap package [85] for R Software [73].

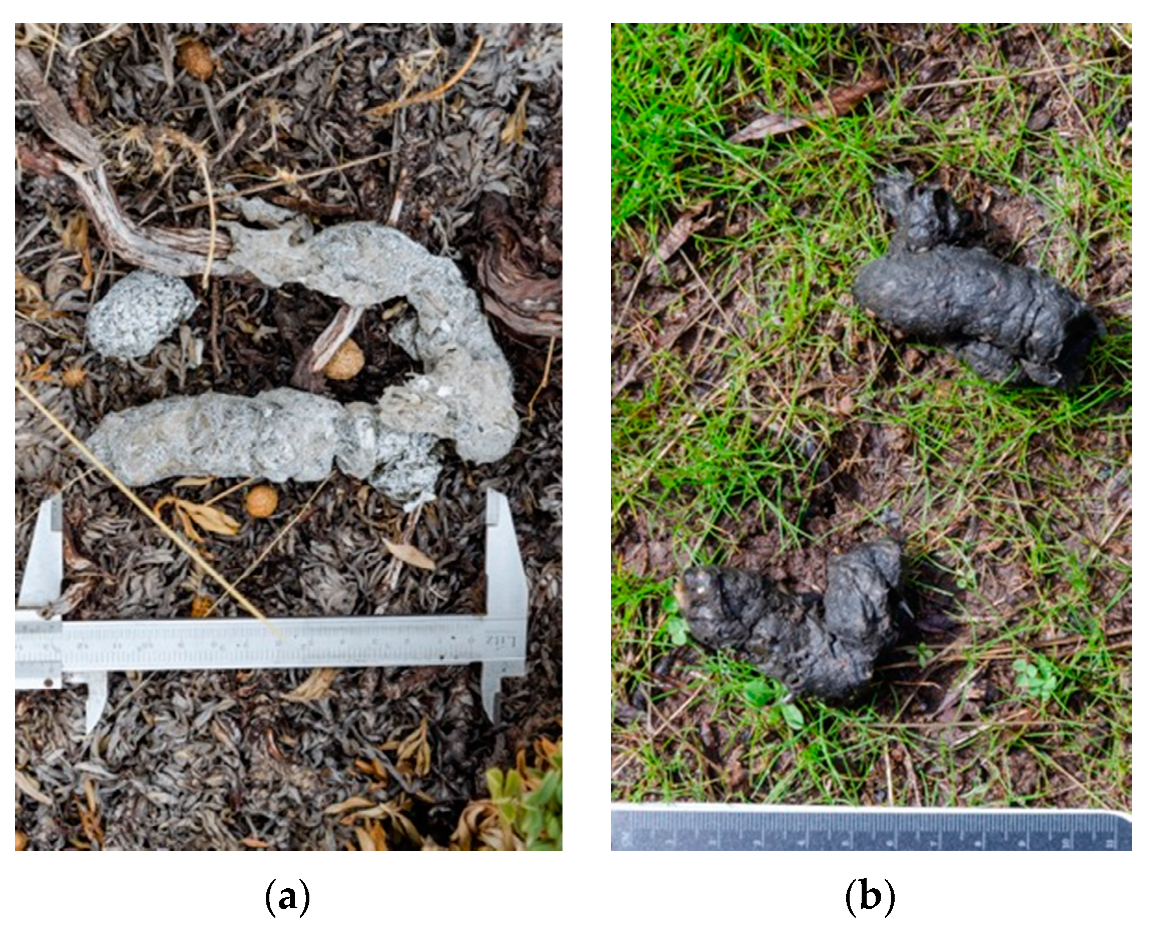
2.5. Scat Collection and Diet Analysis

Carnivore scats were collected between 2012 and 2015 along 3-km long transects (n = 8 to 10) per year in areas where carnivores are likely to transit. Scats found during the fieldwork outside those transects were also collected. Scat host species was identified based on size and shape, which is reliable at this study site given that wild carnivores’ body sizes do not overlap and their scats have different morphology (Figure A1 in Appendix A). Additionally, only felid scats large enough to be positively identified as pumas were collected.
We dried and de-wormed scats on a stove at 70 °C for 3 h and re-hydrated them in soapy water for at least 24 h [66]. We then washed scats and strained them on a fine mesh (1 mm) strainer and dried them again on stove for 5–10 h [66]. Hairs present in scats were analyzed under a microscope to describe the medulla-cortex and scale patterns [86] to identify prey species consumed by carnivores. Teeth in scats were identified using keys available in literature [39,87]. We excluded scats with unidentifiable remains from analysis and we pooled rodents and insectivores into a single category as small mammals. Given that most lagomorph remains in puma scats could not be identified at the species level, we pooled all the lagomorphs (i.e., rabbits and hares) into a single category.
We calculated frequency of occurrence (FO) as the number of scats positive for a prey item divided by all scats collected (with identifiable prey) and the relative percent occurrence (RPO) as the percentage of a specific prey item relative to all prey items found in scats (because there could be more than one prey item per scat) [66]. Given pumas consume large prey, we also calculated relative prey biomass (RBM) as the percentage of the consumed biomass of each prey item corrected for the total biomass consumed by the puma [66]:
B M i = { F O i ( 1.98 + 0.35 X i )   for   prey   species   with   bodyweight   >   2   kg F O i X i   for   prey   species   with   bodyweight     2   kg ,
R B M i = B M i i = 1 n B M i ,
where BMi is the consumed biomass of the i prey species; FOi is the frequency of occurrence of the i prey species; Xi is the average body mass of the i prey species, extracted from bibliographical data; n indicates the total number of prey items (i = 1, 2, 3, ..., n). We calculated RBM only for pumas because the correction factor to derive RBM from RPO is not available for foxes and, given that foxes do not consume large prey, this biomass correction is not needed [66].
To assess which species had a more generalist or specific diet, we calculated the trophic niche breadth for each carnivore, using a version of the Gladfelter–Johnson’s index [88], modified to measure trophic niche breadth based on frequency occurrence, which ranges from 0 to 1, is more sensitive to resource use patterns, and is suitable to measure trophic niche breadth in a guild context [89]:
B = i = 1 n F O i σ 100   R
where:
B′ is the modified Gladfelter–Johnson’s index;
FOi is the frequency of occurrence of the i prey species;
σ is the standard deviation of occurrence frequencies; and
R is the number of prey-species consumed by the carnivore guild.
We also calculated the Pianka’s dietary niche overlap index [90] as a measure of trophic niche overlap between pumas and culpeo foxes Equation (7), given its frequent use in diet studies (e.g., [30,31,91,92]):
α = i = 1 n p i , j p i , k i = 1 n p i , j 2 + i = 1 n p i , k 2
where α is the Pianka’s dietary niche overlap index between species j and species k; pi,j is the proportion of the prey item i in species j diet; pi,k is the proportion of the prey item i in species k diet; n indicates the total number of prey items (i = 1, 2, 3, ..., n).

3. Results

3.1. Camera-Trap Records and Trap Rates

The total sampling effort for both study areas was 9100 camera nights from 50 camera-stations, 7106 from 36 camera-stations at RCNR, and 1994 from 14 camera-stations at VV&LC. We obtained a total of 5953 capture events of all species combined. Carnivores were captured in 3070 photos. The most frequent carnivore captured was the culpeo fox (Figure 2), almost eight times more frequent than the puma, whereas the least frequent carnivore was the pampas cat, detected only four times and only inside the RCNR. Given the small sample size for pampas cats, this species was excluded from statistical analysis (a minimum of 10 independent records is required to conduct temporal activity overlap estimation). No species exhibited statistically significant seasonal differences in VV&LC, but in RCNR, culpeo foxes, and small mammals had significantly lower capture rates in spring summer than in winter-fall (p > 0.01). Lagomorphs were most frequently captured with hares exhibiting similar 24-h capture rates (CR24h) in RNRC and VV&LC (CR24h,RCNR = 4.62, SE = 1.24, CR24h,VV&LC = 4.42, SE = 1.78), while rabbits were more frequently captured in VV&LC (CR24h,RCNR = 2.66, SE = 1.33; CR24h,VV&LC = 6.85, SE = 3.30). Small mammals had similar photographic capture rates in both study sites, and were nearly absent in the spring–summer. Guanacos were the least frequently captured species and were only found in RCRN (CR24h,RCNR = 2.18; SE = 0.81). The southern mountain viscacha, hog-nosed skunk (Conepatus chinga), and lesser grison (Galictis cuja) were not recorded during the camera-trap surveys.

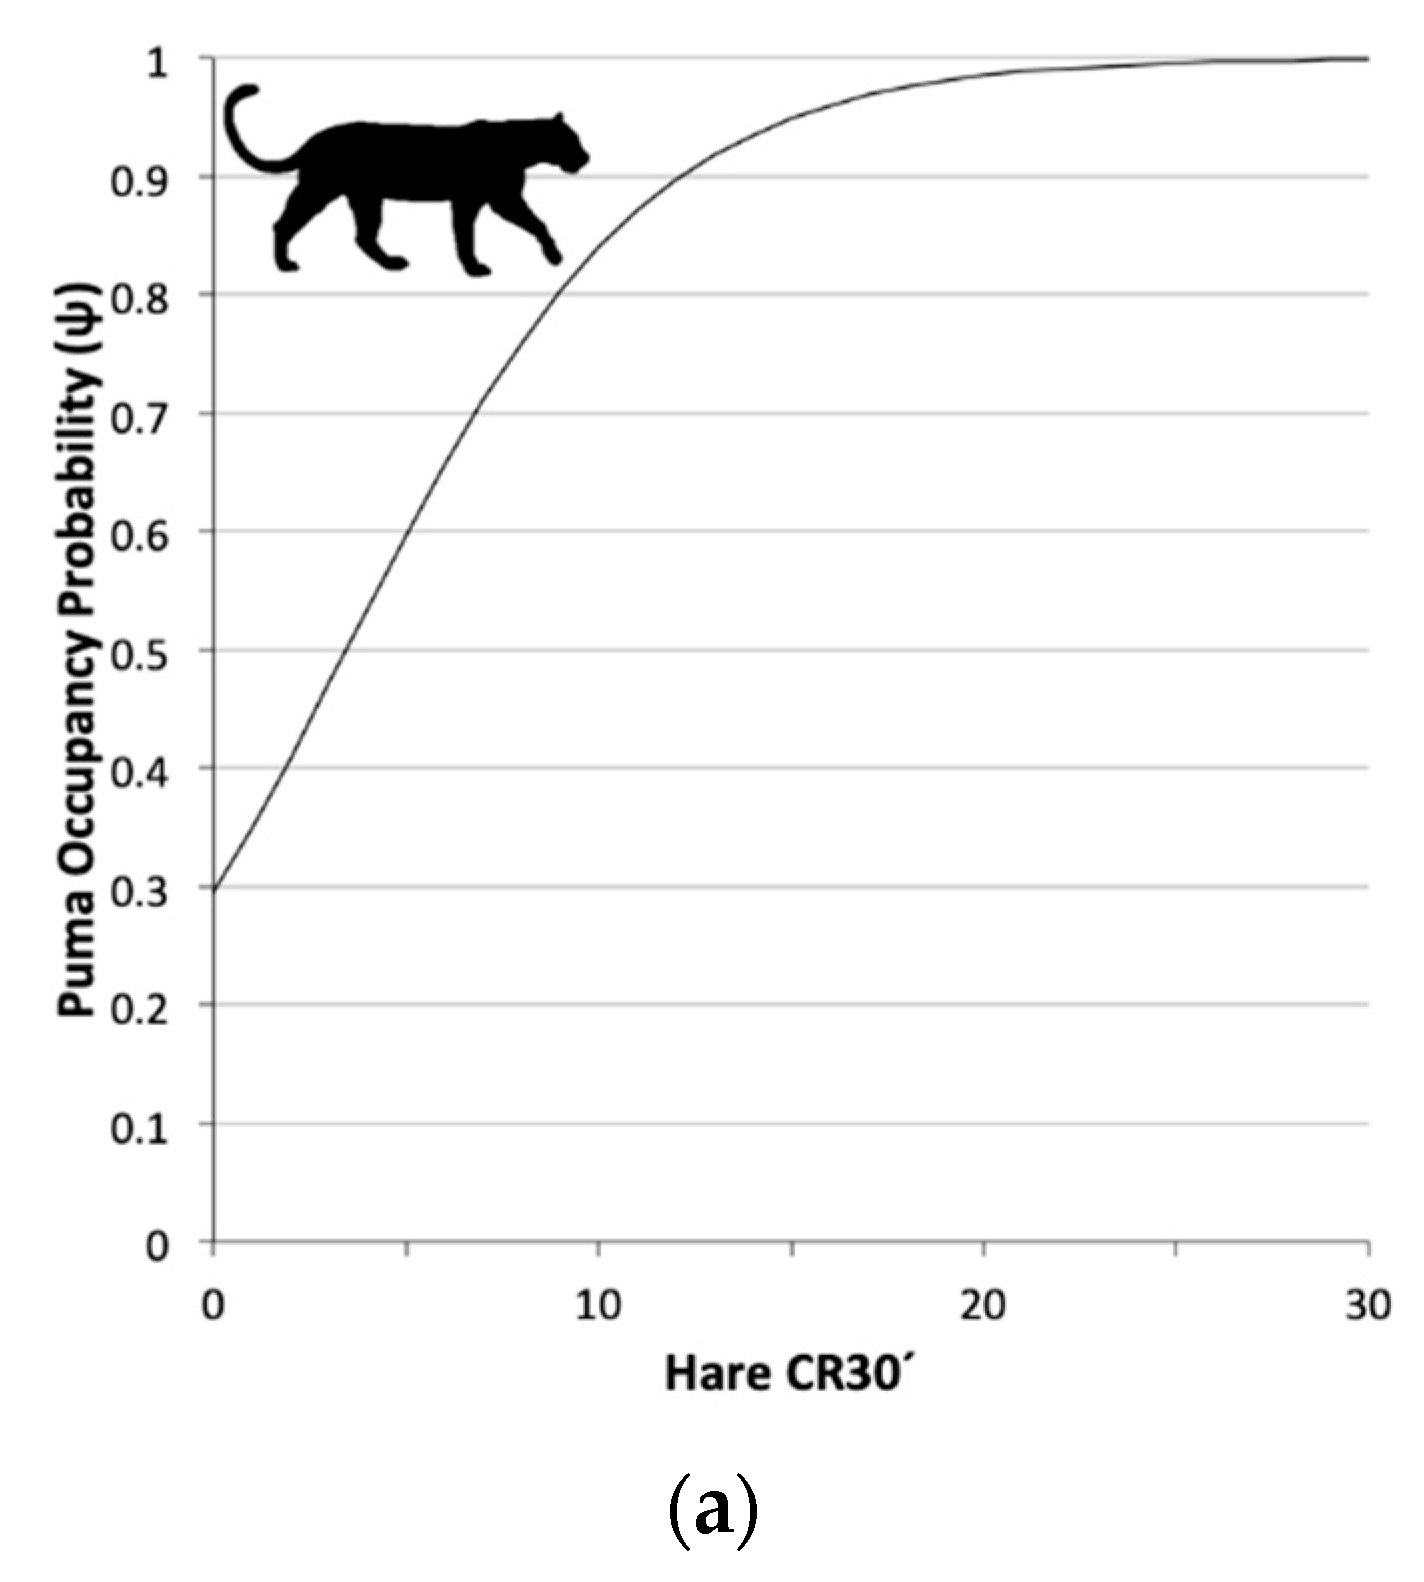
3.2. Single Season Occupancy Models

Only two pairs of covariates were correlated: distance to the reserve border with elevation (rs = 0.73), and 24-h puma capture rates with 24-h hare capture rates (rs = 0.74). Therefore, we did not combine these correlated variables in the same model.
Pumas were recorded at 16 out of 36 sites (i.e., 44.0% naïve occupancy), and estimated occupancy (i.e., site use) from the top-ranked, single season model was 0.51 (SE = 0.12). The top model (with no competing models) suggests that puma site use strongly increases with hare activity (based on CR24h); however, the 95% CIs on the beta estimate overlapped zero suggesting high variability across the landscape (Table 1 and Table 2, Figure 3). Puma detection also increases with hare activity (based on CR24h), and this effect was supported (95% CIs did not overlap zero) but was fairly weak. Puma detection increased with proximity to the river (m), and this effect was supported and strong, particularly at high hare capture rates (Table 1, Figure 3).
Culpeo foxes were recorded at 33 out of 36 sites (91.6% naïve occupancy) and the two top competing models estimated occupancy, Ψ (95% CI), as constant at 0.920 (0.770–0.975) indicating foxes are ubiquitous across the landscape. The top model indicated strong support for a decrease in fox detection probability with increasing elevation, and the competing model, which also included elevation, indicated that fox detection decreased with increasing puma detection, but this effect was weak and not supported (Table 2, Figure 3).

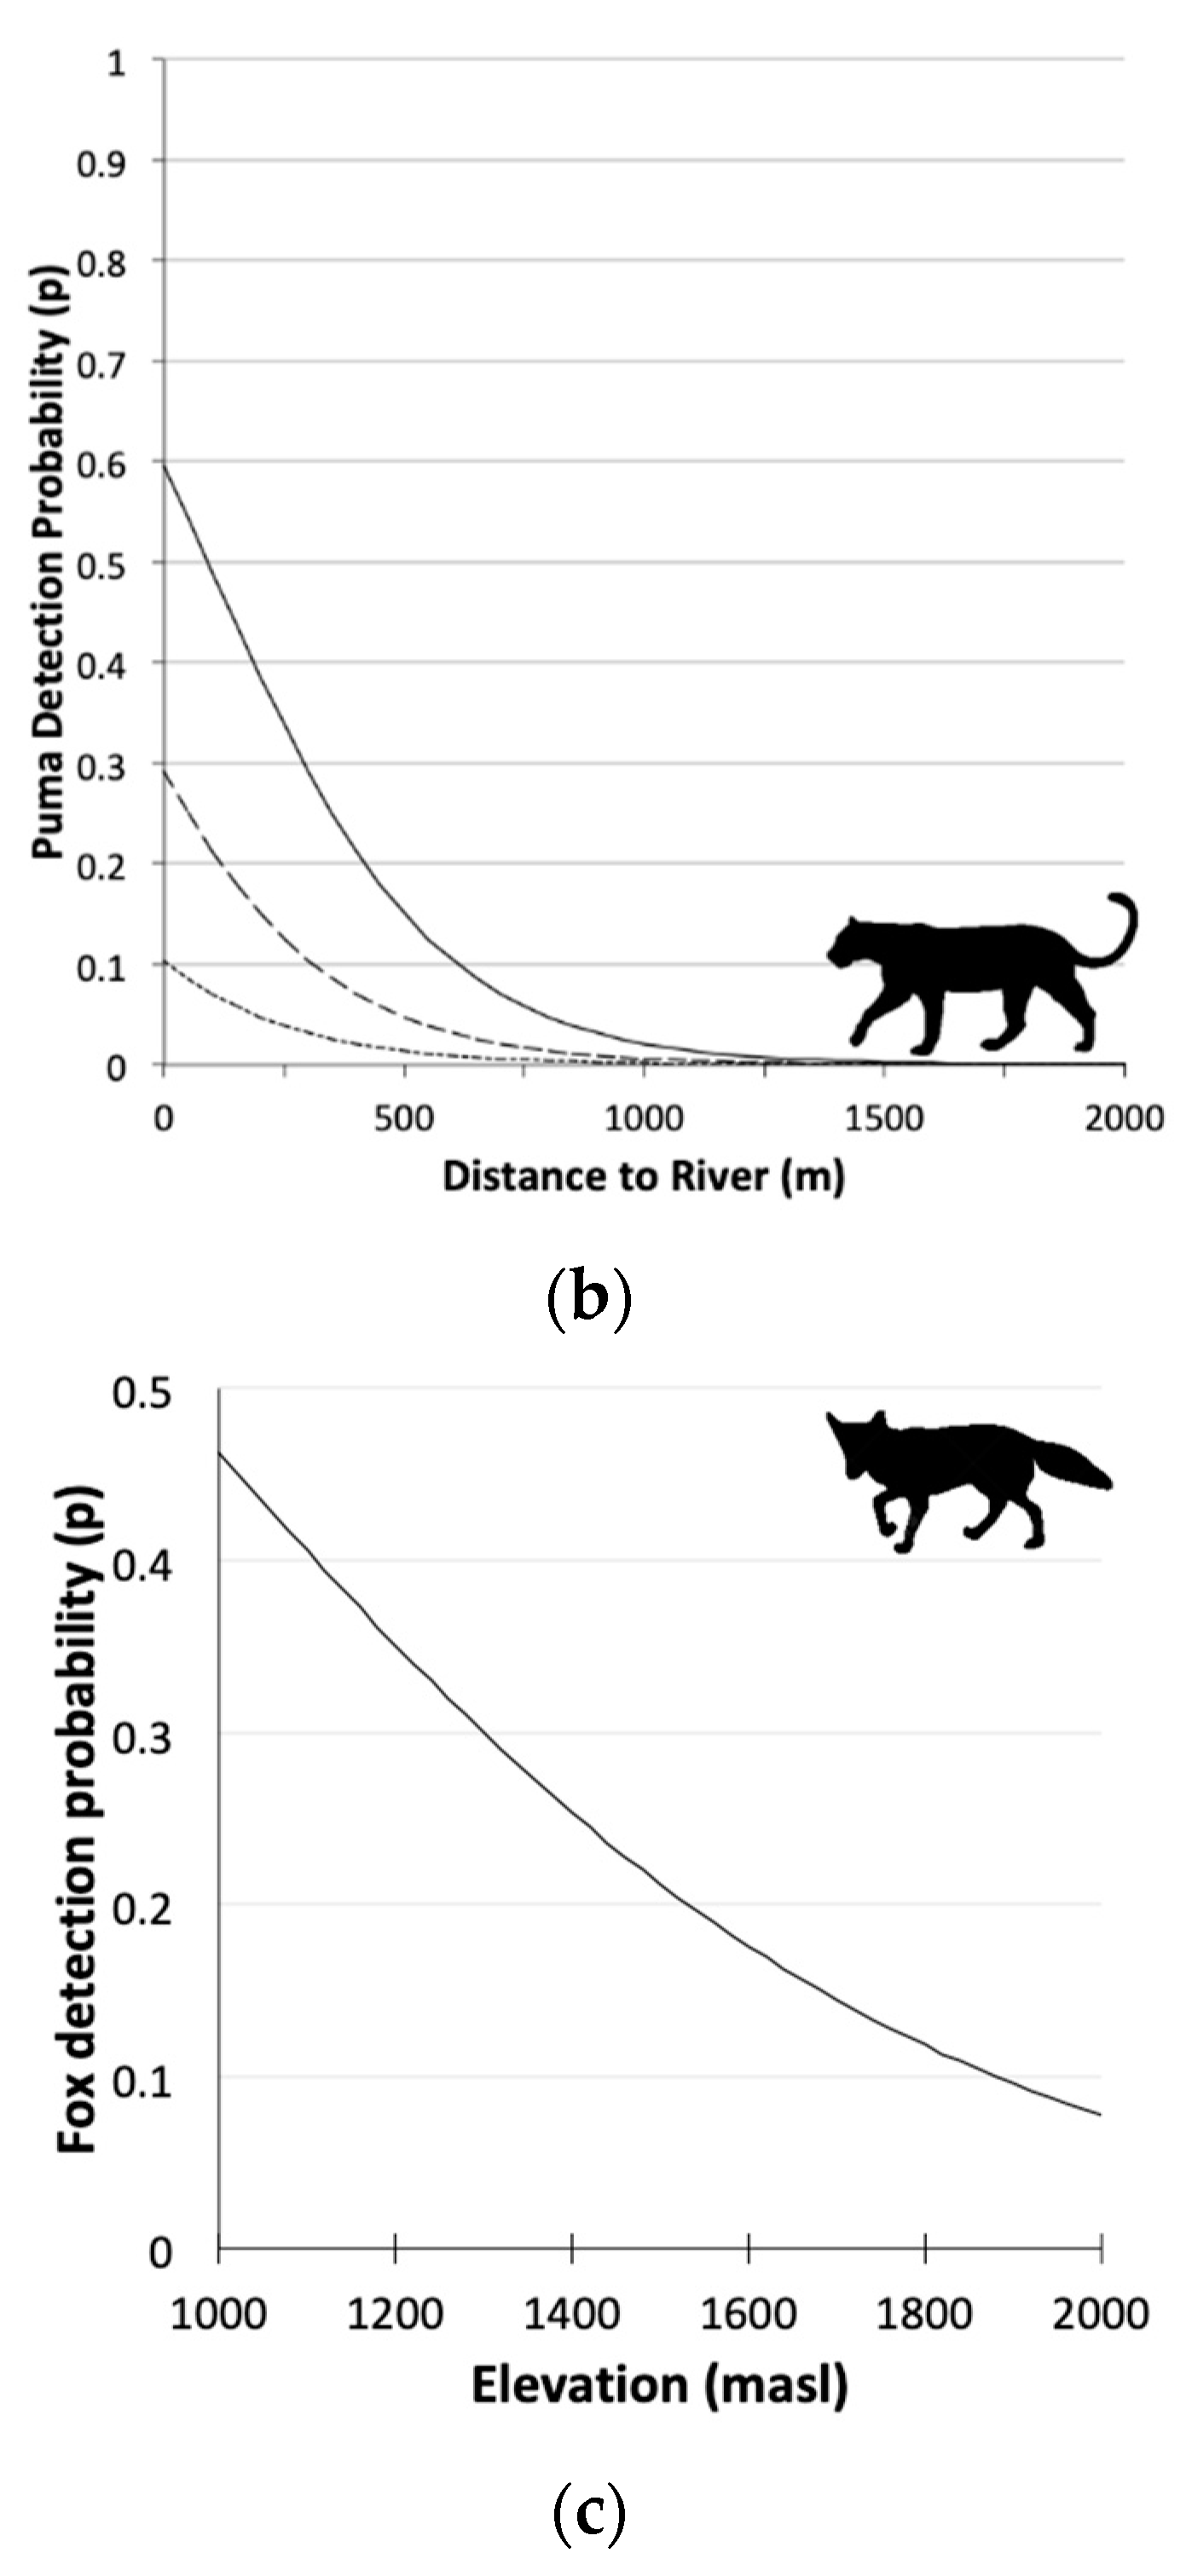
3.3. Two-Species Co-Occurrence Models

All but three out of the 44 candidate, 2-species co-occurrence models reached successful numerical convergence. There was only one top-ranked model with no competing models (Table 3). As with the single season models, puma site use probability increased with hare activity, whereas fox site use probability was constant.
Fox occupancy was the same whether with pumas present or not (ΨFP(.) = ΨFp(.), Table 3), since foxes used almost every site. The Species Interaction Factor (Φ (SE)) was 1.0 (0.0) indicating independent site use by the two species. Interestingly, puma detection probabilities were greater when foxes were present (rP > pP), and increased as the hare CR24h increased (Figure 4a). Contrary to our predictions, fox detection probability was higher when pumas were present and detected at the sites (rFP > rFp > pF), and was higher at lower elevations (Figure 4b). The Detection Interaction Factor δ (95% CI) was 1.55 (1.06–2.05) indicating strong support for co-detection between the two species.

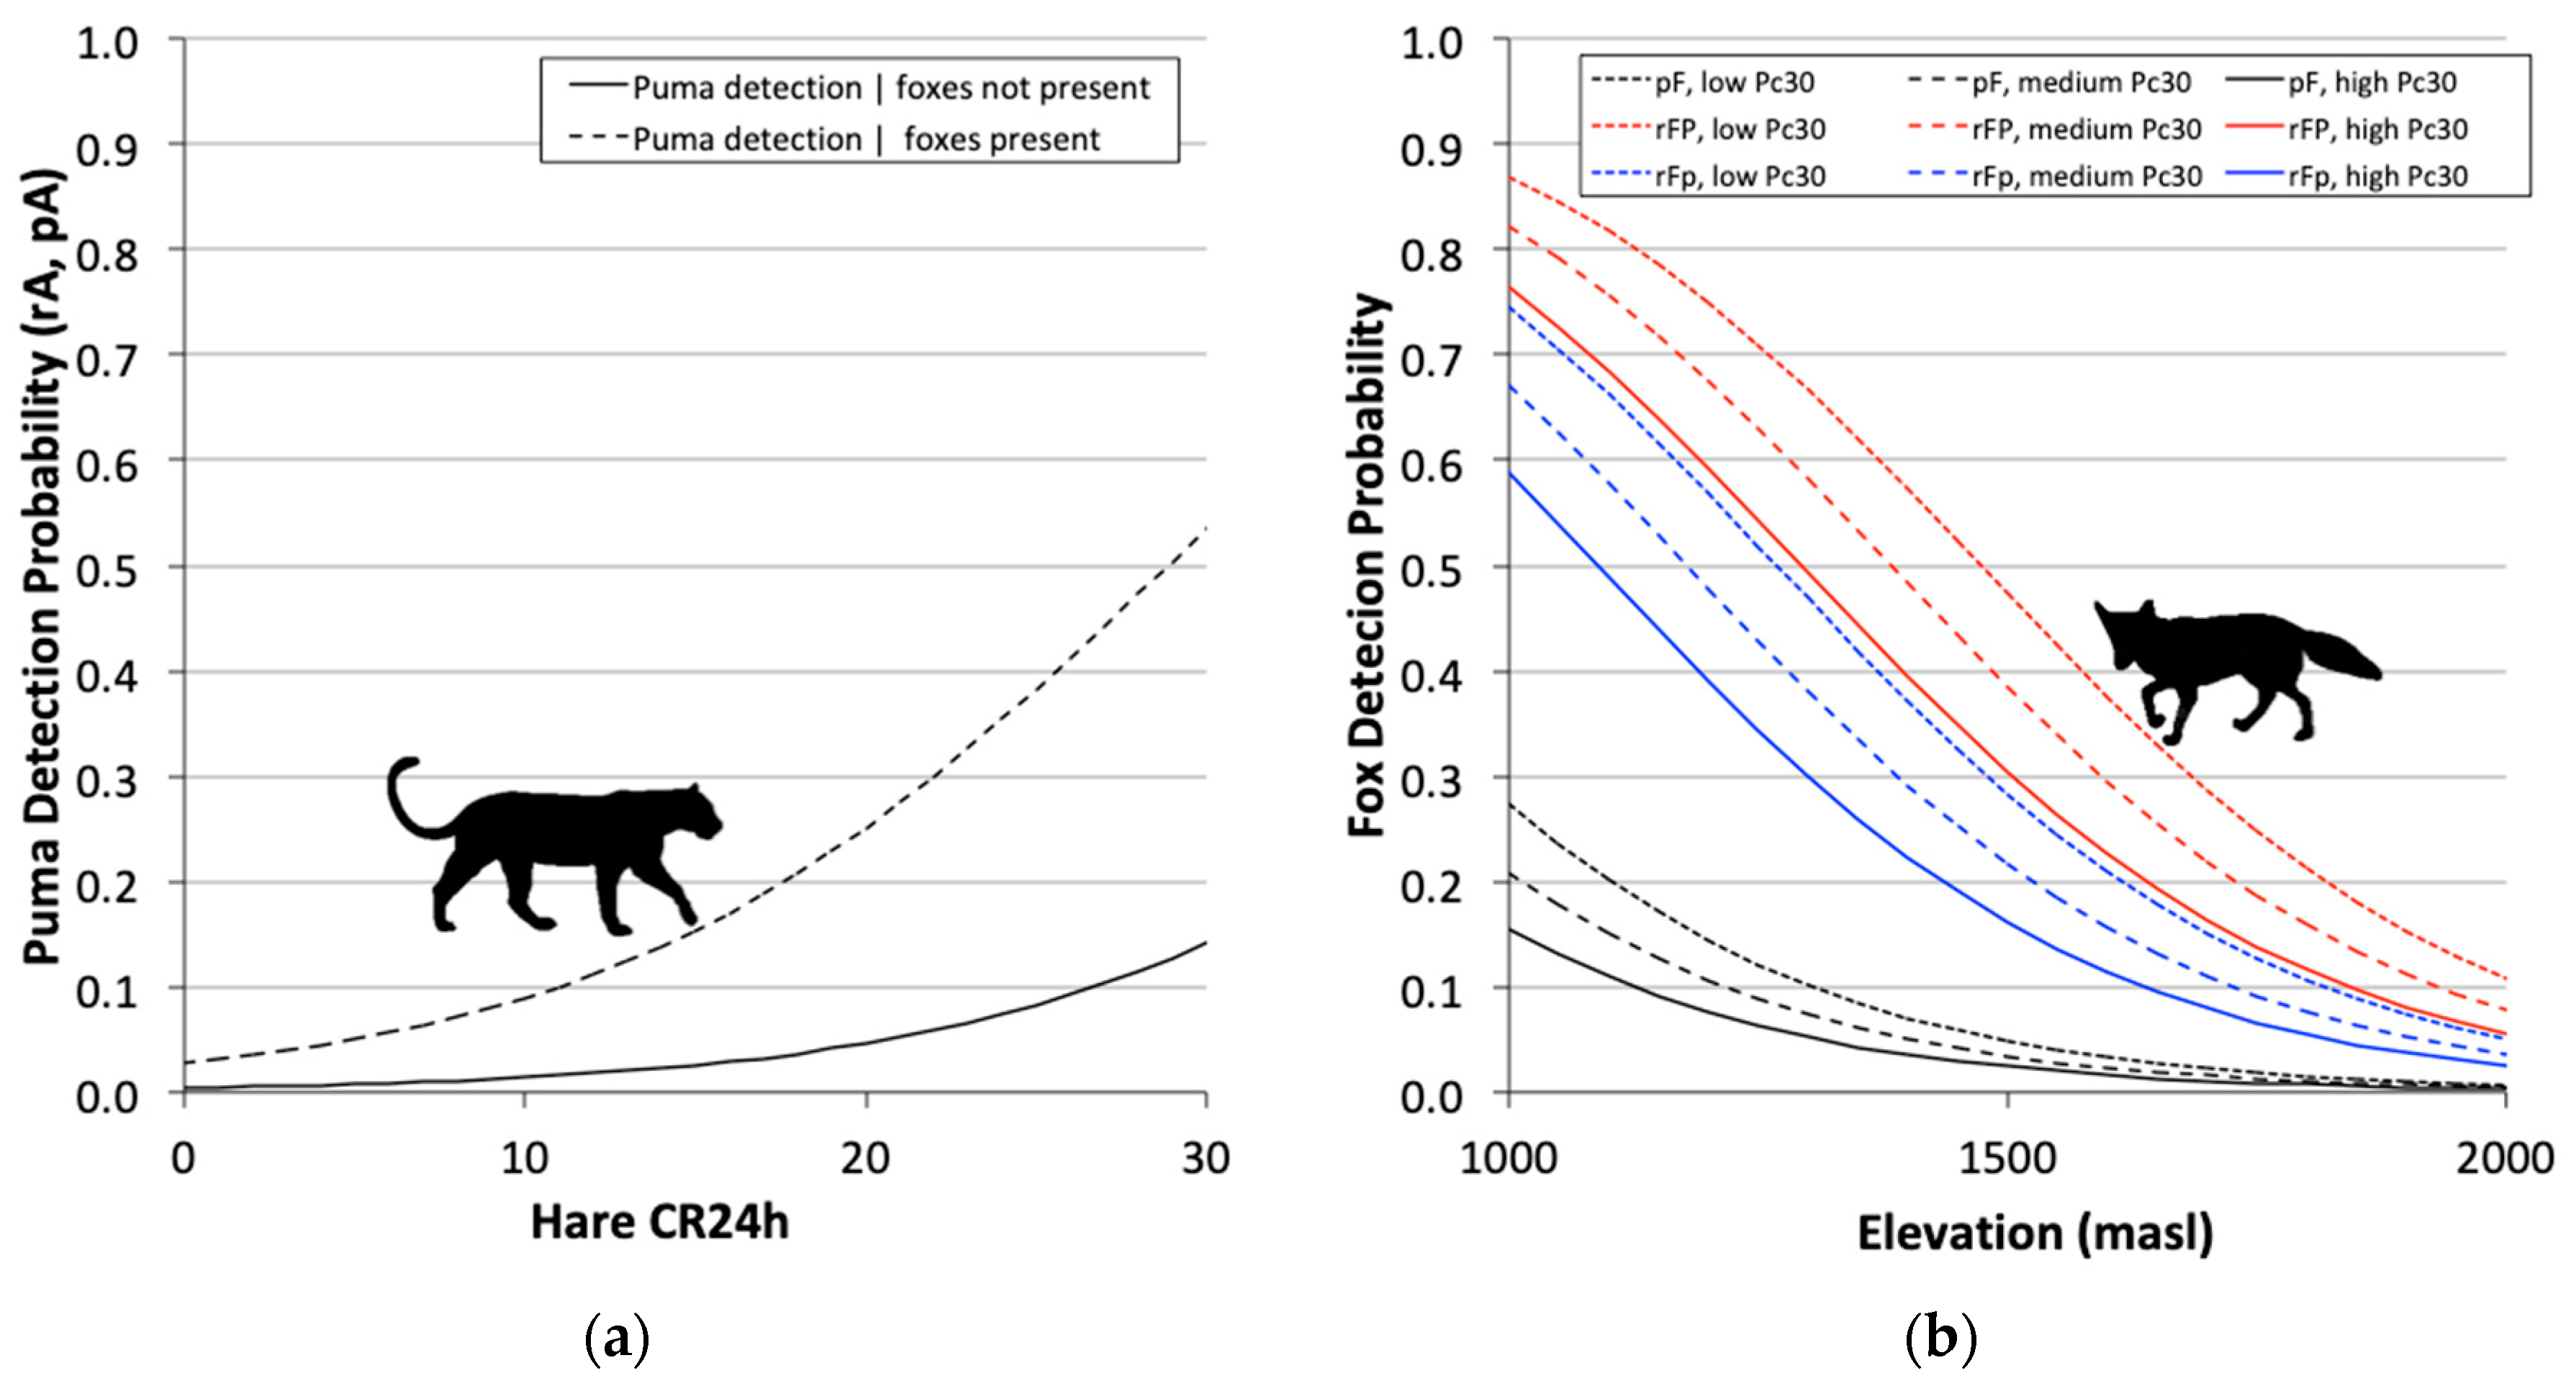
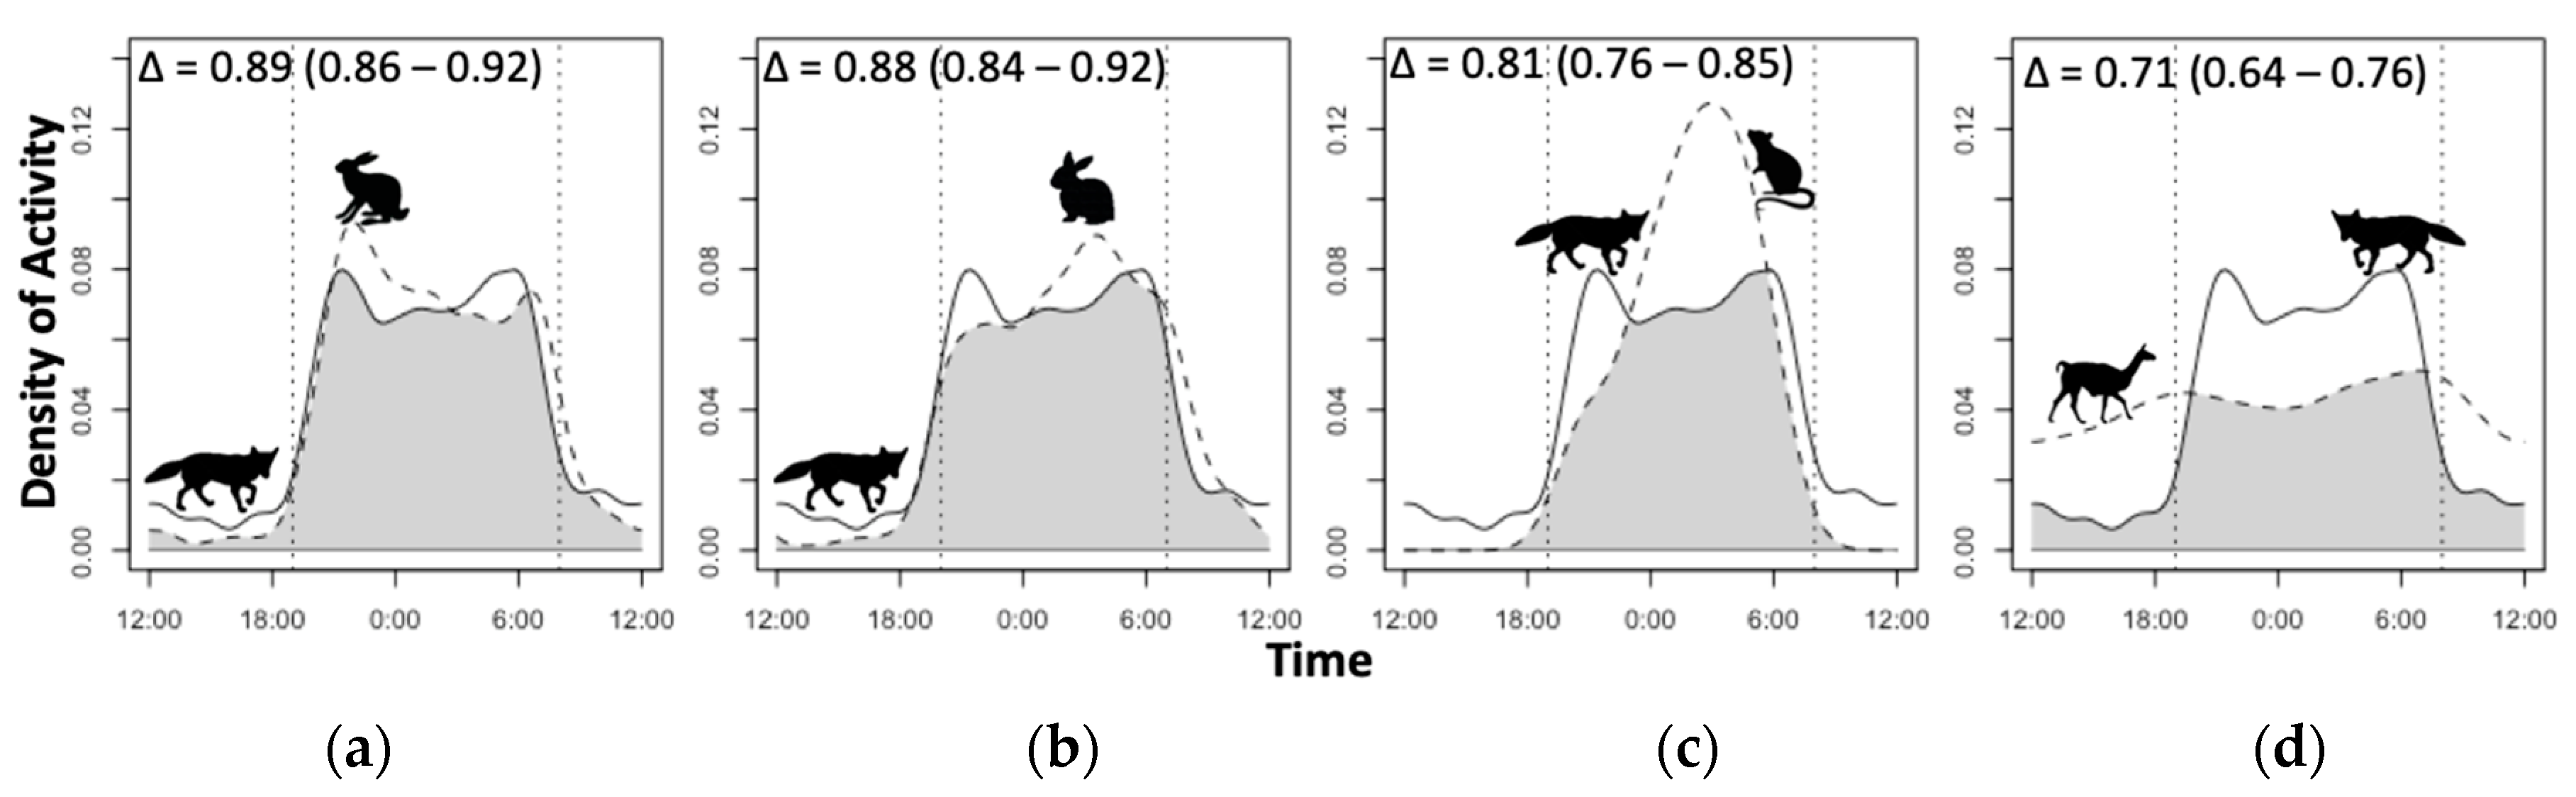
3.4. Diel Selectivity and Activity Pattern Overlap
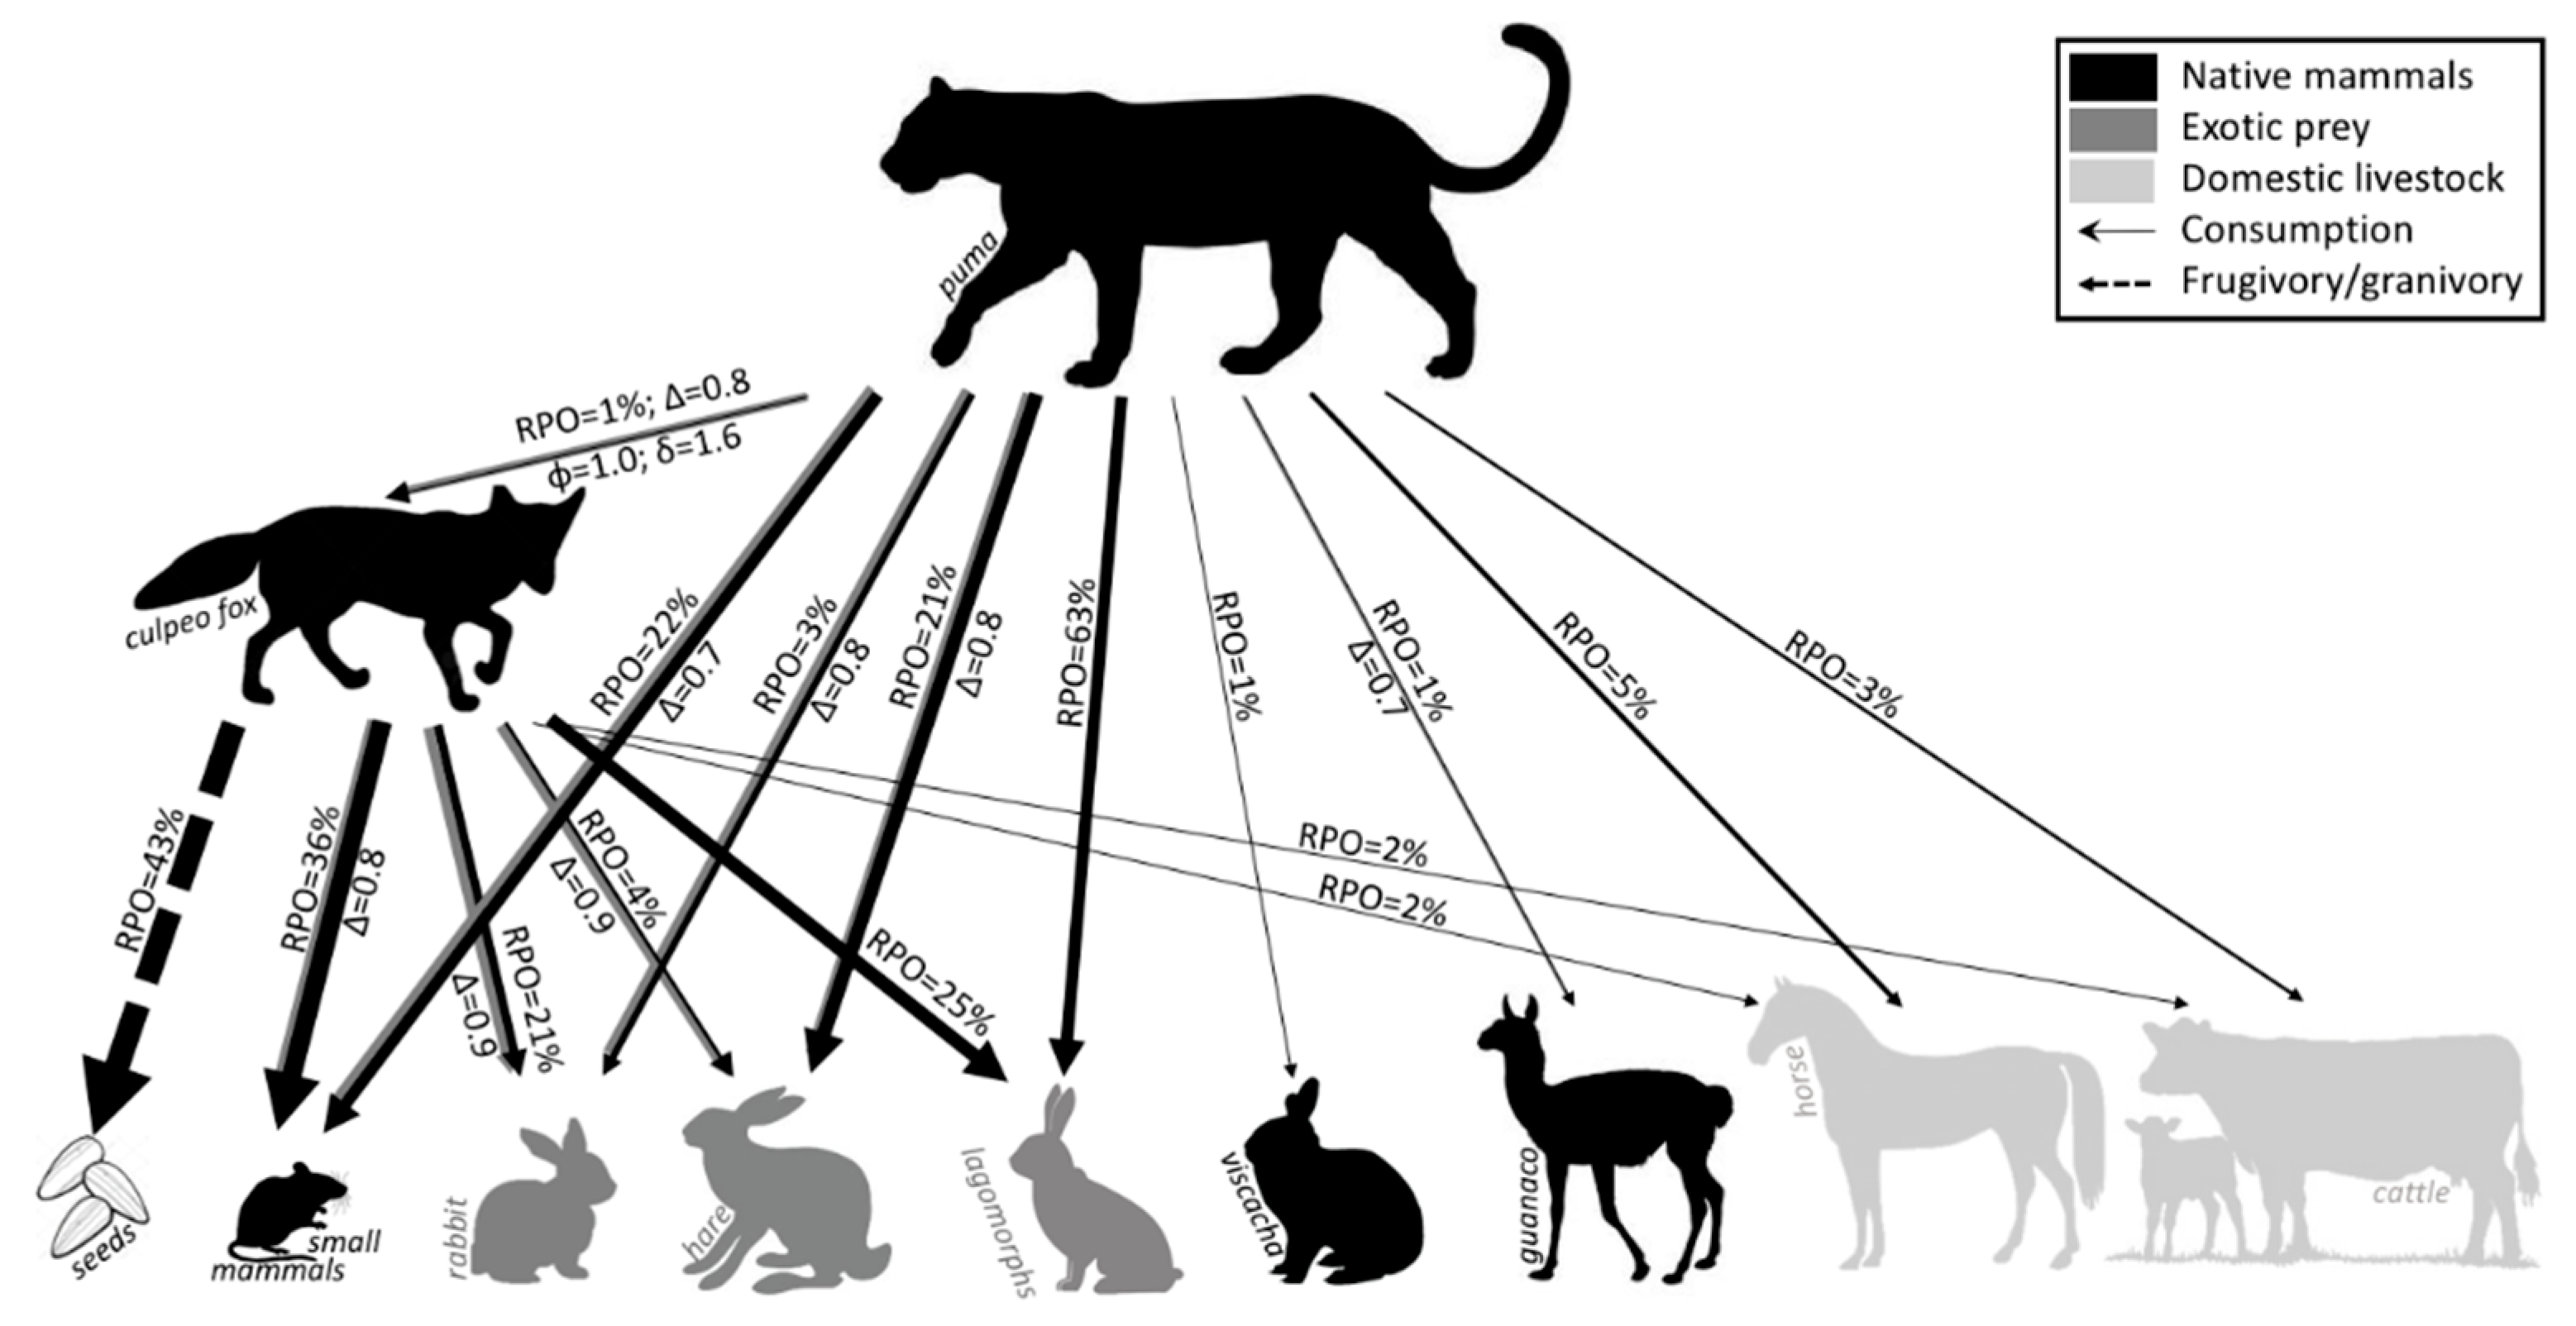
We found that only pumas (F = 10.20, p = 0.002) and guanacos (F = 19.83, p = 1.6 × 10⁻⁵) showed significantly higher activity during spring–summer than in fall–winter. Therefore, we plotted overlap separately for each season. No species showed significant differences in temporal activity patterns between RCNR and VV&LC, thus we combined sites.
The Jacob’s Selectivity Index indicated that pumas, foxes, hares, and rabbits are facultatively nocturnal (0.4 ≥ JSInight > 0.8), whereas small mammals are strictly nocturnal (JSInight = 0.99), guanacos are near diurnal (JSIday = 0.77), and hares also show some selection for crepuscular time periods (Table 4).
The highest activity pattern overlap for pumas occurred with culpeo foxes (Δ = 0.84) in fall–winter (Figure 5a). Pumas showed a peak in activity around midnight in the fall–winter, but shifted to more activity after midnight in the spring–summer, leading to slightly lower overlap with foxes (Δ = 0.81) in that season, while foxes exhibited nocturnal activity peaks at ~10:00 p.m. and ~6:00 a.m. in both seasons (Figure 5a).
Hare activity in fall–winter occurred mostly from ~8:00 p.m. to 6:00 a.m., but, interestingly, in spring–summer hares had crepuscular peaks just after sunset and before sunrise (Figure 5b). This led to higher overlap with pumas, particularly in the spring–summer (Δ = 0.82) when pumas displayed the largest peak in activity just before sunrise, matching the pre-dawn crepuscular peak in hare activity (Figure 5b). Rabbit activity in fall–winter had a single peak at ~4:00 a.m. and in spring–summer exhibited multiple peaks at ~8:00 a.m., ~2:00 a.m. and just before 6:00 a.m., and had similar overlap with pumas in both seasons (Δ = 0.81, Figure 5c). Small mammals displayed the highest peaks in nocturnal activity just past midnight in fall–winter and at ~3:00 a.m. in spring–summer, with low relative overlap with puma activity with Δ = 0.71 and Δ = 0.64 in those seasons, respectively (Figure 5d). Guanacos exhibited more density of activity during night-time in the fall–winter, which led to higher overlap with pumas (Δ = 0.82) compared to the spring–summer when they had peaks of activity in morning and late afternoon resulting in lower overlap with pumas (Δ = 0.54).
We did not find seasonal differences for foxes—or any of their prey species—activity patterns; thus, we combined seasons in the overlap analysis for foxes and prey. The culpeo fox had an activity pattern highly synchronized with both hares (Δ = 0.89) and rabbits (Δ = 0.88) year-round and had higher synchrony with small mammals (Δ = 0.81) than pumas (Figure 6). Foxes also showed lowest temporal overlap with guanacos (Δ = 0.71), but we note that foxes are not known to prey on guanacos.

3.5. Diet Analysis

We found that exotic European lagomorphs made up the majority of the diet for pumas at 76% frequency occurrence (FO), 63% relative percent occurrence (RPO), and 70% by biomass (RBM), with the majority of these items being hares (Table 5). Small mammals made up the next most frequent diet item for pumas, but their biomass contribution was small (2% RBM). Although we never photographed viscachas in the study area, we did find evidence of this diet item in two puma scats. We only found ungulates occasionally in the puma diet, but they made up the second largest diet item by biomass (26%), and this was mostly driven by horse remains found in scats (5% RPO; 15% RBM) and cattle (3% RPO; 8% RBM). Other puma diet items included one culpeo fox, four birds, one reptile, but no seeds (Table 5).
For foxes, the main prey item was small mammals at 75% FO, but the relative percent occurrence was lower at 36% (Table 5). Lagomorphs were the next largest animal prey species accounting for 25% FO and 12% RPO, of which nearly all were rabbits as opposed to hares. We did not find viscachas or guanacos, but did find a 2% RPO each for horses and cattle within fox scats. We found one scat with a hog nosed skunk, four with birds, but no reptiles in fox scats. Unlike pumas, fox scats contained seeds which made up the highest frequency of occurrence (88% FO) and the highest relative frequency of occurrence (43% RPO) of all diet items.
From the samples in which lagomorphs were determined to the species level (all the 48 culpeo fox scats analyzed, and 32 puma scats), lagomorphs consumed by pumas were mainly hares (RPOHare = 20.5%, RPORabbit = 2.6%), whereas lagomorphs consumed by foxes were mainly rabbits (RPOHare = 4%, RPORabbit = 21%).

3.6. Carnivores Trophic Niche Breadth and Overlap

The Gladfelter–Johnson’s index of trophic niche breadth was smaller for pumas (B′Puma = 0.06) than for foxes (B′Fox = 0.07), indicating that foxes consume a slightly broader variety of prey items.
The Pianka’s dietary niche overlap index between the puma and culpeo fox was 0.30, a low to moderate value—considering both carnivores are opportunistic predators, which indicates low trophic overlap between the species.
Finally, we plotted the central Chilean food web across the three trophic niches (species interaction factor and detection interaction factor, temporal overlap Δ, and diet RPO) to visualize the strength of interactions and to assess factors leading to co-occurrence between pumas and foxes (Figure 7).

4. Discussion

4.1. Camera-Trap Records and Trap Rates

To our knowledge, this is the first study to describe and characterize the predator–prey community in the Central Chilean Biodiversity hotspot. We provide new information on the distribution of native and exotic prey in a protected area and an area with livestock ranching, across two seasons. We evaluate factors driving carnivores coexistence by investigating three niche dimensions (space, time, and diet) simultaneously for the main carnivores, pumas and culpeo foxes. Surprisingly, we found few differences in the photographic trapping rates between the protected area (RCNR) and area with livestock grazing (VV&LC) with two notable exceptions. We captured no guanacos in VV&LC, which points to the importance of protected areas for this species, and we captured significantly fewer foxes in RNRC than VV&LC in the spring–summer season only. However, this lower fox capture rate seems to be driven by a seasonal difference within the protected area, since the winter trapping rate was similarly high across the two sites. This may be an artifact of our sampling regime because we could only effectively put cameras in valley bottoms due to steep and rugged terrain. Foxes were potentially limited to these valley bottoms due to high snow in winter thus increasing trapping rates, whereas, once snow melts, they could potentially expand and move up to higher elevations where other vegetation types occur and prey gather in spring–summer [33]. The VV&LC site has a similar elevation level throughout and we found similar fox trapping rates year-round. Alternatively, foxes might be deterred in the summer by high human use of the area for summer recreation. Small mammals also had a significantly lower trapping rate in RCNR in summer, which also could be related to the higher human use. Although pets are not allowed in the reserve, some visitors bypass regulations and domestic dogs, either as pets, rancher’s working dogs, or free-ranging dogs (Muñoz and Osorio, personal observation), are present in the valley bottom during the spring–summer.

4.2. Space Use, Detection, and Overlap

Overall, we found little evidence of segregation between foxes and pumas along the spatial niche axis. In fact, evidence pointed more towards facilitation and co-detection. Foxes were recorded at nearly every camera station in RCNR in 2015, and thus it was no surprise that fox occupancy (i.e., site use) was estimated as high (0.92) and constant across the study site. Puma occupancy was lower (0.51) and increased with hare capture rate, although this effect was highly variable across the landscape with CIs overlapping 0. Thus, we found little evidence of habitat segregation between the species. However, detection rate for pumas increased with proximity to the main river, especially in areas with high hare activity, while fox detection strongly declined with elevation, indicating higher activity rates at lower elevation, as has been reported for culpeo foxes in other studies elsewhere in Chile [93] and Colombia [94].
Our two-species, co-occurrence models indicated independent occurrence across the study site with foxes having the same occupancy at sites with or without pumas present. Detection, however, revealed interesting insights that were contrary to our predictions. The detection interaction factor was strongly positive, indicating a predator was more likely to have higher detection rates at stations with the opposite carnivore present. In fact, for pumas, this was mediated by hare capture rate; puma detection increased with hare capture rate and was higher, and increased more strongly, when foxes were present. For foxes, detection interacted with puma capture rate and elevation, such that foxes had high detection rates at low elevation especially at sites with higher (vs. medium and low) puma capture rates, and fox detection declined with increasing elevation.
We predicted carnivores to be less active at sites with the other carnivore present to avoid potential aggressive encounters, yet we found the opposite, indicating that other factors (i.e., hares and distance to rivers for pumas) and habitat (elevation for foxes) were important, but so was the presence or detection rate of the other carnivore. This could indicate that the presence or activity rate of the opposite predator itself was an attractant, or that there was some other habitat/biotic variable attractive to both species that we failed to account for (e.g., see [62]). Other studies have shown co-occurrence to be common for carnivores across a wide-range of studies [14,20], but here we show that co-detection across sites, perhaps a subtler interaction, also may be common in carnivores.
We note that sample size (i.e., camera traps) was small in VV&LC, and it was surveyed in a different year; this likely limited our ability to make comparisons across sites. Given the large number of private ranches in our region, we suggest that future efforts focus on such areas to provide more insight into how predators utilize such areas across the mosaic landscape. Future research could expand trapping arrays to enlarge sample size and collect micro-habitat variables on-site as it has been done in other regions [26,62] to further explore factors responsible for positive associations in detection rates of pumas and foxes.

4.3. Temporal Activity and Overlap

We found that most species were either nocturnal (small mammals) or facultatively nocturnal (pumas, foxes, hares, rabbits), meaning they can shift diel activity according to environmental/biological cues. Guanacos were the only diurnal species, as reported previously [95] and hares showed some selection for crepuscular periods, which has been described elsewhere [96,97].
Similar to findings for the spatial niche axis, we found little evidence of temporal avoidance as a means to facilitate coexistence between pumas and foxes. In fact, temporal overlap between pumas and foxes almost always was higher than between pumas and prey. Other studies have reported temporal partitioning among carnivores. For example, felids in Sumatra with similar body sizes had low temporal overlap suggesting temporal avoidance [20], jaguars and pumas in Belize avoided using the same site simultaneously [22], and cheetahs (Acynonix jubatus) in Tanzania avoided lions (Panthera leo) and hyenas both spatially and temporally [98,99]. Although it has been reported that interference competition is likely to result in temporal partitioning [21], our lack of evidence for temporal segregation indicates that interference competition is not likely an important driver of co-existence between foxes and pumas.
Pumas exhibited more nocturnal behavior in the spring–summer, likely due to the high heat in that season [100]. In the spring–summer, pumas shifted activity to near dawn, matching the peak in hare activity and, to a lesser extent, rabbit activity. Previous studies in Bolivia and Mexico have shown that pumas did not match the daily activity patterns of any particular prey species [2,8], perhaps due to the complexity of those systems, which harbor many more prey species than our study site.
Pumas had low temporal overlap with small mammals, especially in spring–summer. We predicted pumas to have high overlap with guanacos as a potential main prey item, but instead we found similar overlap to hares in fall–winter and the lowest overlap of all species combinations in the spring–summer. Interestingly, guanacos, the only other species besides pumas that exhibited significant season differences, had more nocturnal activity in fall–winter leading to the higher overlap with pumas, but switched to being strongly diurnal in the spring–summer. Given that guanacos are a primary prey species for pumas in other areas, the lack of association between pumas and guanacos in our study is likely due to low guanaco density.
Foxes exhibited that the highest of all temporal pairwise species overlap with hares and rabbits and their overlap with small mammals was substantially higher than that of pumas. Foxes had lowest overlap with guanacos, which is to be expected considering they are not considered a main prey and that foxes were more strongly nocturnal than pumas.

4.4. Trophic, Dietary Overlap

Our diet analysis provided the strongest evidence that co-existence between pumas and foxes of the Chilean central Andes is facilitated by trophic niche axis segregation. Surprisingly, we found that puma diet was dominated by hares and that, when rabbits and hares were combined, the puma diet consisted almost entirely of these exotic lagomorphs (63% relative percent occurrence and 70% relative biomass). This is in stark contrast to other Andean areas where pumas select guanacos as their main prey item up to 88.5% of time [31,101] even though hares are available [102,103,104,105]. As guanacos are present in RNRC, we expected them to be a main prey item for pumas, yet guanaco consumption was nearly absent, only documented twice in the study area. Low guanaco density, as a result of past over-hunting and habitat change [33], may prevent pumas from hunting them in the study area. In an area of Patagonia where guanacos are scarce (under 5 ind/km2), pumas have been shown to switch prey and consume guanacos only as secondary prey items [106]. Although we have no data on guanaco abundance in our study area, the fact that they were rarely consumed indicates potentially even lower density than in Patagonia.
Interestingly, after lagomorphs, small mammals made of the next highest percent relative proportion in the puma diet, but their biomass contribution was small. Also noteworthy was that we found evidence of the native vischacha in puma diet even though we never photographed this species, either indicating there could be a few remaining on the landscape or that we did not sample the proper habitat where this species could be easier to detect, if present on the landscape. We also found that culpeo fox remains in one puma scat, suggesting that, if intraguild predation does occur, it is rare. Finally, we did find a small contribution of cattle and horse in puma scats (8% relative percent occurrence) similar to other areas [31,38], but, due to the larger body sizes of livestock, this made up a fairly high relative biomass (25%). Given the absence of livestock within RCNR, the predation or scavenging events associated to these findings should have occurred outside RCNR, either in VV&LC or elsewhere.
The majority of culpeo fox diet consisted of seeds and small-mammals (combined relative frequency of occurrence of 79%). Lagomorphs were the next largest diet component, making up 12% relative frequency of concurrency, but most of those were rabbits as opposed to hares. In contrast to our observations, studies of culpeo fox diet in other areas reveal that lagomorphs are often an important prey item [30,47,50], indicating that culpeo foxes may be exhibiting a diet shift away from hares, when pumas are present and guanacos are scarce. The high proportion of fruits and seeds present in the diet of culpeo foxes could also play a role in trophic niche segregation, as it has been previously reported for other opportunistic generalist predators that are more carbohydrate tolerant, like the pine marten (Martes martes) [107], and the red fox [108]. Trophic niche shifts appear to be a key mechanism underlying coexistence between large felids (i.e., jaguars and pumas [17,22]), but the coexistence mechanisms between the largest felid and largest canid of the Andean Mediterranean Region of Chile have not been previously explored.
Dietary niche breadth was higher for foxes than for pumas, as has been reported previously in Andean areas of Argentina [30,31]. Despite the opportunistic feeding behavior described for both pumas [109,110,111,112] and culpeo foxes [30], overlap in diet between the two carnivores was low (α = 0.30) compared to other studies reporting Pianka’s dietary niche overlap indices between pumas and culpeo foxes over 0.8 (e.g., α = 0.97 at Quebrada del Condorito National Park, mountains of central Argentina [30]; α = 0.82 at northern Patagonian ranches, Neuquén Province, Argentina [31]). In addition, based on the scats in which lagomorphs were determined to the species level (hares and rabbits), we observed that pumas consume mainly hares, while foxes consume mainly rabbits. Given that we computed the Pianka’s dietary niche overlap index considering rabbits and hares pooled within a single category (lagomorphs), this difference in lagomorphs consumption would decrease the observed trophic overlap to an even lower value.

5. Conclusions

We found high spatial overlap including co-detection, high temporal overlap, and relatively low dietary similarity (despite low prey species richness) between pumas and foxes. Rather than spatial or temporal exclusion, we found dietary segregation with exotic, introduced lagomorphs and native small mammals and seeds most likely to be the strongest factor promoting coexistence between pumas and foxes. We found evidence that (i) puma space use was positively associated with hare trapping rates, (ii) pumas shifted temporal activity seasonally to match peaks in hare activity, a phenomenon not previously observed, and (iii) lagomorphs (especially hares) made up the majority of puma diet. Foxes were ubiquitous on the landscape, yet their detection increased with puma detection, but also was influenced negatively by elevation. Foxes had more overlap with small mammals, their main mammalian prey, than pumas, but their temporal overlap with lagomorphs also was high and their diet also contained lagomorphs (mostly rabbits). Thus, we report that exotic species (hares and rabbits) are now key trophic resources in Mediterranean central Chile. This is highly relevant for wildlife management and conservation planning, given that, currently, eradication of introduced, exotic lagomorphs is the most common policy response in Chile in an effort to restore the native ecosystem. In this case, a removal plan for hares is likely to severely, negatively affect survival of the top predator. The prey base has changed dramatically in the study area since the 15th century [29] and, given how widespread guanacos were throughout South America historically, it is likely that guanacos previously were an important prey item for pumas in the study area. Thus, without guanaco population augmentation before hare removal, pumas would be unlikely to survive lagomorph removal, while foxes likely could survive on seeds and small mammals. Conservation planning and management actions should also focus on identifying and mitigating threats to guanacos in the study area, so they can naturally increase their population size.
Our work in this relatively low complexity community with introduced hares and rabbits as dominant prey species and only pumas and culpeo foxes competing for them gave us insight into carnivore coexistence and the value of exotic prey in a highly altered ecosystem. In this conservation conundrum, exotic species have become important prey items for native carnivores, and management decisions regarding the control and/or eradication of such species in the Mediterranean area of central Chile could benefit from more research on restoring native prey before large-scale, lagomorph removal campaigns.

Author Contributions

Conceptualization, C.O., M.K., and C.B.; methodology, C.O. and M.K.; formal analysis, C.O. and M.K.; investigation, C.O., A.M. and N.G.; resources, C.O., C.B.; data curation, C.O., N.G.; writing—original draft preparation, C.O.; writing—review and editing, M.K.; visualization, C.O.; supervision, M.K. and C.B.; project administration, A.M. and C.O.; funding acquisition, A.M., N.G., and C.B. All authors have read and agreed to the published version of the manuscript.

Funding

Ana Muñoz and Nicolás Guarda received funds from the Alto Cachapoal Scientific Research Grant, by Pacific Hydro Chile, which partially funded the fieldwork and data collection used for this study. Christian Osorio also awarded a Graduate Research Support grant from the Department of Ecosystems and Environment, Pontifical Catholic University of Chile, which was used to conduct fieldwork for this study as well.

Acknowledgments

Christian Osorio is the recipient of an International Doctorate Scholarship (No. 72170316) from the National Agency of Research and Development (ANID; www.anid.cl), Chile, and was the recipient (2014 to 2015) of a national master’s scholarship (No. 22140653) from the National Agency of Research and Development (ANID). Nicolás Guarda was granted a national doctorate scholarship (2009 to 2013) from the National Agency of Research and Development (ANID; www.anid.cl), Chile. We want to acknowledge the support received from Virginia Tech Open Access Subvention Fund (VT’s OASF) in publishing this article. We want to thank to the CONAF managers and rangers of Río Cipreses National Reserve (Álvaro Aguilar, Joaquín López, Pablo Lobos, Juan Miguel Carrasco, and Nelson Orellana) who provided valuable support during the fieldwork, and the owners of Verde Valle and Los Coligües landholdings for granting us access to the study area in order to collect the data. Special thanks to Francisca Aguirre, Tomás de Ferari, Andrés Gonzalez, Ángela Guajardo, Daniela Hernández, Hélène Jaiard, Angel Lara, Jaime Marmolejo, Isadora Mendoza, Mauricio Mery, Guillermo Reyes, Catalina Silva, and Raúl Silva, who participated in data collection and analysis. We want to thank the anonymous peer reviewers for their valuable feedback and comments, which allowed us to improve the manuscript significantly. We also want to thank Alejandra Muñoz at Department of Natural Resources and Environment, Pontifical Catholic University of Chile, for her valuable feedback and comments to the early versions of this manuscript. We also want to thank the anonymous reviewers of this work, whose comments and feedback allowed us to significantly improve the manuscript.

Conflicts of Interest

The authors declare no conflict of interest. The funders had no role in the design of the study; in the collection, analyses, or interpretation of data; in the writing of the manuscript, or in the decision to publish the results.

Appendix A

Table A1. Model types run and the ecological hypotheses they represent for puma and culpeo fox co-occurrence in Central Chile in year 2015. Pumas are designated as dominant thus their occupancy (i.e., site use) is not expected to be influenced by foxes; however, fox site use could be influenced by pumas, and detection for both carnivores could be influenced by the other.
Model Type Fox Site UsePuma DetectionFox Detection
ΨFP≠ ΨFp, pPrp, rFPrFpNon-independentNon-independentNon-independent
ΨFP ≠ ΨFp, pPrP, rFP = rFpNon-independentNon-independentIndependent
ΨFP ≠ ΨFp, pP = rP, rFPrFpNon-independentIndependentNon-independent
ΨFP ≠ ΨFp, pP = rP, rFP = rFpNon-independentIndependentIndependent
ΨFP = ΨFp, pPrP, rFPrFpIndependentNon-independentNon-independent
ΨFP = ΨFp, pPrP, rFP = rFpIndependentNon-independentIndependent
ΨFP = ΨFp, pP = rP, rFPrFpIndependentIndependentNon-independent
ΨFP = ΨFp, pP = rP, rFP = rFpIndependentIndependentIndependent
pP—probability of detecting pumas, given foxes are not present; pF—probability of detecting foxes, given pumas are not present; rP—probability of detecting pumas, given both are present; rFP—probability of detecting foxes, given both are present and pumas were detected; and rFp—probability of detecting foxes, given both are present, and pumas were not detected; ΨP—probability that a site is occupied by pumas, ΨFP—the probability that area is occupied by foxes, given pumas are present, ΨFp–probability that area is occupied by foxes, given pumas are not present.
Figure A1. Scats from carnivores present at Rio Cipreses National Reserve: (a) puma; (b) culpeo fox. Photos: Christian Osorio.
Diversity 12 00317 g0a1
Figure A2. Camera trap photos of mammalian species present in the study area (Río Cipreses National Reserve and Verde Valle & Los Coligües, Chile): (a) guanaco (Lama guanicoe); (b) puma (Puma concolor); (c) culpeo fox (Lycalopex culpaeus); (d) pampas cat (Leopardus colocolo); (e) rabbit (Oryctolagus cuniculus); (f) hare (Lepus europaeus). Photos: Christian Osorio.
Diversity 12 00317 g0a2

References

  1. Lucherini, M.; Reppucci, J.I.; Walker, R.S.; Villalba, M.L.; Wurstten, A.; Gallardo, G.; Iriarte, A.; Villalobos, R.; Perovic, P. Activity pattern segregation of carnivores in the high Andes. J. Mammal. 2009, 90, 1404–1409. [Google Scholar] [CrossRef]
  2. Romero-Munoz, A.; Maffei, L.; Cuéllar, E.; Noss, A.J. Temporal separation between jaguar and puma in the dry forests of southern Bolivia. J. Trop. Ecol. 2010, 26, 303–311. [Google Scholar] [CrossRef]
  3. Oliveira-Santos, L.G.R.; Graipel, M.E.; Tortato, M.A.; Zucco, C.A.; Cáceres, N.C.; Goulart, F.V. Abundance changes and activity flexibility of the oncilla, Leopardus tigrinus (Carnivora Felidae), appear to reflect avoidance of conflict. Zool. Curitiba 2012, 29, 115–120. [Google Scholar] [CrossRef] [Green Version]
  4. Monterroso, P.; Alves, P.C.; Ferreras, P. Catch me if you can: Diel activity patterns of mammalian prey and predators. Ethology 2013, 119, 1044–1056. [Google Scholar] [CrossRef] [Green Version]
  5. MacArthur, R.; Levins, R. The limiting similarity, convergence, and divergence of coexisting species. Am. Nat. 1967, 101, 377–385. [Google Scholar] [CrossRef]
  6. Palomares, F.; Caro, T.M. Interspecific killing among mammalian carnivores. Am. Nat. 1999, 153, 492–508. [Google Scholar] [CrossRef]
  7. Davis, M.; Kelly, M.; Stauffer, D. Carnivore co-existence and habitat use in the Mountain Pine Ridge Forest Reserve, Belize. Anim. Conserv. 2011, 14, 56–65. [Google Scholar] [CrossRef]
  8. Hernández-SaintMartín, A.D.; Rosas-Rosas, O.C.; Palacio-Núñez, J.; Tarango-Arámbula, L.A.; Clemente-Sánchez, F.; Hoogesteijn, A.L. Activity patterns of jaguar, puma and their potential prey in San Luis Potosi, Mexico. Acta Zool. Mex. Nueva Ser. 2013, 29, 520–533. [Google Scholar]
  9. Monterroso, P.; Alves, P.C.; Ferreras, P. Plasticity in circadian activity patterns of mesocarnivores in Southwestern Europe: Implications for species coexistence. Behav. Ecol. Sociobiol. 2014, 68, 1403–1417. [Google Scholar] [CrossRef] [Green Version]
  10. Kiszka, J.; Simon-Bouhet, B.; Martinez, L.; Pusineri, C.; Richard, P.; Ridoux, V. Ecological niche segregation within a community of sympatric dolphins around a tropical island. Mar. Ecol. Prog. Ser. 2011, 433, 273–288. [Google Scholar] [CrossRef] [Green Version]
  11. Karanth, K.U.; Srivathsa, A.; Vasudev, D.; Puri, M.; Parameshwaran, R.; Kumar, N.S. Spatio-temporal interactions facilitate large carnivore sympatry across a resource gradient. Proc. R. Soc. B Biol. Sci. 2017, 284, 20161860. [Google Scholar] [CrossRef] [PubMed] [Green Version]
  12. Fedriani, J.M.; Palomares, F.; Delibes, M. Niche relations among three sympatric Mediterranean carnivores. Oecologia 1999, 121, 138–148. [Google Scholar] [CrossRef] [PubMed] [Green Version]
  13. Šálek, M.; Červinka, J.; Padyšáková, E.; Kreisinger, J. Does spatial co-occurrence of carnivores in a Central European agricultural landscape follow the null model? Eur. J. Wildl. Res. 2014, 60, 99–107. [Google Scholar] [CrossRef]
  14. Davis, C.L.; Rich, L.N.; Farris, Z.J.; Kelly, M.J.; Di Bitetti, M.S.; Blanco, Y.D.; Albanesi, S.; Farhadinia, M.S.; Gholikhani, N.; Hamel, S.; et al. Ecological correlates of the spatial co-occurrence of sympatric mammalian carnivores worldwide. Ecol. Lett. 2018, 21, 1401–1412. [Google Scholar] [CrossRef] [PubMed] [Green Version]
  15. Soto, C.; Palomares, F. Coexistence of sympatric carnivores in relatively homogeneous Mediterranean landscapes: Functional importance of habitat segregation at the fine-scale level. Oecologia 2015, 179, 223–235. [Google Scholar] [CrossRef]
  16. Gerber, B.D.; Karpanty, S.M.; Randrianantenaina, J. Activity patterns of carnivores in the rain forests of Madagascar: Implications for species coexistence. J. Mammal. 2012, 93, 667–676. [Google Scholar] [CrossRef] [Green Version]
  17. Harmsen, B.J.; Foster, R.J.; Silver, S.C.; Ostro, L.E.; Doncaster, C. Jaguar and puma activity patterns in relation to their main prey. Mamm. Biol. 2011, 76, 320–324. [Google Scholar] [CrossRef]
  18. Foster, V.C.; Sarmento, P.; Sollmann, R.; Tôrres, N.; Jácomo, A.T.; Negrões, N.; Fonseca, C.; Silveira, L. Jaguar and puma activity patterns and predator-prey interactions in four Brazilian biomes. Biotropica 2013, 45, 373–379. [Google Scholar] [CrossRef]
  19. Farris, Z.J.; Golden, C.D.; Karpanty, S.; Murphy, A.; Stauffer, D.; Ratelolahy, F.; Andrianjakarivelo, V.; Holmes, C.M.; Kelly, M.J. Hunting, exotic carnivores, and habitat loss: Anthropogenic effects on a native carnivore community, Madagascar. PLoS ONE 2015, 10, e0136456. [Google Scholar] [CrossRef] [Green Version]
  20. Sunarto, S.; Kelly, M.J.; Parakkasi, K.; Hutajulu, M.B. Cat coexistence in central Sumatra: Ecological characteristics, spatial and temporal overlap, and implications for management. J. Zool. 2015, 296, 104–115. [Google Scholar] [CrossRef]
  21. Carothers, J.H.; Jaksić, F.M. Time as a niche difference: The role of interference competition. Oikos 1984, 403–406. [Google Scholar] [CrossRef]
  22. Harmsen, B.; Foster, R.; Silver, S.; Ostro, L.; Doncaster, C. Spatial and temporal interactions of two sympatric cats in a neotropical forest: The jaguar (Panthera onca) and the puma (Puma concolor). J. Mammal. 2009, 90, 224–236. [Google Scholar] [CrossRef] [Green Version]
  23. Gómez-Ortiz, Y.; Monroy-Vilchis, O.; Mendoza-Martínez, G.D. Feeding interactions in an assemblage of terrestrial carnivores in central Mexico. Zool. Stud. 2015, 54, 16. [Google Scholar] [CrossRef] [PubMed] [Green Version]
  24. Lanszki, Z.; Horváth, G.F.; Bende, Z.; Lanszki, J. Differences in the diet and trophic niche of three sympatric carnivores in a marshland. Mamm. Res. 2020, 65, 93–104. [Google Scholar] [CrossRef] [Green Version]
  25. Santos, M.J.; Pinto, B.M.; Santos-Reis, M. Trophic niche partitioning between two native and two exotic carnivores in SW Portugal. Web Ecol. 2007, 7, 53–62. [Google Scholar] [CrossRef] [Green Version]
  26. Murphy, A.; Kelly, M.J.; Karpanty, S.M.; Andrianjakarivelo, V.; Farris, Z.J. Using camera traps to investigate spatial co-occurrence between exotic predators and native prey species: A case study from northeastern Madagascar. J. Zool. 2019, 307, 264–273. [Google Scholar] [CrossRef]
  27. Roemer, G.W.; Gompper, M.E.; Van Valkenburgh, B. The ecological role of the mammalian mesocarnivore. BioScience 2009, 59, 165–173. [Google Scholar] [CrossRef]
  28. Paviolo, A.; Di Blanco, Y.E.; De Angelo, C.D.; Di Bitetti, M.S. Protection affects the abundance and activity patterns of pumas in the Atlantic Forest. J. Mammal. 2009, 90, 926–934. [Google Scholar] [CrossRef]
  29. Guarda, N.; Gálvez, N.; Leichtle, J.; Osorio, C.; Bonacic, C. Puma concolor density estimation in the Mediterranean Andes of Chile. Oryx 2017, 51, 263–267. [Google Scholar] [CrossRef] [Green Version]
  30. Pia, M.V. Trophic interactions between puma and endemic culpeo fox after livestock removal in the high mountains of central Argentina. Mammalia 2013, 77, 273–283. [Google Scholar] [CrossRef]
  31. Palacios, R.; Walker, R.S.; Novaro, A.J. Differences in diet and trophic interactions of Patagonian carnivores between areas with mostly native or exotic prey. Mamm. Biol. 2012, 77, 183–189. [Google Scholar] [CrossRef]
  32. Bonacic, C.; Ibarra, J.T. Fauna Andina: Historia Natural y Conservación; Ibarra, J.T., Ed.; Editorial Académica Española: Guadalajara, Mexico, 2010. [Google Scholar]
  33. Guarda, N. Abundance and Trophic Ecology of Puma Concolor in the Andean Environments of Mediterranean Chile. Ph.D. Thesis, Pontificia Universidad Católica de Chile, Santiago, Chile, 2015. [Google Scholar]
  34. Myers, N.; Mittermeier, R.A.; Mittermeier, C.G.; Da Fonseca, G.A.; Kent, J. Biodiversity hotspots for conservation priorities. Nature 2000, 403, 853. [Google Scholar] [CrossRef] [PubMed]
  35. Luebert, F.; Pliscoff, P. Sinopsis Bioclimática y Vegetacional de Chile; Editorial Universitaria: Santiago, Chile, 2006. [Google Scholar]
  36. Di Castri, F.; Hajek, E. Bioclimatología de Chile; Editorial Universidad Católica de Chile: Santiago, Chile, 1976. [Google Scholar]
  37. Gajardo, R. La Vegetación Natural de Chile: Clasificación y Distribución Geográfica; Editorial Universitaria: Santiago, Chile, 1995. [Google Scholar]
  38. Rau, J.R.; Jiménez, J.E. Diet of puma (Puma concolor, Carnivora Felidae) in coastal and Andean ranges of southern Chile. Stud. Neotrop. Fauna Environ. 2002, 37, 201–205. [Google Scholar] [CrossRef]
  39. Rau, J.; Tillería, M.S.; Martínez, D.R.; Muñoz, A. Dieta de Felis Concolor (Carnivora: Felidae) en áreas silvestres protegidas del sur de Chile. Rev. Chil. Hist. Nat. 1991, 64, 139–144. [Google Scholar]
  40. Walker, R.S.; Novaro, A.J.; Perovic, P.; Palacios, R.; Donadio, E.; Lucherini, M.; Pia, M.; López, M.S. Diets of three species of Andean carnivores in high-altitude deserts of Argentina. J. Mammal. 2007, 88, 519–525. [Google Scholar] [CrossRef]
  41. Jaksic, F.M. Vertebrate invaders and their ecological impacts in Chile. Biodivers. Conserv. 1998, 7, 1427–1445. [Google Scholar] [CrossRef]
  42. Jaksic, F.M.; Iriarte, J.A.; Jiménez, J.E.; Martínez, D.R. Invaders without frontiers: Cross-border invasions of exotic mammals. Biol. Invasions 2002, 4, 157–173. [Google Scholar] [CrossRef]
  43. Tislerics, A. Oryctolagus cuniculus. Available online: http://animaldiversity.org/accounts/Oryctolagus_cuniculus/ (accessed on 11 July 2016).
  44. Vu, A. Lepus europaeus. Available online: http://animaldiversity.org/accounts/Lepus_europaeus/ (accessed on 14 May 2016).
  45. Macdonald, D.W. The Encyclopedia of Mammals; Oxford University Press: Oxford, UK, 2010. [Google Scholar]
  46. Novaro, A.J.; Funes, M.C.; Walker, R.S. Ecological extinction of native prey of a carnivore assemblage in Argentine Patagonia. Biol. Conserv. 2000, 92, 25–33. [Google Scholar] [CrossRef]
  47. Pia, M.V.; López, M.S.; Novaro, A.J. Effects of livestock on the feeding ecology of endemic culpeo foxes (Pseudalopex culpaeus smithersi) in central Argentina. Rev. Chil. Hist. Nat. 2003, 76, 313–321. [Google Scholar] [CrossRef]
  48. Jaksic, F.M.; Schlatter, R.P.; Yáñez, J.L. Feeding ecology of central Chilean foxes, Dusicyon culpaeus and Dusicyon griseus. J. Mammal. 1980, 61, 254–260. [Google Scholar] [CrossRef]
  49. Correa, P.; Roa, A. Relaciones tróficas entre Oncifelis guigna, Lycalopex culpaeus, Lycalopex griseus y Tyto alba en un ambiente fragmentado de la zona central de Chile. Mastozool. Neotrop. 2005, 12, 57–60. [Google Scholar]
  50. Rubio, A.V.; Alvarado, R.; Bonacic, C. Introduced European rabbit as main prey of the native carnivore culpeo fox (Lycalopex culpaeus) in disturbed ecosystems of central Chile. Stud. Neotrop. Fauna Environ. 2013, 48, 89–94. [Google Scholar] [CrossRef]
  51. Iriarte, J.A.; Johnson, W.E.; Franklin, W.L. Feeding ecology of the Patagonia puma in southernmost Chile. Rev. Chil. Hist. Nat. 1991, 64, 145–156. [Google Scholar]
  52. Skewes, O.; Moraga, C.A.; Arriagada, P.; Rau, J.R. The european wild boar (Sus scrofa): A biological invader as a recent prey of the American puma (Puma concolor) in southern Chile. Rev. Chil. Hist. Nat. 2012, 85, 227–232. [Google Scholar] [CrossRef] [Green Version]
  53. Jackson, R.M.; Roe, J.D.; Wangchuk, R.; Hunter, D.O. Estimating snow leopard population abundance using photography and capture-recapture techniques. Wildl. Soc. Bull. 2006, 34, 772–781. [Google Scholar] [CrossRef]
  54. Delibes-Mateos, M.; Díaz-Ruiz, F.; Caro, J.; Ferreras, P. Activity patterns of the vulnerable guiña (Leopardus guigna) and its main prey in the Valdivian rainforest of southern Chile. Mamm. Biol. 2014, 79, 393–397. [Google Scholar] [CrossRef] [Green Version]
  55. Gelin, M.L.; Branch, L.C.; Thornton, D.H.; Novaro, A.J.; Gould, M.J.; Caragiulo, A. Response of pumas (Puma concolor) to migration of their primary prey in Patagonia. PLoS ONE 2017, 12, e0188877. [Google Scholar] [CrossRef] [Green Version]
  56. Kelly, M.J.; Holub, E.L. Camera trapping of carnivores: Trap success among camera types and across species, and habitat selection by species, on Salt Pond Mountain, Giles County, Virginia. Northeast. Nat. 2008, 15, 249–262. [Google Scholar] [CrossRef]
  57. Srbek-Araujo, A.; Chiarello, A. Domestic dogs in Atlantic forest preserves of south-eastern Brazil: A camera-trapping study on patterns of entrance and site occupancy rates. Braz. J. Biol. 2008, 68, 771–779. [Google Scholar] [CrossRef] [Green Version]
  58. Hines, J.E. Presence; USGS: Reston, VA, USA, 2006.
  59. MacKenzie, D.I.; Nichols, J.D.; Lachman, G.B.; Droege, S.; Andrew Royle, J.; Langtimm, C.A. Estimating site occupancy rates when detection probabilities are less than one. Ecology 2002, 83, 2248–2255. [Google Scholar] [CrossRef]
  60. MacKenzie, D.I.; Nichols, J.D.; Royle, J.A.; Pollock, K.H.; Bailey, L.; Hines, J.E. Occupancy Estimation and Modeling: Inferring Patterns and Dynamics of Species Occurrence; Elsevier: Amsterdam, The Netherlands, 2017. [Google Scholar]
  61. Farris, Z.; Kelly, M.; Karpanty, S.; Ratelolahy, F. Patterns of spatial co-occurrence among native and exotic carnivores in north-eastern Madagascar. Anim. Conserv. 2016, 19, 189–198. [Google Scholar] [CrossRef]
  62. Thomas, J.P.; Reid, M.L.; Barclay, R.M.; Jung, T.S. Salvage logging after an insect outbreak reduces occupancy by snowshoe hares (Lepus americanus) and their primary predators. Glob. Ecol. Conserv. 2019, 17, e00562. [Google Scholar] [CrossRef]
  63. Spencer, W.; Rustigian-Romsos, H.; Strittholt, J.; Scheller, R.; Zielinski, W.; Truex, R. Using occupancy and population models to assess habitat conservation opportunities for an isolated carnivore population. Biol. Conserv. 2011, 144, 788–803. [Google Scholar] [CrossRef]
  64. Webb, N.F.; Merrill, E.H. Simulating carnivore movements: An occupancy–abundance relationship for surveying wolves. Wildl. Soc. Bull. 2012, 36, 240–247. [Google Scholar] [CrossRef]
  65. Long, R.A.; Donovan, T.M.; MacKay, P.; Zielinski, W.J.; Buzas, J.S. Predicting carnivore occurrence with noninvasive surveys and occupancy modeling. Landsc. Ecol. 2011, 26, 327–340. [Google Scholar] [CrossRef]
  66. Ackerman, B.B.; Lindzey, F.G.; Hemker, T.P. Cougar food habits in southern Utah. J. Wildl. Manag. 1984, 48, 147–155. [Google Scholar] [CrossRef]
  67. US Geological Survey; National Aeronautical and Space Agency USGS. Shuttle Radar Topographic Mission, SRTM 2000; USGS: Reston, VA, USA, 2000.
  68. Burnham, K.P.; Anderson, D.R. A Practical Information-Theoretic Approach. Model Selection Multimodel Inference, 2nd ed.; Springer: New York, NY, USA, 2002. [Google Scholar]
  69. Burnham, K.P.; Anderson, D.R. Multimodel inference: Understanding AIC and BIC in model selection. Sociol. Methods Res. 2004, 33, 261–304. [Google Scholar] [CrossRef]
  70. Richmond, O.M.; Hines, J.E.; Beissinger, S.R. Two-species occupancy models: A new parameterization applied to co-occurrence of secretive rails. Ecol. Appl. 2010, 20, 2036–2046. [Google Scholar] [CrossRef]
  71. Steen, D.A.; McClure, C.J.; Brock, J.C.; Craig Rudolph, D.; Pierce, J.B.; Lee, J.R.; Jeffrey Humphries, W.; Gregory, B.B.; Sutton, W.B.; Smith, L.L.; et al. Snake co-occurrence patterns are best explained by habitat and hypothesized effects of interspecific interactions. J. Anim. Ecol. 2014, 83, 286–295. [Google Scholar] [CrossRef]
  72. Powell, L.A. Approximating variance of demographic parameters using the delta method: A reference for avian biologists. Condor 2007, 109, 949–954. [Google Scholar] [CrossRef]
  73. R Core Team R. A Language and Environment for Statistical Computing; R Foundation for Statistical Computing: Vienna, Austria, 2015. [Google Scholar]
  74. Bailey, L.L.; Reid, J.A.; Forsman, E.D.; Nichols, J.D. Modeling co-occurrence of northern spotted and barred owls: Accounting for detection probability differences. Biol. Conserv. 2009, 142, 2983–2989. [Google Scholar] [CrossRef]
  75. Ivlev, V.S. Experimental Ecology of the Feeding of Fishes; Yale University Press: New Haven, CT, USA, 1961. [Google Scholar]
  76. Jacobs, J. Quantitative measurement of food selection. Oecologia 1974, 14, 413–417. [Google Scholar] [CrossRef] [PubMed]
  77. Blanco-Garrido, F.; Prenda, J.; Narvaez, M. Eurasian otter (Lutra lutra) diet and prey selection in Mediterranean streams invaded by centrarchid fishes. Biol. Invasions 2008, 10, 641–648. [Google Scholar] [CrossRef]
  78. Davison, A.C.; Hinkley, D.V. Bootstrap Methods and Their Applications; Cambridge University Press: Cambridge, UK, 1997. [Google Scholar]
  79. Canty, A.; Ripley, B.D. Boot: Bootstrap R (S-Plus) Functions; Cambridge University Press: Cambridge, UK, 2020. [Google Scholar]
  80. Ridout, M.S.; Linkie, M. Estimating overlap of daily activity patterns from camera trap data. J. Agric. Biol. Environ. Stat. 2009, 14, 322–337. [Google Scholar] [CrossRef]
  81. Harrison, D.; Kanji, G.K. The development of analysis of variance for circular data. J. Appl. Stat. 1988, 15, 197–223. [Google Scholar] [CrossRef]
  82. Harrison, D.; Kanji, G.K.; Gadsden, R.J. Analysis of variance for circular data. J. Appl. Stat. 1986, 13, 123–138. [Google Scholar] [CrossRef]
  83. Berens, P. CircStat: A MATLAB toolbox for circular statistics. J. Stat. Softw. 2009, 31, 1–21. [Google Scholar] [CrossRef] [Green Version]
  84. Linkie, M.; Ridout, M.S. Assessing tiger–prey interactions in Sumatran rainforests. J. Zool. 2011, 284, 224–229. [Google Scholar] [CrossRef]
  85. Meredith, M.; Ridout, M. Overlap: Estimates of Coefficient of Overlapping for Animal Activity Patterns; R Package Version 02; R Foundation for Statistical Computing: Vienna, Austria, 2014. [Google Scholar]
  86. Chehébar, C.; Martín, S. Guía para el reconocimiento microscópico de los pelos de los mamíferos de la Patagonia. Doñana Acta Vertebr. 1989, 16, 247–291. [Google Scholar]
  87. Reise, D. Clave para la Determinación de los Cráneos de Marsupiales y Roedores Chilenos; Instituto de Biología, Universidad de Concepción: Conception, Chile, 1973. [Google Scholar]
  88. Gladfelter, W.B.; Johnson, W.S. Feeding niche separation in a guild of tropical reef fishes (Holocentridae). Ecology 1983, 64, 552–563. [Google Scholar] [CrossRef]
  89. Cardona, L. Measurement of trophic niche breadth using occurrence frequencies. J. Fish Biol. 1991, 39, 901–903. [Google Scholar] [CrossRef]
  90. Pianka, E.R. The structure of lizard communities. Annu. Rev. Ecol. Syst. 1973, 4, 53–74. [Google Scholar] [CrossRef] [Green Version]
  91. Shrestha, A.; Thapa, K.; Subba, S.A.; Dhakal, M.; Devkota, B.P.; Thapa, G.J.; Shrestha, S.; Malla, S.; Thapa, K. Cats, canines, and coexistence: Dietary differentiation between the sympatric snow leopard and grey wolf in the western landscape of Nepal Himalaya. J. Threat. Taxa 2019, 11, 13815–13821. [Google Scholar] [CrossRef]
  92. Morin, D.J.; Higdon, S.D.; Holub, J.L.; Montague, D.M.; Fies, M.L.; Waits, L.P.; Kelly, M.J. Bias in carnivore diet analysis resulting from misclassification of predator scats based on field identification. Wildl. Soc. Bull. 2016, 40, 669–677. [Google Scholar] [CrossRef]
  93. Moreira-Arce, D.; Vergara, P.M.; Boutin, S.; Carrasco, G.; Briones, R.; Soto, G.E.; Jimenez, J.E. Mesocarnivores respond to fine-grain habitat structure in a mosaic landscape comprised by commercial forest plantations in southern Chile. For. Ecol. Manag. 2016, 369, 135–143. [Google Scholar] [CrossRef]
  94. Noguera-Urbano, E.A.; Ramírez-Chaves, H.E.; Torres-Martínez, M.M. Análisis geográfico y conservación del zorro andino Lycalopex culpaeus (Mammalia, Canidae) en Colombia. Iheringia Sér. Zool. 2016, 106. [Google Scholar] [CrossRef] [Green Version]
  95. de Lamo, D.A.; Sanborn, A.F.; Carrasco, C.D.; Scott, D.J. Daily activity and behavioral thermoregulation of the guanaco (Lama guanicoe) in winter. Can. J. Zool. 1998, 76, 1388–1393. [Google Scholar] [CrossRef]
  96. Schai-Braun, S.C.; Rödel, H.G.; Hackländer, K. The influence of daylight regime on diurnal locomotor activity patterns of the European hare (Lepus europaeus) during summer. Mamm. Biol. 2012, 77, 434–440. [Google Scholar] [CrossRef]
  97. Zaccaroni, M.; Biliotti, N.; Buccianti, A.; Calieri, S.; Ferretti, M.; Genghini, M.; Riga, F.; Trocchi, V.; Dessì-Fulgheri, F. Winter locomotor activity patterns of European hares (Lepus europaeus). Mamm. Biol. 2013, 78, 482–485. [Google Scholar] [CrossRef]
  98. Durant, S.M. Competition refuges and coexistence: An example from Serengeti carnivores. J. Anim. Ecol. 1998, 67, 370–386. [Google Scholar] [CrossRef] [Green Version]
  99. Durant, S.M. Living with the enemy: Avoidance of hyenas and lions by cheetahs in the Serengeti. Behav. Ecol. 2000, 11, 624–632. [Google Scholar] [CrossRef] [Green Version]
  100. Terrien, J.; Perret, M.; Aujard, F. Behavioral thermoregulation in mammals: A review. Front. Biosci. 2011, 16, 1428–1444. [Google Scholar] [CrossRef] [PubMed] [Green Version]
  101. Elbroch, L.M.; Wittmer, H.U. The effects of puma prey selection and specialization on less abundant prey in Patagonia. J. Mammal. 2013, 94, 259–268. [Google Scholar] [CrossRef] [Green Version]
  102. Wilson, P. Puma predation on guanacos in Torres del Paine National Park, Chile. Mammalia 1984, 48, 515–522. [Google Scholar] [CrossRef]
  103. Bank, M.S.; Sarno, R.J.; Campbell, N.K.; Franklin, W.L. Predation of guanacos (Lama guanicoe) by southernmost mountain lions (Puma concolor) during a historically severe winter in Torres del Paine National Park, Chile. J. Zool. 2002, 258, 215–222. [Google Scholar] [CrossRef]
  104. Cajal, J.L.; Lopez, N.E. The puma as a predator of wild camelids in the San Guillermo reserve, San-Juan, Argentina. Rev. Chil. Hist. Nat. 1987, 60, 87–91. [Google Scholar]
  105. Zanón Martínez, J.I.; Travaini, A.; Zapata, S.; Procopio, D.; Santillán, M.Á. The ecological role of native and introduced species in the diet of the puma Puma concolor in southern Patagonia. Oryx 2012, 46, 106–111. [Google Scholar] [CrossRef] [Green Version]
  106. Baldi, R.; PELLIZA-SBRILLER, A.; Elston, D.; Albon, S. High potential for competition between guanacos and sheep in Patagonia. J. Wildl. Manag. 2004, 68, 924–938. [Google Scholar] [CrossRef]
  107. Remonti, L.; Balestrieri, A.; Raubenheimer, D.; Saino, N. Functional implications of omnivory for dietary nutrient balance. Oikos 2016, 125, 1233–1240. [Google Scholar] [CrossRef]
  108. Lanszki, J.; Zalewski, A.; Horváth, G. Comparison of red fox Vulpes vulpes and pine marten Martes martes food habits in a deciduous forest in Hungary. Wildl. Biol. 2007, 13, 258–271. [Google Scholar] [CrossRef] [Green Version]
  109. Moss, W.E.; Alldredge, M.W.; Logan, K.A.; Pauli, J.N. Human expansion precipitates niche expansion for an opportunistic apex predator (Puma concolor). Sci. Rep. 2016, 6, 39639. [Google Scholar] [CrossRef] [PubMed] [Green Version]
  110. Bauer, J.W.; Logan, K.A.; Sweanor, L.L.; Boyce, W.M. Scavenging behavior in puma. Southwest Nat. 2005, 50, 466–471. [Google Scholar] [CrossRef]
  111. Aranda, M.; Sánchez-Cordero, V. Prey spectra of jaguar (Panthera onca) and puma (Puma concolor) in tropical forests of Mexico. Stud. Neotrop. Fauna Environ. 1996, 31, 65–67. [Google Scholar] [CrossRef]
  112. Moreno, R.S.; Kays, R.W.; Samudio, R. Competitive release in diets of ocelot (Leopardus pardalis) and puma (Puma concolor) after jaguar (Panthera onca) decline. J. Mammal. 2006, 87, 808–816. [Google Scholar] [CrossRef]
Figure 1. Study area and camera-stations. The black arrow in the offset points to the location of the study site (red square) within Chile. Elevation contours, rivers and streams, study site borders, and camera-trap locations are displayed. Surveys took place in 2012 (Verde Valle & Los Coligües), 2013 (Verde Valle & Los Coligües), and 2015 (Río Cipreses National Reserve).
Diversity 12 00317 g001
Figure 2. The 24-h photographic capture rates (CR24h) from camera-trap surveys for (a) RNCR in 2015 and (b) VV&LC (the areas with livestock grazing) in 2012–2013 across seasons and combined. Error bars display standard errors.
Diversity 12 00317 g002
Figure 3. Puma occupancy and detection probabilities (a,b) and fox detection probabilities (c) from the top single-species models for camera-trap data from Río Cipreses National Reserve (2015), Chile. (a) Puma occupancy (Ψ) as a function of hare 30 min capture rates per 100 trap night (Hare CR30min); (b) Puma detection (p) as a function of distance to the river (m) at high—(CR24h = 30, solid line), medium—(CR24h = 15, dashed line), and low—(0 CR24h = 0, dotted line) hare 24-h capture rates (Hare CR24h). (c) Fox detection probability (p), as a function of elevation (meters above sea level—m.a.s.l.), starting at 1000 m.a.s.l. (the lowest elevation at the site).
Diversity 12 00317 g003aDiversity 12 00317 g003b
Figure 4. Puma and fox occupancy and detection probabilities from the top-ranked, 2-species occupancy model fit to camera-trap records from Río Cipreses National Reserve, RCNR (2015), Chile. (a) Puma detection probability when foxes are present (dashed line) and when foxes are not present (solid line) as a function of 24-h hare detection rates (Hare CR24h) across camera-sites; (b) fox detection probability when pumas are not present (pF, black lines), when pumas are present but not detected (rFp, blue lines), and when pumas are present and detected (rFP, red lines), and under low- (0, 30-min independent events per 100 camera-nights (CR30min), dotted lines), medium (5 CR30min, dashed lines) and high- (≥10, CR30min, solid lines) puma 30-min capture rates (Pc30), as a function of elevation (meters above sea level—m.a.s.l.).
Diversity 12 00317 g004
Figure 5. Puma activity pattern (solid line) compared to fox and prey species patterns (dashed lines) from 56 camera-traps from Río Cipreses National Reserve (2015) and Verde Valle & Los Coligües Landholdings (2012–2013), Chile: puma overlap with (a) foxes, (b) hares, (c) rabbits, (d) small mammals and (e) guanacos for both fall–winter (top) and spring–summer (bottom) Estimated overlap (represented by the gray areas) and overlap coefficients are displayed as Δ (95% CI). Vertical dotted lines show the sunset (left) and sunrise (right) times.
Diversity 12 00317 g005
Figure 6. Culpeo fox (solid line) and prey (dashed line) activity pattern overlap from camera-trap records from Río Cipreses National Reserve (2015) and Verde Valle and Los Coligües Landholdings (2012–2013), Chile. Overlap between culpeo foxes and (a) hares, (b) rabbits, (c) small mammals, and (d) guanacos are shown. Estimated activity pattern overlap (gray area) and coefficients of overlap are displayed as Δ (95% CI). Vertical dotted lines show the sunset (left) and sunrise (right) times.
Diversity 12 00317 g006
Figure 7. Predator–predator and predator–prey interspecific relations on Río Cipreses National Reserve (2015) and Verde Valle & Los Coligües Landholdings (2012–2013), Chile, based on trophic dietary niche overlap and temporal and spatial pattern overlap and detection. Relative percent occurrence of prey in predator diet (RPO%), the temporal overlap coefficient (∆) for each species pair, and, for the two carnivores, the species interaction factor (Φ) and detection interaction factor (δ) are presented beside each arrow. The width of the arrows (black component) is proportional to the RPO% as a proxy of the intensity of the trophic interaction, whereas the width of the gray component is proportional to the coefficient of temporal overlap (Δ). Potential prey are arranged from smallest to largest body size. Although not included in the diagram, hog-nosed skunk made up 1% RPO for foxes, reptiles made up 1% RPO for pumas, and birds made up 4% and 2% RPO for foxes and pumas, respectively.
Diversity 12 00317 g007
Table 1. Puma and culpeo fox single-season occupancy models from 36 camera trap stations in Rio Cipreses National Reserve, Chile in 2015. Shown are the top three models and the constant (null) model.
ModelAICcΔAICcwiLK
PumaΨ 1(Le30 2),p 3(Le24 4+D.river 5)477.280.000.7251.0005
Ψ(.),p(Le24+D.river)483.485.590.0350.0614
Ψ(Le30),p(Le24)493.9016.010.0000.0004
Ψ(.),p(.) 6540.1062.210.0000.0002
Culpeo FoxΨ(.),p(Elev 7)1551.400.000.7101.0003
Ψ(.),p(Pc30 8+Elev)1553.331.930.2710.4824
Ψ(.),p(Habitat)1559.618.210.0120.0174
Ψ(.),p(.) 61604.2152.810.0000.0002
AICc—Akaike Information Criterion corrected for small samples; ΔAICc—difference between each model’s AICc and the top-model AICc; wi—model weight; L—model likelihood; K—number of parameters. 1 Ψ—site use probability; 2 Le30—photographic capture rate of hares from 30-min independent events (CR30min); 3 p—detection probability; 4 Le24—photographic capture rate of hares from 24-h independent events (CR24h), 5 D.river—distance to river (m); 6 Ψ(.),p(.)—constant or null model; 7 Elev—elevation (meters above sea level). 8 Pc30—30 min photographic capture rate of pumas (CR30 min).
Table 2. Untransformed estimates of coefficients for covariates (β) for the puma and fox single species, single season top-ranked occupancy model from 36 camera trap stations in Río Cipreses National Reserve, Chile in 2015.
β (95% CI)
PumaΨ 1(Le30 2)2.53 (−0.14; 5.21)
p3(Le24 4)0.11 (0.45; 0.90)
p(D.river 5)−1.48 (−2.23; −0.73)
Culpeo Foxp(Elev 6)top model−0.47 (−0.59; −0.34)
p(Elev)second model−0.45 (−0.58; −0.33)
p(Pc30 7)second model−0.06 (−0.20; 0.09)
1 Ψ—site use probability; 2 Le30—photographic capture rate of hares from 30-min independent events (CR30min); 3 p—detection probability; 4 Le24—photographic capture rate of hares from 24-h independent events (CR34h); 5 D.river—distance to river (m); 6 Elev—elevation (meters above sea level (CR30min). 7 Pc30—30 min photographic capture rate of pumas (CR30min).
Table 3. Two-species co-occurrence models for pumas and culpeo foxes from 36 camera trap stations in Río Cipreses National Reserve, Chile in 2015. The top two models are shown, along with the constant (null) model.
ModelAICcΔAICcwiLK
ΨP(Le30 1), ΨFP(.) = ΨFp(.),
pP(Le24 2), pF(Elev 3 + Pc30 4),
rP(Le24), rFP(Elev + Pc30), rFp(Elev + Pc30)
1952.100.91111
ΨP(Le30), ΨFP(.) = ΨFp(.),
pP = rP(Le24), pF(Elev + Pc30),
rFP(Elev+Pc30), rFp(Elev + Pc30)
1957.95.740.050.0610
ΨP(.), ΨFP(.) ≠ ΨFp(.),
pP(.), pF(.),
rP(.), rFP(.) ≠ rFp(.) 5
2126.7174.50.000.008
AICc—Akaike Information Criterion corrected for small samples; ΔAICc—difference between each model’s AICc and the top-model AICc; wi—model weight; L—model likelihood; K—number of parameters; pP—probability of detecting pumas, given foxes are not present; pF—probability of detecting foxes, given pumas are not present; rP—probability of detecting pumas, given both are present; rFP—probability of detecting foxes, given both are present and pumas were detected; and rFp—probability of detecting foxes, given both are present, and pumas were not detected; ΨP—probability that a site is occupied by pumas, ΨFP—the probability that area is occupied by foxes, given pumas are present, ΨFp–probability that area is occupied by foxes, given pumas are not present. 1 Le30—capture rate of hares from 30-min independent events per 100 trap night (CR30min); 2 Le24—capture rate of hares from 24-h independent events per 100 trap night (CR24h); 3 Elev—Elevation (masl); 4 Pc30—30 min capture rate of pumas (CR30min); 5 ΨP(.), ΨFP(.) ≠ ΨFp(.), pP(.), pF(.), rP(.), rFP(.) ≠ rFp(.)—constant or null model.
Table 4. Mean Jacob’s Selectivity Index (JSI) for diel periods, computed from camera-traps 30-min independent camera-trap records (CR30min) from Río Cipreses National Reserve (2015) and Verde Valle & Los Coligües Landholdings (2012–2013), Chile. Bootstrap 95% confidence intervals are presented between brackets.
SpeciesJSInight (95% CI)JSIdawn (95% CI)JSIday (95% CI)JSIdusk (95% CI)
Puma0.34 (0.24; 0.45) +0.16 (−0.01; 0.35)−0.56 (−0.67; −0.44) 0.10 (−0.07; 0.32)
Culpeo fox0.60 (0.56; 0.63) +−0.28 (−0.37; −0.19)−0.65 (−0.69; −0.61) −0.15 (−0.24; −0.06)
Guanaco−0.77 (−0.87; −0.67) −0.35 (−0.65; 0.03)0.77 (0.69; 0.86) +−0.42 (−0.72; −0.04)
Hare0.47 (0.41; 0.53) +0.20 (0.10; 0.31) +−0.80 (−0.85; −0.74) 0.13 (0.02; 0.25) +
Rabbit0.55 (0.47; 0.62) +0.12 (−0.02; 0.29)−0.81 (−0.88; −0.74) 0.00 (−0.17; 0.18)
Small mammals0.99 (0.98; 1.00) +−1.00 (−1.00; −1.00) −1.00 (−1.00; −1.00) −0.92 (−1.07; −0.74)
+ significant positive selection for diel period; significant negative selection for diel period.
Table 5. Puma and culpeo fox diet composition based on 206 scats collected from Río Cipreses National Reserve (2015) and Verde Valle & Los Coligües Landholdings (2012–2013), Chile. Number of scats where the prey item was detected (N), Frequency of Occurrence (FO%), Relative Percent Occurrence (RPO%), and Relative Biomass (RBM%) are displayed.
PumaCulpeo Fox
ItemNFO 1RPO% 2RBM% 3NFO 1RPO% 2
Lagomorphs120766370122512
Small mammals4126222367536
Viscacha2111000
Ungulates
Cattle5338242
Horse106515242
Guanaco2113000
Total ungulates1711926484
Carnivores
Culpeo fox1111---
Hog-nosed skunk0000121
Total carnivores1111121
Birds432-484
Reptiles111-000
Seeds
Peumo 4----242
Litre 5----285828
Molle 6----484
Drupes----5105
Unknown seeds----484
Total seeds----438843
Undetermined322----
Total189120100100100206100
Total scats158 48
1 Frequency of occurrence (i.e., percent of the scats that contained a particular category of the diet item), 2 relative percentage of occurrence (i.e., percent occurrence of each category of diet item relative to total diet items detected in scats, considering scats can contain more than one diet item), 3 relative biomass (i.e., proportion of the consumed biomass that each prey represented, as calculated using the mean weight of each prey item) [66]. 4 Cryptocaria alba; 5 Lithrea caustica; 6 Schinus polygamus.

