Article

Spatial Segregation between Red Foxes (Vulpes vulpes), European Wildcats (Felis silvestris) and Domestic Cats (Felis catus) in Pastures in a Livestock Area of Northern Spain

1
Department of Conservation Biology, Estación Biológica de Doñana, CSIC, Avda. Américo Vespucio 26, Isla de la Cartuja, 41092 Sevilla, Spain
2
Asociación de Naturalistas Palentinos, C/Vega, 7, Fuentes de Nava, E-34337 Palencia, Spain
*
Authors to whom correspondence should be addressed.
Diversity 2020, 12(7), 268; https://doi.org/10.3390/d12070268
Submission received: 18 May 2020 / Revised: 30 June 2020 / Accepted: 2 July 2020 / Published: 6 July 2020

Abstract

:
Red foxes, European wildcats and domestic cats share cattle pastures for hunting in La Pernía Valley, northern Spain. To understand the mechanisms that allow the coexistence of these mesopredators in a habitat characterized by its anthropogenic modifications, we recorded sightings of these species in pastures in the summers of 2016, 2017, 2018 and 2019. We tested if the species preferred specific areas of pastures and if they exhibited any spatial segregation in the use of pastures. Red foxes did not show consistent preferences for any area of the pastures. European wildcats preferred pasture areas closer to streams and forest edges, whereas domestic cats preferred areas closer to buildings and paved roads whilst avoiding forest edges. All species pairs showed strong spatial segregation with less than 7% overlap. We hypothesize that spatial segregation is the mechanism used by European wildcats and domestic cats to avoid dangerous interactions with other predators and which characterizes their preference of specific areas on pastures, using areas near places that may protect them from other predators. Ultimately, the influence of fox presence (and probably that of other larger potential predators) on the use of pastures by European wildcats and domestic cats is decreasing the number of interactions between them and may help to prevent hybridization in this area.

Graphical Abstract

1. Introduction

Wild mammalian carnivores play a key role in ecosystems both as predators and competitors, and changes in their abundance or community composition could induce changes at other ecosystem levels [1,2,3]. Mesocarnivores, which are small-to-medium sized carnivores [3], are as important as large carnivores in ecosystems because they are more diverse and abundant [2]. Discerning niche characteristics of mesocarnivores is key to understanding ecological processes such as habitat segregation or competitive interactions [3], which is important in assessing their impact on ecosystems.
Interspecific interactions or predation are frequent between predators due to their adaptations for killing [4] and play an important role in shaping ecological networks in terrestrial ecosystems [5]. Sympatric carnivore interactions may result in competitive responses like kleptoparasitism, intimidation, spatial exclusion and even mortality [6,7]. Spatial distribution and population dynamics of carnivore species are strongly influenced by competitive interactions [8,9].
Niche partitioning is an important mechanism to avoid and reduce negative effects of competition [10], which allows mesocarnivore communities to coexist. Diverse behavioral mechanisms, such as diet partitioning, different uses of space or time, as well as active avoidance and intensified aggression at finer scales, have been observed in carnivores to avoid competitive encounters [7,11,12,13]. The spatial dimension of the niche is the most frequently partitioned, especially when considered at finer scales [10,14,15].
Protected areas in Spain, due to historical linkages of human-shaped and natural landscapes [16], are characterized by a shared purpose of supporting both conservation and human activities and exploitation of natural resources. Such is the case of La Pernía Valley in Montaña Palentina Natural Park (MPNP), northern Spain, where valley bottoms are used as pastures to feed livestock. Anthropogenic factors are known to influence intraguild competition by modifying resource levels and distribution or by directly altering species densities [17]. In addition, areas of sparse housing within natural landscapes, such as the rural areas in La Pernía Valley, usually support a higher abundance of domestic species than urban areas where buildings are more concentrated [18,19], and thus the likelihood of domestic species infiltrating the surrounding natural areas is higher. In La Pernía Valley, several mesocarnivore species have been observed coexisting with domestic predators in the pastures of the valleys, which they use for hunting mainly montane water voles (Arvicola scherman; personal observations). The spatial complexity in heterogeneous landscapes such as that found in the study area foments the coexistence of similar species, allowing different habitat selections and thus promoting sympatry [20,21,22].
Red foxes (Vulpes vulpes), European wildcats (Felis silvestris) and domestic cats (Felis catus) are the most abundant mesocarnivores observed on the pastures of the study area. All three species present some overlap in their trophic niche and, when lagomorphs are absent, mostly prey on small mammals [15,23,24,25,26,27], which are abundant in the pastures in our study area [28]. Therefore, one would expect strong resource competition between the three carnivores. Red foxes are larger than both cat species and have been observed to attack domestic cats, with samples of European wildcats and domestic cats having been found in the red fox diet [25,29,30]. Domestic cats have also been observed far from farmhouses when red foxes are absent, but stay close when they are present [31]. Therefore, under a potential competition scenario, red foxes should be dominant over European wildcats and domestic cats [32].
In this study, we examined the hypothesis of spatial segregation among red foxes, wildcats and domestic cats within pasture areas used for hunting by the three species. Since the three species, as a rule, mainly prey upon the same species, and according to their body size differences, we expected: (1) different spatial use of pastures by each species, with red foxes using pastures in a more random manner, and wild and domestic cats using areas closer to forest/riparian vegetation and buildings, respectively. (2) If the three species are spatially using pastures in a different way, and foxes are the dominant species, we expected a clear spatial segregation between the three predators, with wild and domestic cats avoiding the use of areas used by foxes and wild and domestic cats also segregating within pastures since they would use areas closer to forest/riparian vegetation and buildings, respectively. (3) Finally, if the predicted spatial segregation pattern is observed, and is due to interspecific interference competition, we expected that the abundance of the main potential prey for the three species in pastures would be higher (or similar) in areas used by foxes compared with areas used by wild or domestic cats; otherwise, species distribution within pastures may indicate restrictions to accessing the most profitable areas for hunting.

2. Materials and Methods
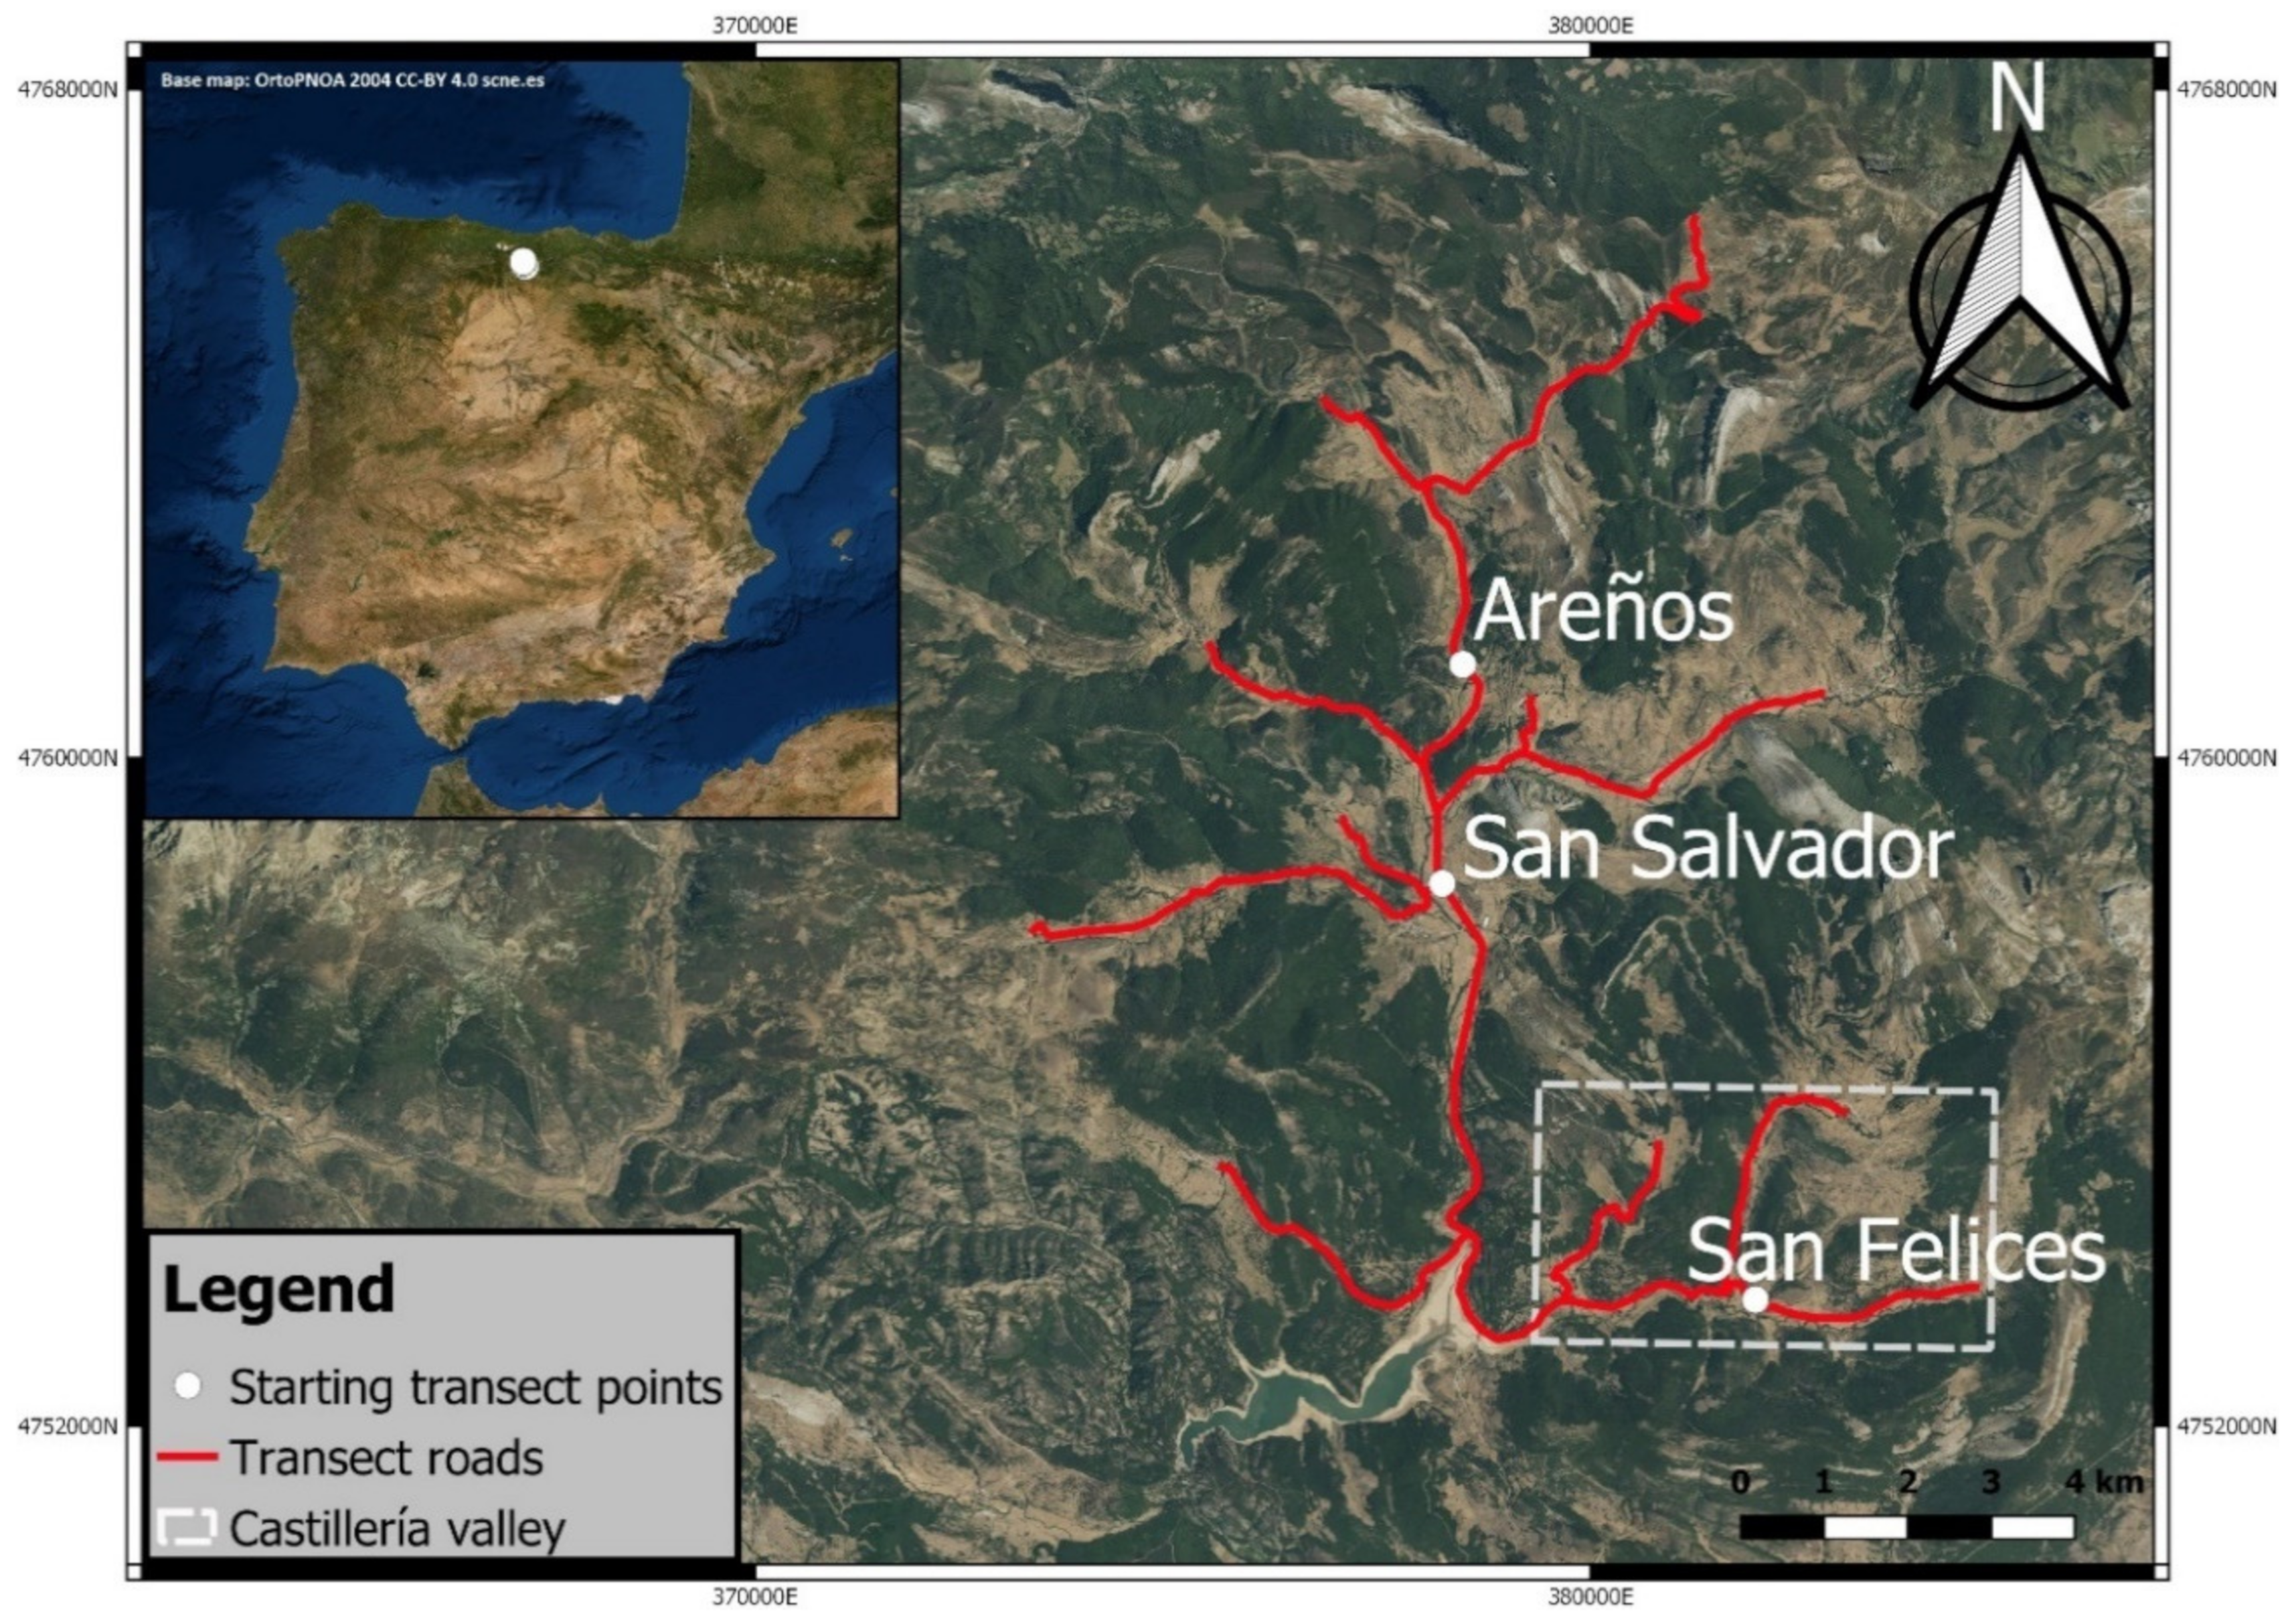
2.1. Study Area

This study was located in the valleys of the Montaña Palentina Natural Park, situated in Palencia Province (Northern Spain; 42°56′ N 4°35′ W). The park is located in the south of the Cantabric mountain range; therefore, the territory is characterized by alternating faults and folds of limestone with valleys and cirques through the natural park. Considering the classification of Rivas-Martínez and Loidi [33], the bioclimate in the study area is temperate oceanic with sub-Mediterranean variants, complemented with higher continentality and lower precipitation due to its meridional position within the Cantabric mountain range. The valleys are situated between 1000 and 1300 m asl; annual average precipitation is approximately 1100 mm and annual average temperature ranges from 8 °C to 10 °C [34].
The study area was formed by one main valley with a north–south orientation and smaller valleys that feed into it (Figure 1). It is characterized by low human pressure and density. The population in the valleys uses pastures for livestock, which are surrounding the valleys.

2.2. Study Design

Data were collected in the summers of 2016, 2017, 2018 and 2019 using transects carried out during seven consecutive days every year. We selected summers for censuses because in previous pilot sampling it was the period of the year when mesocarnivores were more often observed. The earliest start date was the 22nd of July and the latest finish date was the 12th of August. Transects were carried out by car through the valleys of our study area (Figure 1) three times a day: during the morning starting approximately 15 min before sunrise (7 a.m.–10:30 a.m. approx.), through the afternoon, finishing approximately 15 min after sunset (6 p.m.–9:30 p.m. approx.), and at night (11 p.m.–12:30 a.m. approx.) until past midnight. In 2016, transects at midday (11 a.m.–11:15 p.m. approx.) were also carried out, but after confirming that the probability of observing mesocarnivores was very low, sampling in this time period was discarded in the following years.
Transects were carried out by 2–3 observers. Each diurnal transect was 53 km long, which was sampled twice, one going from the starting point and one coming back. Starting points were set at different parts of the study area each day to avoid possible biases related to being in the same location at the same time. Starting points were at the bottom (San Felices), middle (San Salvador) and top (Areños) of the study area (Figure 1). Night transects were a section of diurnal transect of 12.6 km in the Castillería Valley and the starting point was always San Felices (Figure 1). At night, flashlights were used to detect animals on the pastures. During transects, when coming back along a road already surveyed, we did not record animals that were observed in the same locations. All transects were carried out at between 20 and 30 km/h when driving by pasture fields where animals were observed and at 50–60 km/h in other areas during daylight transects, and at between 10–20 km/h during the night transects when driving by pasture fields.
When an animal was observed in the field, 8 × 40 binoculars and a telescope (Leica Ultravid 20–60×) were used to correctly identify it. Furthermore, animals were photographed and/or filmed using a bridge camera (Canon EOS 7D Mark II or Nikon Coolpix P700). If after photographic analysis the identification of the animal was impossible (this only happened in night transects), the observation was discarded. Additionally, to properly distinguish between domestic cats and European wildcats, we used the coat pattern traditionally described and accepted for the European wildcat [35].
The dataset used in this study also included 20 sightings carried out in the study area but not during censuses, 5 in 2016 and 15 in 2017, as they contained valuable information on sites used in pastures by the carnivores studied that could aid the aim of this study.
An index of abundance or potential prey for three studied species was obtained for the autumns of 2016, 2017, 2018 and 2019. By far the most abundant fossorial species in pastures of the study area is the montane water vole (Arvicola scherman), but it is possible to find other fossorial small mammals such as European moles (Talpa europaea) and Lusitanian pine voles (Microtus lusitanicus). Each year, 278 100-m-long fixed transects were surveyed during 3–4 consecutive days, between the 30th September and 14th October. When possible, the line of the 100 m transects was parallel to streams or rivers, in order to maintain similar conditions of soil and humidity. Each transect was subdivided into 20 5-m sections where the galleries of three small mammal species (mainly montane water voles, and to a lesser extent European moles and Lusitanian pine voles) were counted. Thus, for each 100-m transect we obtained an index of potential prey abundance ranging from 0 (no gallery in any of the 20 5-m sections) to 1 (galleries in all 20 5-m sections). Since all three carnivore species may consume all potential fossorial small mammal prey [24,25,27], our prey abundance index included all of them. Gallery counts for these small mammal species are a good index of their abundance [36,37,38].

2.3. Selection of Sites on Pastures by Carnivores

Four environmental variables were considered to examine if there were differences in sites on pastures selected by the studied species. These variables were distances to (1) streams, (2) urban settlements or isolated buildings, (3) paved roads and (4) forest edges. Digitized 1:10,000 maps for the year 2015 were obtained from the Castilla y León SDI website (cartografia.jcyl.es) to calculate distance to rivers and streams, urban settlements and isolated buildings and to paved roads in our study area. To calculate the distance to forest edges, 2014 Castilla y León SIOSE (cartografia.jcyl.es) was used. The information these layers provided was compared, rectified and complemented using the most recent aerial orthophotography provided by the PNOA (pnoa.ign.es) for our study area before carrying out any calculations. Only streams that provided vegetation cover were considered, as we wanted to test their function as potential refuge sites. Forest cover area had to be patches of at least one hectare to be considered for analysis. QGIS 3.4 [39] was used to analyze the layers and to obtain the measurements for the different environmental variables.
To determine if the studied species were selecting some area of the pastures, we generated random points within the effective sampling area and measured distances from these points to streams, forests, buildings and paved roads, and compared this with the observed data. The effective sampling area was the area within visible pastures and up to a distance of 500 m from our transect line. The 500 m limit from the transect line was chosen after checking that 99% of carnivores sighted during censuses were within this distance from the censusing line. We obtained a set of 525 points within the effective sampling area where the distance from each point to the different environmental features previously mentioned was also measured.
To test whether each species used the different parts of the pastures in a random manner, we compared the observed distances to each environmental feature with these expected distances corresponding to the randomly generated points. For this purpose, means and 95% confidence intervals of distances to streams, forests, paved roads and buildings were calculated for every year and species, and for the random points, and were compared to test for significant differences. Prior to the calculations of the confidence intervals, observed data were Box Cox transformed to correct for non-normality. Data were then inversely transformed for a clearer interpretation.

2.4. Spatial Segregation among Carnivores

To examine some actual possible spatial segregation among the three studied carnivore species, we first compared distance between species pairs using Wilcoxon tests for each study year. The distances between each sighting of a given species to its closest sighting of the other species were measured. Secondly, we followed a similar simulation procedure to that used by Palomares et al. (2017) with jaguars and pumas [40]. We established a 100 × 100 m grid to check if observations of two different species fell into the same cells. The grid size was set at 100 m, as we considered this distance was safe for individuals to avoid dangerous interactions, and because a lower grid size could also be affected by errors when estimating the location of animals sighted during censusing. The overlap of cells with the two species was calculated (percentage of cells with both species, in relation to the total cells that had at least one species detected). To test if there was a possible attraction, repulsion or indifference in the sites used within pastures by each pair of carnivores, we randomized the position of the observed animals, and again estimated the percentage of co-occurrence in the 100 m grid. We repeated this procedure 1000 times and compared results (mean overlap and 95% CI) with the observed percentages. Higher, lower and similar observed overlapping percentages compared to those obtained by simulations would suggest attraction, avoidance, and indifference, respectively. The grids were created using QGIS and the randomization procedure was carried out using R [41].

2.5. Prey Abundance in Places within Pastures Used by Carnivores

For each year and carnivore species, an index of potential prey abundance was estimated using the prey transect carried out during early autumns. With these analyses we only considered the prey transect closer than 100 m from any sighting of a studied carnivore in each year, in order to measure real prey abundances of the places in pastures where animals were observed. Prey abundance differences between species and years was analyzed using GLMs. As our data were not normally distributed, quasi-Poisson families were used to account for data overdispersion, and post-hoc comparisons were used to check for differences between species and years.

3. Results

A total of 582 observations were collected for domestic cats, European wildcats and red foxes (Table 1). Red foxes were the most often sighted, followed by domestic cats and wildcats (Table 1). We observed the most carnivores in 2016 and fewer in 2018 and 2019 (Table 1). Additionally, most sightings were done during the morning, followed by the evening, night and midday (Table 1). On average, animals were observed at distances of 49 ± 43 m, range = 0–286; 95 ± 76 m, range = 0–342; and 118 ± 91 m, range = 1–603 for domestic cats, European wildcats and foxes, respectively. Four other carnivore species were also observed during censuses (European badger, Meles meles, 33 times; pine marten, Martes martes, 8 times; stone marten, Martes foina, 1 time and wolf, Canis lupus, 6 times). Domestic dogs, Canis familiaris, were also frequently seen, but we did not record them.

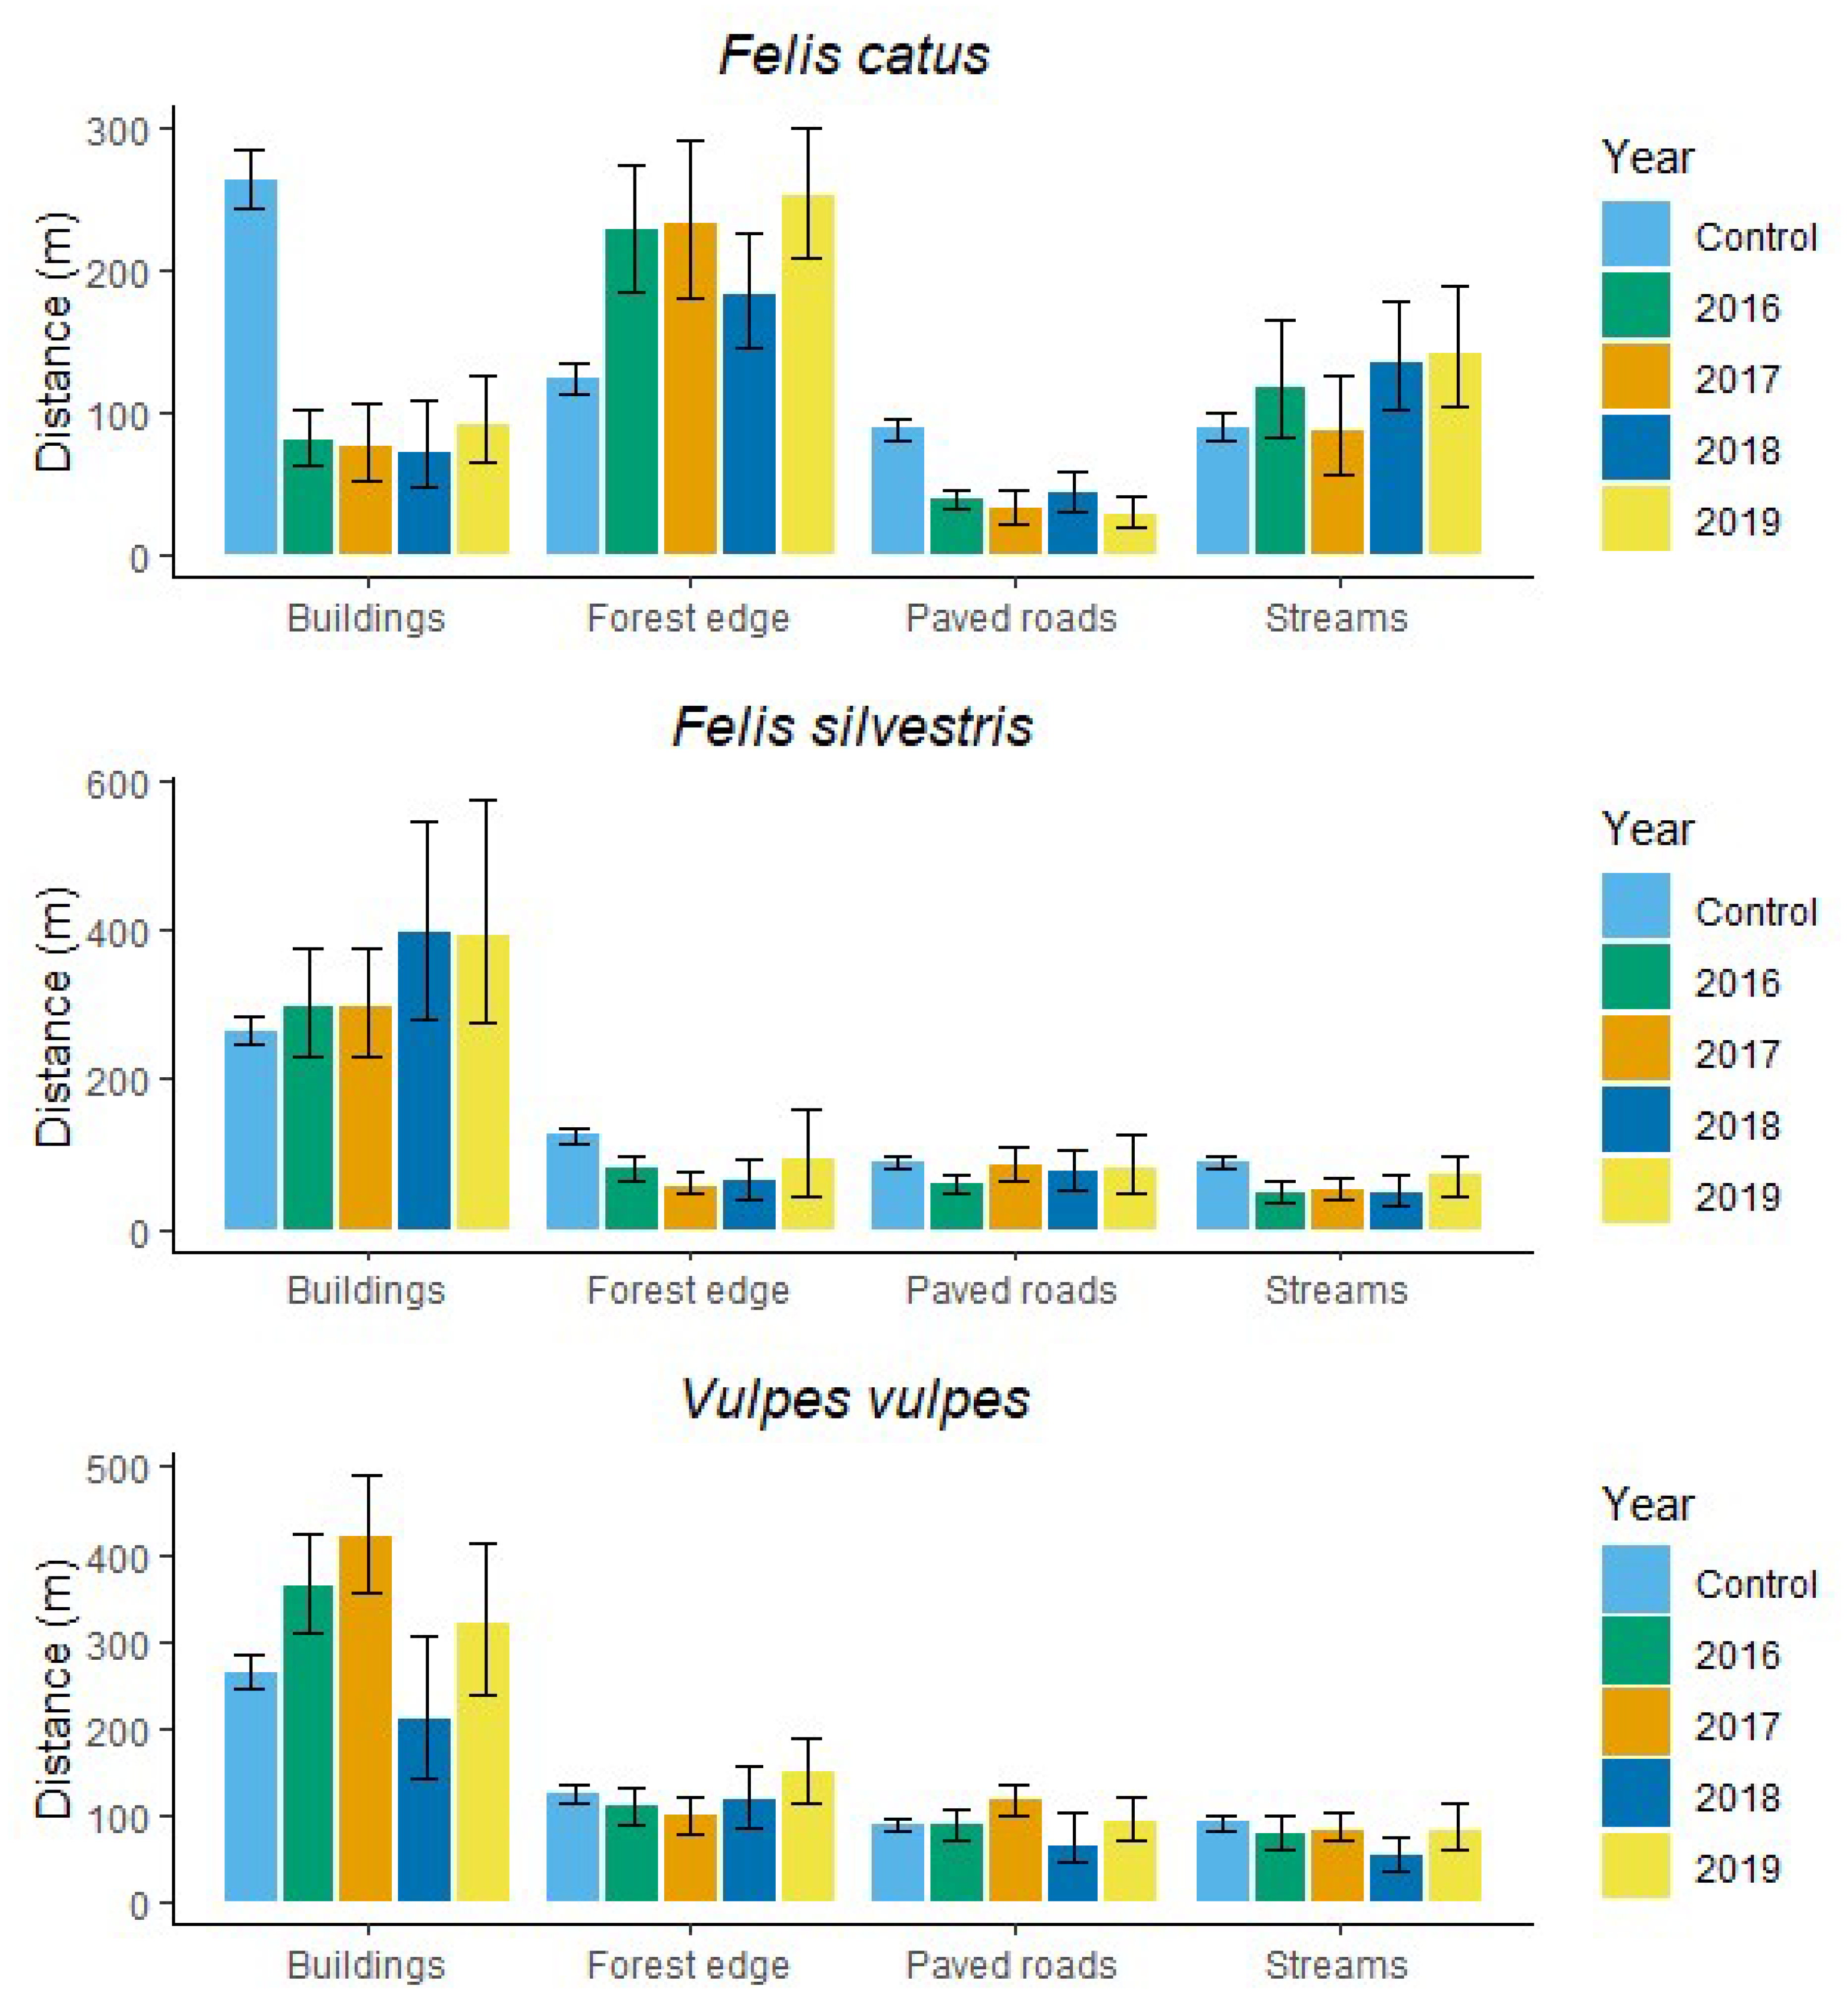
3.1. Selection of Sites within Pastures by Carnivores

The distance of European wildcats to streams and the forest edge was always shorter than the distance obtained from random points in 2016, 2017 and 2018, and was similar in 2019 (Table 2, Figure 2). In comparison, the distance to paved roads and buildings was as expected for all years except the distance to roads in 2016, which was closer than expected (Table 2, Figure 2). Trends in 2019 were the same as in previous years, but the 95% CI between observed and random points overlapped due to the low number of European wildcat observations in that year.
Domestic cats were always sighted closer than expected to paved roads and buildings and further than expected from forest edges (Table 2, Figure 2 and Figure 3), whereas the distance to streams varied from as expected in 2016 and 2017 to further than expected in 2018 and 2019 (Table 2, Figure 2).
Finally, the distance of red foxes to forest edges, streams and paved roads was always as expected, except in 2017 when the distance to paved roads was greater than expected, and in 2018 when the distance to streams was shorter than expected (Table 2, Figure 2 and Figure 3). Similarly, the distance to buildings changed from greater than expected in 2016 and 2017 to as expected for the other two years (Table 2, Figure 2).

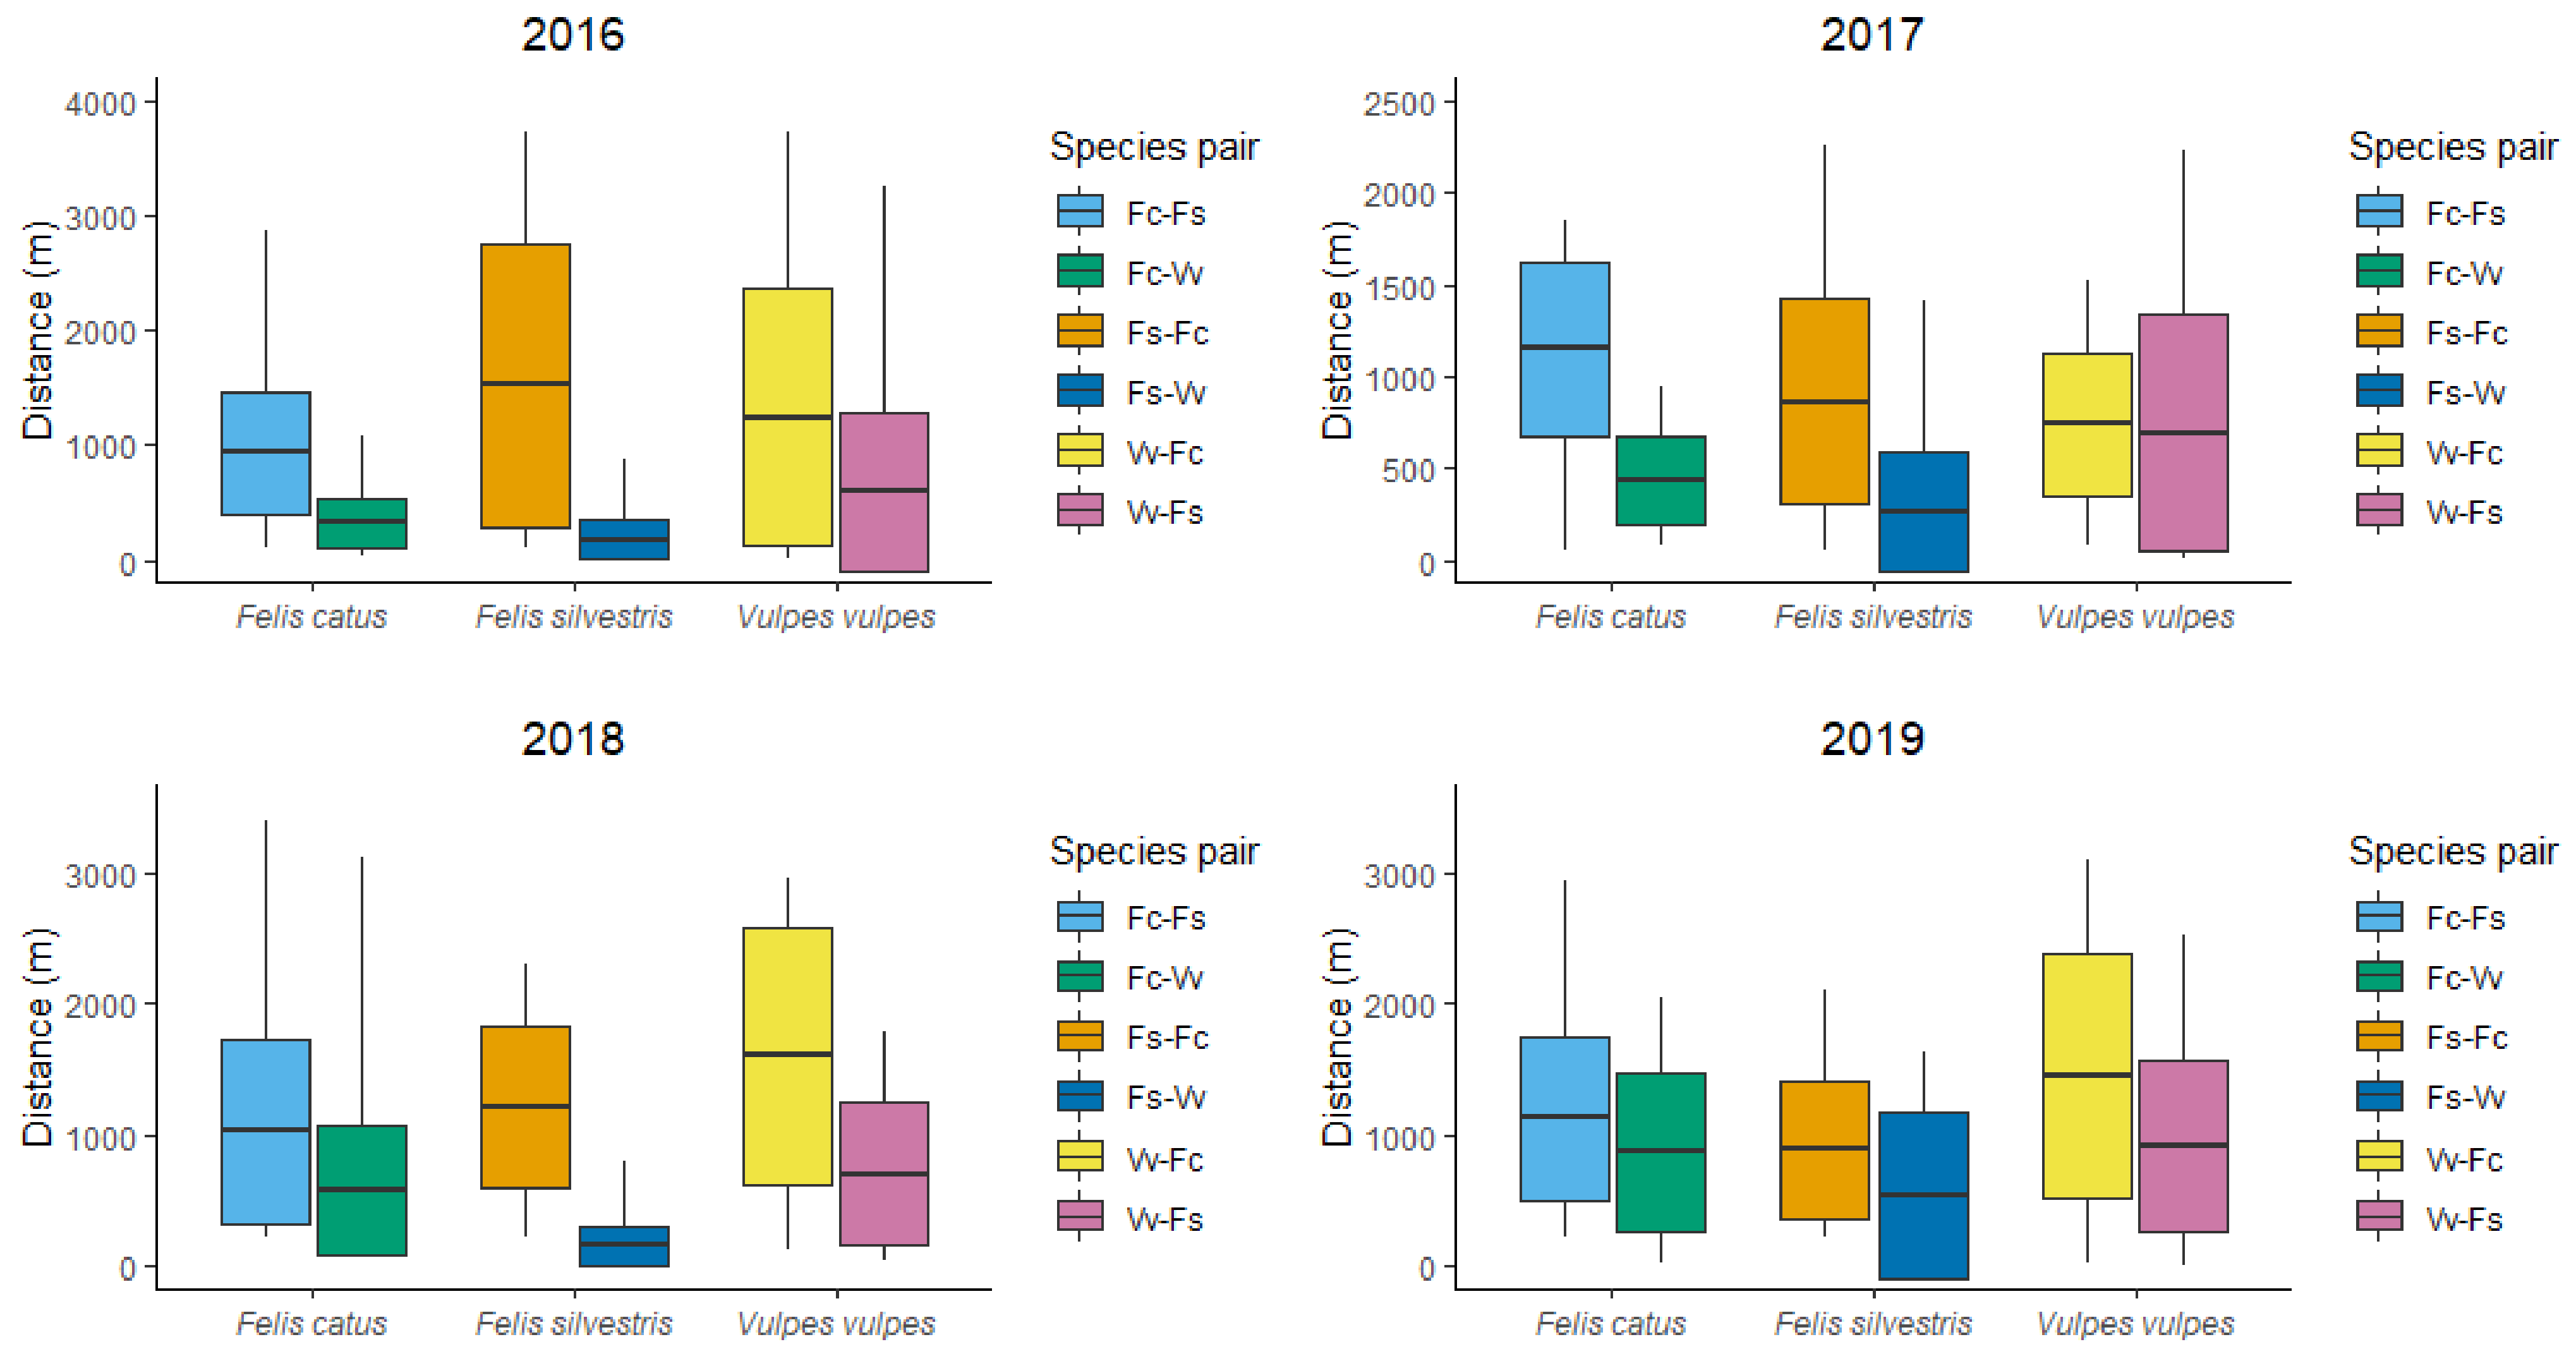
3.2. Spatial Segregation among Carnivores

Comparisons between the closest distance analyses of one species to the other two were all significant, except between distances among domestic cats with red foxes and European wildcats, and distances among European wildcats with red foxes and domestic cats, both in 2019, although differences in these cases approached significance (Table 3, Figure 4). The greatest distance was observed between red foxes and domestic cats, whereas the shortest was observed between European wildcats and red foxes, both in 2018 (Table 3, Figure 4).
The results of the species overlap analyses revealed 0% observed overlap between domestic cats and European wildcats every year, as well as between domestic cats and red foxes for all years except 2016 (Table 4). Observed overlap between European wildcats and red foxes was lower than 7% every year (Table 4). On the other hand, simulated overlaps ranged from 19% to 39%, significantly higher than those observed, which suggests all species pairs showed strong spatial segregation during all study years (Table 4).

3.3. Prey Abundance within Pasture Areas Used by Carnivores

A total of 360 sightings within 100 m of prey transects were compared to test for differences in prey availability for each species during the study. Overall, 126 observations corresponded to domestic cats (ranging between 19 and 56 by year), whereas 95 observations corresponded to European wildcats (range = 7–48 by year) and 139 to red foxes (range = 16–53 by year).
No significant differences in prey abundance were detected between sites where each carnivore species was observed (F = 0.911, p = 0.403), whereas there were significant differences among years of sampling (F = 18.736, p < 0.001).

4. Discussion

Road transects proved to be a useful methodology to get a good number of observations of our target species in the study area, because they allowed us to cover a large area in a relatively small amount of time. Nevertheless, with this method there was a possibility of misidentification of animals, mainly between wild and domestic cats, and the method obviously only allowed us to make inferences on the behavior of the target species on the pastures. In our experience, misidentification of animals was very low for several reasons: (1) most observations (99%) were closer than 500 m from observers, we used binoculars and a telescope to see animals and we took photographs of them for proper identification; (2) most domestic cats had coat patterns and colors very different from wildcats, and as rule they were observed close to buildings and roads (see Figure 2 and Figure 3); (3) in the few cases where the attempt to distinguish between species was compromised (all of them during the night), we discarded those observations.

4.1. Sites Selected in Pastures

Our analysis confirmed different uses of the pastures by the studied species. European wildcats preferred areas in pastures closer to streams and forest edges. Other studies [42,43,44] that focused on the spatial distribution of European wildcats, regardless of habitat type, also found that they preferred to stay near streams and forest edges. Stream vegetation and forest edges provide enough shelter cover for hiding and favorable resting places [45,46]. In addition, riparian and edge habitats, as well as agricultural areas near streams, provide a higher abundance of small mammals such as water voles (Arvicola terrestris) [47,48,49], which benefit the wildcat [50]. Although our study areas were pastures instead of croplands, a similar interpretation could be extrapolated. Our results are consistent with the findings of Recio et al. (2015) showing that higher wildcat abundance in ex-urban areas was not linked to the presence of isolated buildings but to a mixture of pastures and shrub areas [51], which is a favorable habitat for wildcats [52,53,54]. In opposition to the findings of Klar et al. (2008), our results did not clearly indicate that wildcats avoid buildings and roads, but rather that they appear indifferent to them [43]. This could be due to the fact that we calculated distance to buildings without differentiating between isolated buildings and human settlements. Klar et al. (2008) did differentiate between the two and found that wildcats were rarely present closer than 900 m from settlements, but were found as close as 200 m away from isolated buildings [43]. Our results show intermediate values (Table 2), which could mean that if analyzed separately, the closer distances would correspond to isolated buildings and the larger distances to human settlements. It is also possible that wildcats prioritized areas close to shelters and with high prey availability, while relegating human disturbances to a secondary position. In the study by Jerosch et al. (2010), several resting sites were found in areas with good shelter and prey availability but very close to forest roads and streets. A lack of preference for any environmental features in the 2019 results could be explained by the small number of European wildcat sightings, which led to larger confidence intervals [46].
Domestic cat preference for pasture areas closer to buildings and paved roads is consistent with other findings in which the activity of this species in rural areas is concentrated around human settlements [31,44,51,55,56]. In such areas, where human activity is higher, domestic cats benefit from humans though obtaining food, shelter and other resources [27,31,57]. Human settlements may also provide protection from other carnivores, which would explain why they avoided areas near forest edges, where resource competition and the likelihood of dangerous encounters with other competitors would be higher [27,58,59].
As a rule, red foxes lacked preference for any pasture areas, and this may be explained by their generalist ecological niche [23,60,61,62]. However, when interpreted in more detail, red fox presence in pasture areas near streams in 2016 and 2018 agrees with the results from Soto and Palomares (2015) where bush density and distance to water were some of the most important predictors in their models [15]. Red foxes, as with many generalists, can take advantage of resources provided by human settlements such as food [63,64], but the red foxes in our study showed an indifference toward or avoidance of buildings. This could be because the pastures and ecotones between streams and forests, rich in small mammals, provide enough food for red foxes, mitigating their need to raid human settlements for food with the associated risks. In Spain, fox hunting is still legal under certain circumstances (Law Decree no. 202/2004), and illegal hunting has been reported in rural areas, which could explain why red foxes avoid human interactions and settlements unless necessary. In addition, other studies [22,65,66] have found that red foxes avoid human settlements, which is consistent with our results for 2016 and 2017.

4.2. Spatial Segregation

The results discussed above regarding the selection of pasture fields suggest spatial segregation between domestic cats and European wildcats. However, it is not clear if there is spatial segregation between red foxes and domestic cats or European wildcats, as red foxes used pasture more generally. However, our more detailed analysis examining spatial segregation between species indicates that clear spatial segregation exists between all species pairs (Table 4).
The red foxes in our study used the pasture fields in a more random manner, probably related to prey availability rather than any other factors [40]. Following the same reasoning, European wildcats and domestic cats would behave in a manner intended to decrease intraguild interactions that could lead to dangerous encounters with red foxes, as foxes are larger and there have been reports of attacks by red foxes on cats and traces of wildcats have been found in the fox diet [25,30,32]. In 2019, we also observed and recorded two red foxes chasing and biting a European wildcat in a pasture field, with the cat able to reach a refuge area in a nearby forest.
The lack of any spatial overlap between red foxes and domestic cats during our study (except in 2016, when a 23% overlap was observed) may be due to avoidance of foxes, and other large predators, by cats. Open areas such as pastures are dangerous for cats as red foxes and domestic dogs frequent these areas as well. These two predators have been observed attacking [29,67], and can chase them more easily in open pastures. Ferreira et al. (2011) found that domestic cats range very far from farmhouses when red foxes are absent, but stay in the surrounding areas when red foxes are present [31]. In addition, wolves (Canis lupus) are common in our study area, and the remains of domestic cats have been found in the diet of Iberian wolves [68,69], which places the wolf, a dominant predator, as another potential threat to cats in pastures. Therefore, pasture areas near buildings may be safe for domestic cats as they offer nearby hiding places when in danger from any potential predators.
Even though the European wildcats in our study clearly spatially avoided red foxes when using pastures, there was some overlap in observation of these species. This could be explained by their similar use of pasture areas: both species were indifferent to buildings (except red foxes in 2016 and 2017) and paved roads, and red foxes were seen closer to streams in 2016 and 2017, which European wildcats also favored. However, it is important to keep in mind that data from different transects and days was pooled together each year for the spatial segregation analyses, which means that the observations that accounted for the overlap may have occurred at different times of day or on different days.
Our fine-scale spatial segregation results showed 0% spatial overlap between European wildcats and domestic cats, in contrast with previous studies in which at least some level of spatial overlap was found [44,70,71]. The differences between our study and those of Germain, Benhamou and Poulle (2008) and Beutel et al. (2017) are probably due to the fine scale used in our study compared to their broader scale [44,70]. This lack of overlap could be explained by the fact that both cat species used pastures in a way compatible with the avoidance of other larger predators. Besides avoiding red foxes, recent studies also showed low spatial overlap between European wildcats and wolves in southern Italy [72]. Both cat species use pastures close to sites that offer protection, shelter or hiding areas, but the characteristics of these features differ between the two species. European wildcats use bushes and forests for protection, whereas domestic cats use human infrastructure. Therefore, any overlap between the two species is nearly impossible as long as red foxes and other potential predators are present in the study area. One could theorize that if those predators were absent, European wildcats would still shy away from human settlements. However, domestic cats could venture deeper into the pastures and forests, where the species ranges may overlap [31,44,52]. Interactions of domestic cats and European wildcats could pose a threat to European wildcats due to disease transmission and hybridization. Disease transmission from domestic cats has been suggested as a threat to European wildcats [73], but most diseases present in domestic cats have also been observed endemically in wildcats [26]. Therefore, the role of domestic cats as vectors of diseases for European wildcats is still under discussion. However, there is clear proof of hybridization between European wildcats and domestic cats in countries such as Scotland, France, Hungary and Germany [74,75,76,77]. In the Iberian Peninsula, a low level of introgression has been found in Portugal and even less has been found for Spain [78,79,80]. Hybrids have been observed even in situations with low spatial overlap and few opportunities for breeding [70]. Therefore, a complete lack of spatial overlap between the two species at a fine scale due to interference by other predators may protect European wildcats from these threats. Our study was carried out during the summer and we would expect spatial segregation to be exacerbated in winter, as our study area is characterized by harsh winters with very low temperatures, discouraging domestic cats from leaving buildings, which would prevent hybridization between the species, as suggested by the study on home ranges of wildcats and domestic cats by Germain et al. (2008) [70].
One would expect that the observed spatial segregation among the carnivore species studied results from a trade-off between prey availability and exploitative and/or interference competition. However, we found no significant difference in prey abundance in areas close to where predator species were sighted, and therefore it is not likely that prey abundance explains the observed spatial segregation between species. In situations with very low prey availability, red foxes should monopolize the resource and European wildcats and domestic cats would almost never venture into the pastures looking for prey, instead using forests and households as food sources, respectively. Thus, we hypothesized that the observed spatial segregation among the three species is mainly due to interference competition, where red foxes would be the dominant species using the resource (pastures) somewhat evenly, and European wildcats and domestic cats using pasture areas near potential shelters (forests and riparian vegetation for wildcats, and buildings for domestic cats) to prevent risky interactions with the foxes (and other potential predators).
The spatial use of pastures observed by the studied species does not seem to be conditioned by other mesocarnivore species also detected in the study area (badger, pine marten and stone marten). They were only seen on a few occasions. Furthermore, the badger, which was observed more times, was always seen during the night. Additionally, there is no previous information suggesting that any of these species could influence the presence and/or abundance of the studied species. Thus, the presence in pastures of these other species should not influence the spatial pattern observed during the study of our three target species. However, as discussed earlier, the potential presence of wolves and domestic dogs might partially explain the results found.
To summarize, our fine-scale study highlights clearly different uses of pastures by the three species. European wildcats used areas closer to streams and forest edges, whereas domestic cats used areas closer to paved roads and buildings. Red foxes, however, did not seem to prefer any area of the pastures in a consistent manner. The spatially segregated use of pastures between the three species allowed their coexistence in the same area, probably aided by a high potential prey abundance. Red foxes appeared to be the dominant species over European wildcats and domestic cats. At a small scale, domestic cats and European wildcats in MPNP showed no spatial overlap, and we hypothesize that this may be due to the presence of red foxes (and perhaps dogs and wolves as well) in pastures, which alleviates concerns related to the threats that domestic cats represent for European wildcats, as frequent interactions between the two species are unlikely. We suggest studies on temporal and spatial segregation during different times of year to further understand intraguild interactions and resource partitioning within the mesocarnivore community in MPNP. This could also help dissipate any concerns about interactions between European wildcats and domestic cats.

Author Contributions

Conceptualization, F.P., F.U., F.J. and J.R.; methodology, F.P., F.U., F.J. and J.R.; validation, F.P.; formal analysis, A.R.; investigation, A.R., F.P., F.U., F.J., J.R. and E.R.; resources, F.P., F.U., F.J., J.R. and E.R.; data curation, A.R., F.P., F.U., F.J., J.R. and E.R.; writing—original draft preparation, A.R.; writing—review and editing, A.R. and F.P.; visualization, A.R. and F.P.; supervision, F.P.; funding acquisition, F.U., F.J. and F.P.; project administration, F.U., F.J. and F.P. All authors have read and agreed to the published version of the manuscript.

Funding

This study was partially supported by M. Torres Diseños Industriales SAU, Jaguar Land Rover España and by the Agencia Estatal de Investigación from the Ministry of Economy, Industry and Competitiveness, Spain (project CGL2017-83045-R AEI/FEDER EU, co-financed with FEDER Funds).

Acknowledgments

We are very grateful to Laura Benito, Juan Ángel de la Torre, Alberto Pezonaga and Gema Ruiz for helping during fieldwork, to David Aragonés for helping with QGIS and to Alicia Delgado for her support during the study. Regarding the ethical code, we never were in touch or carried out any invasive techniques with the animals studied during the field work. It was just observing from the roads into the fields with binoculars. Therefore, we did not need ethical code approval for the study.

Conflicts of Interest

The authors declare no conflict of interest. The funders had no role in the design of the study; in the collection, analyses, or interpretation of data; in the writing of the manuscript, or in the decision to publish the results.

References

  1. Treves, A.; Karanth, K.U. Human-Carnivore Conflict and Perspectives on Carnivore Management Worldwide. Conserv. Biol. 2003, 17, 1491–1499. [Google Scholar] [CrossRef]
  2. Prugh, L.R.; Stoner, C.J.; Epps, C.W.; Bean, W.T.; Ripple, W.J.; Laliberte, A.S.; Brashares, J.S. The Rise of the Mesopredator. BioScience 2009, 59, 779–791. [Google Scholar] [CrossRef]
  3. Roemer, G.W.; Gompper, M.E.; Valkenburgh, B.V.A.N. The Ecological Role of the Mammalian Mesocarnivore. BioScience 2009, 59, 165–173. [Google Scholar] [CrossRef]
  4. Creel, S.; Spong, G.; Creel, N. Interspecific competition and the population biology of extinction-prone carnivores. In Carnivore Conservation; Gittleman, J.L., Funk, S.M., Macdonald, D.W., Wayne, R.K., Eds.; Cambridge University Press: Cambridge, UK, 2001; pp. 35–60. [Google Scholar]
  5. Polis, G.A.; Myers, C.A.; Holt, R.D. The Ecology and Evolution of Intraguild Predation: Potential Competitors that Eat Each Other. Annu. Rev. Ecol. Syst. 1989, 20, 297–330. [Google Scholar] [CrossRef]
  6. Palomares, F.; Caro, T.M. Interspecific killing among mammalian carnivores. Am. Nat. 1999, 153, 492–508. [Google Scholar] [CrossRef]
  7. Vanak, A.T.; Fortin, D.; Thaker, M.; Ogden, M.; Owen, C.; Greatwood, S.; Slotow, R. Moving to stay in place: Behavioral mechanisms for coexistence of African large carnivores. Ecology 2013, 94, 2619–2631. [Google Scholar] [CrossRef]
  8. Hunter, J.S.; Durant, S.M.; Caro, T.M. To flee or not to flee: Predator avoidance by cheetahs at kills. Behav. Ecol. Sociobiol. 2007, 61, 1033–1042. [Google Scholar] [CrossRef]
  9. Rostro-García, S.; Kamler, J.F.; Hunter, L.T.B. To kill, stay or flee: The effects of lions and landscape factors on habitat and kill site selection of cheetahs in South Africa. PLoS ONE 2015, 10, e0117743. [Google Scholar] [CrossRef] [Green Version]
  10. Schoener, T.W. Resource partitioning in ecological communities. Science 1974, 185, 27–39. [Google Scholar] [CrossRef]
  11. Karanth, K.U.; Sunquist, M.E. Prey Selection by Tiger, Leopard and Dhole in Tropical Forests. J. Anim. Ecol. 1995, 64, 439–450. [Google Scholar] [CrossRef]
  12. Durant, S.M. Competition refuges and coexistence: An example from Serengeti carnivores. J. Anim. Ecol. 1998, 67, 370–386. [Google Scholar] [CrossRef] [Green Version]
  13. Monterroso, P.; Alves, P.C.; Ferreras, P. Plasticity in circadian activity patterns of mesocarnivores in Southwestern Europe: Implications for species coexistence. Behav. Ecol. Sociobiol. 2014, 68, 1403–1417. [Google Scholar] [CrossRef] [Green Version]
  14. Hemami, M.R.; Watkinson, A.R.; Dolman, P.M. Habitat selection by sympatric muntjac (Muntiacus reevesi) and roe deer (Capreolus capreolus) in a lowland commercial pine forest. For. Ecol. Manag. 2004, 194, 49–60. [Google Scholar] [CrossRef]
  15. Soto, C.; Palomares, F. Coexistence of sympatric carnivores in relatively homogeneous Mediterranean landscapes: Functional importance of habitat segregation at the fine-scale level. Oecologia 2015, 179, 223–235. [Google Scholar] [CrossRef] [PubMed]
  16. Blondel, J. The “design” of Mediterranean landscapes: A millennial story of humans and ecological systems during the historic period. Hum. Ecol. 2006, 34, 713–729. [Google Scholar] [CrossRef]
  17. Schuette, P.; Wagner, A.P.; Wagner, M.E.; Creel, S. Occupancy patterns and niche partitioning within a diverse carnivore community exposed to anthropogenic pressures. Biol. Conserv. 2013, 158, 301–312. [Google Scholar] [CrossRef] [Green Version]
  18. Marzluff, J.M. Worldwide urbanization and its effects on birds. In Avian Ecology and Conservation in an Urbanizing World; Marzluff, J.M., Bowman, R., Donnelly, R., Eds.; Springer: Boston, MA, USA, 2001; pp. 19–47. [Google Scholar]
  19. Fraterrigo, J.M.; Wiens, J.A. Bird communities of the Colorado Rocky Mountains along a gradient of exurban development. Landsc. Urban Plan. 2005, 71, 263–275. [Google Scholar] [CrossRef]
  20. Levin, S.A. Dispersion and population interactions. Am. Nat. 1974, 108, 207–228. [Google Scholar] [CrossRef]
  21. Rosenzweig, M.L.; Abramsky, Z.; Brand, S. Estimating species interactions in heterogeneous environments. Oikos 1984, 43, 329–340. [Google Scholar] [CrossRef]
  22. Pereira, P.; Alves da Silva, A.; Alves, J.; Matos, M.; Fonseca, C. Coexistence of carnivores in a heterogeneous landscape: Habitat selection and ecological niches. Ecol. Res. 2012, 27, 745–753. [Google Scholar] [CrossRef]
  23. Amores, F. Diet of the red fox (Vulpes vulpes) in the western Sierra Morena (south Spain). Doñana Acta Vertebr. 1975, 2, 221–229. [Google Scholar]
  24. Biró, Z.; Lanszki, J.; Szemethy, L.; Heltai, M.; Randi, E. Feeding habits of feral domestic cats (Felis catus), wild cats (Felis silvestris) and their hybrids: Trophic niche overlap among cat groups in Hungary. J. Zool. 2005, 266, 187–196. [Google Scholar] [CrossRef]
  25. Hartová-Nentvichová, M.; Šálek, M.; Červený, J.; Koubek, P. Variation in the diet of the red fox (Vulpes vulpes) in mountain habitats: Effects of altitude and season. Mamm. Biol. 2009, 75, 334–340. [Google Scholar] [CrossRef]
  26. Lozano, J.; Malo, A. Conservation of the European Wildcat (Felis silvestris) in Mediterranean Environments: A Reassessment of Current Threats. In Mediterranean Ecosystems: Dynamics, Management and Conservation; Nova Science Publisher’s, Inc.: Hauppauge, NY, USA, 2012; pp. 1–31. ISBN 978-1-61209-146-4. [Google Scholar]
  27. Széles, G.L.; Purger, J.J.; Molnár, T.; Lanszki, J. Comparative analysis of the diet of feral and house cats and wildcat in Europe. Mammal Res. 2018, 63, 43–53. [Google Scholar] [CrossRef]
  28. Román, J.; Fermín, U.; Jubete, F.; Revilla, E.; Palomares, F. Definiendo el Hábitat de la Rata Topera (Arvicola Scherman) en la Cordillera Cantábrica. Presented at the XIII Congreso SECEM, Guadalajara, Spain, 6–9 December 2017. [Google Scholar]
  29. Risbey, D.A.; Calver, M.C.; Short, J.; Bradley, J.S.; Wright, I.W. The impact of cats and foxes on the small vertebrate fauna of Heirisson Prong, Western Australia. II. A field experiment. Wildl. Res. 2000, 27, 223–235. [Google Scholar] [CrossRef] [Green Version]
  30. Bakaloudis, D.; Bontzorlos, V.; Vlachos, C.; Papakosta, M.; Chatzinikos, E.; Braziotis, S.; Kontsiotis, V. Factors affecting the diet of the red fox (Vulpes vulpes) in a heterogeneous Mediterranean landscape. Turk. J. Zool. 2015, 39. [Google Scholar] [CrossRef] [Green Version]
  31. Ferreira, J.P.; Leitão, I.; Santos-Reis, M.; Revilla, E. Human-related factors regulate the spatial ecology of domestic cats in sensitive areas for conservation. PLoS ONE 2011, 6. [Google Scholar] [CrossRef] [Green Version]
  32. Molsher, R.L. The Ecology of Feral Cats, Felis catus, in Open Forest in New South Wales: Interactions with Food Resources and Foxes; School of Biological Sciences, University of Sydney: Sydney, NSW, Australia, 1999. [Google Scholar]
  33. Martínez, S.R.; Arregui, J.J.L. Bioclimatology of the Iberian peninsula. Itinera Geobot. 1999, 13, 41–47. [Google Scholar]
  34. Ortega Villazán, M.T.; Morales Rodríguez, C. El Clima de la Cordillera Cantábrica Castellano-Leonesa: Diversidad, Contrastes y Cambios. Investig. Geográficas 2015, 63, 45–67. [Google Scholar] [CrossRef] [Green Version]
  35. Stahl, P.R.; Léger, F. Le Chat Sauvage d’Europe:(Felis silvestris Schreber, 1777); Société Française pour L’étude et la Protection des Mammifères: Pezenas, France, 1992. [Google Scholar]
  36. Mead-Briggs, A.; Woods, J. An index of activity to assess the reduction in mole numbers caused by control measures. J. Appl. Ecol. 1973, 10, 837–845. [Google Scholar] [CrossRef]
  37. Giraudoux, P.; Pradier, B.; Delattre, P.; Deblay, S.; Salvi, D.; Defaut, R. Estimation of water vole abundance by using surface indices. Acta Theriol. 1995, 40, 77. [Google Scholar] [CrossRef] [Green Version]
  38. Santos, S.M.; Mira, A.P.; Mathias, M.L. Using presence signs to discriminate between similar species. Integr. Zool. 2009, 4, 258–264. [Google Scholar] [CrossRef] [PubMed] [Green Version]
  39. QGIS Development Team. QGIS Geographic Information System; QGIS. 2009. Available online: https://www.qgis.org/en/site/ (accessed on 18 May 2020).
  40. Palomares, F.; Adrados, B.; Zanin, M.; Silveira, L.; Keller, C. A non-invasive faecal survey for the study of spatial ecology and kinship of solitary felids in the Viruá National Park, Amazon Basin. Mammal Res. 2017, 62, 241–249. [Google Scholar] [CrossRef] [Green Version]
  41. R Core Team. R: A Language and Environment for Statistical Computing; R Foundation for Statistical Computing: Vienna, Austria, 2013. [Google Scholar]
  42. Jerosch, S.; Kramer-Schadt, S.; Götz, M.; Roth, M. The importance of small-scale structures in an agriculturally dominated landscape for the European wildcat (Felis silvestris silvestris) in central Europe and implications for its conservation. J. Nat. Conserv. 2018, 41, 88–96. [Google Scholar] [CrossRef]
  43. Klar, N.; Fernández, N.; Kramer-Schadt, S.; Herrmann, M.; Trinzen, M.; Büttner, I.; Niemitz, C. Habitat selection models for European wildcat conservation. Biol. Conserv. 2008, 141, 308–319. [Google Scholar] [CrossRef] [Green Version]
  44. Beutel, T.; Reineking, B.; Tiesmeyer, A.; Nowak, C.; Heurich, M. Spatial patterns of co-occurrence of the European wildcat Felis silvestris silvestris and domestic cats Felis silvestris catus in the Bavarian Forest National Park. Wildl. Biol. 2017, 2017, wlb.00284. [Google Scholar] [CrossRef] [Green Version]
  45. Wittmer, H.U. Home range size, movements, and habitat utilization of three male European wildcats (Felis silvestris Schreber, 1777) in Saarland and Rheinland-Pfalz (Germany). Mamm. Biol. Z. Saugetierkd. 2001, 66, 365–370. [Google Scholar]
  46. Jerosch, S.; Götz, M.; Klar, N.; Roth, M. Characteristics of diurnal resting sites of the endangered European wildcat (Felis silvestris silvestris): Implications for its conservation. J. Nat. Conserv. 2010, 18, 45–54. [Google Scholar] [CrossRef]
  47. Doyle, A.T. Use of riparian and upland habitats by small mammals. J. Mammal. 1990, 71, 14–23. [Google Scholar] [CrossRef]
  48. Osbourne, J.D.; Anderson, J.T.; Spurgeon, A.B. Effects of habitat on small-mammal diversity and abundance in West Virginia. Wildl. Soc. Bull. 2005, 33, 814–822. [Google Scholar] [CrossRef]
  49. Sullivan, T.P.; Sullivan, D.S. Plant and small mammal diversity in orchard versus non-crop habitats. Agric. Ecosyst. Environ. 2006, 116, 235–243. [Google Scholar] [CrossRef]
  50. Dieterlen, F. Schermaus (Ostschermaus, Große Wühlmaus) Arvicola terrestris (Linnaeus, 1758). In Die Säugetiere Baden-Württembergs; Eugen Ulmer: Stuttgart, Germany, 2005; pp. 328–341. [Google Scholar]
  51. Recio, M.R.; Arija, C.M.; Cabezas-Díaz, S.; Virgós, E. Changes in Mediterranean Mesocarnivore Communities along Urban and Ex-Urban Gradients. Curr. Zool. 2015, 61, 793–801. [Google Scholar] [CrossRef] [Green Version]
  52. Easterbee, N.; Hepburn, L.V.; Jefferies, D.J. Survey of the Status and Distribution of the Wildcat in Scotland, 1983–1987; Nature Conservancy Council for Scotland: Edinburgh, Scotland, 1991.
  53. Lozano, J.; Virgós, E.; Malo, A.F.; Huertas, D.L.; Casanovas, J.G. Importance of scrub-pastureland mosaics for wild-living cats occurrence in a Mediterranean area: Implications for the conservation of the wildcat (Felis silvestris). Biodivers. Conserv. 2003, 12, 921–935. [Google Scholar] [CrossRef]
  54. Silva, A.P.; Kilshaw, K.; Johnson, P.J.; MacDonald, D.W.; Rosalino, L.M. Wildcat occurrence in Scotland: Food really matters. Divers. Distrib. 2013, 19, 232–243. [Google Scholar] [CrossRef]
  55. Goszczyński, J.; Krauze, D.; Gryz, J. Activity and exploration range of house cats in rural areas of central Poland. Folia Zool. 2009, 58, 363–371. [Google Scholar]
  56. Krauze-Gryz, D.; Gryz, J.B.; Goszczyński, J.; Chylarecki, P.; Zmihorski, M. The good, the bad, and the ugly: Space use and intraguild interactions among three opportunistic predators—Cat (Felis catus), dog (Canis lupus familiaris), and red fox (Vulpes vulpes)—Under human pressure. Can. J. Zool. 2012, 90, 1402–1413. [Google Scholar] [CrossRef] [Green Version]
  57. Fitzgerald, B.M. Diet of domestic cats and their impact on prey populations. In Domestic Cat: The Biology of Its Behavior; Turner, D.C., Bateson, P., Eds.; Cambridge University Press: Cambridge, UK, 1988. [Google Scholar]
  58. Woods, M.; McDonald, R.A.; Harris, S. Predation of wildlife by domestic cats Felis catus in Great Britain. Mammal Rev. 2003, 33, 174–188. [Google Scholar] [CrossRef] [Green Version]
  59. Crooks, K. Relative Sensitivities of Mammalian Carnivores to Habitat Fragmentation. Conserv. Biol. 2002, 16, 488–502. [Google Scholar] [CrossRef]
  60. Pyšková, K.; Kauzál, O.; Storch, D.; Horáček, I.; Pergl, J.; Pyšek, P. Carnivore distribution across habitats in a central-European landscape: A camera trap study. ZooKeys 2018, 770, 227–246. [Google Scholar] [CrossRef]
  61. Cavallini, P.; Lovari, S. Environmental factors influencing the use of habitat in the red fox, Vulpes vulpes. J. Zool. 1991, 223, 323–339. [Google Scholar] [CrossRef]
  62. Delibes-Mateos, M.; Fernandez De Simon, J.; Villafuerte, R.; Ferreras, P. Feeding responses of the red fox (Vulpes vulpes) to different wild rabbit (Oryctolagus cuniculus) densities: A regional approach. Eur. J. Wildl. Res. 2008, 54, 71–78. [Google Scholar] [CrossRef]
  63. Harris, S. An estimation of the number of foxes (Vulpes vulpes) in the city of Bristol, and some possible factors affecting their distribution. J. Appl. Ecol. 1981, 18, 455–465. [Google Scholar] [CrossRef]
  64. Sorace, A.; Gustin, M. Distribution of generalist and specialist predators along urban gradients. Landsc. Urban Plan. 2009, 90, 111–118. [Google Scholar] [CrossRef]
  65. Červinka, J.; Drahníková, L.; Kreisinger, J.; Šálek, M. Effect of habitat characteristics on mesocarnivore occurrence in urban environment in the Central Europe. Urban Ecosyst. 2014, 17, 893–909. [Google Scholar] [CrossRef]
  66. Alexandre, M.; Hipólito, D.; Ferreira, E.; Fonseca, C.; Rosalino, L.M. Humans do matter: Determinants of red fox (Vulpes vulpes) presence in a western Mediterranean landscape. Mamm. Res. 2020, 65, 203–214. [Google Scholar] [CrossRef]
  67. Baker, P.J.; Soulsbury, C.D.; Iossa, G.; Harris, S. Domestic cat (Felis catus) and domestic dog (Canis familiaris). In Urban Carnivores, Ecology, Conflict, and Conservation; Gehrt, S.D., Riley, S.P.D., Cypher, B.L., Eds.; John Hopkins University Press: Baltimore, MD, USA, 2010; pp. 157–172. ISBN 978-0-8018-9389-6. [Google Scholar]
  68. Figueiredo, A.M.; Valente, A.M.; Barros, T.; Carvalho, J.; Silva, D.A.M.; Fonseca, C.; de Carvalho, L.M.; Torres, R.T. What does the wolf eat? Assessing the diet of the endangered Iberian wolf (Canis lupus signatus) in northeast Portugal. PLoS ONE 2020, 15, 1–15. [Google Scholar] [CrossRef]
  69. Barja, I. Prey and Prey-Age Preference by the Iberian Wolf Canis Lupus Signatus in a Multiple-Prey Ecosystem. Wildl. Biol. 2009, 15, 147–154. [Google Scholar] [CrossRef]
  70. Germain, E.; Benhamou, S.; Poulle, M.L. Spatio-temporal sharing between the European wildcat, the domestic cat and their hybrids. J. Zool. 2008, 276, 195–203. [Google Scholar] [CrossRef]
  71. Gil-Sánchez, J.M.; Jaramillo, J.; Barea-Azcón, J.M. Strong spatial segregation between wildcats and domestic cats may explain low hybridization rates on the Iberian Peninsula. Zoology 2015, 118, 377–385. [Google Scholar] [CrossRef]
  72. Mori, E.; Bagnato, S.; Serroni, P.; Sangiuliano, A.; Rotondaro, F.; Marchianò, V.; Cascini, V.; Poerio, L.; Ferretti, F. Spatiotemporal mechanisms of coexistence in an European mammal community in a protected area of southern Italy. J. Zool. 2020, 310, 232–245. [Google Scholar] [CrossRef]
  73. Nowell, K.; Jackson, P. Wild Cats: Status Survey and Conservation Action Plan; IUCN: Gland, Switzerland, 1996; Volume 382. [Google Scholar]
  74. Beaumont, M.; Barratt, E.M.; Gottelli, D.; Kitchener, A.C.; Daniels, M.J.; Pritchard, J.K.; Bruford, M.W. Genetic diversity and introgression in the Scottish wildcat. Mol. Ecol. 2001, 10, 319–336. [Google Scholar] [CrossRef] [PubMed] [Green Version]
  75. Lecis, R.; Pierpaoli, M.; Birò, Z.S.; Szemethy, L.; Ragni, B.; Vercillo, F.; Randi, E. Bayesian analyses of admixture in wild and domestic cats (Felis silvestris) using linked microsatellite loci. Mol. Ecol. 2006, 15, 119–131. [Google Scholar] [CrossRef] [PubMed]
  76. Hertwig, S.T.; Schweizer, M.; Stepanow, S.; Jungnickel, A.; Böhle, U.R.; Fischer, M.S. Regionally high rates of hybridization and introgression in German wildcat populations (Felis silvestris, Carnivora, Felidae). J. Zool. Syst. Evol. Res. 2009, 47, 283–297. [Google Scholar] [CrossRef]
  77. O’Brien, J.; Devillard, S.; Say, L.; Vanthomme, H.; Léger, F.; Ruette, S.; Pontier, D. Preserving genetic integrity in a hybridising world: Are European Wildcats (Felis silvestris silvestris) in eastern France distinct from sympatric feral domestic cats? Biodivers. Conserv. 2009, 18, 2351–2360. [Google Scholar] [CrossRef]
  78. Ruiz-García, M.; García-Perea, R.; García, F.J.; Guzmán, J. Primeros resultados sobre el análisis genético de poblaciones españolas de gato montés (Felis silvestris) y su posible hibridación con gatos domésticos (Felis catus). Presented at the V Jornadas SECEM, Vitoria, Spain, 3–5 October 2001. [Google Scholar]
  79. Oliveira, R.; Godinho, R.; Randi, E.; Ferrand, N.; Alves, P.C. Molecular analysis of hybridisation between wild and domestic cats (Felis silvestris) in Portugal: Implications for conservation. Conserv. Genet. 2008, 9, 1–11. [Google Scholar] [CrossRef]
  80. Oliveira, R.; Godinho, R.; Randi, E.; Alves, P.C. Hybridization versus conservation: Are domestic cats threatening the genetic integrity of wildcats (Felis silvestris silvestris) in Iberian Peninsula? Philos. Trans. R. Soc. B Biol. Sci. 2008, 363, 2953–2961. [Google Scholar] [CrossRef] [PubMed] [Green Version]
Figure 1. Map of the study area in La Pernía Valley (Palencia, Spain), with transect for censusing carnivores (red line), and the three starting points for censuses (see Materials and Methods for details).
Diversity 12 00268 g001
Figure 2. Distance of observed domestic cats, European wildcats, and red foxes to different environmental features in pastures for each study year compared to the distance from random points to these same environmental features (Control). Error bars represent 95% CI.
Diversity 12 00268 g002
Figure 3. Distribution in pastures of domestic cats, European wildcats and red foxes in 2016 (A), 2017 (B), 2018 (C) and 2019 (D) in a central section of the study area. As a rule, dark and cleared areas represent forests and pastures, respectively.
Diversity 12 00268 g003
Figure 4. Mean closest distance between species observed in pastures. The boxes represent Mean ± SD and the lines represent the ranges of values.
Diversity 12 00268 g004
Table 1. Number of domestic cats, European wildcats and red foxes observed each year and during the different periods of the day.
Year Period of the Day
Species2016201720182019TotalMorningMiddayEveningNightTotal
Felis catus63333446176729905176
Felis silvestris515329141476924432147
Vulpes vulpes10087333925991258108259
Total214173969958223213192145582
Table 2. Distance of observed European wildcats, domestic cats and red foxes to different environmental features in pastures for each study year. Distances from random points to these same environmental features are also shown. All results are in meters. Bold results indicate significant differences between observed and random distances.
Distance to
BuildingsForest EdgePaved RoadsStreams
YearsMean95% CIMean 95% CIMean95% CIMean95% CI
SpeciesRandom points264245, 285125115,1358981, 979182, 100
Felis catus20168264, 104229186, 2764033, 4711984, 166
20177754, 108233182, 2933322, 468757, 128
20187349, 109184146, 2274432, 60136102, 180
20199367, 127253209, 3013021, 42143106, 191
Felis silvestris2016297232, 3758164, 1006048, 754834, 67
2017297232, 3765647, 768666, 1105441, 71
2018396282, 5436542, 937654, 1064731, 72
2019392277, 5729243, 1608250, 1257343, 120
Vulpes vulpes2016363308, 42511089, 1338873, 1067759, 98
2017421357, 4929979, 121116100, 1348273, 104
2018210141, 30711784, 1556348, 1025437, 76
2019319240, 416149114, 1909273, 1128259, 113
Table 3. Mean closest distance between species observed in pastures. Comparisons were made between pairs of species taking one as a reference: first domestic cat (Fc), second European wildcat (Fs) and third red fox (Vv). p-values are provided for each comparison. All measurements are in meters.
20162017
SpeciesMean ± SDRangeNp-ValueMean ± SDRangeNp-Value
Fc-Fs932 ± 537107–286163<0.0011152 ± 47257–184533<0.001
Fc-Vv326 ± 21627–107063433 ± 23583–93633
Fs-Fc1524 ± 1232107–373651<0.001859 ± 55856–226253<0.001
Fs-Vv182 ± 16723–87151265 ± 3289–140453
Vv-Fc1248 ± 112810–3729100<0.001739 ± 38783–1529870.044
Vv-Fs598 ± 69221–3258100690 ± 6458–222787
20182019
SpeciesMean ± SDRangeNp-ValueMean ± SDRangeNp-Value
Fc-Fs1025 ± 698223–3385340.0041126 ± 623229–2925460.067
Fc-Vv572 ± 498131–310534866 ± 60326–204246
Fs-Fc1206 ± 613223–229429<0.001889 ± 527229–2100100.056
Fs-Vv154 ± 14727–79629533 ± 6398–162710
Vv-Fc1604 ± 979131–296433<0.0011450 ± 93326–3083390.008
Vv-Fs703 ± 54947–177833913 ± 6538–251239
Table 4. Observed and simulated percentages of spatial segregation in 100 m grids between domestic cats, European wildcats and red foxes in pastures. Simulated data (mean and 95% CI are presented) were obtained from 1000 simulations.
20162017
Species PairsObserved Overlap (%)Simulated Overlap (%)ResultsObserved Overlap (%)Simulated Overlap (%)Results
Felis catus-Felis silvestris038.7; 38.3–39.1Segregation031.9; 31.6–32.2Segregation
Felis catus-Vulpes vulpes2.334.2; 33.9–34.5Segregation025.5; 25.3–25.8Segregation
Felis silvestris-Vulpes vulpes4.839.4; 39.1–39.7Segregation5.434.2; 33.9–34.5Segregation
20182019
Species PairsObserved Overlap (%)Simulated Overlap (%)ResultsObserved Overlap (%)Simulated Overlap (%)Results
Felis catus-Felis silvestris037.1; 36.6–37.6Segregation020; 19.6–20.4Segregation
Felis catus-Vulpes vulpes032.9; 32.4–33.4Segregation033.6; 33.2–34Segregation
Felis silvestris-Vulpes vulpes1.832.6; 32.2–33Segregation6.719.4; 19–19.8Segregation

