Article

Seasonal and Agricultural Response of Acidobacteria Present in Two Fynbos Rhizosphere Soils

Department of Microbiology, Stellenbosch University, Private Bag X1, Stellenbosch 7600, South Africa
*
Author to whom correspondence should be addressed.
Diversity 2020, 12(7), 277; https://doi.org/10.3390/d12070277
Submission received: 27 April 2020 / Revised: 3 July 2020 / Accepted: 6 July 2020 / Published: 10 July 2020

Abstract

:
The Acidobacteria is one of the most abundant phyla in most soil types. Fynbos plants are endemic to South Africa, and these soils provide the ideal habitat for Acidobacteria, because of its low pH and oligotrophic properties. However, little is known about their distribution in the fynbos biome and the impact of cultivation of plants on Acidobacterial diversity. Therefore, the aim of this study was to determine the effect of seasonal changes and cultivation on the relative abundance and diversity of Acidobacteria associated with Aspalathus linearis (rooibos) and Cyclopia spp. (honeybush). This study was based on rhizosphere soil. A total of 32 and 31 operational taxonomic units (OTUs) were identified for honeybush and rooibos, respectively. The majority of these were classified as representatives of subdivisions 1, 2, 3, and 10. Significant differences in community compositions were observed between seasons for both honeybush and rooibos, as well as between the cultivated and uncultivated honeybush. Acidobacteria had a significantly positive correlation with pH, C, Ca2+, and P. In this study, we have shown the effect of seasonal changes, in summer and winter, and cultivation farming on the relative abundance and diversity of Acidobacteria present in the soil of rooibos and honeybush.

Graphical Abstract

1. Introduction

The Cape Floristic Region (CFR) is internationally known for its plant species diversity endemic to the western and southwestern regions of South Africa [1]. This region is characterized by a warm-temperate climate with cool, wet winters and warm, dry summers [2], although some regions within the CFR might experience small but significant amounts of rainfall in the dry summer seasons [3]. The CFR has the richest temperate flora in the world as it contains almost 9000 plant species on just 4% of the surface area of South Africa [2]. Of the estimated 9000 species, about 7500 are fynbos (fine bush) species [1]. Two fynbos legume species, Aspalathus linearis and Cyclopia spp., belong to the Fabaceae family and are used to prepare herbal teas commonly known as rooibos, meaning “red bush” (Aspalathus linearis), and honeybush (Cyclopia spp.) [4]. Rooibos is distributed in the western region of South Africa and honeybush in the southwestern region (Figure 1). The cultivation of rooibos and honeybush occurs within proximity of uncultivated populations (Figure S1), where uncultivated plants are found in dense fynbos vegetation, and cultivated plants are more easily accessible for harvesting. Therefore, this unique environment makes it particularly interesting to study the effects of agricultural cultivation on bacterial diversity.
The cultivation of plants usually results in a change in soil microbial community structure and/or diversity. This is mainly because of agricultural practices, soil properties, and crop type [5,6,7]. Bacterial community structures are significantly correlated with the soil properties, which in turn are also influenced by agricultural practices [8,9]. Soil pH, for example, seems to be one of the main drivers in structuring bacterial communities. This could be because of the narrow pH range for optimal growth of most bacteria [10,11]. Seasonal changes in soil temperature and moisture are other contributors that can alter the bacterial community composition. As with pH, bacterial response to temperature is dependent on the optimal temperature range for growth. Soil moisture is vital for microbial activity, as well as for plant growth. The drying and rewetting of soils induce changes in the carbon and nitrogen dynamics, which triggers biological and biogeochemical transformations [12].
As for Cyclopia spp., a recent study has revealed highly similar bacterial communities between uncultivated and cultivated honeybush plants [13]. Similar results were observed for the rooibos bacterial communities [14]. However, seasonal variation between a wet winter and dry summer resulted in significantly different bacterial communities [13,14]. These differences in microbial composition suggest that bacteria also react to short-term changes in the environment, like seasonal variations, rather than the host plant. Some of the main reasons may be the difference in soil temperature during sampling periods, as well as the exudation of acids, polysaccharides, sugars, and ectoenzymes by plant roots that changes during the different developmental phases and growth cycles of the plant [15,16,17].
Acidobacteria is a dominant bacterial phylum commonly found in soil with a low pH and low nutrient content [18], although several Acidobacteria have also been found in alkaline habitats [19,20,21]. Other known habitats also include the deep sea [22], sponges [23], caves [24], and extreme habitats, such as the Yellowstone hot springs [25], acid mine lakes [26], and soil contaminated with uranium [27]. This group received phylum status in 1997 with only four known subdivisions (SDs), with each subdivision corresponding to the class level [28]. It has since increased to 26 subdivisions in 2007 [27], and then refined to 15 subdivisions in 2018 [29], of which subdivisions 1–4 and 6 are most commonly found in soil environments [30,31]. Although these bacteria are ubiquitous and abundant in soil, only a few representatives have been cultured and represents only a few subdivisions within this phylum [32]. Despite their dominant presence in several habitats, little is still known about their diversity, distribution, and how they respond to environmental changes and agricultural practices. A few studies have indicated a negative effect of agriculture on the relative abundance of Acidobacteria. For example, a conversion of forest soil to pasture for agricultural use saw a significant decrease in Acidobacteria [33]. A meta-analysis of more than 100 soil studies also revealed an Acidobacteria relative abundance that was greater in natural (or uncultivated) soils compared to agricultural soils in arid, continental, and temperate regions [7]. In most studies, there was a correlation between Acidobacteria and soil properties, particularly pH, which is influenced by agricultural practices with the addition of soil nutrients and chemicals [5,30,31,34,35].
The literature on the role of Acidobacteria in the rhizosphere have indicated contrasting results. Several studies have detected a higher relative abundance of Acidobacteria in the bulk soil, which agrees with the oligotrophic preference of the Acidobacteria [36,37]. However, other studies have challenged these findings by revealing an increase in relative abundance in the rhizosphere soil where nutrient availability (soil organic carbon) is higher [35,38]. The fynbos rhizosphere soil has a low pH as a result of plant exudates [39], providing an attractive niche for the Acidobacteria and an interesting environment to study.
To our knowledge, the relative abundance and diversity of Acidobacteria in fynbos soil has not yet been closely studied in an uncultivated and cultivated environment. Therefore, we aimed at comparing the diversity and relative abundance of Acidobacteria in the rhizosphere soil of two commercially important plants of South Africa, more specifically, Aspalathus linearis and Cyclopia spp. (Cyclopia subternata and Cyclopia longifolia). Furthermore, we also looked at the effect of seasonal changes on the Acidobacteria in these environments.

2. Materials and Methods

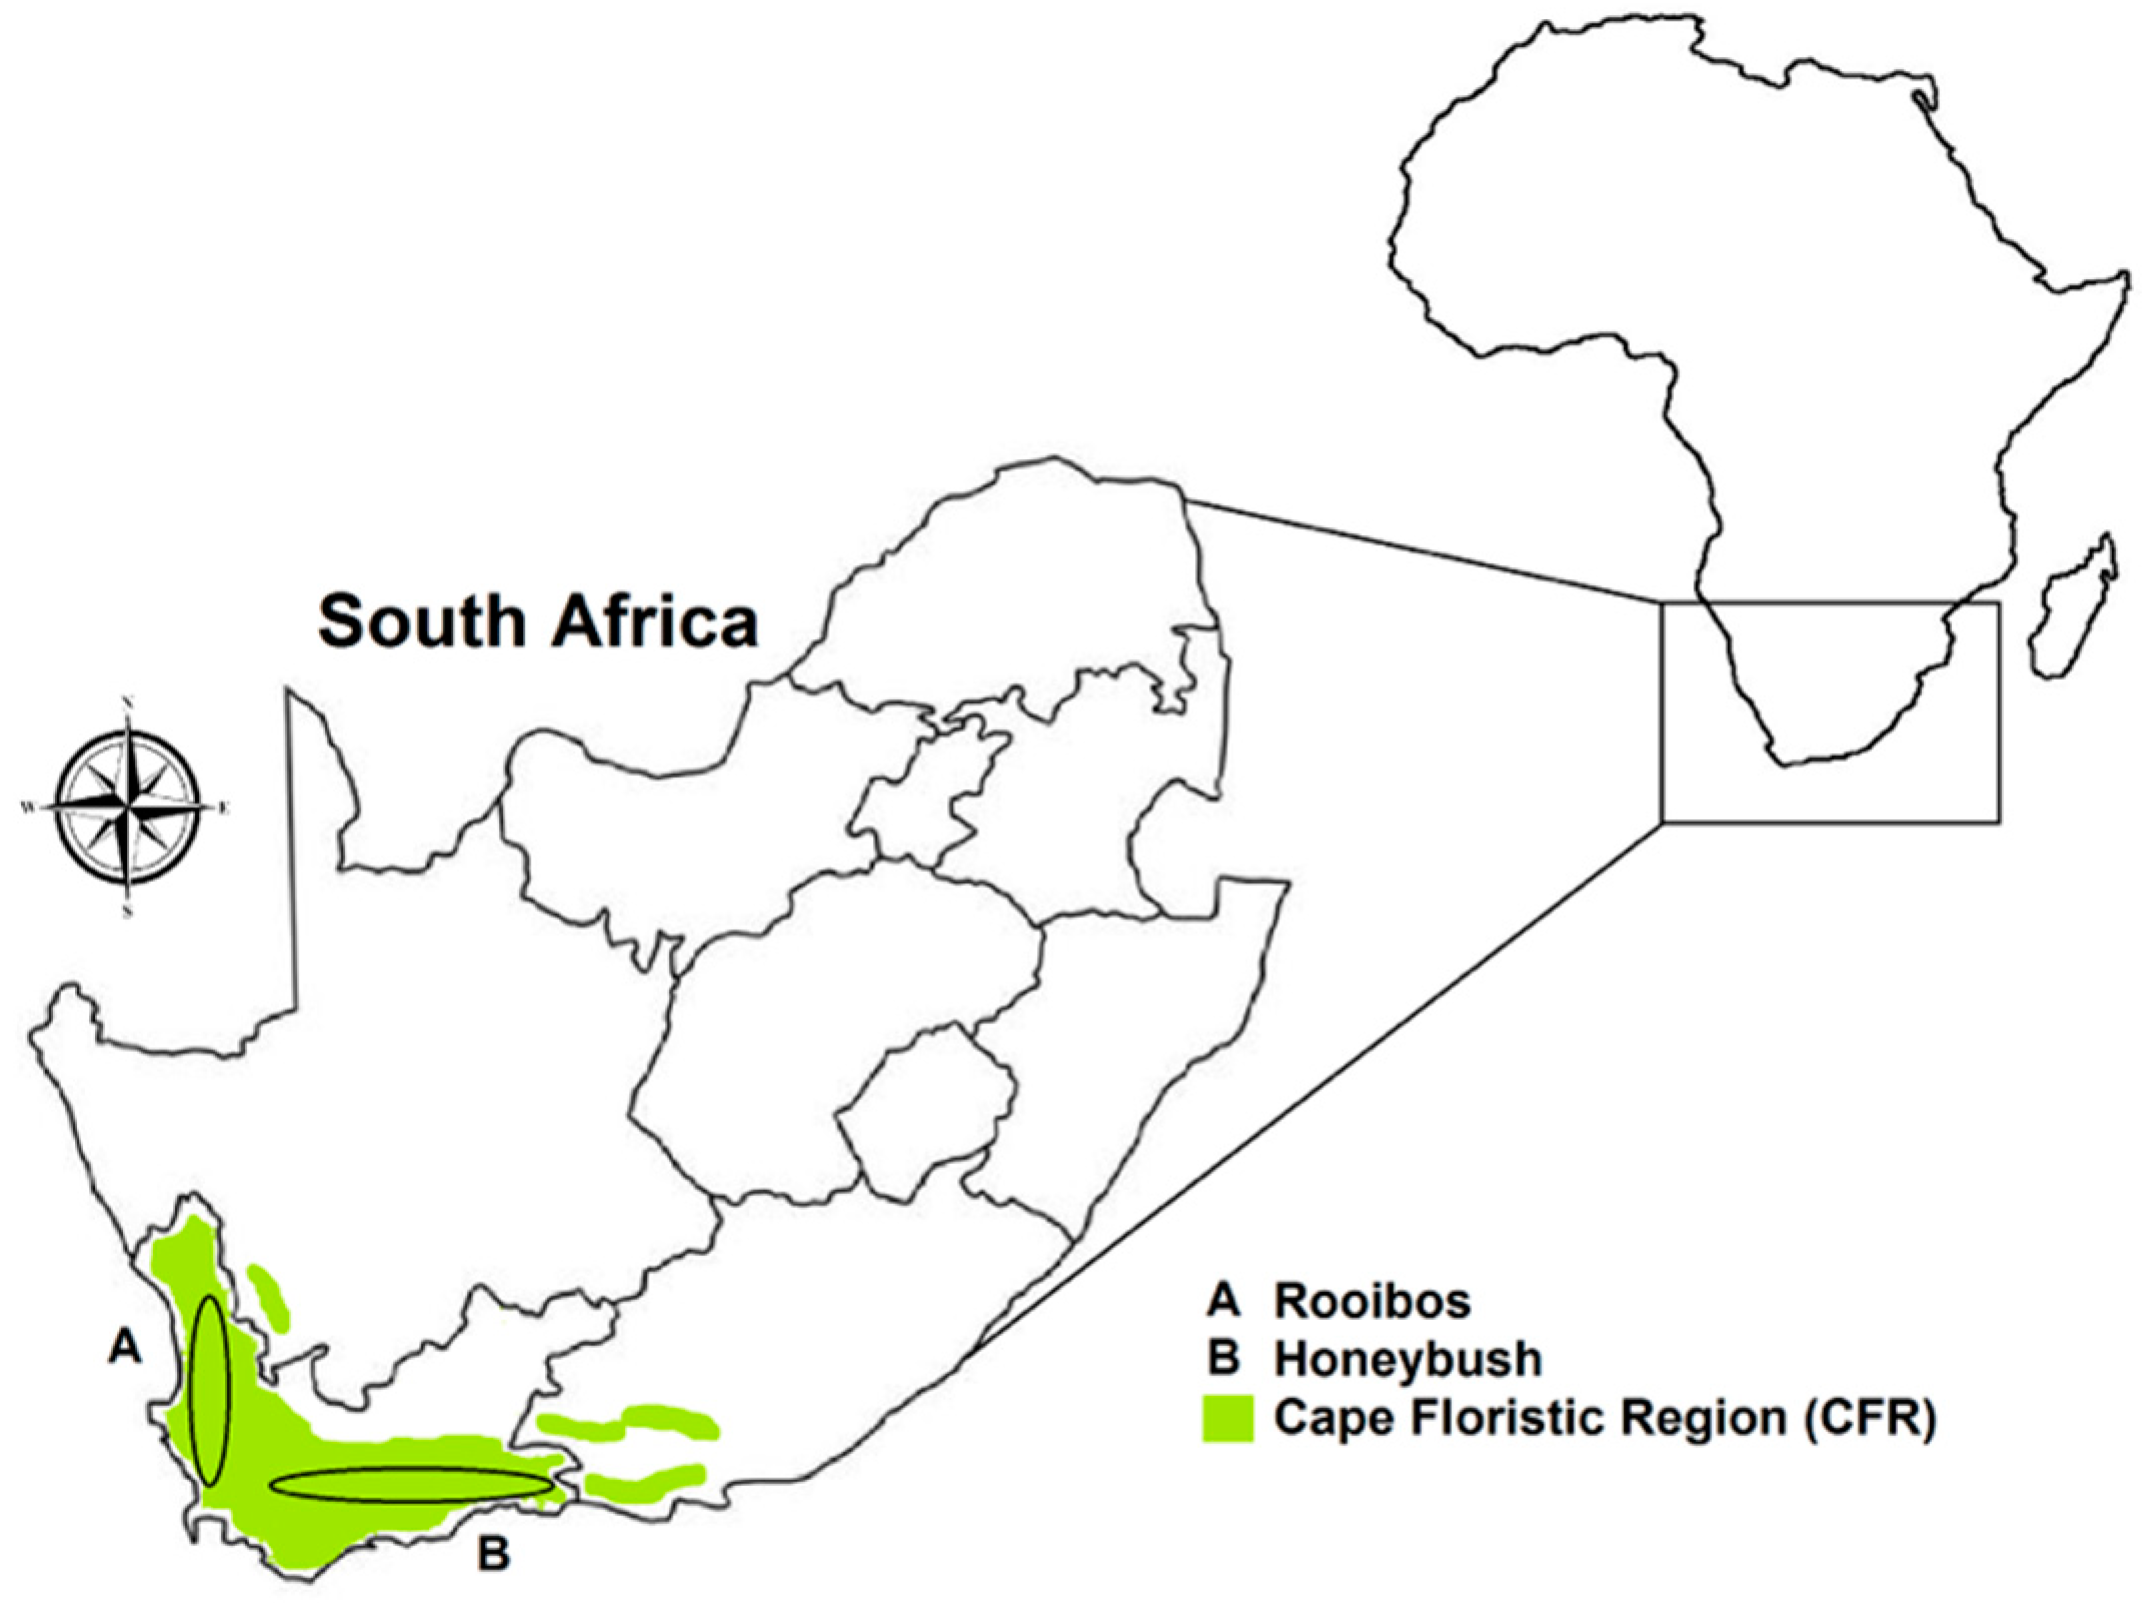
2.1. Experimental Data

We obtained data from two previous studies from our research group, with GenBank accession numbers DRA003953 for Cyclopia spp. (honeybush) and DRA004000 for Aspalathus linearis (rooibos) [13,14]. The geographical locations of all sampling sites are illustrated in Figure S1. Sample locations were selected at random. The samples represented rhizosphere soil of 12 wet winter and 16 dry summer raw data sets from honeybush, and 12 dry summer and 13 wet winter raw data sets from rooibos. These samples also represented 12 cultivated and 16 uncultivated honeybush samples, and 11 cultivated and 14 uncultivated rooibos samples. Furthermore, additional data was obtained for the abiotic soil properties. This includes soil pH, phosphorous concentrations, total available soil carbon, as well as concentrations of nitrogen (in the form of nitrate and ammonium), calcium, potassium, hydrogen, sodium, and magnesium. Technical information regarding the sampling sites, sampling procedures, DNA extraction, and sequencing using Ion Torrent is largely discussed in [13] and [14]. In brief, soil surrounding the plants were removed to depths of 10–20 cm and root fragments, ±15 cm in length, together with about 200 g of soil closely surrounding the roots were collected in sterile plastic bags. Soil samples were stored on ice directly after sampling. The soil and root fragments were sieved to separate the soil from plant material and larger stones. DNA was extracted within 24 h of collection. The 16S rRNA gene was amplified with modified primers for one-way multiplex sequencing, targeting the variable V4 to V5 region. The PCR amplification consisted of an initial denaturing of the DNA at 95 °C for 5 min, followed by 98 °C for 20 s, 75 °C for 15 s, and 72 °C for 30 s for 35 cycles. A final extension was completed at 72 °C for 60 s. Sequencing of the gene products was done using the Ion PGM Sequencing 400 Kit (Ion Torrent, Life Technologies, Carlsbad, CA, USA).

2.2. Sequence Processing

For each comparison (uncultivated and cultivated; wet and dry) the same data processing procedures were followed. The raw data were analysed using MOTHUR (v.1.43.0), following the SOP tutorial (http://www.mothur.org/wiki/454_SOP), with some modifications [40,41]. The sequences were trimmed using the trim.seqs command and filtered to contain sequences with a quality score greater than 25, a minimum length of 400 bp, and homopolymers less than 8. Sequences were aligned against the SILVA v.132 reference database released on December 13, 2017 (http://www.arb-silva.de/). The aligned sequences were screened to include 97.5% of all sequences that overlap within the same alignment space. Further filtering of the sequences included a pre.cluster command to remove sequences with any errors, and chimeras were removed using the chimera.uchime command [42]. Sequences were then classified using a cutoff value of 80. A distance matrix was generated with a pairwise distance cutoff of 0.15 and sequences were clustered together into operational taxonomic units (OTUs), with a threshold of 0.03, with the cluster.split command. All sequence samples were normalized to contain the same number of sequences (11,108 and 12,335 sequences for honeybush and rooibos, respectively). The get.lineage command was used to obtain a file that contained only the acidobacterial sequences to be used for further analysis.

2.3. Statistical Analysis
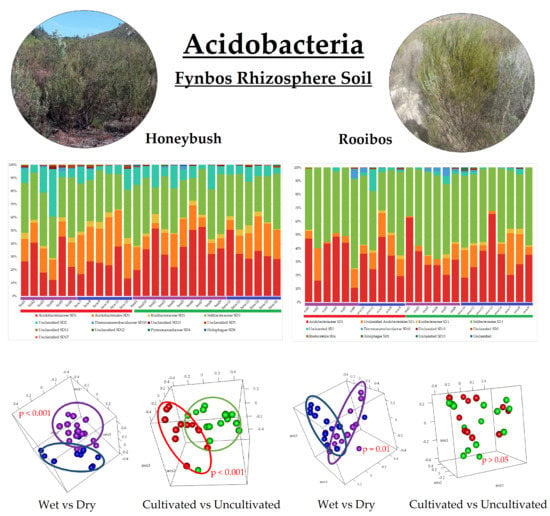
A non-parametric Kruskal–Wallis H-test was performed in R (v.3.6.3, R Core Team 2013) for all abiotic soil properties, the Shannon diversity indices, and to compare the acidobacterial relative abundances between a dry summer and wet winter as well as between cultivated and uncultivated soil for both rooibos and honeybush. Due to data constraints, interactions between cultivated and uncultivated soil in the different seasons for both honeybush and rooibos was not considered.
The metastats command in MOTHUR was used to further describe which OTUs were significantly different between groups. Principle Coordinate Analysis (PCoA) were done in R using the Bray–Curtis distance matrix. The PCoA was based on the eigenvector approach. Further statistical evaluations of the PCoA were performed in MOTHUR using Analysis of Molecular Variance (AMOVA). AMOVA makes use of the distance matrixes generated in MOTHUR to determine if the center of the clouds that represent a group are more distinguished than the variation in the samples of the same group or treatment. A Canonical Correspondence Analysis (CCA) was performed in R, using the Vegan package, to identify the OTU abundances and abiotic soil properties that were most frequently related to acidobacterial community structures. The significance of the relationship between acidobacterial OTUs and soil abiotic properties obtained from the CCA ordination was tested with the Adonis function in the Vegan R package, using 999 permutations.

3. Results

Acidobacteria diversity in Aspalathus linearis (rooibos) and Cyclopia spp. (honeybush) soil was analysed based on the 16S rRNA sequences obtained from GenBank. In addition, the differences in subdivisions specific to each sample group and their soil characteristics were studied to identify the subdivision-specific distributions for each plant’s environment (cultivated and uncultivated) and season (wet winter and dry summer).

3.1. Abiotic Soil Properties

The selected abiotic soil properties and their values for both honeybush and rooibos are summarized in Table 1 and Table 2, respectively, for the wet and dry season, as well as for uncultivated and cultivated soil. The honeybush soil had a relatively low pH with averages ranging between 3.83 (± 0.46) and 4.75 (± 0.42). The pH of the rooibos soil ranged between 4.29 (± 0.24) and 4.81 (± 0.19). A significant difference in pH was observed between the honeybush cultivated and uncultivated soil, where the uncultivated soil had a significantly lower pH than the cultivated soil. In contrast, the rooibos cultivated soil had a significantly lower pH than the uncultivated soil. All soil types (cultivated, uncultivated, wet, or dry) had an acidic soil pH, which is consistent with the fynbos biome. For the most part, a significant difference was only observed between the cultivated and uncultivated abiotic soil properties, which included magnesium (Mg2+) and nitrate (NO3-N) in the honeybush soil, and phosphorus (P) in the rooibos soil. In the wet winter and dry summer, the carbon concentration in the honeybush and rooibos soil was significantly higher in the wet winter (11.31 ± 4.90 and 0.77 ± 0.60) compared to the dry summer (2.05 ± 0.73 and 0.31 ± 0.15).
Some differences were observed between plant soil types. For example, the hydrogen (H+), calcium (Ca2+), magnesium (Mg2+), and total carbon (C) concentration was higher for the honeybush soil compared to the rooibos soil. Lower concentrations of phosphorus (P) was observed for the honeybush soil compared to the rooibos soil.

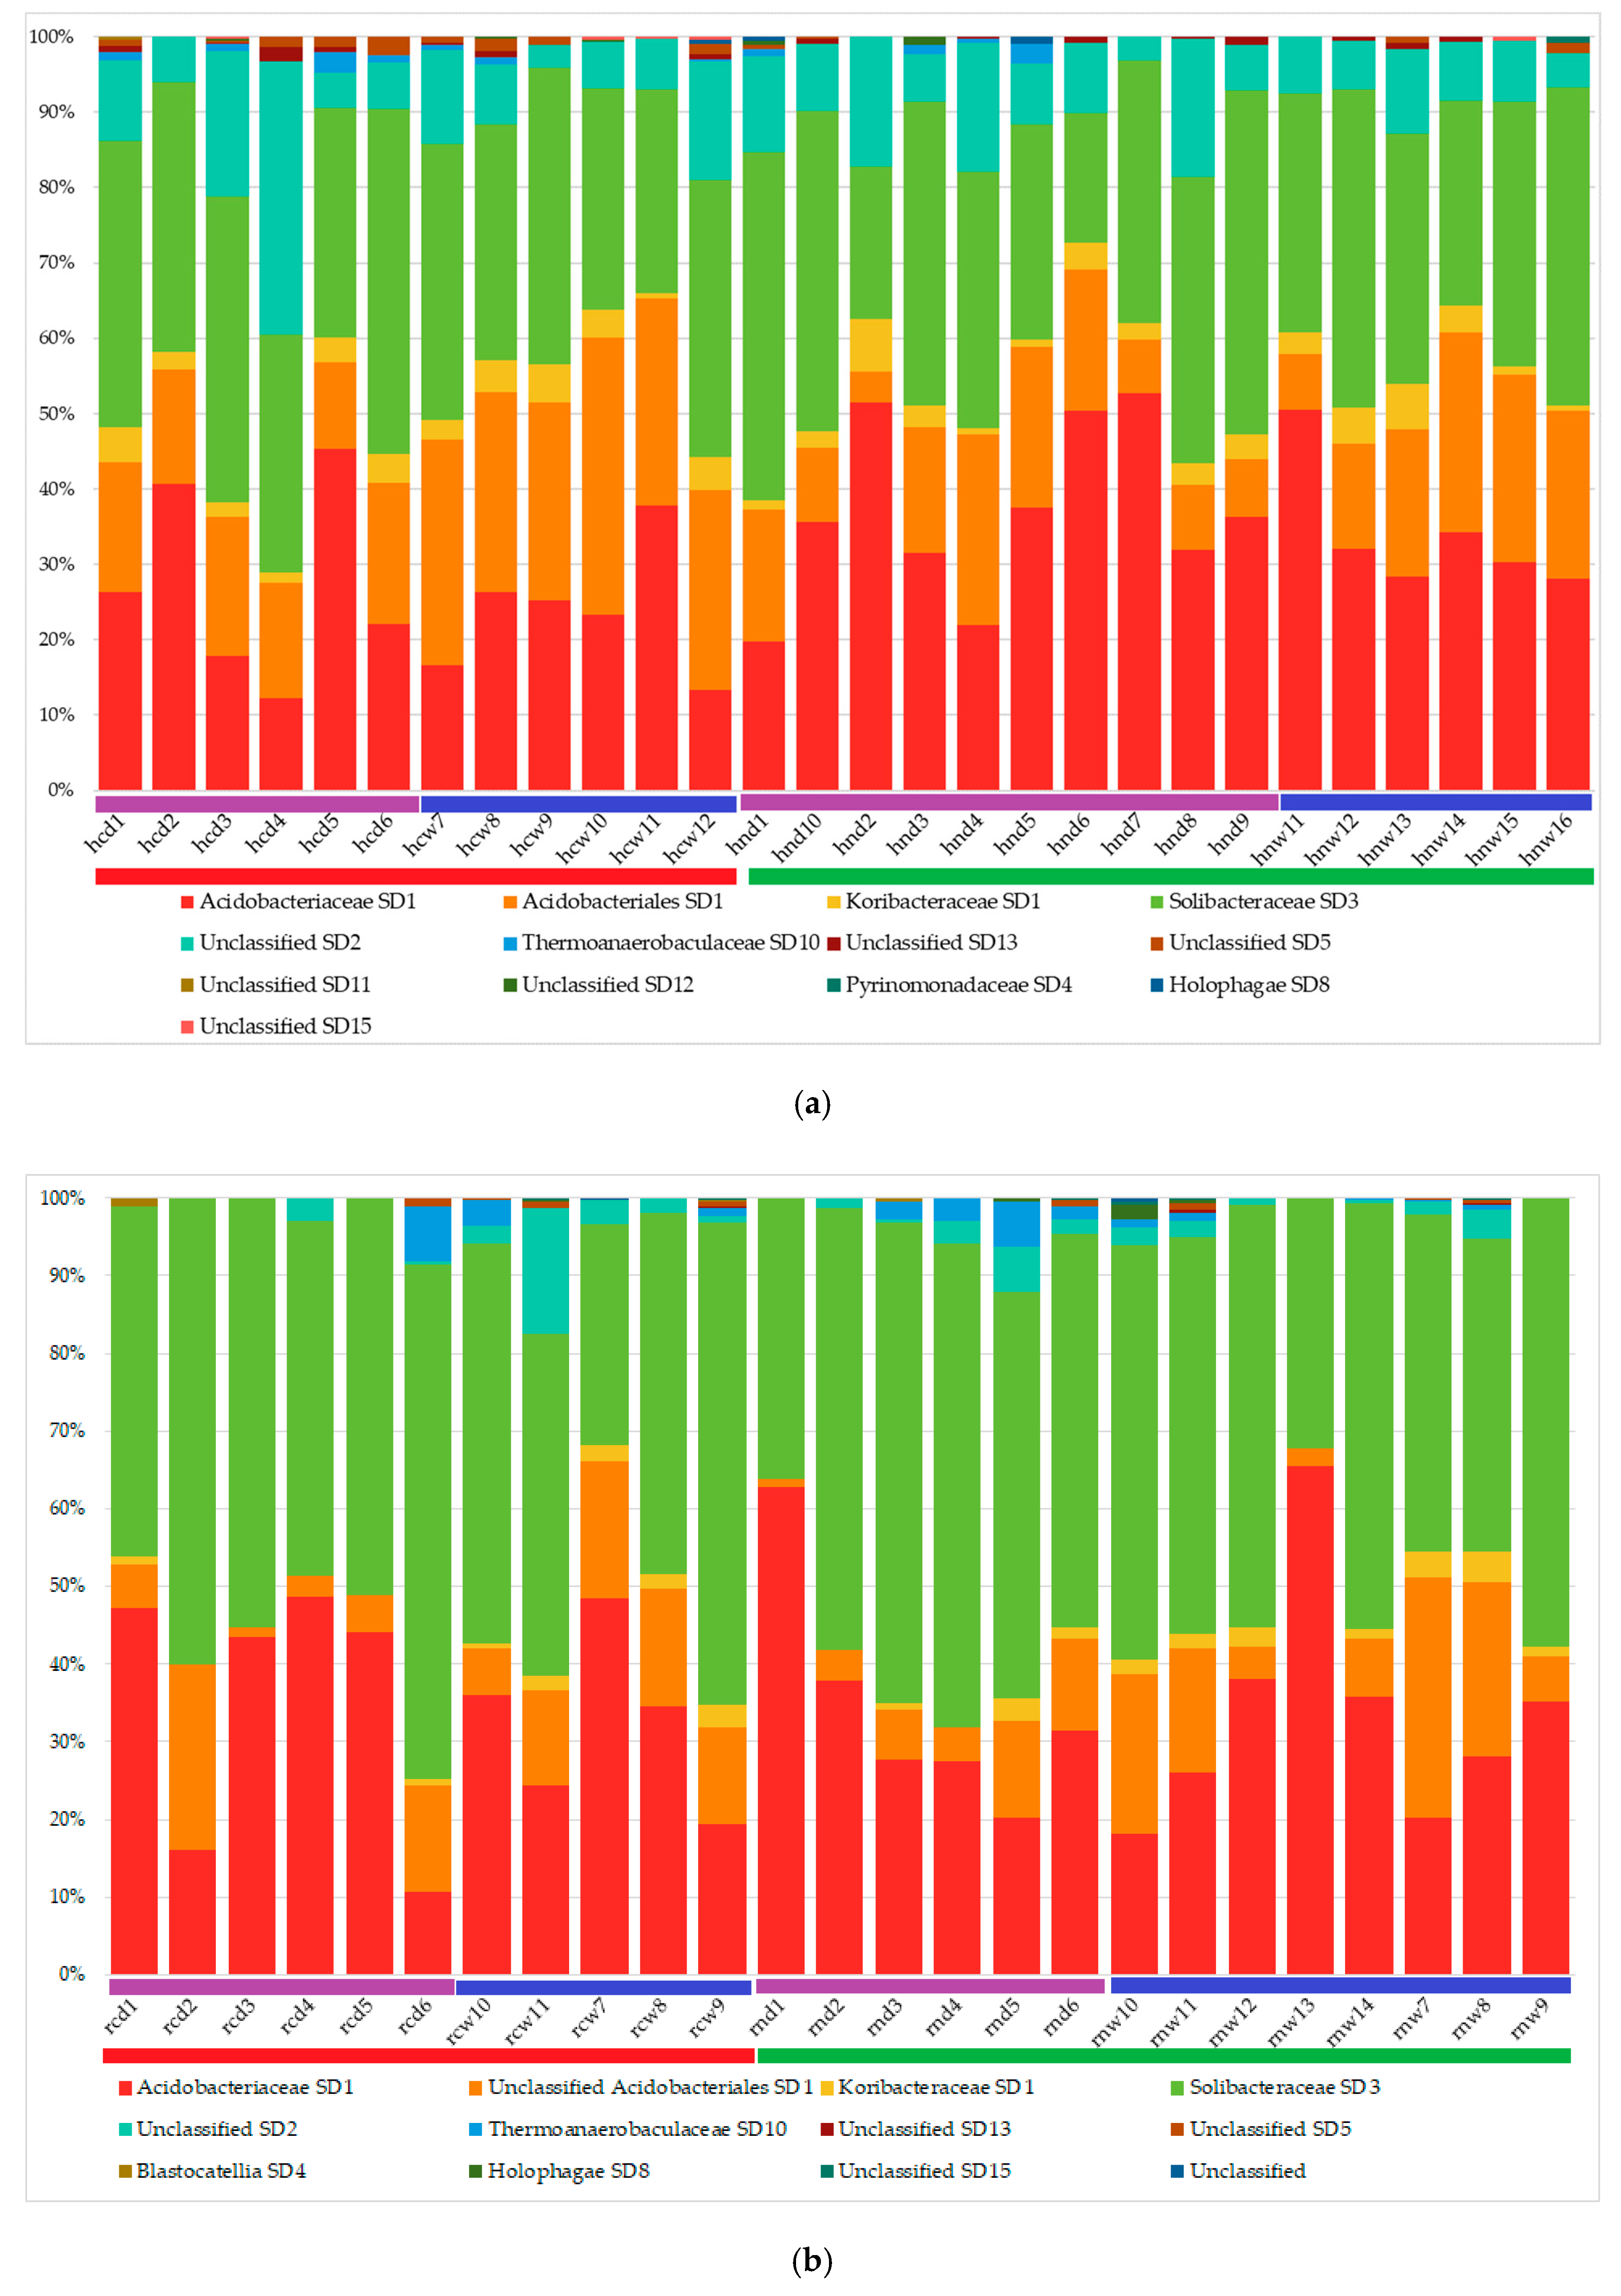
3.2. Acidobacterial Community Composition

A total of 644,341 and 1,035,887 partial 16S rRNA gene sequences with a mean amplicon length of 410 bp were obtained from honeybush and rooibos, respectively, after quality filtering and the removal of chimeras (Table S1). Of these, a total of 50,788 and 45,189 were Acidobacteria-affiliated reads, with a relative abundance ranging between 2.6% and 12.3% and 0.2% and 15.9% in the different samples of honeybush and rooibos, respectively. These differences in relative abundances is often observed with biological replicates under the same conditions. The relative abundance of the Acidobacteria-affiliated reads between a wet winter and dry summer were consistently higher in the wet winter for both honeybush and rooibos (Table 3), although this was not significant in the honeybush. There was a higher relative abundance of Acidobacteria in the honeybush cultivated soil (9.4%) compared to the uncultivated soil (7.0%), although this was not significant (p > 0.05). The relative abundance was similar between the cultivated (4.2%) and uncultivated (4.5%) rooibos soil.
Figure 2 illustrates the Acidobacteria community composition based on the 16S rRNA gene sequence analysis. Distinct differences were observed between the honeybush (Figure 2a) and rooibos (Figure 2b) communities. In the honeybush samples, the community was dominated by representatives of SD1, indicated as Acidobacteriaceae SD1, Acidobacteriales SD1, and Koribacteraceae SD1. The Acidobacteriales SD1 contain as-yet-undescribed representatives of the class Acidobacteria that make up SD1. Other SDs also represented in these soils included representatives of SD3, Solibacteraceae SD3, and as-yet-undescribed representatives of SD 2, indicated as Unclassified SD2. Some SDs also detected but with relative abundances below 1% included SDs 4 (Pyrinomonodaceae), 5, 8 (Holophagae), 10 (Thermoanaerobaculaceae), 11, 12, 13, and 15. Subdivisions 5, 11, 12, 13, and 15 included as-yet-undescribed representatives.
In the rooibos samples, the community was dominated by representatives of SD3 (Solibacteraceae), followed by representatives of SD1 (Acidobacteriaceae, Acidobacteriales, and Koribacteraceae), and not-yet-cultured representatives of SD2 (Unclassified SD2). Other SDs also detected but with a relative abundance below 1% included SDs 4 (Blastocatellia), 5, 8 (Holophagae), 10 (Thermoanaerobaculaceae), 13, and 15. Subdivisions 11 and 12 were not detected in any of the rooibos samples.
The operational taxonomic units (OTUs) were classified into 32 and 31 phylotypes for honeybush and rooibos, respectively (Table S2). There were three major taxonomic groups identified throughout all samples of honeybush and rooibos. These included SDs 1, 2, and 3. Subdivision 10 is also a major taxonomic group within the rooibos samples. Subdivisions 1 and 3 contain several cultured and characterized representatives, a number of which have been identified within these samples. These included from SD1 Acidipila, Granulicella, Candidatus Koribacter, Occallatibacter, Edaphobacter, Terracidiphilus, Acidicapsa, Terriglobus, and Bryocella, and from SD3 Bryobacter and Candidatus Solibacter. However, a large proportion of the OTUs were of as-yet-uncultured representatives and are indicated as Unclassified, or by their available taxonomic classification at the family, order, or class level.
The distribution of the OTUs identified and their relative abundances was different for some groups between a wet winter and a dry summer, as well as between the cultivated and uncultivated soils (Table 4 and Figure S2). During the dry summer, the relative abundance of SD1 Acidipila and Granulicella, SD2, and SD10 was significantly higher compared to the wet winter, where the relative abundance of the two unclassified OTUs of SD1 was significantly higher in the wet winter compared to the dry summer. Between the uncultivated and cultivated honeybush soil, a significant difference was observed in the relative abundance of SD1 Acidipila, Bryocella, and Granulicella, where it had a significantly higher relative abundance in the uncultivated soil, and the relative abundance of SD5 was significantly higher in the cultivated soil. At the SD level, a significant difference was only observed for SD5 and SD10, but not for the dominant SDs 1, 2, and 3.
There was no significant difference observed between the uncultivated and cultivated OTU relative abundances in the rooibos soils. Between the wet winter and the dry summer, an unclassified SD1 OTU (Acidobacteriaceae) had a significantly higher relative abundance in the wet winter compared to the dry summer. No significant differences were observed at the SD level.
In all comparisons of honeybush and rooibos, the most prominent presence of SDs of the Acidobacteria are SD1 and SD3. These subdivisions are among the most commonly found SDs in soil. A large group of OTUs affiliated with SD1 (order Acidobacteriales), SD3 (order Solibacterales), SD2, and SD10 (family Thermoanaerobaculaceae) were classified as belonging to the as-yet-uncultured representatives. These OTUs accounted for between 44 and 51% of the honeybush relative abundances, and 34–44% of the rooibos relative abundances.

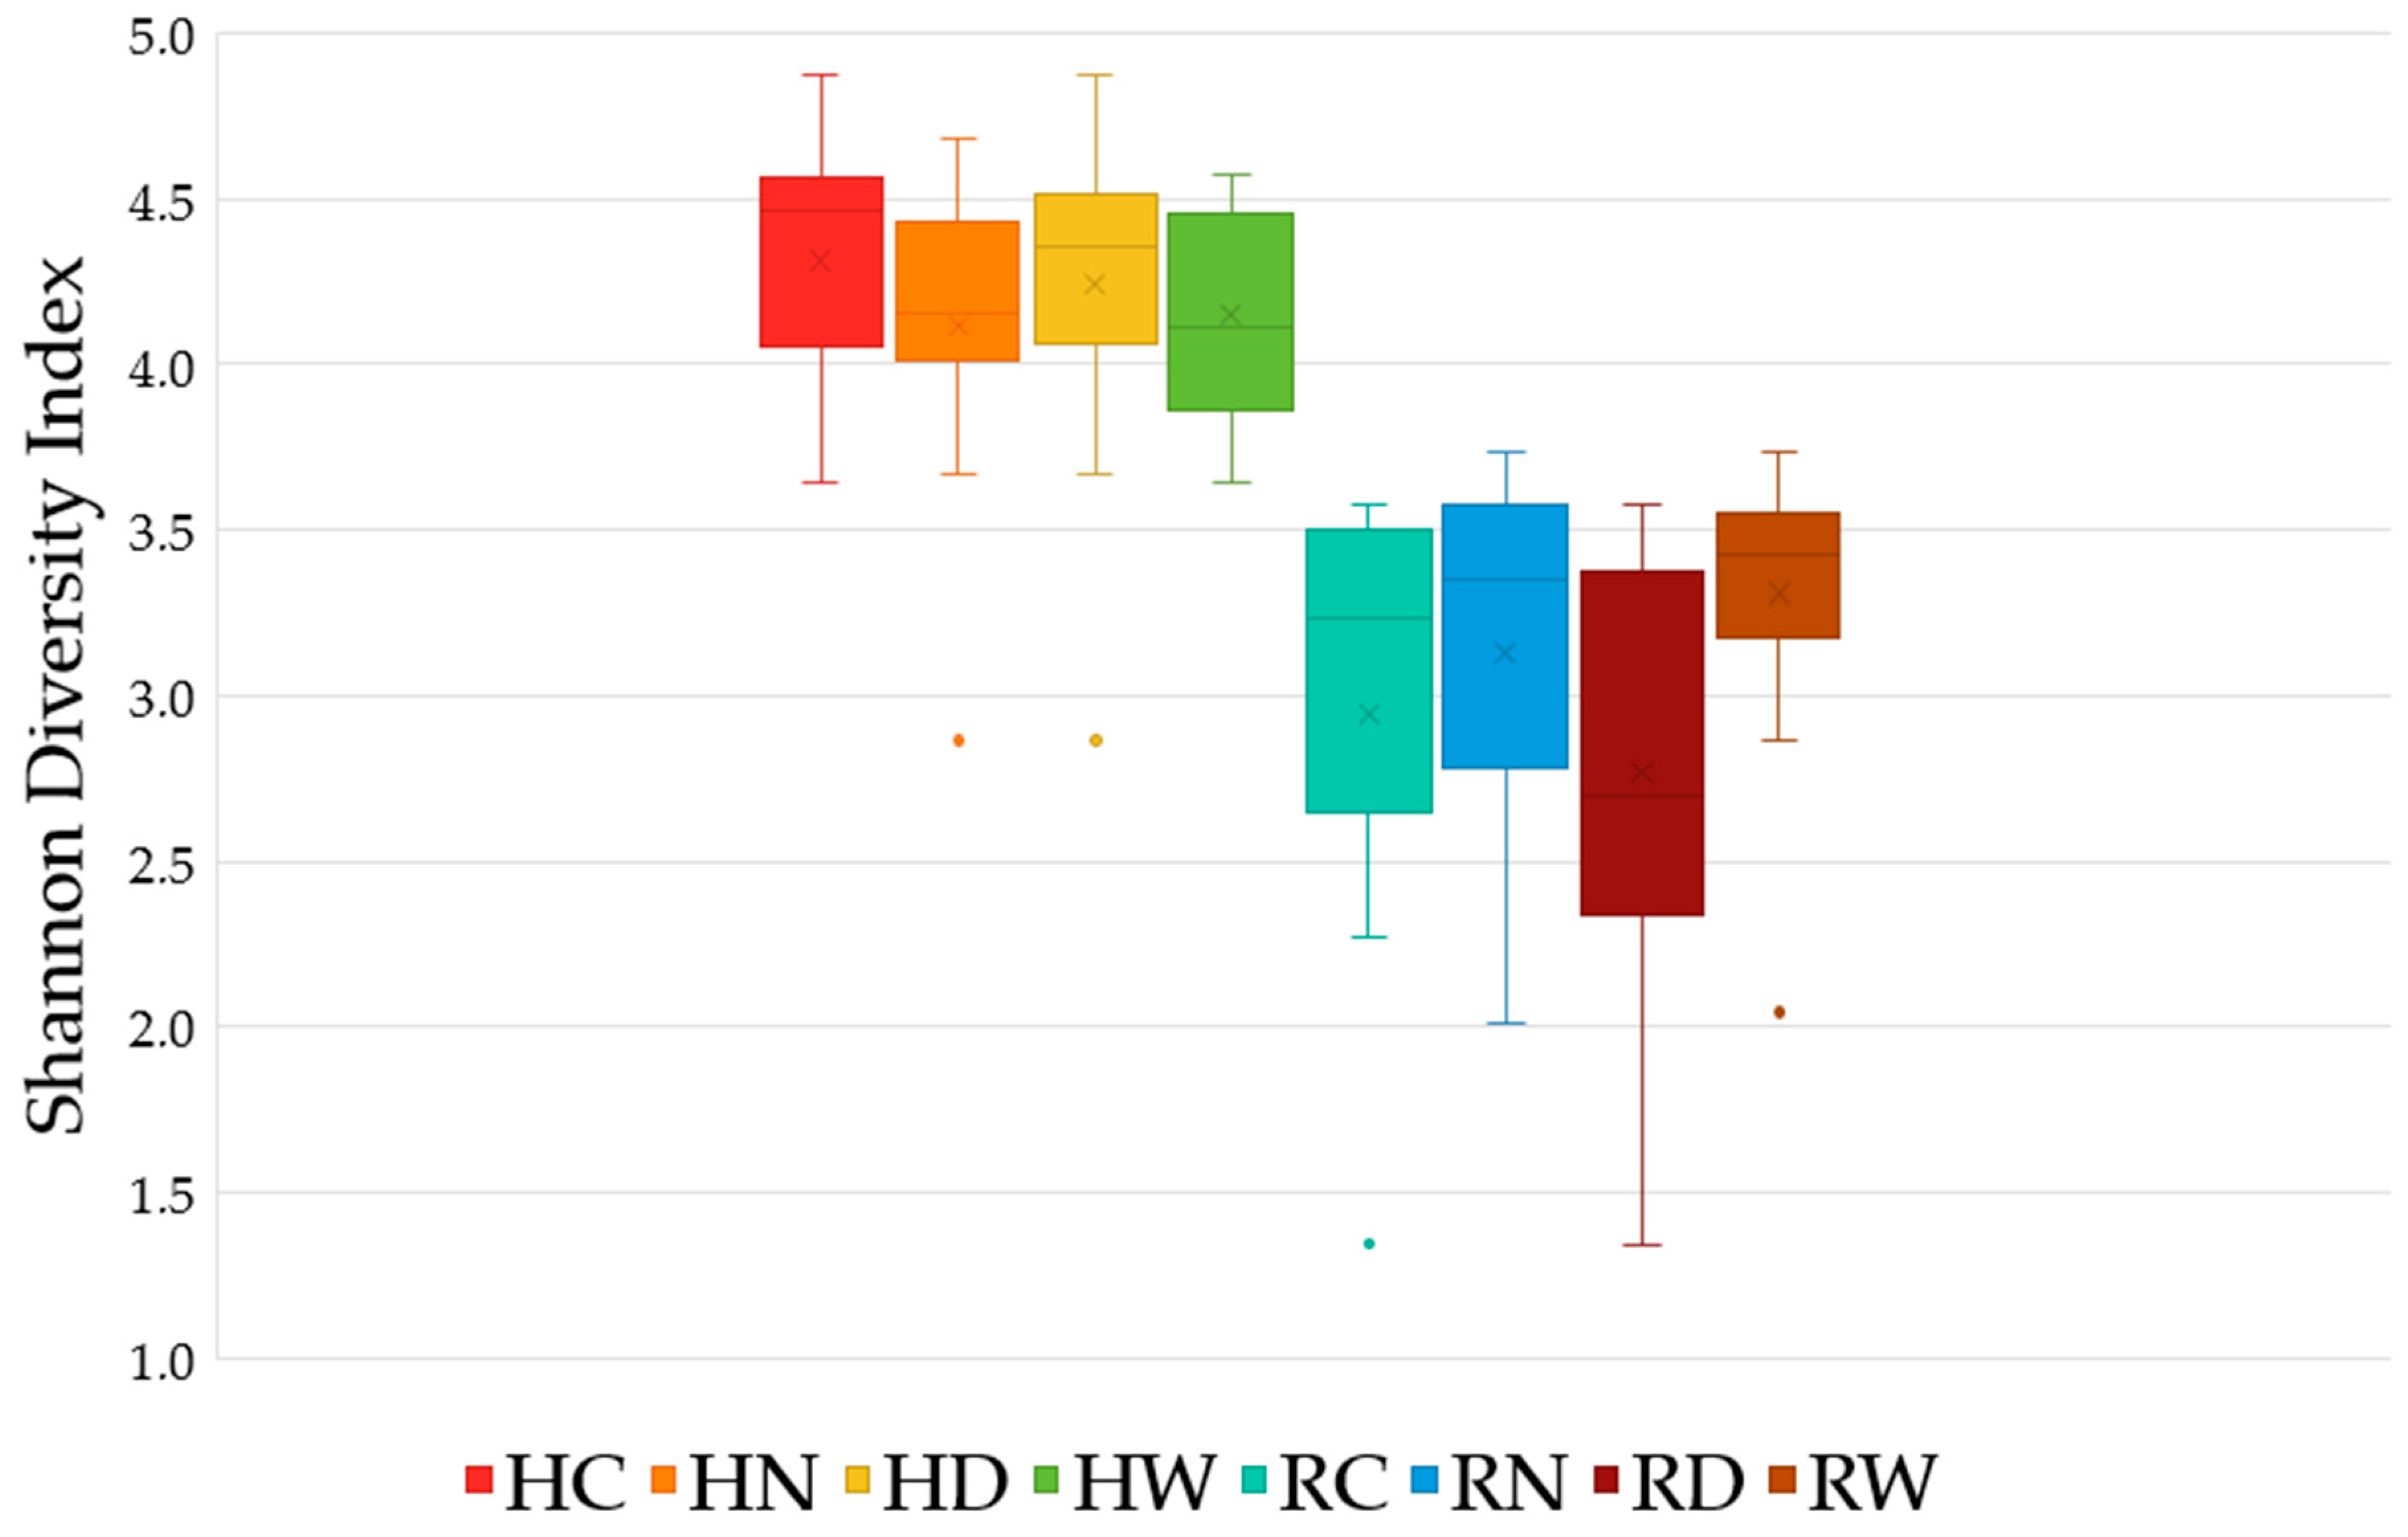
3.3. Alpha-Diversity
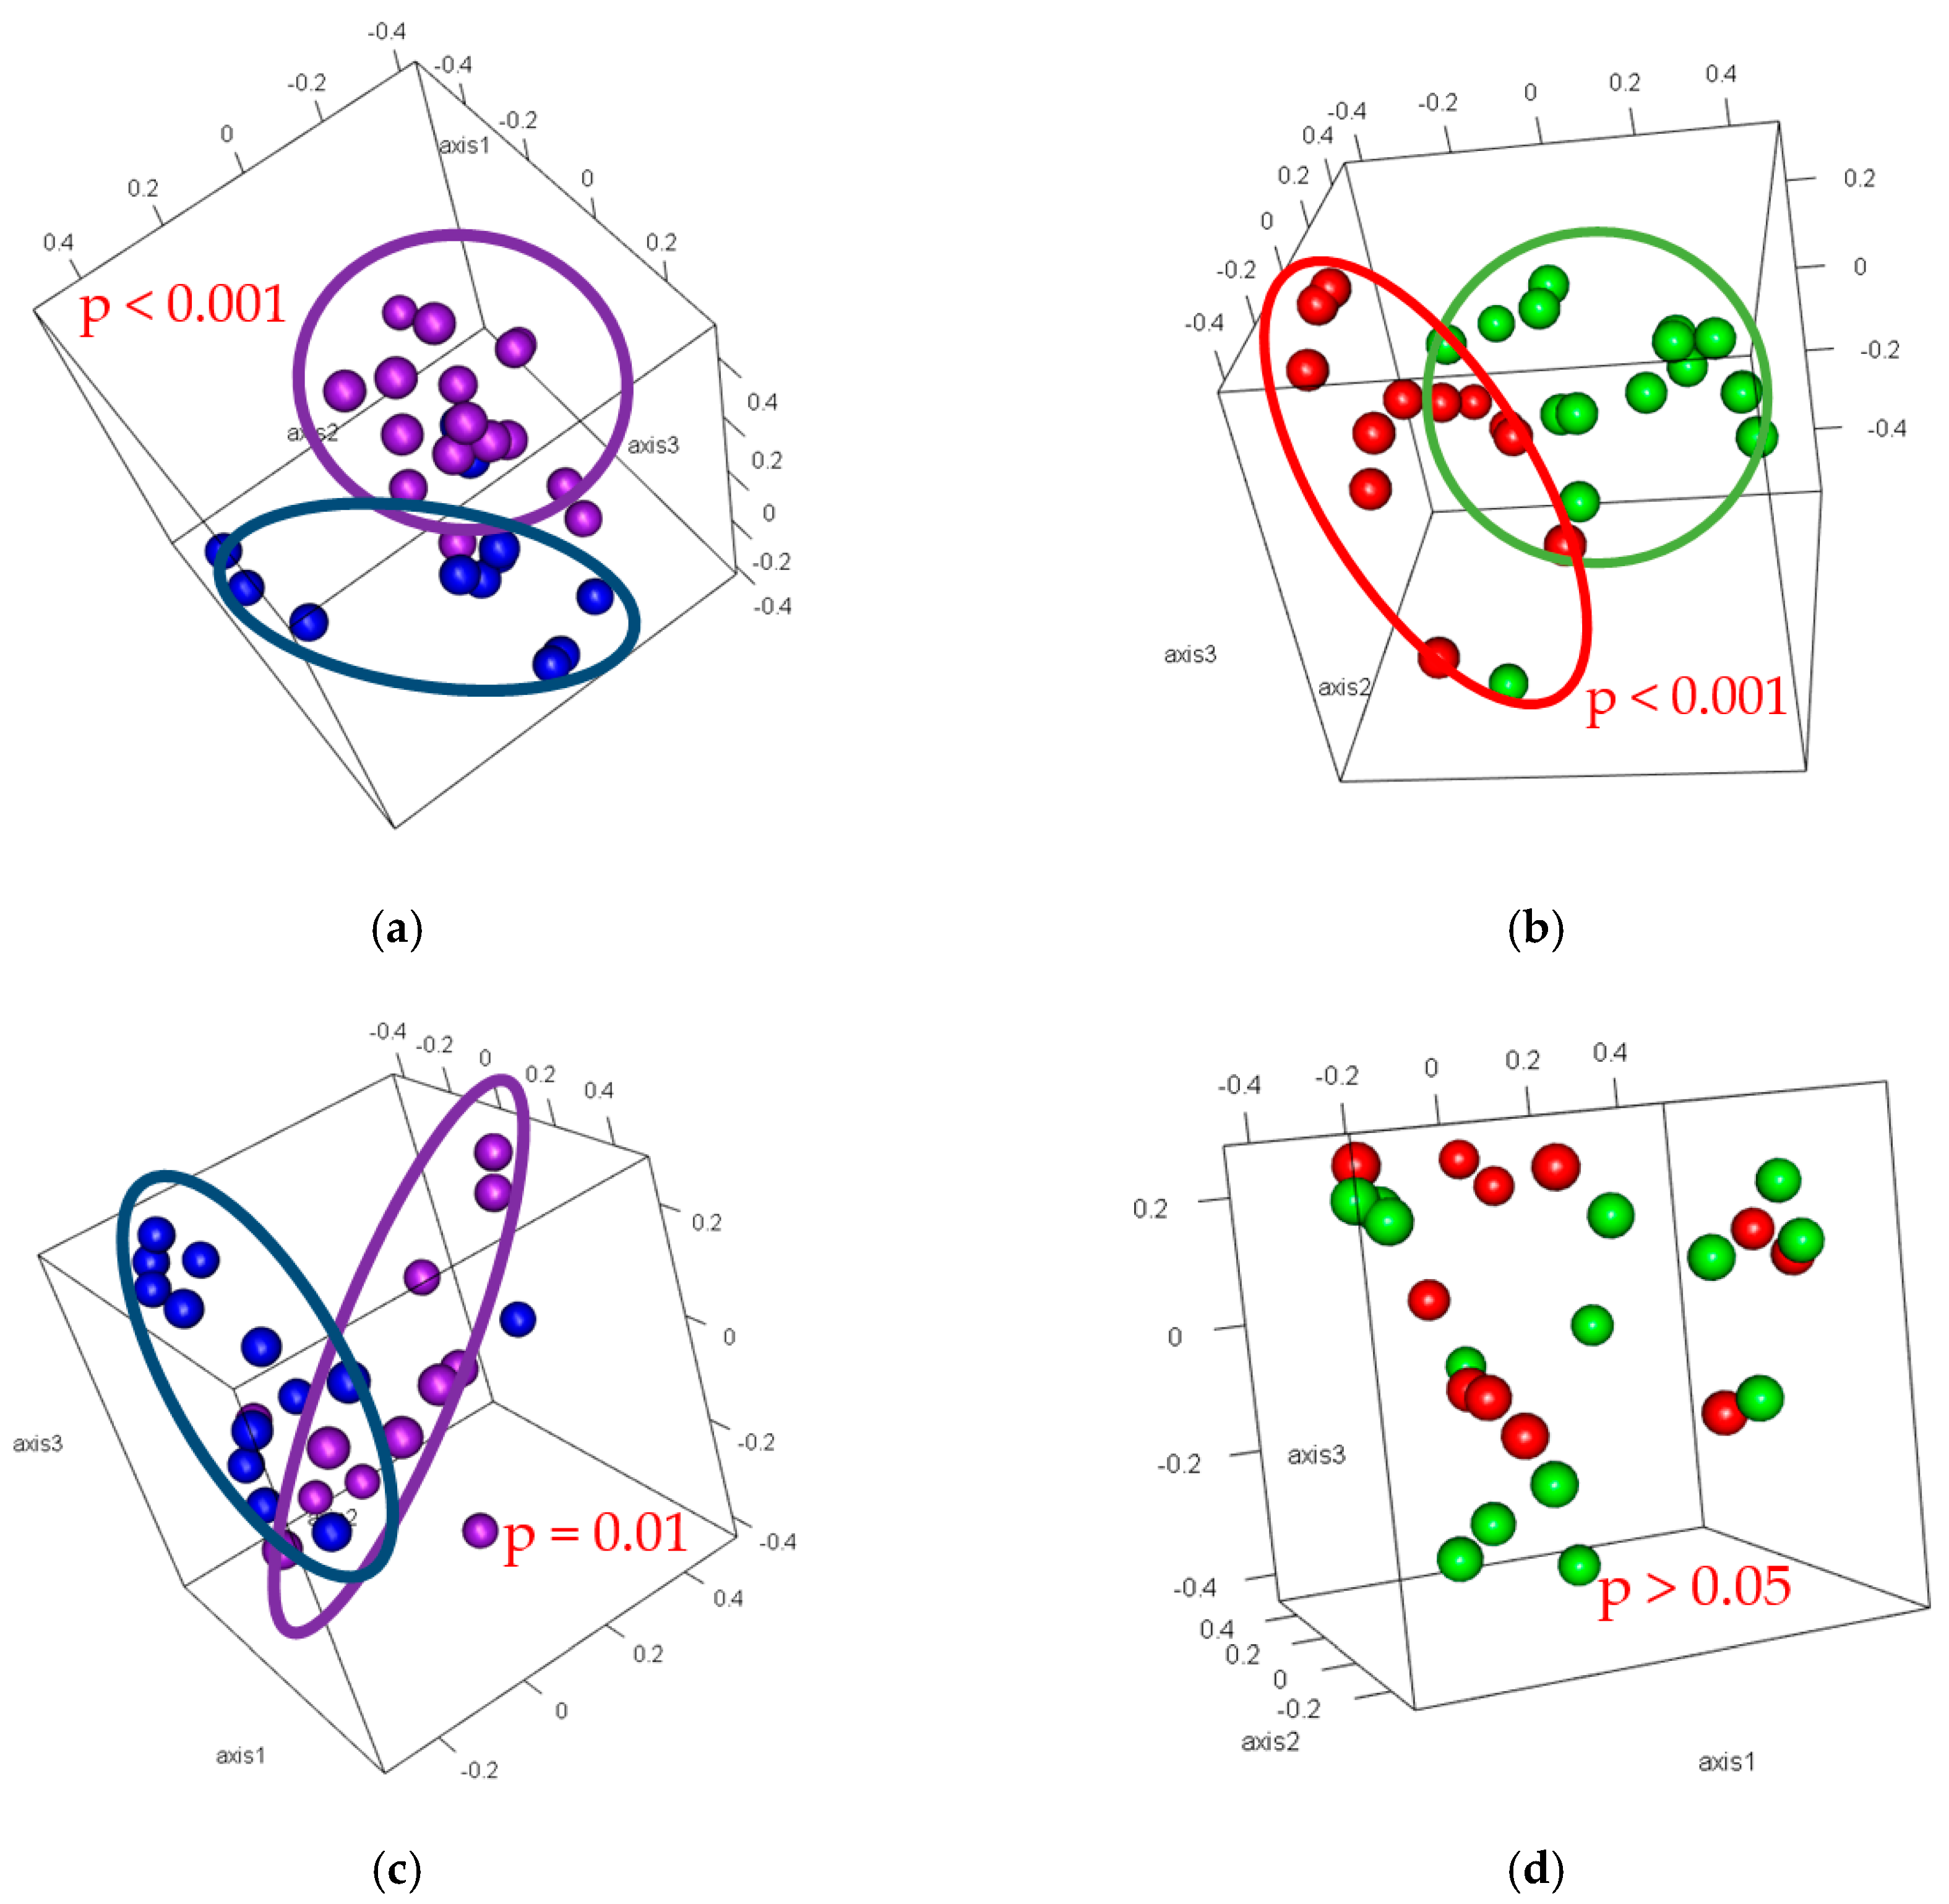
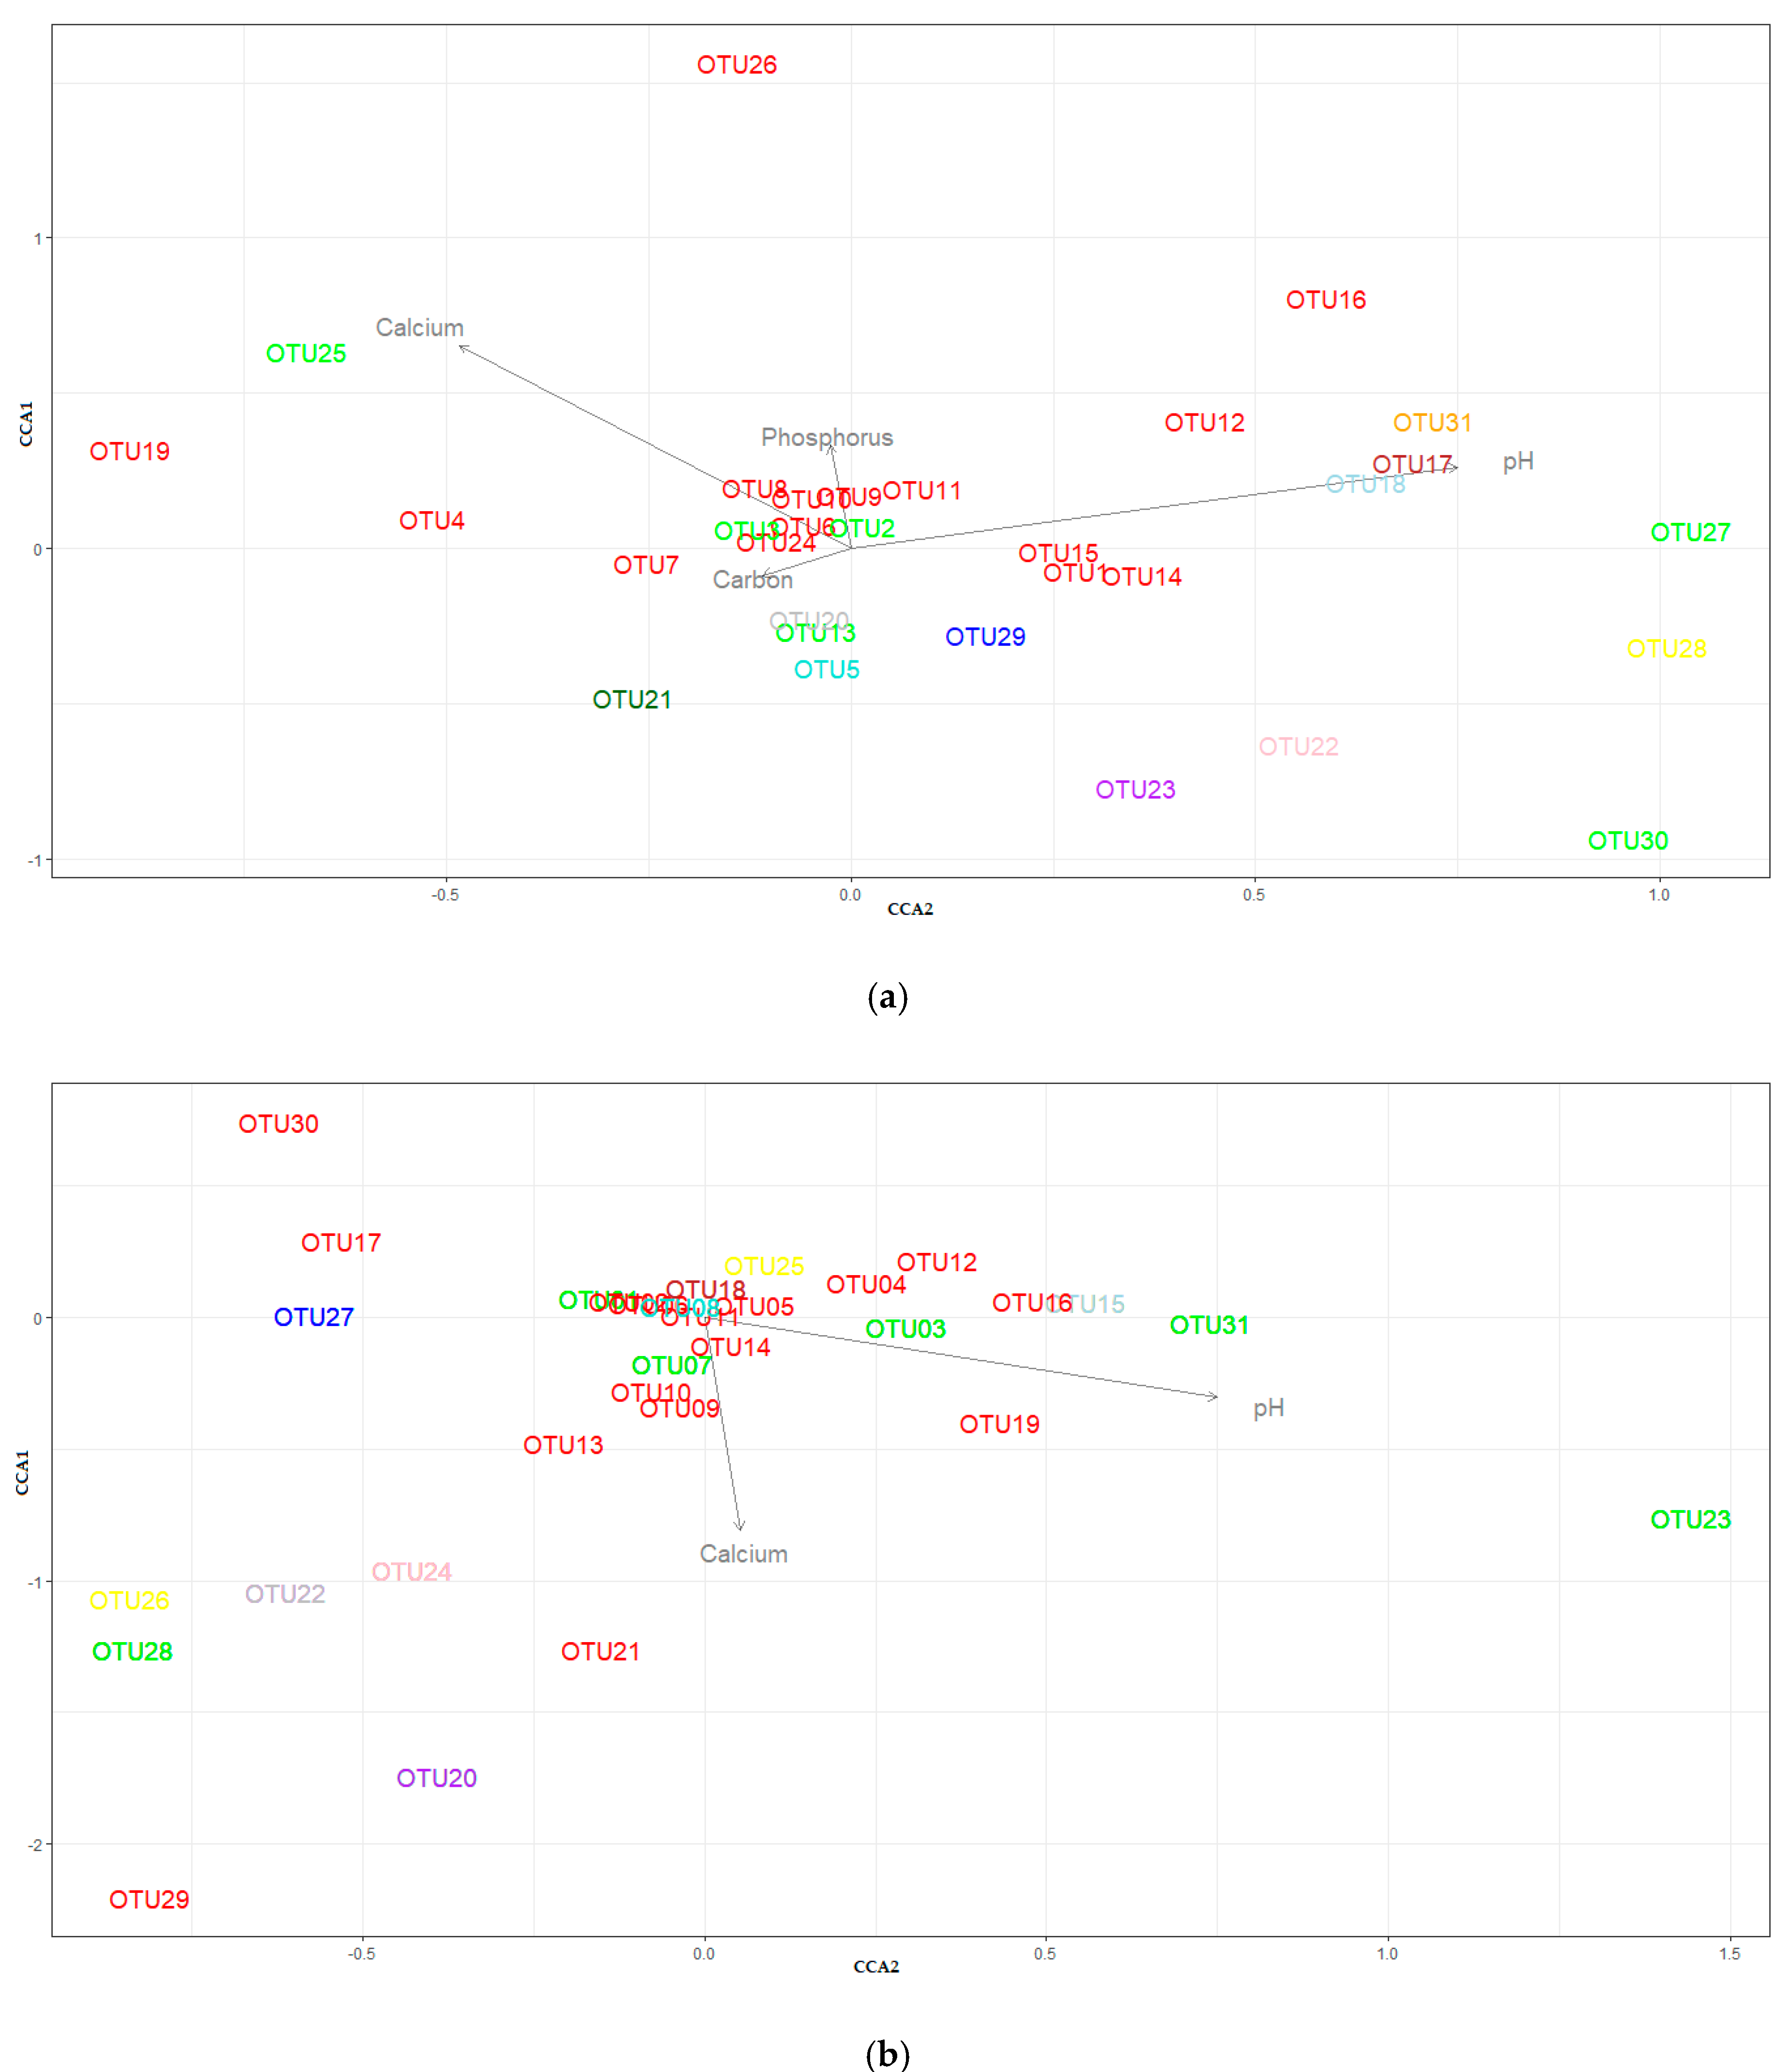
Overall, the alpha-diversity in the honeybush and rooibos soils were similar between samples and no statistically significant differences (p ≤ 0.05) were observed between sample groups (Figure 3). The average Shannon diversity indices for the rooibos (2.7 ± 0.4–3.3 ± 0.2) was slightly lower than the honeybush (4.1 ± 0.2–4.3 ± 0.1).

3.4. Beta-Diversity

The Principal Coordinate Analyses (PCoA) revealed distinct acidobacterial communities corresponding to the different sample groups (Figure 4). However, there was no clear distinct acidobacterial communities for the rooibos cultivated and uncultivated samples (Figure 4c). The observed separation in the honeybush cultivated and uncultivated (Figure 4b), as well as honeybush (Figure 4a) and rooibos (Figure 4c) wet and dry samples was statistically significant (p ≤ 0.05).
To identify the abiotic factors likely affecting the acidobacterial community composition, a CCA was carried out with the OTU table (Table S2) and soil abiotic properties. Of the 10 soil abiotic properties measured, pH, phosphorus, calcium, and carbon appeared to be significantly correlated to acidobacterial structure in the honeybush soil samples (p ≤ 0.05) (Figure 5a and Table S3), of which pH was the most important soil parameter (p < 0.001). For the rooibos soil samples, calcium was significantly related to the acidobacterial structure (p ≤ 0.05) and pH was only weakly related (p = 0.058) (Figure 5b and Table S3).
In the honeybush soil samples, several representatives of SD1 (OTU1, 11, 12, and 14–16) and SD3 (OTU2 and 27) correlated with soil pH, as well as SD5 (OTU17), SD10 (OTU18), and SD11 (OTU31). Representatives of SD1 (OTU6 and 8–11) and SD3 (OTU2) correlated with phosphorus, some representatives of SD1 (OTU6, 8, and 24) and SD3 (OTU3 and 25) also correlated with calcium, and SD1 (OTU7 and 24), SD3 (OTU13), and SD13 (OTU20) correlated with soil carbon. In the rooibos soil samples, several representatives of SD1 (OTU9, 10, 13, 14, and 21) and SD3 (OTU7) correlated with calcium. As for pH, SD1 (OTU4, 5, 12, 16, and 19), SD3 (OTU3 and 31), and SD10 (OTU15) had a weak correlation with pH.

4. Discussion

The Acidobacteria phylum is highly diverse and ubiquitous. This phylum has been detected in high abundance in various environments with the application of molecular techniques [18,30]. However, few have been successfully cultivated and little is known about this phylum and how it reacts to changes in the environment. All previous knowledge of Acidobacteria in fynbos soil refers only to the phylum and some subdivision-specific representations, but none have looked at the specific Acidobacteria representation between seasons or cultivation farming practices [13,14,43,44,45]. In this study, we have shown the effect of seasonal changes (in summer and winter) and plant cultivation on the relative abundance and diversity of Acidobacteria associated with Aspalathus linearis (rooibos) and Cyclopia spp. (honeybush). Both these plants are fynbos plants that occur in oligotrophic soils with a low pH [1]. Acidobacteria is known to prefer soils with oligotrophic properties and previous studies have indicated a relatively high abundance of Acidobacteria in these types of soils [9,31,34,46,47,48].
Some differences were observed in terms of the soil abiotic properties between honeybush and rooibos (Table 1 and Table 2). There were higher concentrations of hydrogen (H+), calcium (Ca2+), magnesium (Mg2+), and total carbon concentration (C) observed in the honeybush samples, together with lower concentrations of phosphorus (P). More significantly was the increase in total available C in the wet winter season compared to the dry summer season in the honeybush soil. The Mediterranean-type ecosystem that is the fynbos biome, is usually susceptible to stresses caused by the drying and rewetting of the soil, as rainfall events are not frequent and the drying of the soil can be rapid [12]. The mineralization of carbon generally increases after the rewetting of dry soil [49]. Previous studies have indicated that this could be due to several reasons. First, the sudden change in the water potential after rewetting may cause the microorganisms present in the soil to undergo osmotic stress, leading to microbial cell lysis and the release of intracellular solutes [50]. Soil aggregates can also break apart during the rewetting of the soil, resulting in the exposure of soil organic matter that was otherwise physically protected [12]. However, even though there were changes in values for some abiotic properties, the acidobacterial alpha-diversity and composition within these samples remained similar throughout all sample groups (Figure 2 and Figure 3). All rooibos sample groups had a slightly lower Shannon diversity index compared to the honeybush samples. This could be because of lower concentrations available of the abiotic soil properties in the rooibos soil, especially the low carbon availability, as a direct result of a lower frequency of rainfall during the dry summer seasons. The honeybush regions experience a small but significant amount of rainfall during the dry summer seasons within the CFR [3].
The relative abundance of Acidobacteria increased in the wet winter season for both the honeybush from 7.0% to 9.9%, and more drastically and significantly (p < 0.01) for the rooibos from 2.1% to 9.6% (Table 3). As previously stated, some regions within the CFR experience small but significant amounts of rainfall during the dry summer seasons [3]. Therefore, it could be that the small increase in relative abundance in honeybush samples between the summer and winter is due to the few rainfall events that this region experiences in their summer seasons, compared to the rooibos region. However, these findings are in stark contrast to previous research that suggest that Acidobacteria is negatively influenced by soil moisture [51,52,53,54]. For example, a study indicated the preference of SDs 1, 2, and 3 for low soil moisture, compared to SDs 5, 11, and 17 preferring high soil moisture [53]. Even though soil moisture is important in several ways to the survival and function of microorganisms, more than one factor may influence the shift in microbial abundance and diversity. These include seasonal shifts in soil temperature, or it could be seasonal carbon inputs to the soil, periodic plant life cycles, and litter production [55,56]. The most likely explanation for the increase in relative abundance of Acidobacteria in a wet season, for both honeybush and rooibos, is soil temperature. The mean daily maximum and minimum temperatures for February (summer) and July (winter) ranges between 27.0 and 27.3 °C and 2.9 and 4.2 °C, respectively, in the honeybush region, and between 28.4 and 30.2 °C and 4.0 and 6.1 °C, respectively, in the rooibos region [1]. The majority of cultured Acidobacteria are classified as psychrotolerant mesophiles or mesophiles [32]. Therefore, the lower temperatures in the wet winter seasons could be advantageous for the Acidobacteria.
There was no effect of land use on the relative abundance of Acidobacteria, which is in stark contrast to previous studies. Several studies have indicated a decrease in the relative abundance and diversity of Acidobacteria in cultivated (or agricultural) soils [5,16,35]. In some regions, the relative abundance of Acidobacteria was up to three times higher in uncultivated soils [7]. However, this increase in relative abundance was not significant (p > 0.05) for the honeybush soils. The rooibos relative abundance (4.5%) within the uncultivated soil was slightly higher than the cultivated soil (4.2%). However, this too was not significant. These results suggest that the cultivation farming practice of honeybush and rooibos does not influence the relative abundance of the Acidobacteria. However, seasonal changes do have a significant influence on the relative abundance in the rooibos soil and might be the key factor influencing the Acidobacteria.
Although cultivation farming practices might not affect the relative abundance of Acidobacteria, it might affect the community composition within the honeybush and rooibos soils. There was a significant difference (p ≤ 0.05) between community compositions for the honeybush dry and wet, honeybush cultivated and uncultivated, as well as rooibos dry and wet soil (Figure 4). No significant difference (p > 0.05) was observed between the rooibos cultivated and uncultivated soil. A closer look at the different compositions revealed subdivision-specific adaptations for both honeybush and rooibos communities (Figure S2). The honeybush community was dominated by SD1 and the rooibos was dominated by SD3. Representatives of SD1, including the genera detected within these soils, are known to degrade polysaccharides derived from plants and microorganisms [57,58,59]. With the rewetting of the soil during the wet winter, plant material is degraded more rapidly [60] and some microorganisms are subject to cell lysis due to the osmotic stress [50,61], resulting in a greater availability of polysaccharides. This increase in available polysaccharides can lead to the increase in relative abundance of SD1 during the wet winter, as was seen in this study. Previous studies have also reported these changes in relative abundance within acidobacterial SDs in savanna, Arctic tundra, grassland, and forest soils [47,62,63]. The characteristics of the representatives of SD1 include genera that are acidophilic to mildly acidophilic, aerobic bacteria. Representatives of this SD are mesophiles and are able to withstand low temperatures [32], which allows them to thrive at the low temperatures of the wet winter seasons of the fynbos biome [2]. This could also explain why there is an increase in the relative abundance of SD1 in the wet winter, compared to other SDs also detected within these samples. Whole genome sequencing has revealed that representatives of SD1 are able to form biofilms in the soil environment with the production of exopolysaccharides (EPS), allowing it to adhere to its surroundings and reduce stresses caused by the environment in terms of nutrient and moisture fluctuations [46,64]. Their ability to survive these harsh conditions during the warm dry summers may be related to the production of large amounts of EPS [65]. The functional importance of representatives of SD3 is vastly understudied. Representatives of this subdivision that have been described are psychrotolerant and either aerobic or facultatively anaerobic [32]. Their relatively slower metabolism allow them to grow at lower temperatures than the mesophiles, although it is unclear why this subdivision is the most dominant in the dry summer season for rooibos soils, as summer temperatures can rise well above 30 °C and rainfall is low during the summer [1]. It is also important to consider the plant nutritional status between the different seasons, as this could affect the concentration of nutrients and the pH of the soil surrounding the roots of the plants. Several studies have indicated a decrease in the relative abundance of Acidobacteria in the rhizosphere compared to the bulk soil [36,37,66]. The fynbos rhizosphere is unique as the plant exudates decrease the soil pH surrounding the roots [39], which might be the attracting factor for Acidobacteria. Other studies have also indicated a higher relative abundance and metabolically active Acidobacteria in the rhizosphere [38,67,68]. A recent study that looked at acidobacterial genomes from Mediterranean soils, which are similar to fynbos soils, revealed that some SDs (mostly SDs 1, 2, and 3) encode for enzymes for the degradation of complex carbohydrates [69]. Several genomes also have the gene capacity to use inorganic and organic nitrogen sources [65]. These traits are ideal in environments where nutrient availability fluctuates between seasons.
The community composition between the honeybush cultivated and uncultivated soil differed significantly (Figure 4b). As previously mentioned, members of SDs 1, 2, and 3 possess the capability to degrade complex carbohydrates and could use inorganic and organic nitrogen sources. With the addition of nutrients and chemicals to cultivated soils, it is possible that these Acidobacteria have adapted and can thrive in the farming environment. There is a larger representation of Unclassified SD1 within the cultivated soil. Without cultured representatives of SD1, 2, 3, and 10, it is difficult to speculate on the functional importance of these subdivisions. Currently, SD1 has the most cultured representatives, followed by SD3, while SD2 and SD10 have no cultured representatives [32]. A large percentage of sequences that were identified as acidobacterial are unclassified representatives of this phylum (Table S2 and Table 4). Acidobacteria are known to be difficult to culture, and despite more than 20 years of culturing efforts, only about 50 species have been successfully cultured and described [32], none of which were isolated from the fynbos biome. On average, more than 40% of the acidobacterial sequences from the honeybush and rooibos samples were from unclassified sequences. This relatively high percentage indicates a niche that is unique and can provide opportunities to isolate novel species. Some subdivisions of interest include SDs 2, 3, and 10, since these subdivisions are in high abundance but underrepresented in culture collections.
The key factors that influenced the Acidobacteria community composition and structure, according to the CCA analysis, was pH, P, Ca2+, and C in the honeybush soil, and pH and Ca2+ in the rooibos soil (Figure 5 and Table S3). Of these, soil pH was the most significant indicator within the honeybush soil samples (p < 0.001). In this study, we have shown that the response of Acidobacteria SDs 1, 3, 5, 10, and 11 correlated to soil pH. This agrees with several other studies that have indicated a strong correlation of Acidobacteria to soil pH; although, the reports on the effect of soil pH has been inconsistent, where some studies indicated a negative correlation [5,30,31,34] and others a positive correlation [70,71,72]. It is possible that the Acidobacteria have adapted to better fit the fynbos environment compared to other soil environments. As one study revealed, some Acidobacteria were better adapted to more acidic environments, such as those with a pH between 2 and 3, than Acidobacteria from other environments [26]. Despite the strong correlation with pH (positive or negative), it is still unclear whether pH has a direct effect on the Acidobacteria, or if this is the result of other environmental factors that covary with pH.
This study has also shown the response of Acidobacteria to other soil abiotic properties, like C, Ca2+, and P. Acidobacteria was initially described as oligotrophic. However, this can create a misconception as recent studies have revealed that not all SDs, or even OTUs in the same SD, are oligotrophic [36,66,71,72]. Not all Acidobacteria will, therefore, have the same biological strategy and variations could occur within the Acidobacteria phylum. This was observed in this study, where a high relative abundance was measured within these rhizosphere soils where nutrient availability fluctuates; SDs 1, 3, and 13 positively correlated to soil C; and SDs 1 and 3 correlated with P and Ca2+ in the honeybush soils (Figure 5a). Considering these soil properties (pH, Ca2+, P, and C) as key factors (Figure 5) and their measured values (Table 1 and Table 2), a significant difference was observed only in soil pH between the cultivated and uncultivated soil as well as for soil C between the wet winter and dry summer in the honeybush soils. With an increase in soil C in the wet winter, the relative abundance of Acidobacteria increased. With an increase in soil pH in the cultivated soil, the Acidobacteria relative abundance also increased.

5. Conclusions

Although Acidobacteria is one of the most dominant phyla in soil communities, few species have been described and little is known about their function. In this study, we have shown that the relative abundance of Acidobacteria was significantly higher in the wet winter seasons compared to the dry summer seasons in the rooibos soil, but the increase was not significant in the honeybush soil. A decrease in soil temperature could be contributing to this increase, as most Acidobacteria are either classified as mesophiles or psychrotolerant with a slow metabolic activity. The community composition was also significantly different between the honeybush cultivated and uncultivated soil. Although the distribution of SDs was not specific to the season or land use, the dominant SD represented for each plant was different. SD1 was the dominant SD in the honeybush soil and SD3 in the rooibos soil. Soil pH, C, Ca2+, and P are also important indicators that influenced acidobacterial community composition and structure within these biomes. Despite the differences observed, this study only focused on the Acidobacteria, which represents only a portion of the total bacterial community. Therefore, these differences could also be influenced by the presence of other microorganisms and their interactions, whether directly or indirectly, with the Acidobacteria. Our understanding of Acidobacteria and how they survive in these harsh conditions of acidic soils with low nutrient and water availability is far from complete. More research is needed to isolate new species, determine their function, and determine why they are so abundant in the soil environment.

Supplementary Materials

The following are available online at https://www.mdpi.com/1424-2818/12/7/277/s1. Table S1: Sequencing results of both honeybush and rooibos and their acidobacterial relative abundances for each sample. Table S2: Taxonomic classification of OTUs identified in both honeybush and rooibos. OTUs are ranked from the highest representation within all samples to the lowest. Table S3: Adonis test results of the significant correlations between OTUs and soil abiotic properties. Figure S1: Geographical locations of sampling sites in (a) South Africa. Samples were collected from five different farms that specializes in the production of Rooibos and Honeybush tea; two farms for (b) rooibos and three farms for (c) honeybush. Both uncultivated (green) and cultivated (red) samples were collected from each farm for each sampling season. Uncultivated and cultivated plants are grown within proximity of each other. Figure S2: Average relative abundance (%) of Acidobacteria subdivisions (at the class level) for each sample group, where HC—honeybush cultivated; HN—honeybush uncultivated; HD—honeybush dry; HW—honeybush wet; RC—rooibos cultivated; RN—rooibos uncultivated; RD—rooibos dry; and RW—rooibos wet.

Author Contributions

Conceptualization, T.C. and K.J.; formal analysis, T.C.; funding acquisition, K.J.; investigation, T.C.; methodology, T.C.; project administration, K.J.; resources, K.J.; supervision, K.J.; visualization, T.C.; writing—original draft, T.C.; writing—review and editing, K.J. All authors have read and agreed to the published version of the manuscript.

Funding

This research was funded by the National Research Foundation of South Africa, grant number 112070.

Acknowledgments

The authors of this article would like to thank R. De Wet for his help. We acknowledge the use of data from [13,14]. We also extend our gratitude to the anonymous reviewers for their comments and suggestion to improve this manuscript.

Conflicts of Interest

The authors declare no conflict of interest.

References

  1. Rebelo, A.G.; Boucher, C.; Helme, N.; Mucina, L.; Rutherford, M.C. Fynbos Biome. In The Vegetation of South Africa, Lesotho and Swaziland; South African National Biodiversity Institute: Pretoria, South Africa, 2006; pp. 52–219. [Google Scholar]
  2. Cowling, R.M.; Rundel, P.W.; Lamont, B.B.; Arroyo, M.K.; Arianoutsou, M. Plant diversity in mediterranean-climate regions. Trends Ecol. Evol. 1996, 11, 362–366. [Google Scholar] [CrossRef]
  3. Cowling, R.M.; Ojeda, F.; Lamont, B.B.; Rundel, P.W.; Lechmere-Oertel, R. Rainfall reliability, a neglected factor in explaining convergence and divergence of plant traits in fire-prone mediterranean-climate ecosystems. Glob. Ecol. Biogeogr. 2005, 14, 509–519. [Google Scholar] [CrossRef]
  4. Joubert, E.; Gelderblom, W.C.A.; Louw, A.; de Beer, D. South African herbal teas: Aspalathus linearis, Cyclopia spp. and Athrixia phylicoides-A review. J. Ethnopharmacol. 2008, 119, 376–412. [Google Scholar] [CrossRef] [PubMed]
  5. Navarrete, A.A.; Kuramae, E.E.; de Hollander, M.; Pijl, A.S.; van Veen, J.A.; Tsai, S.M. Acidobacterial community responses to agricultural management of soybean in Amazon forest soils. FEMS Microbiol. Ecol. 2013, 83, 607–621. [Google Scholar] [CrossRef] [PubMed] [Green Version]
  6. Montecchia, M.S.; Tosi, M.; Soria, M.A.; Vogrig, J.A.; Sydorenko, O.; Correa, O.S.; Moora, M. Pyrosequencing Reveals Changes in Soil Bacterial Communities after Conversion of Yungas Forests to Agriculture. PLoS ONE 2015, 10, e0119426. [Google Scholar] [CrossRef]
  7. Trivedi, P.; Delgado-Baquerizo, M.; Anderson, I.C.; Singh, B.K. Response of soil properties and microbial communities to agriculture: Implications for primary productivity and soil health indicators. Front. Plant Sci. 2016, 7, 990. [Google Scholar] [CrossRef] [Green Version]
  8. Jesus, E.D.C.; Marsh, T.L.; Tiedje, J.M.; Moreira, F.M.D.S. Changes in land use alter the structure of bacterial communities in Western Amazon soils. ISME J. 2009, 3, 1004–1011. [Google Scholar] [CrossRef]
  9. Fierer, N.; Lauber, C.L.; Ramirez, K.S.; Zaneveld, J.; Bradford, M.A.; Knight, R. Comparative metagenomic, phylogenetic and physiological analyses of soil microbial communities across nitrogen gradients. ISME J. 2012, 6, 1007–1017. [Google Scholar] [CrossRef] [Green Version]
  10. Lauber, C.L.; Hamady, M.; Knight, R.; Fierer, N. Pyrosequencing-based assessment of soil pH as a predictor of soil bacterial community structure at the continental scale. Appl. Environ. Microbiol. 2009, 75, 5111–5120. [Google Scholar] [CrossRef] [Green Version]
  11. Fierer, N. Embracing the unknown: Disentangling the complexities of the soil microbiome. Nat. Rev. Microbiol. 2017, 15, 579–590. [Google Scholar] [CrossRef]
  12. Fierer, N.; Schimel, J.P. Effects of drying-rewetting frequency on soil carbon and nitrogen transformations. Soil Biol. Biochem. 2002, 34, 777–787. [Google Scholar] [CrossRef]
  13. Postma, A.; Slabbert, E.; Postma, F.; Jacobs, K. Soil bacterial communities associated with natural and commercial Cyclopia spp. FEMS Microbiol. Ecol. 2016, 92, 1–10. [Google Scholar] [CrossRef] [PubMed] [Green Version]
  14. Brink, C.; Postma, A.; Slabbert, E.; Postma, F.; Muasya, A.; Jacobs, K. Bacterial communities associated with natural and commercially grown rooibos (Aspalathus linearis). Pedosphere 2019, in press. [Google Scholar]
  15. Aulakh, M.S.; Wassmann, R.; Bueno, C.; Kreuzwieser, J.; Rennenberg, H. Characterization of root exudates at different growth stages of ten rice (Oryza sativa L.) cultivars. Plant Biol. 2001, 3, 139–148. [Google Scholar] [CrossRef] [Green Version]
  16. Bell, C.W.; Acosta-Martinez, V.; McIntyre, N.E.; Cox, S.; Tissue, D.T.; Zak, J.C. Linking microbial community structure and function to seasonal differences in soil moisture and temperature in a Chihuahuan Desert grassland. Microb. Ecol. 2009, 58, 827–842. [Google Scholar] [CrossRef]
  17. Pietikäinen, J.; Pettersson, M.; Bååth, E. Comparison of temperature effects on soil respiration and bacterial and fungal growth rates. FEMS Microbiol. Ecol. 2005, 52, 49–58. [Google Scholar] [CrossRef]
  18. Barns, S.M.; Takala, S.L.; Kuske, C.R. Wide distribution and diversity of members of the bacterial kingdom Acidobacterium in the environment. Appl. Environ. Microbiol. 1999, 65, 1731–1737. [Google Scholar] [CrossRef] [Green Version]
  19. Tank, M.; Costas, A.M.G.; Bryant, D.A. Chloracidobacterium. In Bergey’s Manual of Systematics of Archaea and Bacteria; John Wiley & Sons Ltd.: New York, NY, USA, 2018; pp. 1–9. ISBN 9781118960608. [Google Scholar]
  20. Huber, K.J.; Geppert, A.M.; Wanner, G.; Fösel, B.U.; Wüst, P.K.; Overmann, J. The first representative of the globally widespread subdivision 6 Acidobacteria, Vicinamibacter silvestris gen. nov., sp. nov., isolated from subtropical savannah soil. Int. J. Syst. Evol. Microbiol. 2016, 66, 2971–2979. [Google Scholar] [CrossRef]
  21. Vieira, S.; Luckner, M.; Wanner, G.; Overmann, J. Luteitalea pratensis gen. nov., sp. nov. a new member of subdivision 6 Acidobacteria isolated from temperate grassland soil. Int. J. Syst. Evol. Microbiol. 2017, 67, 1408–1414. [Google Scholar] [CrossRef]
  22. Quaiser, A.; López-García, P.; Zivanovic, Y.; Henn, M.R.; Rodriguez-Valera, F.; Moreira, D. Comparative analysis of genome fragments of Acidobacteria from deep Mediterranean plankton. Environ. Microbiol. 2008, 10, 2704–2717. [Google Scholar] [CrossRef]
  23. O’Connor-Sánchez, A.; Rivera-Domínguez, A.J.; de los Santos-Briones, C.; López-Aguiar, L.K.; Peña-Ramírez, Y.J.; Prieto-Davo, A. Acidobacteria appear to dominate the microbiome of two sympatric Caribbean Sponges and one Zoanthid. Biol. Res. 2014, 47, 67–73. [Google Scholar] [CrossRef] [PubMed] [Green Version]
  24. Zimmermann, J.; Gonzalez, J.M.; Saiz-Jimenez, C.; Ludwig, W. Detection and phylogenetic relationships of highly diverse uncultured acidobacterial communities in Altamira Cave using 23S rRNA sequence analyses. Geomicrobiol. J. 2005, 22, 379–388. [Google Scholar] [CrossRef]
  25. Hugenholtz, P.; Pitulle, C.; Hershberger, K.L.; Pace, N.R. Novel Division Level Bacterial Diversity in a Yellowstone Hot Spring Novel Division Level Bacterial Diversity in a Yellowstone Hot Spring. J. Bacteriol. 1998, 180, 366–376. [Google Scholar] [CrossRef] [PubMed] [Green Version]
  26. Kleinsteuber, S.; Müller, F.D.; Chatzinotas, A.; Wendt-Potthoff, K.; Harms, H. Diversity and in situ quantification of Acidobacteria subdivision 1 in an acidic mining lake. FEMS Microbiol. Ecol. 2008, 63, 107–117. [Google Scholar] [CrossRef] [PubMed] [Green Version]
  27. Barns, S.M.; Cain, E.C.; Sommerville, L.; Kuske, C.R. Acidobacteria phylum sequences in uranium-contaminated subsurface sediments greatly expand the known diversity within the phylum. Appl. Environ. Microbiol. 2007, 73, 3113–3116. [Google Scholar] [CrossRef] [Green Version]
  28. Ludwig, W.; Bauer, S.H.; Bauer, M.; Held, I.; Kirchhof, G.; Huber, I.; Spring, S.; Hartmann, A.; Schleifer, K.H. Detection and in situ identification of representatives o fa widely distributed new bacterial phylum. FEMS Microbiol. Lett. 1997, 153, 181–190. [Google Scholar] [CrossRef]
  29. Dedysh, S.N.; Yilmaz, P. Refining the taxonomic structure of the phylum Acidobacteria. Int. J. Syst. Evol. Microbiol. 2018, 68, 3796–3806. [Google Scholar] [CrossRef]
  30. Janssen, P.H. Identifying the dominant soil bacterial taxa in libraries of 16S rRNA and 16S rRNA genes. Appl. Environ. Microbiol. 2006, 72, 1719–1728. [Google Scholar] [CrossRef] [Green Version]
  31. Jones, R.T.; Robeson, M.S.; Lauber, C.L.; Hamady, M.; Knight, R.; Fierer, N. A comprehensive survey of soil acidobacterial diversity using pyrosequencing and clone library analyses. Int. Soc. Microb. Ecol. 2009, 3, 442–453. [Google Scholar] [CrossRef]
  32. Dedysh, S.N.; Sinninghe Damsté, J.S. Acidobacteria. In eLS; John Wiley & Sons Ltd.: Chichester, UK, 2018; pp. 1–10. [Google Scholar]
  33. Rodrigues, J.L.M.; Pellizari, V.H.; Mueller, R.; Baek, K.; Jesus, E.D.C.; Paula, F.S.; Mirza, B.; Hamaou, G.S.; Tsai, S.M.; Feiglf, B.; et al. Conversion of the Amazon rainforest to agriculture results in biotic homogenization of soil bacterial communities. Proc. Natl. Acad. Sci. USA 2013, 110, 988–993. [Google Scholar] [CrossRef] [Green Version]
  34. Sait, M.; Davis, K.E.R.; Janssen, P.H. Effect of pH on isolation and distribution of members of subdivision 1 of the phylum Acidobacteria occurring in soil. Appl. Environ. Microbiol. 2006, 72, 1852–1857. [Google Scholar] [CrossRef] [PubMed] [Green Version]
  35. Navarrete, A.A.; Venturini, A.M.; Meyer, K.M.; Klein, A.M.; Tiedje, J.M.; Brendan, B.J.; Nüsslein, K.; Tsai, S.M.; Rodrigues, J.L.M. Differential response of Acidobacteria subgroups to forest-to-pasture conversion and their biogeographic patterns in the western Brazilian Amazon. Front. Microbiol. 2015, 6, 1443. [Google Scholar] [CrossRef] [PubMed] [Green Version]
  36. Fierer, N.; Bradford, M.A.; Jackson, R.B. Toward an ecological classification of soil bacteria. Ecology 2007, 88, 1354–1364. [Google Scholar] [CrossRef] [PubMed]
  37. Kielak, A.; Pijl, A.S.; Van Veen, J.A.; Kowalchuk, G.A. Phylogenetic diversity of Acidobacteria in a former agricultural soil. ISME J. 2009, 3, 378–382. [Google Scholar] [CrossRef]
  38. Da Rocha, U.N.; Plugge, C.M.; George, I.; Van Elsas, J.D.; Van Overbeek, L.S. The rhizosphere selects for particular groups of Acidobacteria and Verrucomicrobia. PLoS ONE 2013, 8, e82443. [Google Scholar]
  39. Maseko, S.T.; Dakora, F.D. Accumulation of mineral elements in the rhizosphere and shoots of Cyclopia and Aspalathus species under different settings of the Cape fynbos. S. Afr. J. Bot. 2017, 110, 103–109. [Google Scholar] [CrossRef]
  40. Schloss, P.D.; Gevers, D.; Westcott, S.L. Reducing the Effects of PCR Amplification and Sequencing Artifacts on 16S rRNA-Based Studies. PLoS ONE 2011, 6, e27310. [Google Scholar] [CrossRef] [Green Version]
  41. Schloss, P.D.; Westcott, S.L.; Ryabin, T.; Hall, J.R.; Hartmann, M.; Hollister, E.B.; Lesniewski, R.A.; Oakley, B.B.; Parks, D.H.; Robinson, C.J.; et al. Introducing mothur: Open-Source, Platform-Independent, Community-Supported Software for Describing and Comparing Microbial Communities. Appl. Environ. Microbiol. 2009, 75, 7537–7541. [Google Scholar] [CrossRef] [Green Version]
  42. Edgar, R.C.; Haas, B.J.; Clemente, J.C.; Quince, C.; Knight, R. UCHIME improves sensitivity and speed of chimera detection. Bioinformatics 2011, 27, 2194–2200. [Google Scholar] [CrossRef] [Green Version]
  43. Keet, J.H.; Ellis, A.G.; Hui, C.; Le Roux, J.J. Strong spatial and temporal turnover of soil bacterial communities in South Africa’s hyperdiverse fynbos biome. Soil Biol. Biochem. 2019, 136, 107541. [Google Scholar] [CrossRef]
  44. Stafford, W.H.L.; Baker, G.C.; Brown, S.A.; Burton, S.G.; Cowan, D.A. Bacterial diversity in the rhizosphere of Proteaceae species. Environ. Microbiol. 2005, 7, 1755–1768. [Google Scholar] [CrossRef] [PubMed]
  45. Slabbert, E.; Jacobs, S.M.; Jacobs, K. The soil bacterial communities of South African fynbos riparian ecosystems invaded by Australian Acacia species. PLoS ONE 2014, 9, e86560. [Google Scholar] [CrossRef] [PubMed]
  46. Ward, N.L.; Challacombe, J.F.; Janssen, P.H.; Henrissat, B.; Coutinho, P.M.; Wu, M.; Xie, G.; Haft, D.H.; Sait, M.; Badger, J.; et al. Three genomes from the phylum Acidobacteria provide insight into the lifestyles of these microorganisms in soils. Appl. Environ. Microbiol. 2009, 75, 2046–2056. [Google Scholar] [CrossRef] [Green Version]
  47. Männistö, M.K.; Kurhela, E.; Tiirola, M.; Häggblom, M.M. Acidobacteria dominate the active bacterial communities of Arctic tundra with widely divergent winter-time snow accumulation and soil temperatures. FEMS Microbiol. Ecol. 2013, 84, 47–59. [Google Scholar] [CrossRef] [Green Version]
  48. Lee, S.H.; Cho, J.C. Distribution patterns of the members of phylum Acidobacteria in global soil samples. J. Microbiol. Biotechnol. 2009, 19, 1281–1287. [Google Scholar] [CrossRef]
  49. Mikha, M.M.; Rice, C.W.; Milliken, G.A. Carbon and nitrogen mineralization as affected by drying and wetting cycles. Soil Biol. Biochem. 2005, 37, 339–347. [Google Scholar] [CrossRef]
  50. Van Gestel, M.; Ladd, J.N.; Amato, M. Microbial biomass responses to seasonal change and imposed drying regimes at increasing depths of undisturbed topsoil profiles. Soil Biol. Biochem. 1992, 24, 103–111. [Google Scholar] [CrossRef]
  51. Castro, H.F.; Classen, A.T.; Austin, E.E.; Norby, R.J.; Schadt, C.W. Soil Microbial Community Responses to Multiple Experimental Climate Change Drivers. Appl. Environ. Microbiol. 2010, 76, 999–1007. [Google Scholar] [CrossRef] [Green Version]
  52. Lauber, C.L.; Ramirez, K.S.; Aanderud, Z.; Lennon, J.; Fierer, N. Temporal variability in soil microbial communities across land-use types. ISME J. 2013, 7, 1641–1650. [Google Scholar] [CrossRef]
  53. de Menezes, A.B.; Müller, C.; Clipson, N.; Doyle, E. The soil microbiome at the Gi-FACE experiment responds to a moisture gradient but not to CO2 enrichment. Microbiology 2016, 162, 1572–1582. [Google Scholar] [CrossRef]
  54. Lee, K.C.; Caruso, T.; Archer, S.D.J.; Gillman, L.N.; Lau, M.C.Y.; Cary, S.C.; Lee, C.K.; Pointing, S.B. Stochastic and Deterministic Effects of a Moisture Gradient on Soil Microbial Communities in the McMurdo Dry Valleys of Antarctica. Front. Microbiol. 2018, 9, 1–12. [Google Scholar] [CrossRef] [PubMed] [Green Version]
  55. Bardgett, R.D.; Freeman, C.; Ostle, N.J. Microbial contributions to climate change through carbon cycle feedbacks. ISME J. 2008, 2, 805–814. [Google Scholar] [CrossRef] [Green Version]
  56. Parton, W.; Silver, W.L.; Burke, I.C.; Grassens, L.; Harmon, M.E.; Currie, W.S.; King, J.Y.; Carol Adair, E.; Brandt, L.A.; Hart, S.C.; et al. Global-Scale Similarities in Nitrogen Release Patterns During Long-Term Decomposition. Science 2007, 315, 361–364. [Google Scholar] [CrossRef] [PubMed]
  57. Pankratov, T.A.; Dedysh, S.N. Granulicella paludicola gen. nov., sp. nov., Granulicella pectinivorans sp. nov., Granulicella aggregans sp. nov. and Granulicella rosea sp. nov., acidophilic, polymer-degrading acidobacteria from Sphagnum peat bogs. Int. J. Syst. Evol. Microbiol. 2010, 60, 2951–2959. [Google Scholar] [CrossRef] [PubMed]
  58. Männistö, M.K.; Rawat, S.; Starovoytov, V.; Häggblom, M.M. Terriglobus saanensis sp. nov., an acidobacterium isolated from tundra soil. Int. J. Syst. Evol. Microbiol. 2011, 61, 1823–1828. [Google Scholar] [CrossRef] [PubMed]
  59. García-Fraile, P.; Benada, O.; Cajthaml, T.; Baldrian, P.; Llado, S. Terracidiphilus gabretensis gen. nov., sp. nov., an Abundant and Active Forest Soil Acidobacterium Important in Organic Matter Transformation. Appl. Environ. Microbiol. 2016, 82, 560–569. [Google Scholar] [CrossRef] [Green Version]
  60. Denef, K.; Six, J.; Bossuyt, H.; Frey, S.D.; Elliott, E.T.; Merckx, R.; Paustian, K. Influence of dry-wet cycles on the interrelationship between aggregate, particulate organic matter, and microbial community dynamics. Soil Biol. Biochem. 2001, 33, 1599–1611. [Google Scholar] [CrossRef]
  61. Halverson, L.J.; Jones, T.M.; Firestone, M.K. Release of Intracellular Solutes by Four Soil Bacteria Exposed to Dilution Stress. Soil Sci. Soc. Am. J. 2000, 64, 1630. [Google Scholar] [CrossRef]
  62. Pereira de Castro, A.; Sartori da Silva, M.R.S.; Quirino, B.F.; da Cunha Bustamante, M.M.; Krüger, R.H. Microbial Diversity in Cerrado Biome (Neotropical Savanna) Soils. PLoS ONE 2016, 11, e0148785. [Google Scholar] [CrossRef] [Green Version]
  63. Catão, E.C.P.P.; Lopes, F.A.C.C.; Araújo, J.F.; De Castro, A.P.; Barreto, C.C.; Bustamante, M.M.C.C.; Quirino, B.F.; Krüger, R.H.; Barreto, C.C.; Krüger, R.H.; et al. Soil Acidobacterial 16S rRNA Gene Sequences Reveal Subgroup Level Differences between Savanna-Like Cerrado and Atlantic Forest Brazilian Biomes. Int. J. Microbiol. 2014, 2014, 1–12. [Google Scholar] [CrossRef]
  64. Challacombe, J.F.; Eichorst, S.A.; Hauser, L.; Land, M.; Xie, G. Biological Consequences of Ancient Gene Acquisition and Duplication in the Large Genome of Candidatus Solibacter usitatus Ellin6076. PLoS ONE 2011, 6, 24882. [Google Scholar] [CrossRef] [PubMed] [Green Version]
  65. Kielak, A.M.; Barreto, C.C.; Kowalchuk, G.A.; van Veen, J.A.; Kuramae, E.E. The ecology of Acidobacteria: Moving beyond genes and genomes. Front. Microbiol. 2016, 7, 744. [Google Scholar] [CrossRef] [Green Version]
  66. Singh, B.K.; Munro, S.; Potts, J.M.; Millard, P. Influence of grass species and soil type on rhizosphere microbial community structure in grassland soils. Appl. Soil Ecol. 2007, 36, 147–155. [Google Scholar] [CrossRef]
  67. Lee, S.H.; Ka, J.O.; Cho, J.C. Members of the phylum Acidobacteria are dominant and metabolically active in rhizosphere soil. FEMS Microbiol. Lett. 2008, 285, 263–269. [Google Scholar] [CrossRef] [PubMed] [Green Version]
  68. Kalam, S.; Das, S.N.; Basu, A.; Podile, A.R. Population densities of indigenous Acidobacteria change in the presence of plant growth promoting rhizobacteria (PGPR) in rhizosphere. J. Basic Microbiol. 2017, 57, 376–385. [Google Scholar] [CrossRef]
  69. Crits-Christoph, A.; Diamond, S.; Butterfield, C.N.; Thomas, B.C.; Banfield, J.F. Novel soil bacteria possess diverse genes for secondary metabolite biosynthesis. Nature 2018, 558, 440–444. [Google Scholar] [CrossRef]
  70. Liu, J.; Sui, Y.; Yu, Z.; Yao, Q.; Shi, Y.; Chu, H.; Jin, J.; Liu, X.; Wang, G. Diversity and distribution patterns of acidobacterial communities in the black soil zone of northeast China. Soil Biol. Biochem. 2016, 95, 212–222. [Google Scholar] [CrossRef]
  71. Li, W.; Liu, X.; Niu, S. Differential responses of the acidobacterial community in the topsoil and subsoil to fire disturbance in Pinus tabulaeformis stands. PeerJ 2019, 7, e8047. [Google Scholar] [CrossRef] [Green Version]
  72. Sui, X.; Zhang, R.; Frey, B.; Yang, L.; Li, M.H.; Ni, H. Land use change effects on diversity of soil bacterial, Acidobacterial and fungal communities in wetlands of the Sanjiang Plain, northeastern China. Sci. Rep. 2019, 9, 18535. [Google Scholar] [CrossRef]
Figure 1. The distribution of rooibos (A) and honeybush (B) within the Cape Floristic Region of South Africa.
Diversity 12 00277 g001
Figure 2. Acidobacteria community composition based on the 16S rRNA gene sequence analysis for (a) honeybush and (b) rooibos. Taxonomic classification at the order or family level is according to the Silva 132 database. Subdivisions with no taxonomic classification are indicated as Unclassified. Lines beneath graphs: purple—dry; blue—wet; red—cultivated; and green—uncultivated.
Diversity 12 00277 g002
Figure 3. Box-and-whisker plot of the Shannon diversity index for each plant (honeybush and rooibos), where HC—honeybush cultivated; HN—honeybush uncultivated; HD—honeybush dry; HW—honeybush wet; RC—rooibos cultivated; RN—rooibos uncultivated; RD—rooibos dry; and RW—rooibos wet.
Diversity 12 00277 g003
Figure 4. Principal Coordinate Analyses (PCoA), using the Bray–Curtis dissimilarity index, of the Acidobacteria community composition represented in samples of this study, where (a) is honeybush wet and dry; (b) is honeybush cultivated and uncultivated; (c) is rooibos wet and dry; and (d) is rooibos cultivated and uncultivated. A confidence level at p ≤ 0.05 is considered significant. Blue—wet; purple—dry; red—cultivated; green—uncultivated.
Diversity 12 00277 g004
Figure 5. Canonical correlation analysis (CCA) of acidobacterial OTUs and the significant soil abiotic factors of (a) honeybush and (b) rooibos. Red—SD1; turquoise—SD2; green—SD3; blue—SD4; brown—SD5; purple—SD8; light blue—SD10; orange—SD11; dark green—SD12; grey—SD13; pink—SD15; and yellow—unclassified. OTU taxonomic identification is available in Table S2.
Diversity 12 00277 g005
Table 1. The abiotic properties of the soil surrounding honeybush for both the wet and the dry season, as well as for the cultivated and uncultivated soil. Values are the means ± SD.
Soil PropertiesDry 1Wet 1Cultivated 2Uncultivated 2
pH4.15 ± 0.674.37 ± 0.614.75 ± 0.42 *3.83 ± 0.46 *
H+3.03 ± 2.612.31 ± 2.111.42 ± 1.403.80 ± 2.55
P3.76 ± 2.635.00 ± 2.635.23 ± 2.833.50 ± 2.31
K+52.18 ± 14.2369.17 ± 33.2956.69 ± 28.7561.25 ± 22.20
Na+0.18 ± 0.070.17 ± 0.090.12 ± 0.040.21 ± 0.08
Ca2+1.88 ± 0.871.51 ± 0.791.41 ± 0.771.99 ± 0.84
Mg2+1.27 ± 0.651.03 ± 0.630.92 ± 0.58 *1.38 ± 0.63 *
C2.05 ± 0.73 *11.31 ± 4.90 *6.88 ± 5.745.08 ± 5.52
NO3-N1.28 ± 1.271.48 ± 1.782.26 ± 1.85 *0.63 ± 0.20 *
NH4-N7.08 ± 1.507.59 ± 1.387.28 ± 1.757.30 ± 1.21
A significant difference at a confidence level of * p ≤ 0.05 is indicated for 1 between a wet and a dry season, and 2 between cultivated and uncultivated soil.
Table 2. The abiotic properties of the soil surrounding rooibos for both the wet and the dry season, as well as for the cultivated and uncultivated soil. Values are the means ± SD.
Soil PropertiesDry 1Wet 1Cultivated 2Uncultivated 2
pH4.65 ± 0.384.48 ± 0.294.29 ± 0.24 *4.81 ± 0.19 *
H+0.57 ± 0.300.50 ± 0.220.58 ± 0.300.49 ± 0.22
P6.67 ± 2.105.54 ± 5.068.00 ± 4.13 *4.31 ± 2.75 *
K+49.58 ± 34.0824.62 ± 9.0048.42 ± 34.2625.69 ± 11.18
Na+0.10 ± 0.070.05 ± 0.030.09 ± 0.080.06 ± 0.03
Ca2+0.65 ± 0.360.81 ± 0.540.40 ± 0.201.04 ± 0.41
Mg2+0.32 ± 0.050.34 ± 0.240.25 ± 0.080.41 ± 0.20
C0.31 ± 0.15 *0.77 ± 0.60 *0.39 ± 0.200.70 ± 0.64
NO3-N1.30 ± 0.750.84 ± 0.721.49 ± 0.870.66 ± 0.29
NH4-N7.76 ± 1.838.01 ± 0.858.09 ± 1.577.71 ± 1.21
A significant difference at a confidence level of * p ≤ 0.05 is indicated for 1 between a wet and a dry season, and 2 between cultivated and uncultivated soil.
Table 3. Sequencing results of both honeybush and rooibos and their average relative abundances for each Group ID.
GroupGroup IDFiltered Reads 1Acidobacteria ReadsAverage Relative Abundance (%)p-Value 2
Honeybush CultivatedHC238,52622,5189.4 ± 5.10.09
Honeybush UncultivatedHN405,81528,2707.0 ± 2.4
Honeybush DryHD451,35831,5917.0 ± 2.50.19
Honeybush WetHW192,98319,1979.9 ± 4.9
Rooibos CultivatedRC514,84421,6914.2 ± 5.40.14
Rooibos UncultivatedRN521,04323,4984.5 ± 3.9
Rooibos DryRD717,98114,8112.1 ± 2.00.006 *
Rooibos WetRW317,90630,3789.6 ± 2.8
1 Filtered reads are the number of reads excluding low-quality reads and chimeras. 2 A significant difference in relative abundance is observed at * p ≤ 0.05, using the non-parametric Kruskal–Wallis H-test.
Table 4. Differences in relative abundances (%) detected in the different sample groups, where HC—honeybush cultivated; HN—honeybush uncultivated; HD—honeybush dry; HW—honeybush wet; RC—rooibos cultivated; RN—rooibos uncultivated; RD—rooibos dry; and RW—rooibos wet.
Taxonomic ClassificationHCHNHWHDRCRNRDRW
SubdivisionFamilyGenusMeanSDMeanSDMeanSDMeanSDMeanSDMeanSDMeanSDMeanSD
SD1AcidobacteriaceaeAcidicapsa1.31.52.21.81.21.52.21.70.50.60.31.00.51.10.30.6
Acidipila3.0 *2.09.4 *5.04.6 *5.07.5 *5.38.39.07.75.29.18.77.55.1
Unclassified0.10.20.10.20.10.20.10.20.10.10.20.40.20.20.10.4
Unclassified10.15.513.86.011.55.212.56.312.86.311.68.99.6 *5.413.1 *9.2
Bryocella0.1 *0.10.4 *1.00.41.10.20.30.63.50.81.21.03.40.61.2
Edaphobacter2.32.41.41.81.51.22.02.61.52.11.42.12.32.81.10.8
Granulicella2.1 *0.94.4 *3.32.7 *1.93.7 *3.54.32.64.14.35.14.33.82.8
Occallatibacter1.31.01.40.91.50.81.21.00.60.71.01.80.92.00.80.6
Telmatobacter----- - <0.10.1----<0.10.1
Terracidiphilus2.21.31.61.01.71.21.91.31.41.21.31.41.01.71.50.8
Terriglobus0.61.70.30.50.40.40.51.50.20.30.20.4<0.10.40.30.3
Unclassified0.90.60.40.51.1 *0.60.3 *0.41.00.61.41.10.60.51.40.9
UnclassifiedUnclassified0.10.2--- <0.10.2--0.10.1--<0.10.1
UnclassifiedUnclassified2.51.11.62.02.61.91.71.53.01.75.34.02.31.75.03.8
KoribacteraceaeCandidatus Koribacter2.91.42.71.93.31.82.51.61.61.02.01.31.10.92.11.0
UnclassifiedUnclassified20.37.213.76.723.2 *6.913.1 *5.48.95.68.95.16.85.49.75.0
UnclassifiedUnclassified0.10.1--0.10.1--0.10.10.10.1<0.10.10.10.1
SD2UnclassifiedUnclassified13.29.29.74.69.0 *3.512.7 *8.33.94.71.91.71.71.83.24.2
SD3SolibacteraceaeUnclassified0.10.3--0.10.3--- ------
Bryobacter13.31.814.84.214.23.914.03.123.210.421.07.323.810.621.36.8
Candidatus Solibacter18.04.716.46.716.54.017.57.216.68.416.810.819.813.415.55.4
Unclassified<0.10.1--<0.10.1----<0.10.1--<0.10.1
Paludibaculum<0.10.1<0.10.1<0.10.1<0.10.1--0.10.20.10.2--
Unclassified3.41.54.73.03.02.14.82.79.55.912.04.910.45.711.14.9
Unclassified<0.10.1----<0.10.1<0.10.0<0.10.1--<0.10.1
SD4PyrinomonadaceaePyrinomonas--<0.10.2<0.10.2----------
UnclassifiedUnclassified--------0.10.3<0.10.10.10.3<0.10.1
SD5UnclassifiedUnclassified0.9 *0.80.2 *0.40.70.70.40.70.40.40.30.30.40.40.30.3
SD8UnclassifiedUnclassified0.10.20.10.30.10.20.10.3<0.10.10.30.50.10.10.20.5
SD10ThermoanaerobaculaceaeUnclassified0.60.80.30.70.2 *0.30.5 *0.91.32.31.21.62.62.50.71.0
SD11UnclassifiedUnclassified<0.10.1----<0.10.1--------
SD12UnclassifiedUnclassified0.10.10.10.30.10.10.10.3--------
SD13UnclassifiedUnclassified0.50.60.30.40.40.40.40.5<0.10.10.10.1--0.10.2
SD15UnclassifiedUnclassified0.10.2<0.10.10.10.2<0.10.10.10.10.10.1<0.10.00.10.2
* A significant difference in relative abundance was observed at * p ≤ 0.05, using metastats.

