Article

Effects of Upwelling Intensity on Nitrogen and Carbon Fluxes through the Planktonic Food Web off A Coruña (Galicia, NW Spain) Assessed with Stable Isotopes

Instituto Español de Oceanografia, Centro Oceanográfico de A Coruña, Apdo 130, 15080 A Coruña, Spain
*
Author to whom correspondence should be addressed.
Diversity 2020, 12(4), 121; https://doi.org/10.3390/d12040121
Submission received: 12 March 2020 / Revised: 23 March 2020 / Accepted: 24 March 2020 / Published: 25 March 2020
(This article belongs to the Special Issue Marine Nitrogen Cycling and Food Webs)

Abstract

:
The input of new nutrients by upwelling in shelf waters, and the associated carbon and nitrogen fluxes, can be traced by their stable isotope signatures in organic matter. Here, we analyze the relationships between upwelling intensity and natural abundance of stable carbon and nitrogen isotopes in seston, sedimented particles, and four plankton size fractions (200 to 5000 µm) sampled monthly during 2010 and 2011 in a seasonal upwelling ecosystem. Upwelling modified the seasonal warming stratification by introducing cold and nutrient-rich waters in subsurface layers, enhancing chlorophyll-a and diatom abundance. Seston and sedimented particles were enriched in heavy nitrogen (but not carbon) isotopes linearly with upwelling intensity, indicating a primary effect of upwelling on phytoplankton production. In contrast, all plankton fractions were enriched in heavy carbon isotopes with upwelling, mainly due to the consumption of diatoms. These results confirm the differential effect of upwelling on nitrogen and carbon fluxes in the plankton food web. Direct effects of the new nitrogen inputs on phytoplankton are less evident with the increase of plankton size as nitrogen is repeatedly recycled, while the enriched carbon of plankton suggests the consumption of diatoms during upwelling. We provide linear equations to assess the influence of changes in upwelling intensity on nitrogen and carbon fluxes in seston and plankton in this ecosystem, as well as to estimate reference baseline values for food web studies.

1. Introduction

Coastal upwelling ecosystems are characterized by higher biological production than ecosystems at similar latitudes but with seasonal variability in nutrient inputs [1,2]. High production events of days to weeks occur through a favorable upwelling season, alternated with nutrient regeneration periods [3,4]. In these ecosystems, upwelling is generally the primary source of new (external) nutrients fueling primary production, but this can be influenced by inputs from continental origins, particularly near large rivers [5]. Upwelling nutrient inputs in the photic layer produce a primary response of phytoplankton growth (blooming of diatoms in a few days) closely followed by increases in bacteria and protozoans (in a few days), and later (in a few weeks) by increases in metazoan zooplankton [6]. The transfer of nutrients (mainly C and N) up the food web is assumed to be highly efficient in these systems because of the repetition of upwelling events and the presence of dense plankton populations leading to large populations of fish and other consumers [2].
Upwelling productivity is expected to increase with climate change because of an increase in favorable winds [1,7], but its effect on different components of the food webs requires further research. For instance, large scale fluctuations in the populations of plankton and planktivorous fish in different upwelling ecosystems were associated mainly with changes in low-frequency atmospheric pressure and oceanic temperature [8], but currently, there is not a full understanding of the combination of climate forcing, local physical processes, nutrient fluxes, and biology producing such fluctuations mainly because of the complex responses of the plankton communities [9].
Analysis of the natural abundance of stable nitrogen and carbon isotopes can provide clues on the relevant fluxes and fate of nutrients and organic matter produced by upwelling. Nitrogen isotopes can trace the upwelled nitrate because its relative enrichment in heavy (15N) isotopes compared to ammonium released in surface waters [10]. Also, there is a trophic enrichment in 15N isotopes in every trophic step, due to the preferential excretion of light isotopes by consumers [11]. This allows for the estimation of trophic positions of consumers relative to a known isotopic baseline by assuming specific values of trophic enrichment. Determinations of appropriate baselines depend on a good knowledge of the N sources used by primary producers [11]. The sources of carbon for upwelling food webs can be also traced, because, in contrast with nitrogen, there is almost no enrichment in heavy carbon isotopes through the food web [11,12]. However, diatom carbon is relatively enriched in heavy isotopes compared to other phytoplankton, thus providing a marker that can be used to trace their importance for zooplankton [13], as diatoms are the dominant phytoplankton in upwelling ecosystems [14].
Galicia (NW Spain) is at the northern limit of the boundary upwelling system of the northeastern Atlantic and receives the seasonal (March-October) influence of pulses or north-eastern wind parallel to the coast [15,16]. High primary production, plankton biomass, as well as high yields of fisheries and aquaculture products are sustained mainly by the upwelling [17], but other nutrient inputs from continental origin were identified as being locally important [4,18]. In this region, decadal changes in primary production [16,19] and in zooplankton biomass and composition [19] were only related in part to upwelling intensity, as continental inputs of nutrients from rainfall and river outflow affected plankton populations at multiple scales.
The objective of this study is to determine the influence of variations in upwelling intensity on nitrogen and carbon fluxes in plankton by analyzing seasonal variations in the natural abundance of stable isotopes in seston, sedimented particles, and plankton size fractions. The underlying hypothesis is that the plankton food web is supported mainly by new nitrogen (i.e., nitrate) introduced by the upwelling, while diatoms are the main carbon source for plankton consumers.

2. Materials and Methods

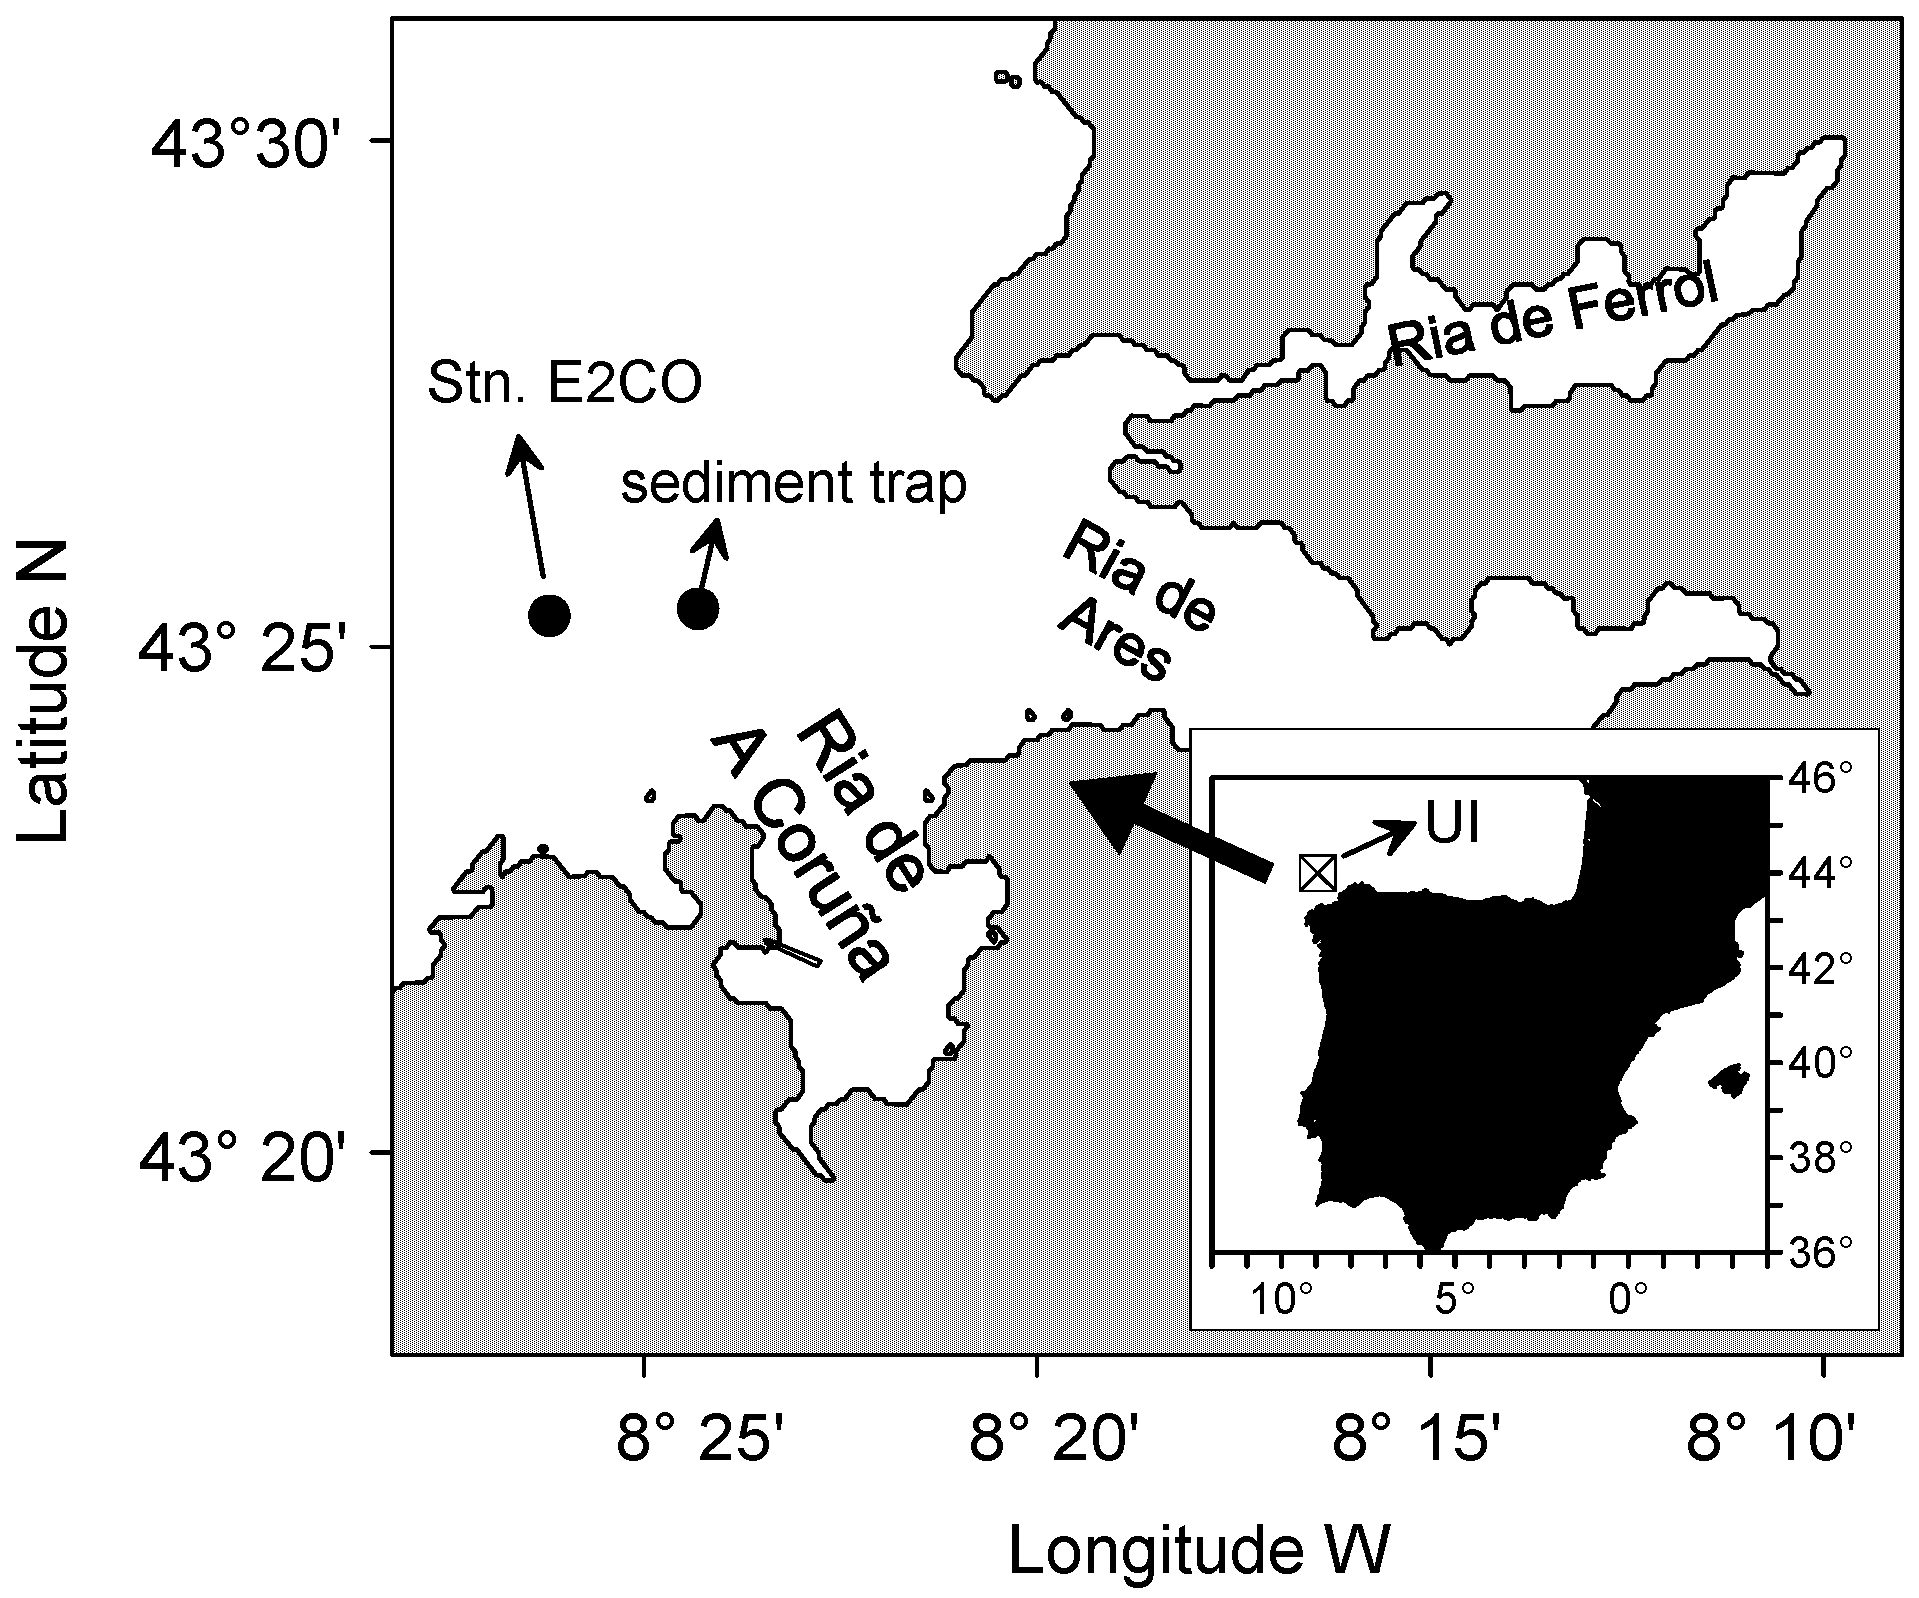
2.1. Sampling and Determination of Environmental Variables

Samples of water, seston and plankton were collected approximately at a monthly frequency in 2010 and 2011 at St. E2CO (80 m depth) off A Coruña (Figure 1). This station is part of the observational time series project RADIALES of the Instituto Español de Oceanografía (http://www.seriestemporales-ieo.com/) and was sampled uninterruptedly since 1989. Water samples at 0, 5, 10, 20, 30, 40 and 70 m were obtained by the deployment of a CTD-rosette equipped with Niskin bottles. Aliquots were employed for determination of dissolved nutrients, chlorophyll, phytoplankton species composition, and natural abundance of seston stable nitrogen and carbon isotopes. Dissolved nutrients included total nitrate (nitrate plus nitrite), phosphate, and ammonium, and were determined by segmented-flow analysis (Bran-Luebbe). Chlorophyll a (Chla) was determined in 90% acetone extracts by fluorometry after filtration of 200 mL of water through GF/F filters. Total diatom abundance (cells L−1) was determined in 50 to 100 mL aliquots preserved in Lugol’s solution by the Utermöhl technique. Seston was collected by vacuum filtration of up to 1 L of water through GF/F filters and stored frozen (−20 °C). Temperature and salinity profiles were obtained with a SeaBird SBE-25 CTD. Details on the analytical methods, plankton species composition and biomass, and environmental conditions at this station can be found elsewhere [19,20,21].
We collected mesoplankton (200–5000 µm) by double oblique tows of a Juday-Bogorov net (200 μm mesh size) between the surface and the bottom. Samples were fractionated using sieves to obtain four size-fractions (200–500, 500–1000, 1000–2000, and >2000 µm) and dried (50 °C, 48 h) immediately after collection.
Sinking particles were collected by means of a particle interceptor trap of 6 cm diameter deployed for 24 h at 50 m depth and anchored to the seafloor at a fixed point close to Stn. E2CO. Sediment trap deployments were made at the same dates of water and plankton sampling. Details of sampling and limitations of this approach can be found in Bode et al. [21].

2.2. Stable Isotope Anaysis

Dried (50 °C, 24 h) and finely ground (mortar and pestle) aliquots of plankton or whole filters in the case of seston were packed in tin capsules for conversion into CO2 and N2 in an elemental analyzer (Carlo Erba CHNSO 1108) coupled to an isotope ratio mass spectrometer (Finnigan Mat Delta Plus). Samples were not acidified to remove carbonates because zooplankton is only lightly calcified [22]. Nitrogen and carbon stable isotope abundance was expressed as δ15N and δ13C relative to atmospheric N2 isotope and VPDB (Vienna PeeDee Belemnite carbonate), respectively [23]. Standards of the International Atomic Energy Agency USGS40 and L-alanine, as well as internal acetanilide and sample standards, were analyzed with each batch of samples to ensure offsets between certified and measured values <0.1‰. Precision (± standard error) of replicate determinations of both C and N stable isotopes was <0.03‰. For comparison with water-column integrated plankton values, the weighted average of isotopic values for seston was computed for each sampling date by taking into account the depth distribution of C and N [24]. δ13C values for plankton fractions were normalized to correct for their variable lipid content using the sample C:N weight ratio following the empirical relationship derived from meta-analysis in aquatic animals [25]:
corrected δ13C = uncorrected δ13C −3.32 + 0.99 C:N

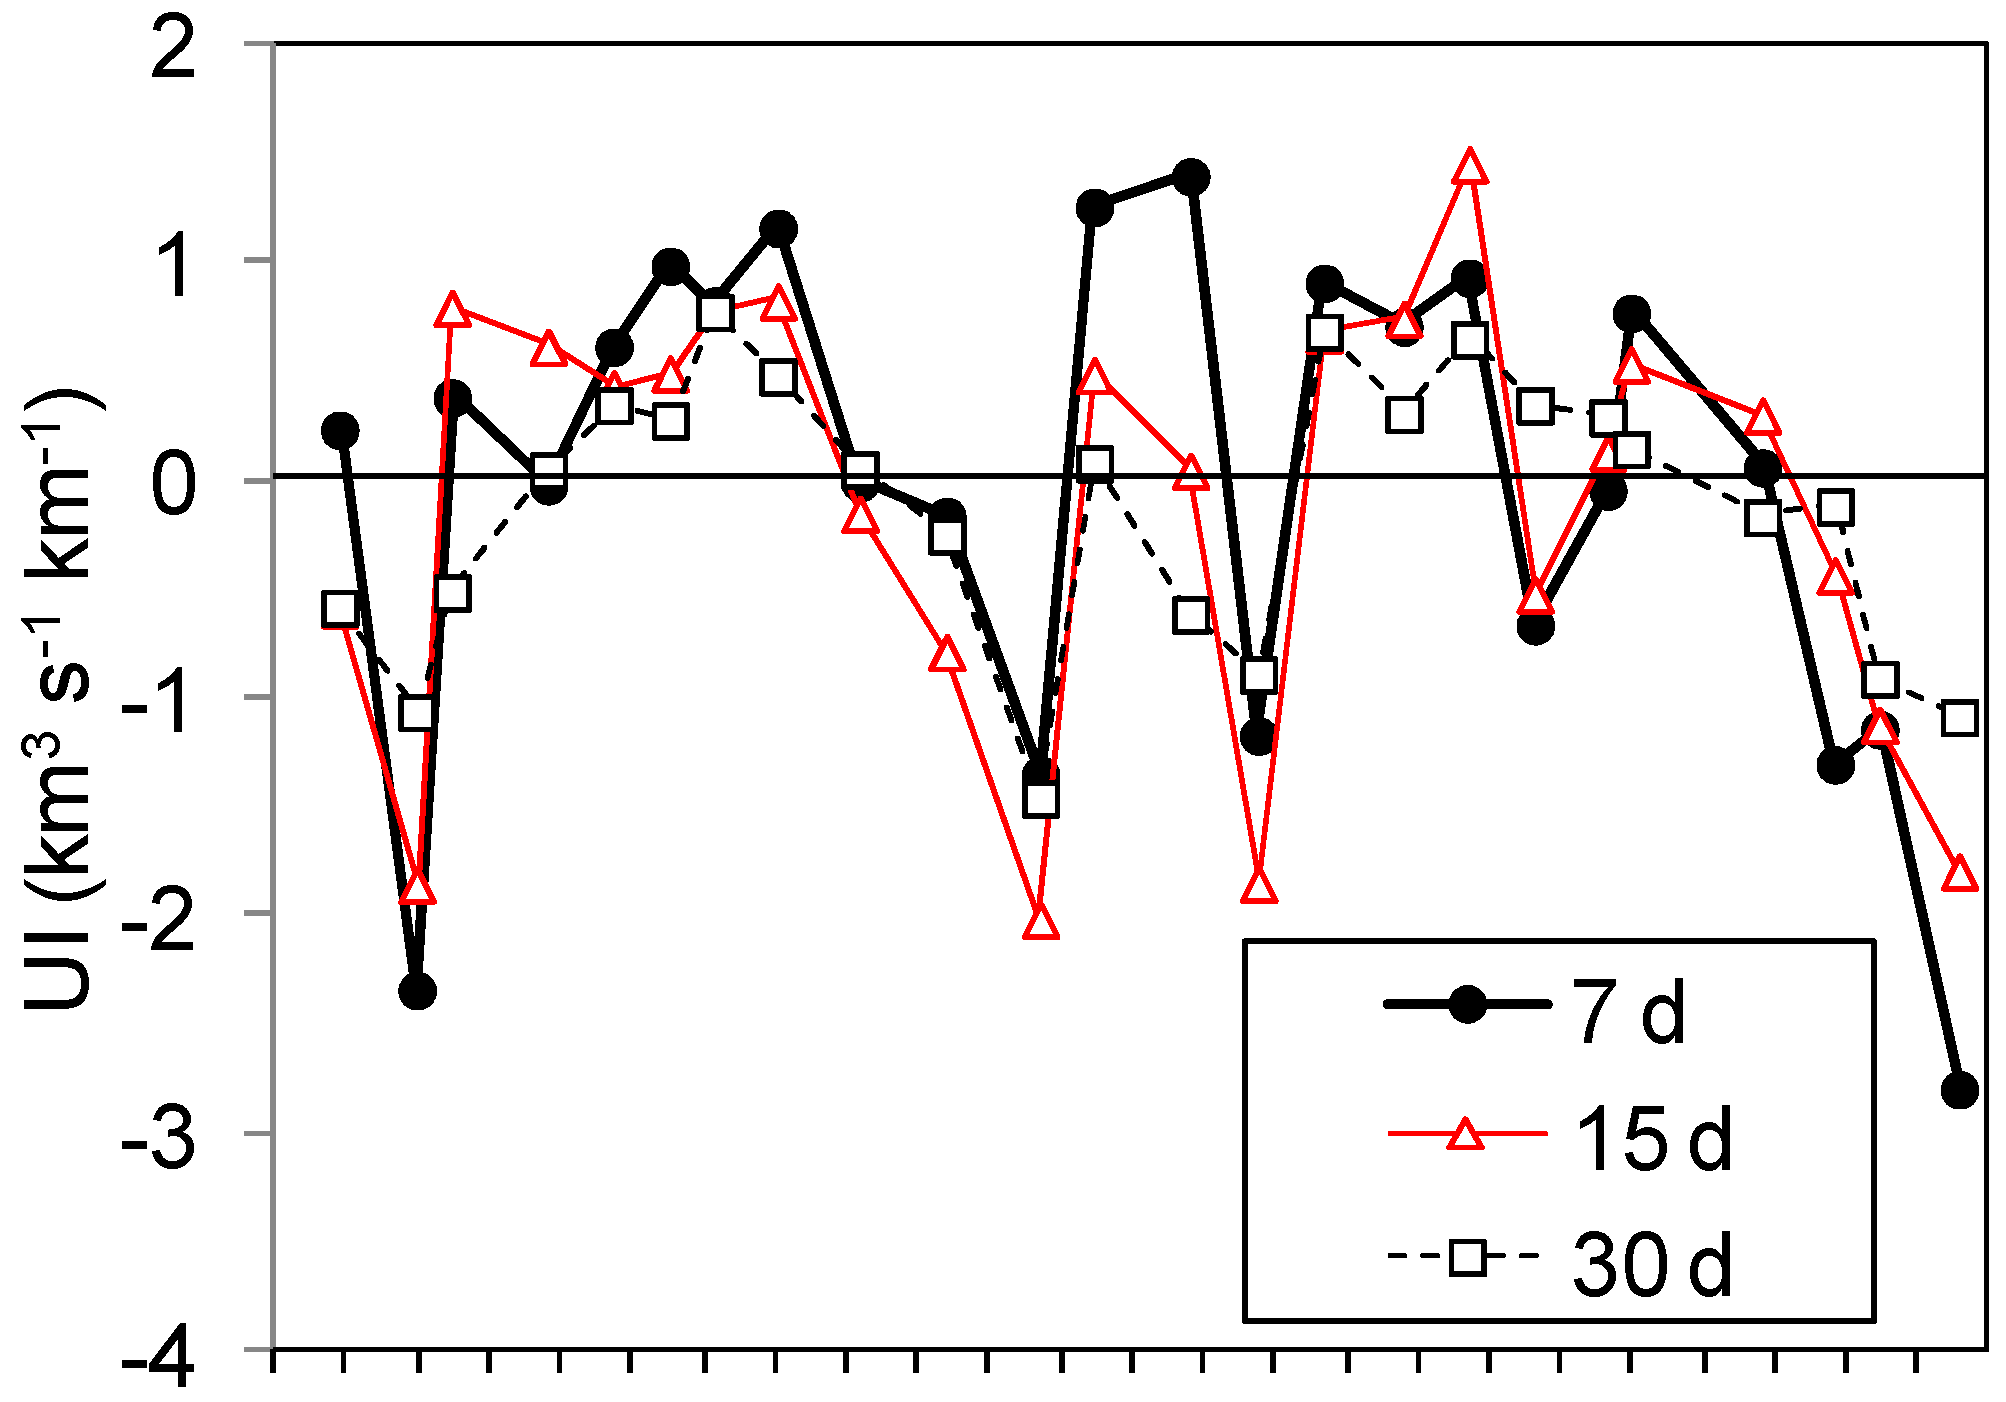
2.3. Upwelling Intensity

Upwelling intensity (UI) was estimated by calculating the Ekman transport from surface winds (m3 s−1 km−1) computed by the Instituto Español de Oceanografía (http://www.indicedeafloramiento.ieo.es/) in a cell of 1° × 1° centered at 44°N, 9°W from atmospheric pressure at sea level [26]. This location is representative of the subregional wind regime affecting upwelling in northern Galicia. Positive values of this index indicate net upwelling periods when surface water is transported offshore, while negative values indicate an accumulation of surface water against the coast (downwelling). For the purpose of the present study, 6-hourly UI values were averaged over the 7, 15 or 30 days (UI7, UI15, and UI30, respectively) preceding each sampling event of E2CO station, as previous studies indicated that Chla was correlated with upwelling events occurring several days before sampling [27].

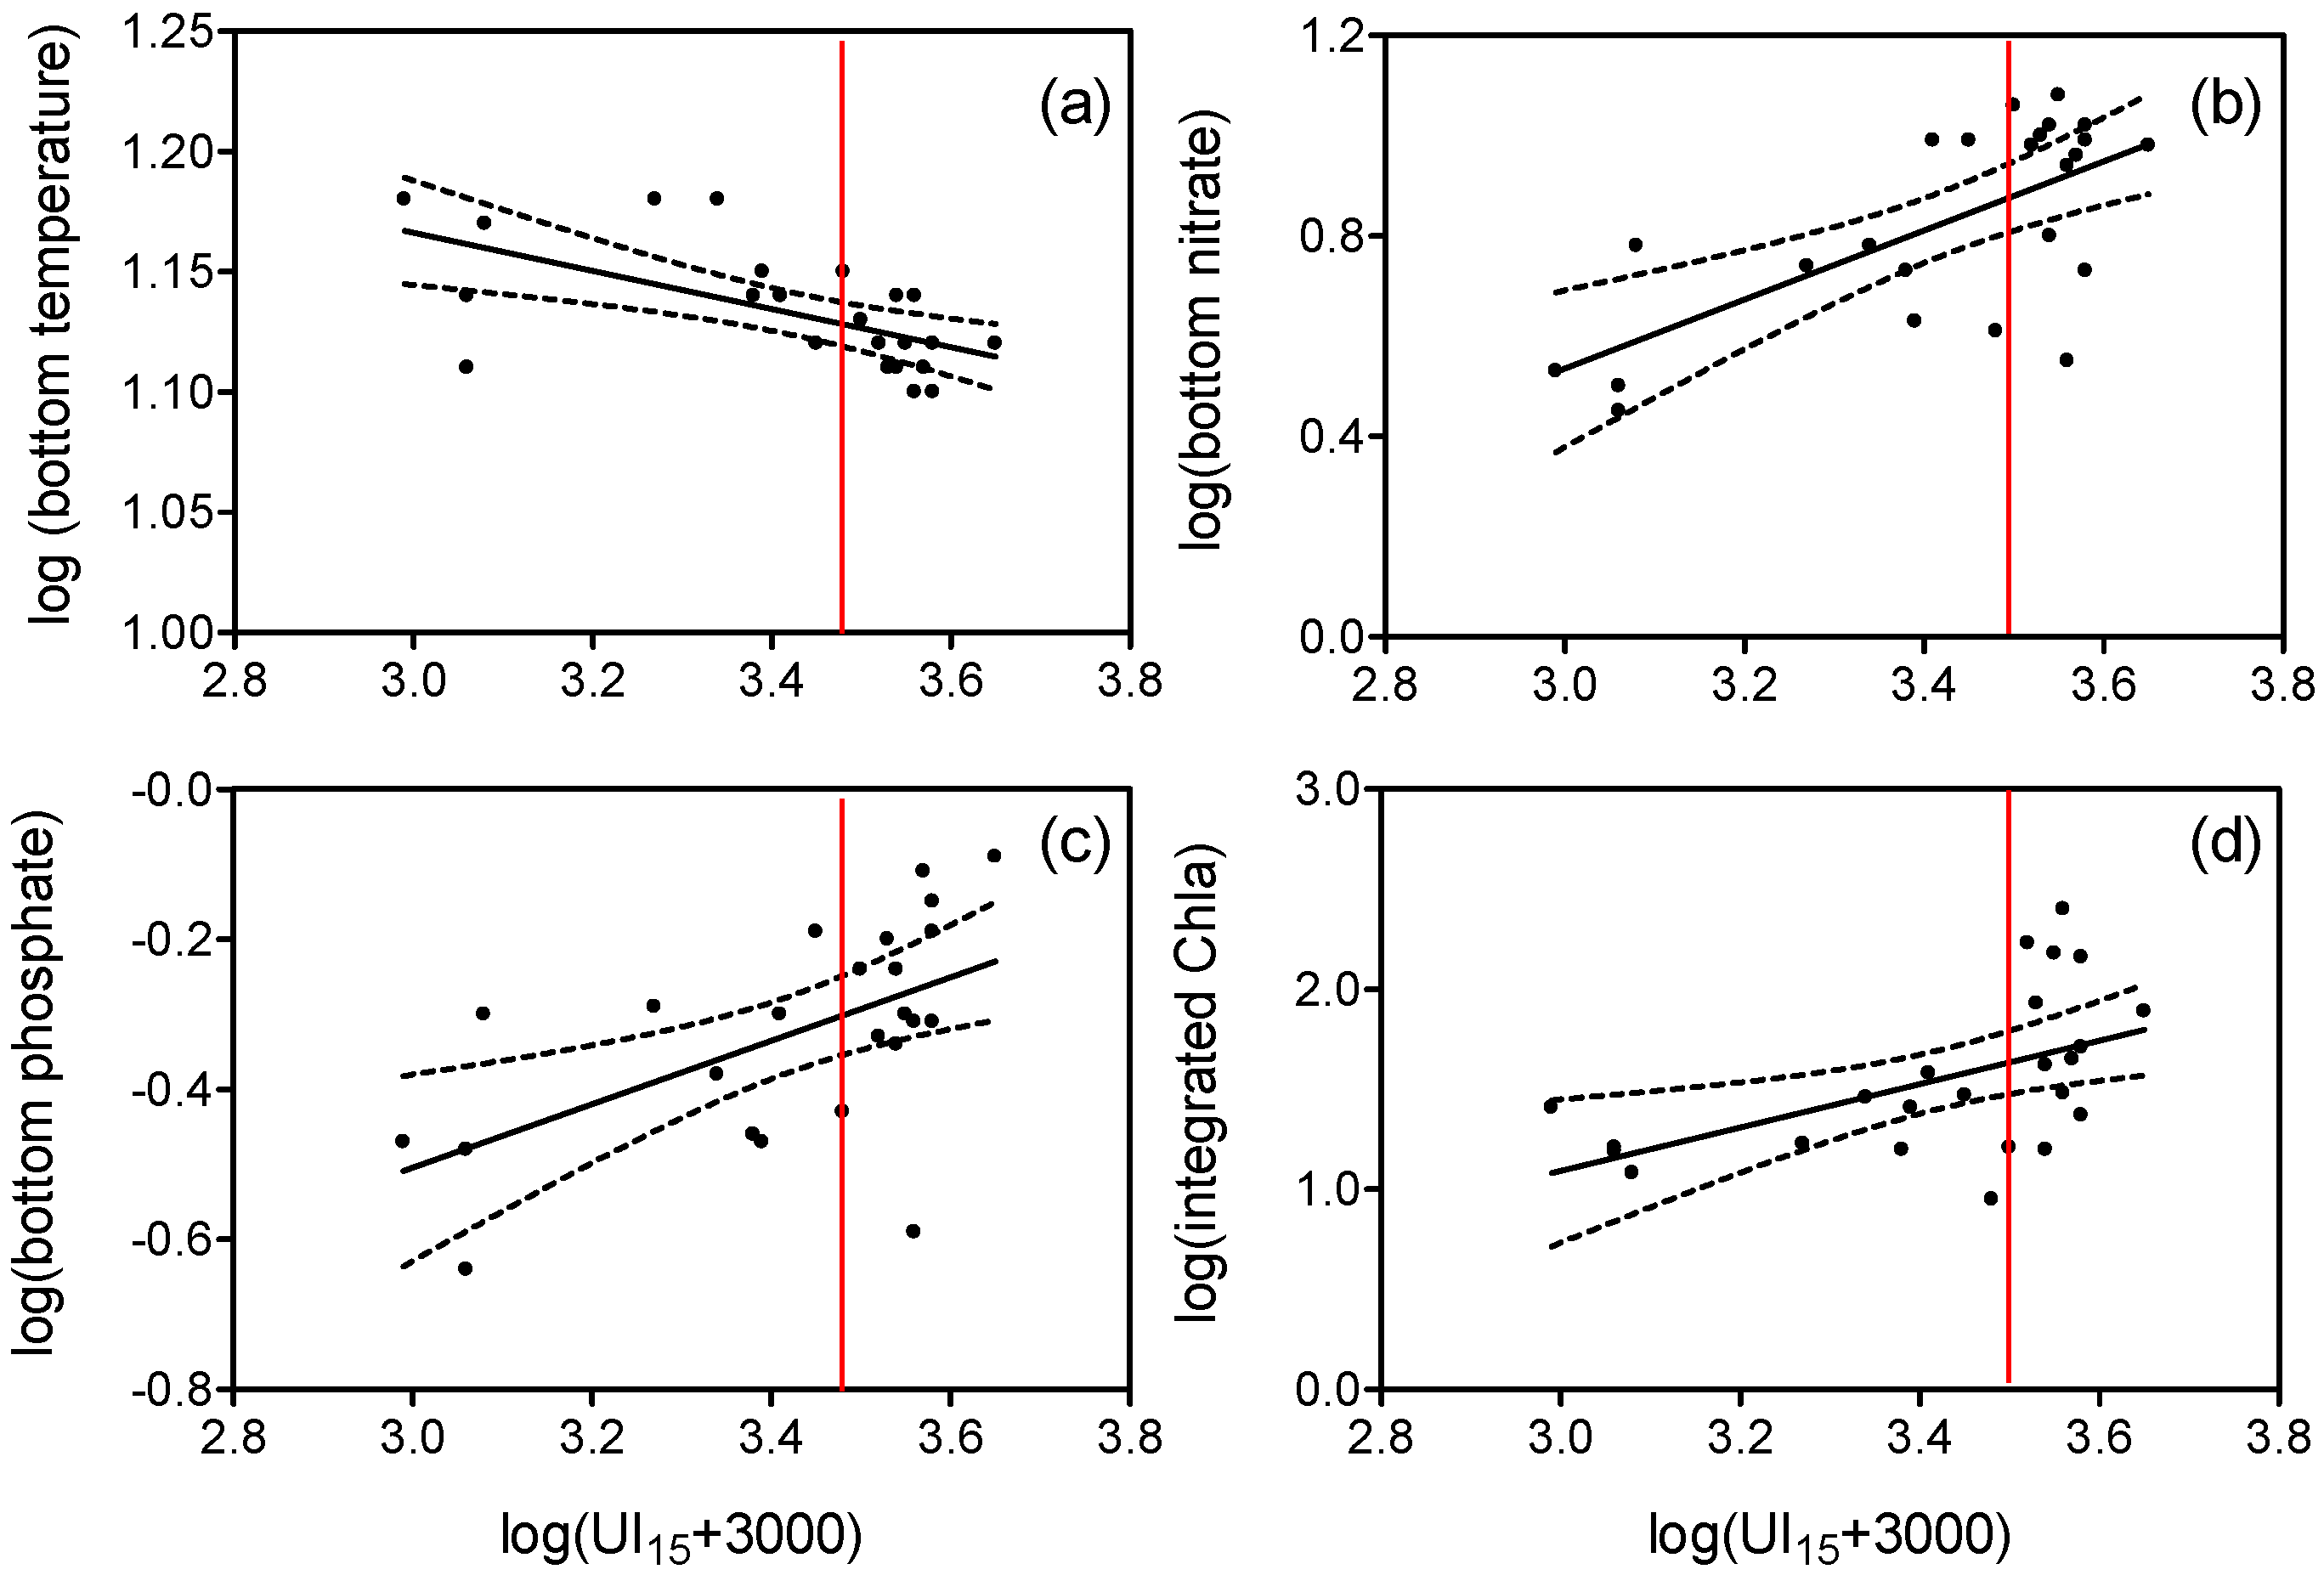
2.4. Statistical Analysis

The relationships between upwelling and other variables were analyzed by correlation (Pearson coefficient) and linear regression (ordinary least squares). All variables were normally distributed after logarithmic transformations (Shapiro-Wilk normality test, P < 0.05). Constant values were added to UI and δ13C values prior to transformation to avoid negative numbers. Differences between mean values of isotope abundance in the different compartments were assessed with ANOVA and Bonferroni post-hoc tests. Differences between regression slopes were determined with ANCOVA. Corrections for inequality of variances were applied as required. As the observations were obtained along a gradient of time, the residuals of the regressions were tested for autocorrelation (Durbin-Watson test, Supplementary Table S1). Statistical analysis was made using the package Past version 4.0 [28]. All raw data used in this study can be accessed through the PANGAEA repository (https://doi.pangaea.de/10.1594/PANGAEA.911575).

3. Results

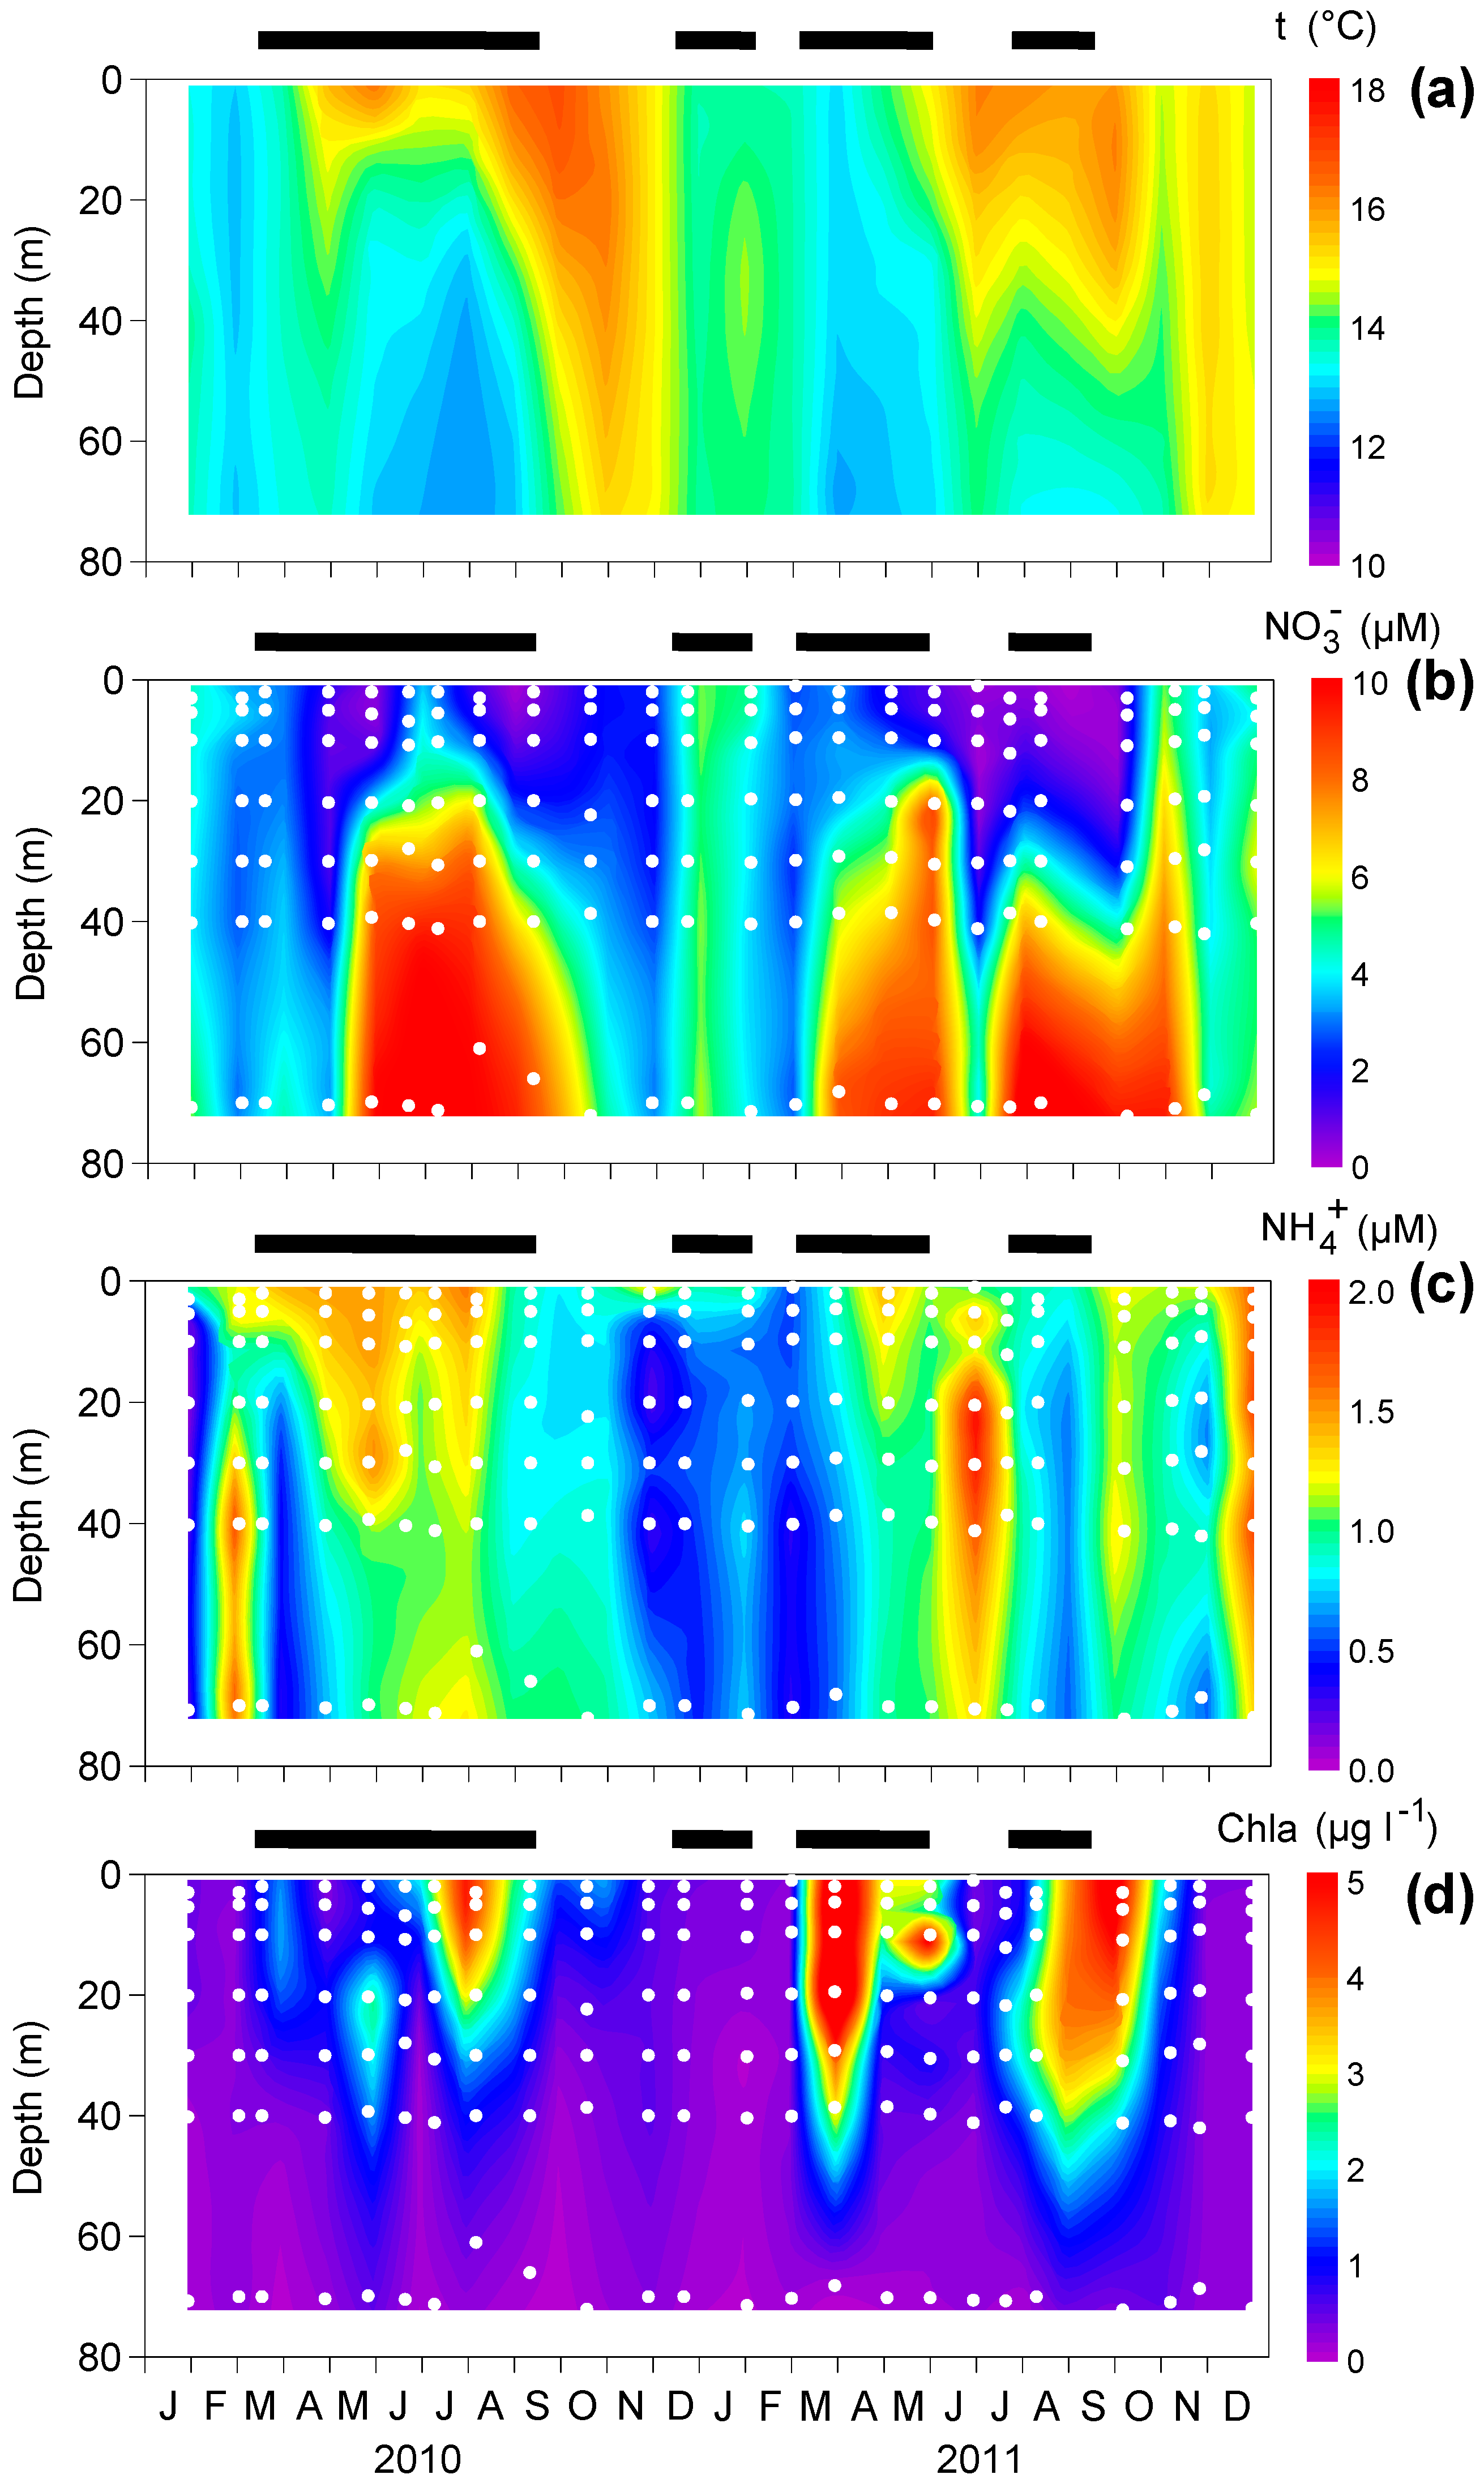
3.1. Upwelling and Nutrient Enrichment

Positive values of UI were more frequent between March and September in both 2010 and 2011, while negative values occurred mainly in October-November and February (Figure 2). However, interannual variations were also observed as the upwelling events in December 2010 and January 2011 or the downwelling events in June and July 2011. All variations of the index were significantly correlated (UI7 with UI15, r = 0.742; UI7 with UI30, r = 0.706; and UI15 with UI30, r = 0.718, all with P < 0.001); therefore, UI15 was employed in all subsequent analysis. Observations were classified as “upwelling” when UI15 > 0 or “downwelling” when UI15 < 0.
Upwelling events modified the seasonal stratification caused by the warming of the surface layer (Figure 3a). In most cases, this upper layer narrowed because of the input of cold waters (<15 °C) near the bottom. In turn, downwelling periods were characterized by the warming of the whole water column because of the accumulation of surface waters towards the coast. The input of cold subsurface water was mirrored by consequent increases in nitrate (Figure 3b), while surface waters displayed increases in ammonium concentrations mainly after the upwelling events and during downwelling (Figure 3c). Not all upwelling events produced large phytoplankton blooms, as indicated by Chla (Figure 3d). However, Chla values were generally high in the upper 50 m during, or immediately after, upwelling periods.
Considering all observations, UI15 was negatively correlated with temperature and positively correlated with nitrate and phosphate concentrations in bottom waters (Figure 4a–c). All these relationships could be described by linear regressions illustrating the changes in temperature or concentrations for a given intensity of upwelling (or downwelling). The same occurred with the increase in 50 m-integrated Chla, but in this case, the effect of upwelling is less clear because of the increase in variance when UI15 > 0 (Figure 4d). Integrated Chla was also positively correlated with the abundance of diatoms (r = 0.444, P < 0.05), which was also correlated with UI15 (r = 0.505, P < 0.05).

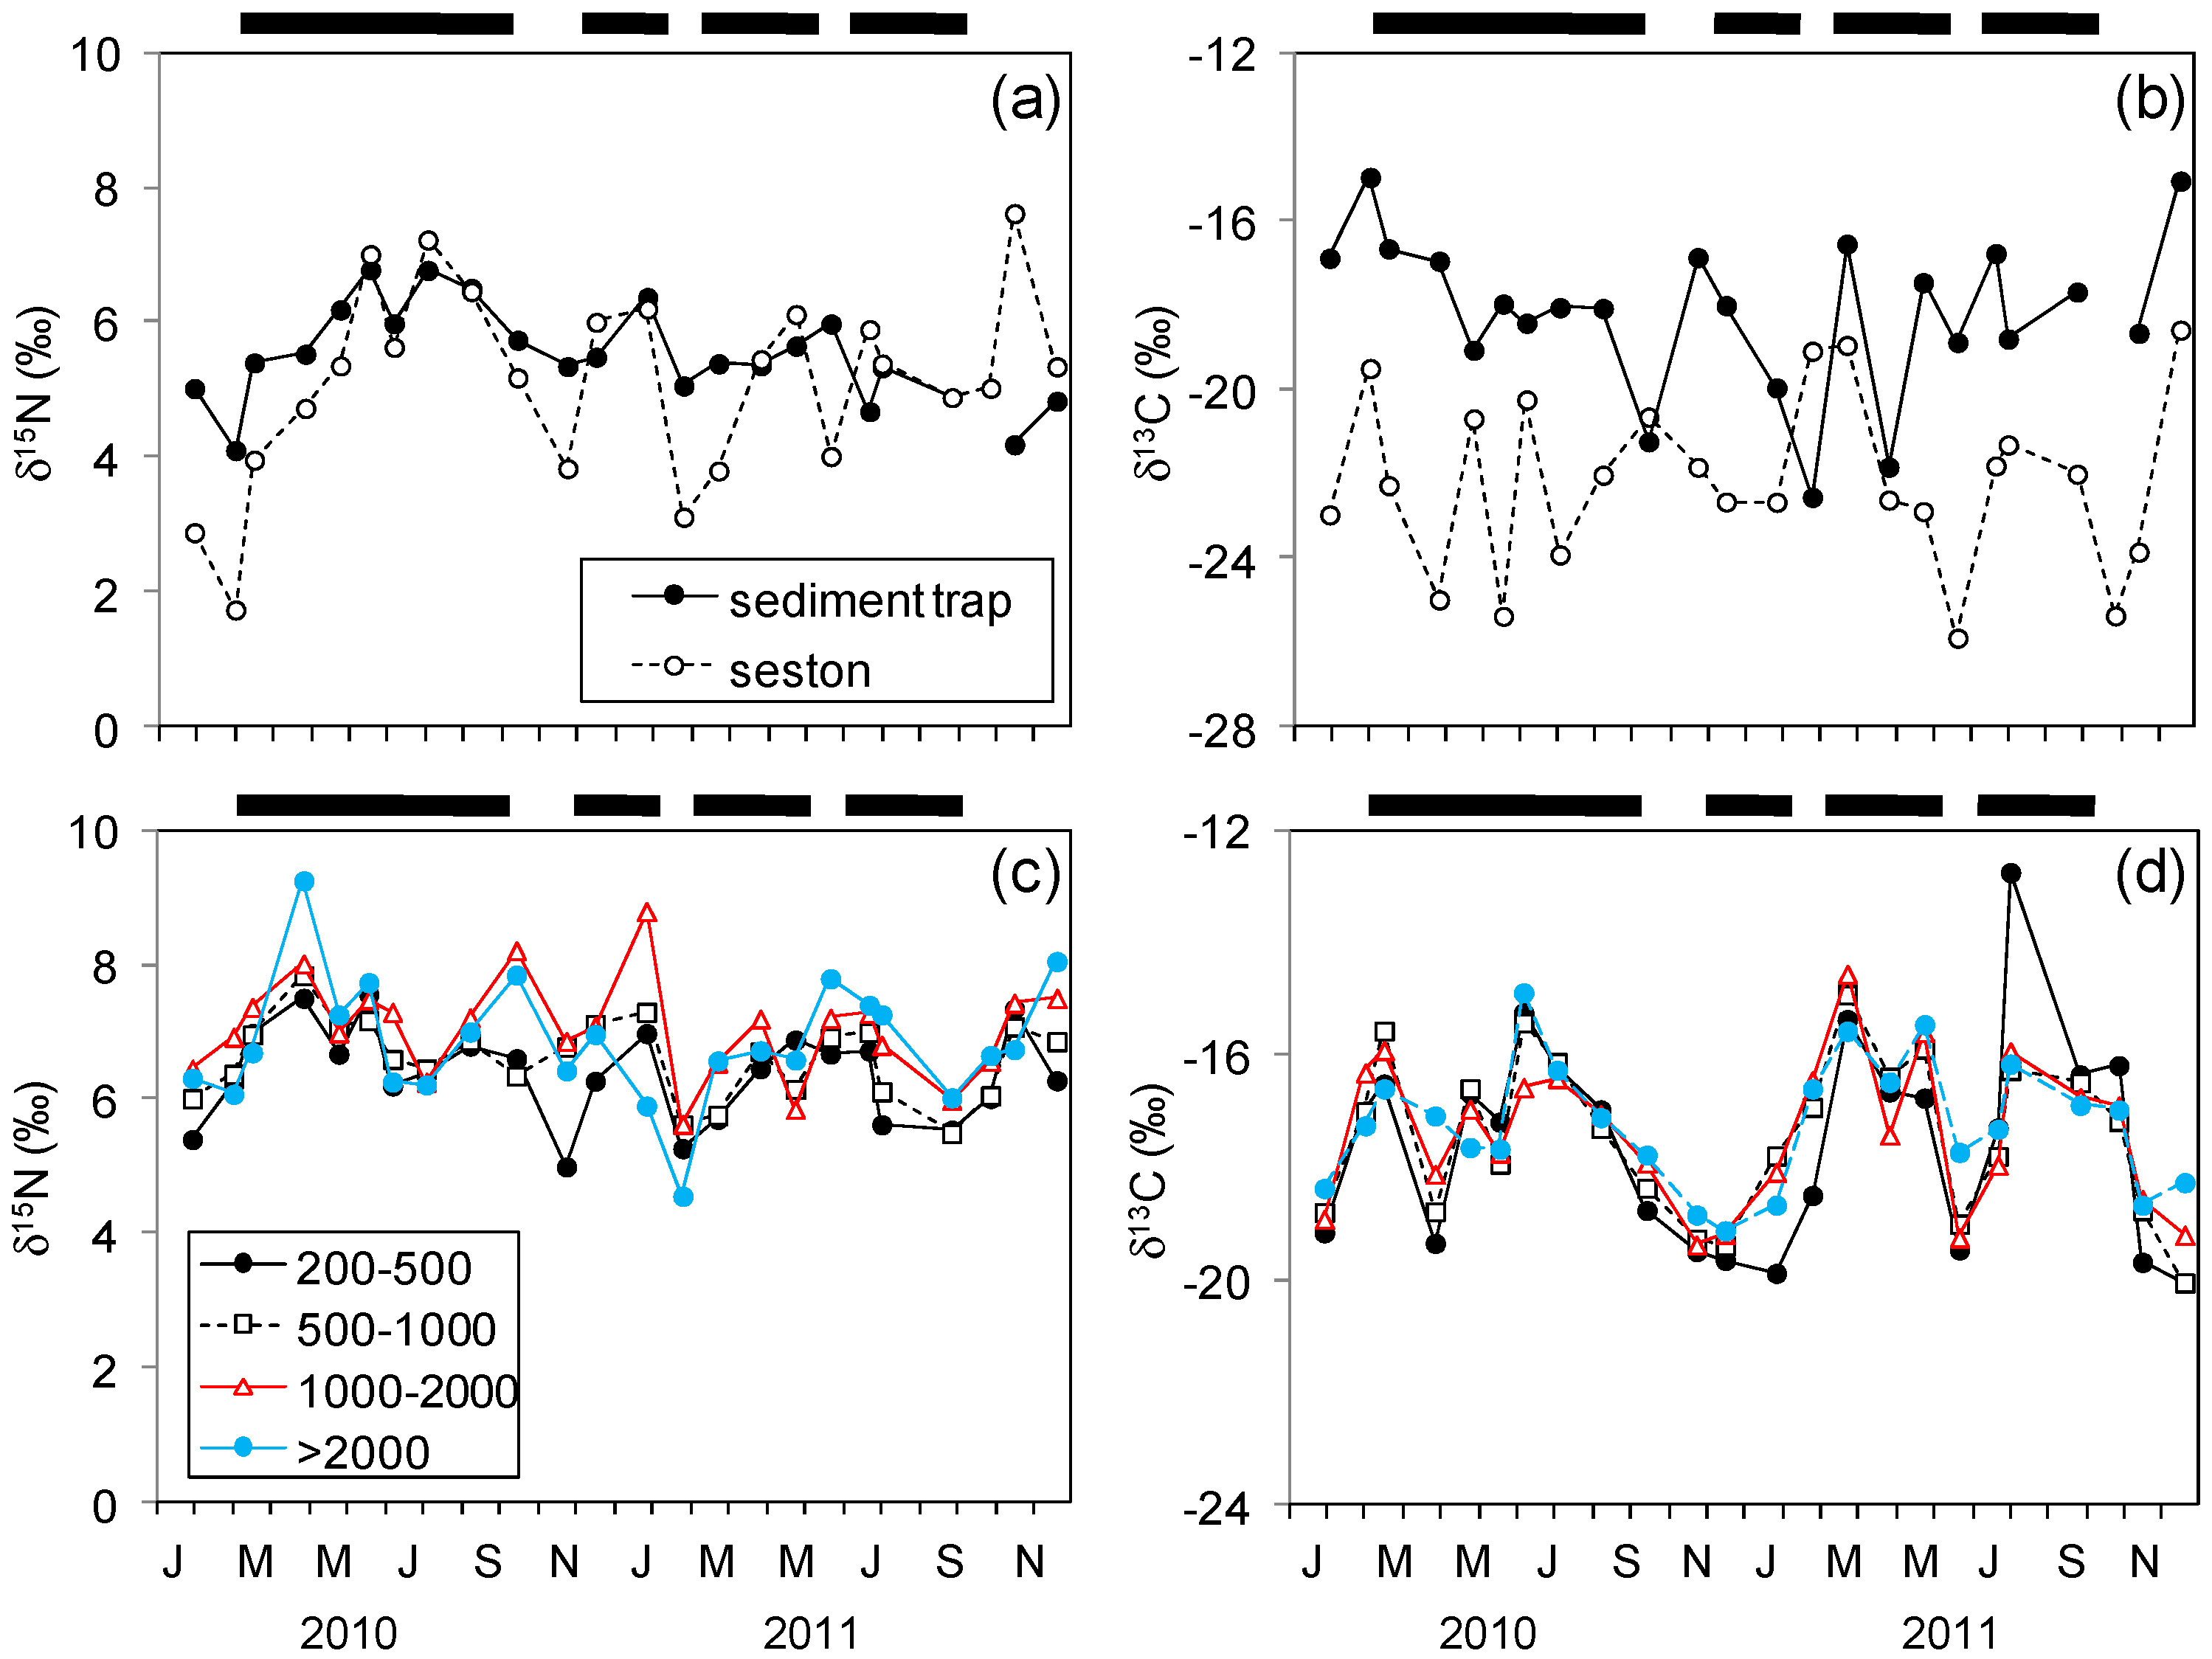
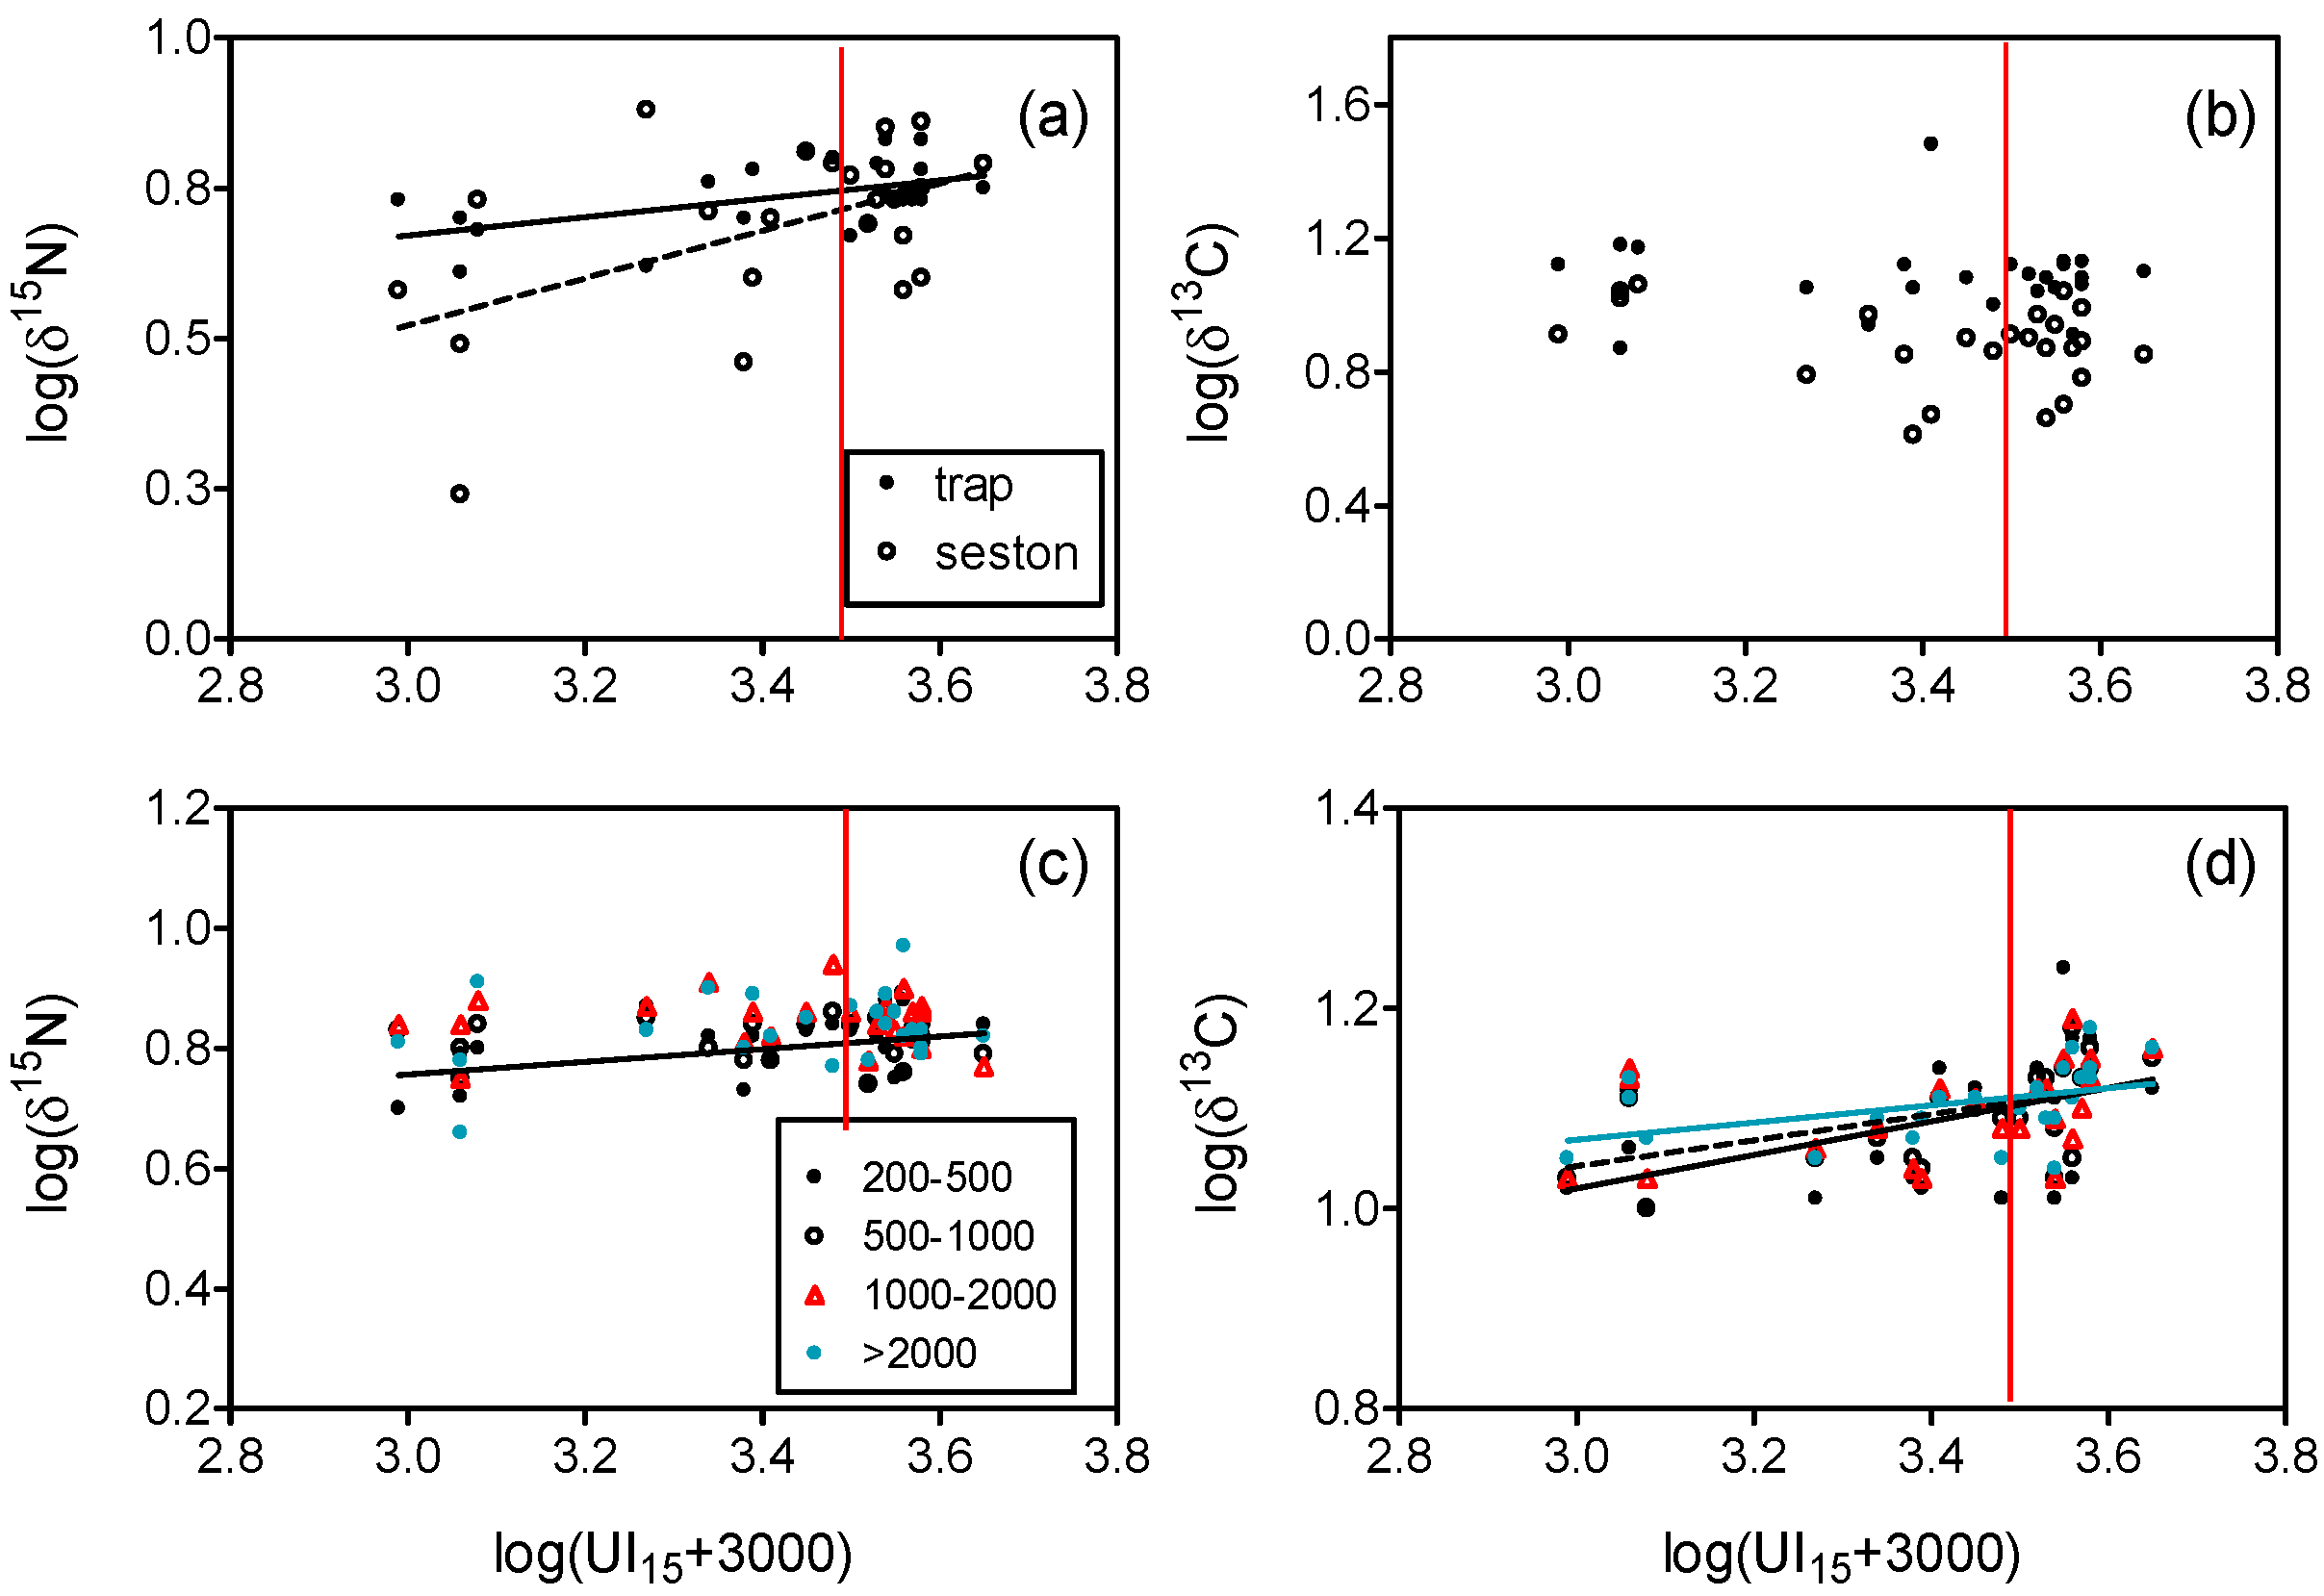
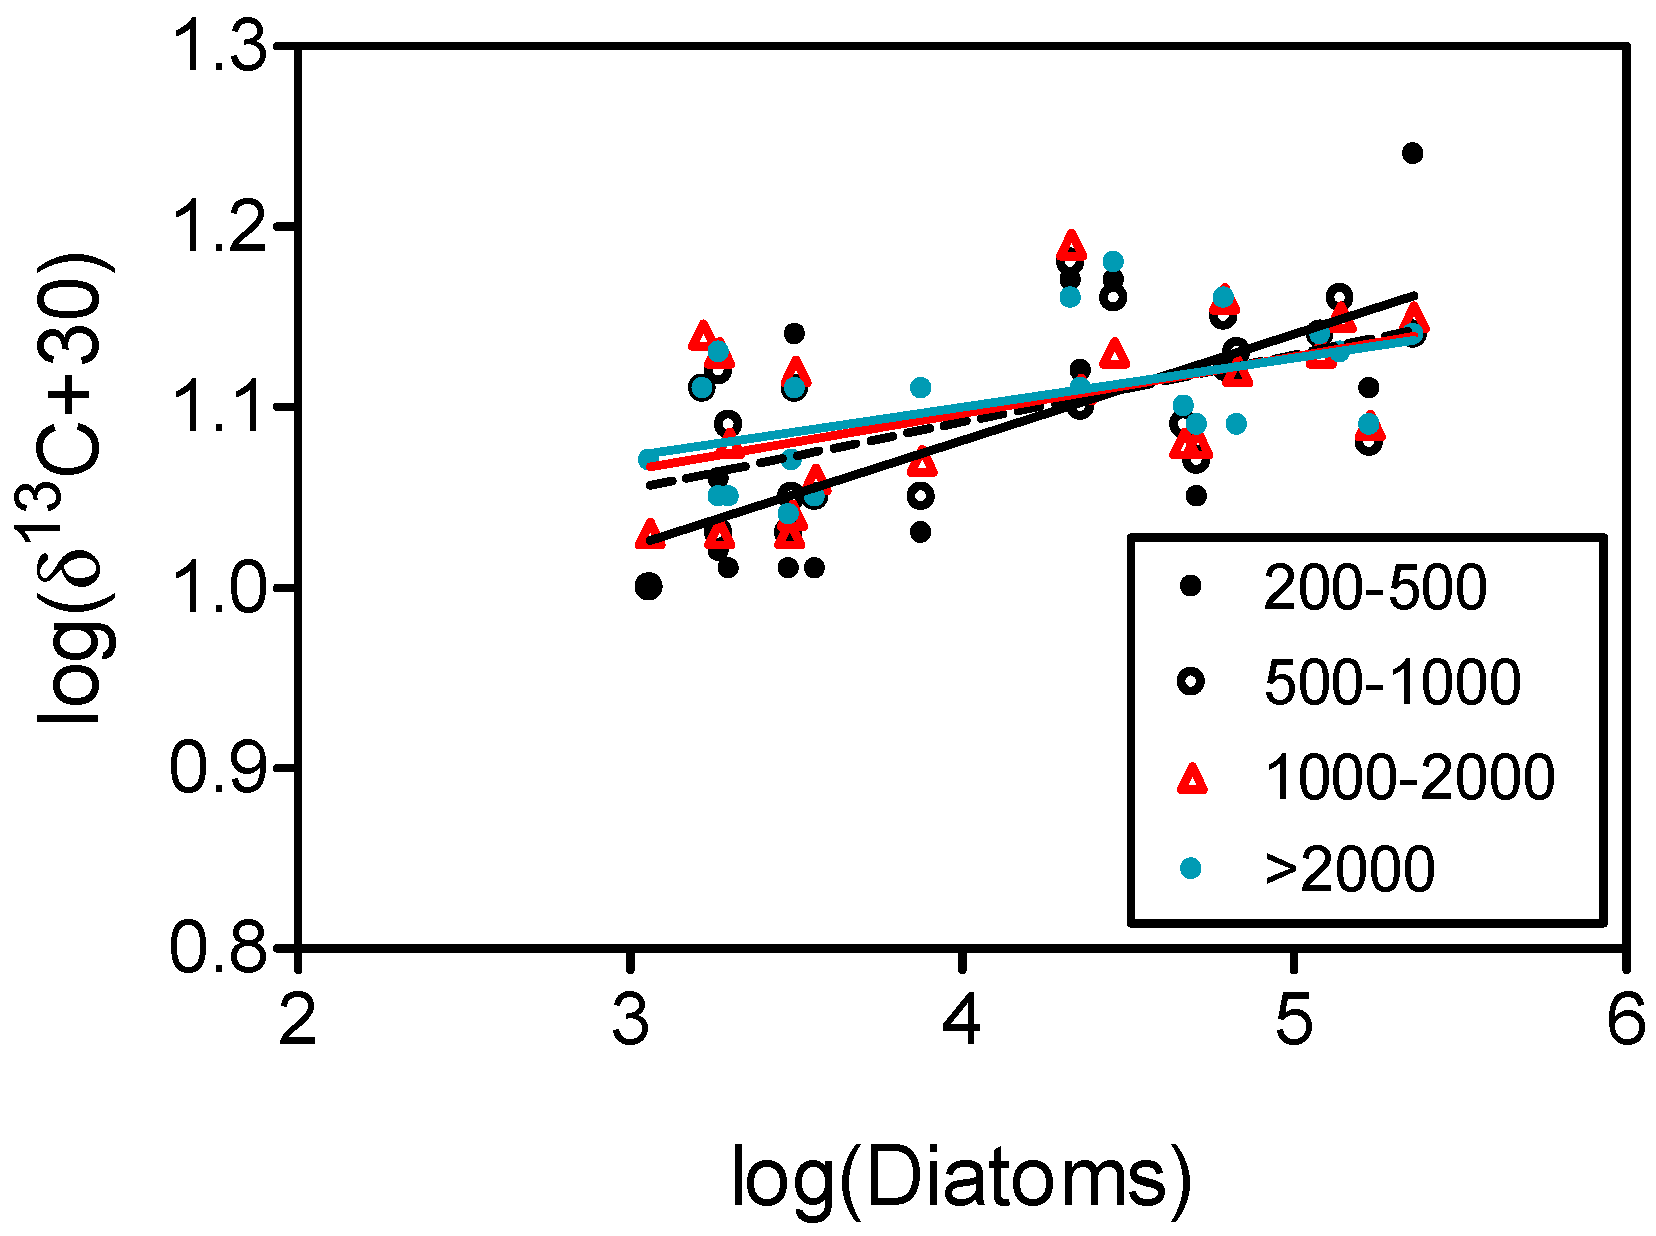
3.2. Stable Isotopes in Seston and Plankton

Seston showed larger variability in δ15N and δ13C than sediment trap particles and plankton (Table 1). However, mean δ15N was similar in seston and trap particles but lower than in plankton (ANOVA and Bonferroni post-hoc tests, P < 0.01). Mean (± se) enrichment in δ15N between seston and plankton varied between 1.26 ± 1.19‰ (200–500 µm fraction) and 1.92 ± 1.42‰ (1000–2000 µm fraction). In turn, mean δ13C of seston was lower than the values observed in sediment trap particles and plankton, which resulted in mean enrichment of 4.63 ± 2.54‰ (200–500 µm fraction) and 4.96 ± 2.56‰ (>2000 µm fraction). Both δ15N and δ13C were significantly and positively correlated for all plankton fractions considered (P < 0.01).
Neither δ15N or δ13C showed a clear seasonal pattern for seston and sediment traps, but mean δ13C values for all plankton fractions were significantly higher during the March-September period when compared to those observed during October-February (Figure 5, ANOVA, p < 0.05). However, seston and sediment trap δ15N values were linearly enriched with upwelling and isotopically diluted with downwelling (Figure 6a). Regression slopes of δ15N with UI15 were not significantly different for seston and for sediment trap particles (ANCOVA, p > 0.05). In this way, the regression equation for seston was:
log(δ15N) = −0.663 (±0.468) + 0.395 (±0.137) log(UI15 + 3000)
with standard errors of the coefficients indicated in parenthesis (r = 0.525, P < 0.01, n = 24). Using this equation we can estimate the δ15N value for UI15 = 0 (5.13‰) as a mean reference δ15N value of integrated seston for non-upwelling situations.
In turn, δ15N of plankton fractions (except the 200–500 µm fraction) and δ13C of seston and trap particles were not related to upwelling index values at any of the different time scales considered (Figure 6b,c, Supplementary Table S2), while δ13C of plankton (except the 500–1000 µm fraction) increased at similar rates with UI15 (Figure 6d, ANCOVA, P > 0.05). Therefore, a common linear regression equation for δ13C can be computed using all fractions:
log(δ13C + 30) = 0.692 (±0.083) + 0.119 (±0.024) log(UI15 + 3000)
with standard errors of the coefficients indicated in parenthesis (r = 0.454, P < 0.001, n = 96). The δ13C estimate for UI15 = 0 computed from this equation (−17.24‰) indicates the mean reference value for lipid-corrected δ13C in plankton between 200 and 5000 µm for non-upwelling situations.
Similarly, there was a positive linear increase in δ13C of all plankton fractions with the abundance of diatoms with non-significantly different slopes (ANCOVA, P > 0.05), while δ13C of other compartments did not display significant relationships with diatoms (Figure 7).

4. Discussion

This study revealed differential effects of upwelling on the carbon and nitrogen isotopic composition across various compartments of particulate organic matter. Such differences are indicative of the processes affecting carbon and nitrogen fluxes across the food web. First, the new nitrogen inputs by the upwelling were tracked by seston and sediment trap particles but not in larger size-fractions of plankton. Second, the carbon produced by the upwelling, mainly in the form of diatoms, can be tracked in plankton fractions, but not in seston or recently-sedimented particles.

4.1. Nitrogen Isotopes and Fluxes

Reported changes in δ15N of seston and small (<100 µm) plankton organisms during upwelling were inconsistent, as there were examples of decreases [29,30], no change from the δ15N of subsurface nitrate [31], or even increases in δ15N [32,33]. This variability in δ15N can be attributed to rapid changes in the isotopic composition of the upwelled nitrate, as the phytoplankton assimilates preferentially light nitrogen atoms and leaves the remaining nitrate enriched in heavy isotopes [34]. Therefore the relative enrichment or depletion of seston δ15N compared to the initial nitrate upwelled will depend on the timing of the phytoplankton bloom produced by the upwelling. In the present study, seston and trap particles showed a significant increase in δ15N with upwelling intensity (and conversely a decrease with downwelling) integrated over the preceding 15 days. Even when temporal autocorrelation may affect Type 1 statistical errors in both cases, similar increases were also found in the small plankton fractions that did not show significant autocorrelation (Supplementary Table S1). Such a timescale is similar to the time required for reaching maximum uptake rates by phytoplankton after an upwelling pulse [3]. Therefore, the isotopic enrichment is consistent with the rapid uptake and assimilation of the nitrate produced in subsurface waters through nitrification, as this process has a relatively large isotopic fractionation effect [10]. In contrast, the uptake of isotopically-light inorganic nitrogen regenerated in the surface layer, mostly in the form of ammonium and accumulated during downwelling, produced less enriched particles during non-upwelling periods. Upwelling of subsurface nitrate was also claimed as the main cause of high values of δ15N in seston in open waters of the Atlantic, as opposed to the low values caused by the fixation of nitrogen [32,35,36].
Other sources of nitrogen could also cause the elevation or decrease of δ15N in organic matter. For instance, the input of anthropogenic nitrogen from residual waters may affect coastal ecosystems, as detected in the study region [18,37]. However, the δ15N values observed in suspended and sedimented particles at the studied station were closer to those of nitrate at 70 m depth in the same station (6.08 ± 0.28‰, n = 24) than to those typical in the effluent of a water treatment plant (16.6 ± 1‰, n = 3), as reported in a previous study [18]. Furthermore, denitrification or other nitrogen transformation processes can be expected to be of low importance at the studied station because the water column remains well-oxygenated through the year [38]. The value of the intercept of the regression line between seston δ15N and UI15 (equation 2) is almost equivalent to the overall mean (Table 1), thus supporting that the upwelled nitrogen is conserved in the water column. Alternatively, atmospheric nitrogen fixation would decrease δ15N, but, although with measurable rates, this process has a low impact on nitrogen inputs for phytoplankton in this station [39]. The prevalence of eukaryotic phytoplankton (mainly diatoms and dinoflagellates) in local primary production and biomass [21,40] would also explain the increase of δ15N in particles with upwelling, as phytoeukaryotes showed a larger affinity for upwelled nitrate than prokaryotes [33].
Furthermore, the similarity in the magnitude and variation of δ15N in seston and sediment trap particles observed in this study suggests the rapid (i.e., within the 15 d of integration of the upwelling event) and complete uptake of the nitrate provided by the upwelling with a minimal process in the water column, as found in other studies of coastal upwelling ecosystems [41]. Meanwhile, in oceanic environments characterized by deeper water columns, the enrichment in heavy isotopes of the sedimented particles at deep water layers is the norm [31,42]. All these results are indicative of a rapid response of phytoplankton to upwelling nitrate (and other nutrient) inputs, but at the same time suggest also rapid changes to regenerated nutrient sources during downwelling, with minimal influence of additional nutrient sources. Intensive and repeated remineralization of the organic matter in the shelf causes the upwelled water in this region to contain a mixture of new (oceanic) and regenerated nitrogen [4], thus affecting the variability in isotopic composition observed in the particles.
Another implication of the observed variability in seston δ15N is that annual or seasonal averages of δ15N may underestimate the reference baseline for trophic position estimations because most consumers in the food web would have different integration times [43]. Therefore, alternative baselines must be defined by primary consumers [12] as zooplankton. In this study, all plankton fractions larger than 200 µm displayed lower variability in δ15N than seston, thus allowing for the use of mean values as representative baselines for trophic position estimates in the pelagic food web of this ecosystem. However, the observed mean isotopic enrichment of plankton relative to seston δ15N was much lower than the commonly-accepted mean (± sd) value of 3.4 ± 1.0‰ increase per trophic level [11]. One explanation could be the presence of phytoplankton in the various fractions, but previous studies in the same station indicate that the fraction larger than 200 µm is composed mainly by zooplankton (up to 8000 indiv m−3 during spring and autumn peaks), with a dominance of copepods for most of the year [44]. While the exact taxonomic composition of plankton in all the fractions considered in this study was not determined, the influence of phytoplankton in the δ15N signal of these fractions is expected to be low, although the contribution of some large diatom cells and colonies in the 200–500 µm fraction cannot be totally excluded. Alternatively, our results suggest that plankton consumers had lower isotopic fractionation per trophic level than other consumers. Even when there are reports of the variability in trophic δ15N fractionation caused by differences in diet, environmental factors, or the taxonomic composition and size of consumers [12,45,46], few studies highlighted the low fractionation observed in plankton. This low fractionation can be attributed in part to the consumption of protists with similar δ15N values to their phytoplankton and bacterial prey [47].
In absence of clear seasonal patterns, the δ15N of all plankton fractions in our study reflects a balanced integration of upwelling-derived and regenerated nitrogen during non-upwelling periods, as the dominance of upwelling nitrogen sources would have produced an enrichment at least equivalent to the values observed in seston during upwelling. This is due to the longer time required for integration of the isotopic signal in the fractionated plankton than in seston, where the dominance of phytoplankton assimilation and heterotrophic remineralization processes alternate [48]. These results highlight the importance of the repeated cycling of the nitrate initially provided by the upwelling in the Galician shelf, almost doubling the effect of the upwelling nitrogen on primary production [4].
To overcome the short-term variability in δ15N, studies in other upwelling regions focused on the analysis of benthic organisms, notably filter-feeder mollusks integrating the signal at seasonal time scales. This approach successfully revealed geographic gradients in the effect of upwelling in the coasts of South Africa [49], northern Chile [50], and California [51]. Nevertheless, the analysis of the long series of δ15N in zooplankton allowed the detection of variations in the upwelling source waters, as exemplified in the California Current [52].

4.2. Carbon Isotopes and Fluxes

As opposed to δ15N, there was a linear increase in δ13C with upwelling intensity in plankton fractions, but not in seston or sediment trap particles. These results evidence the differential routing of carbon and nitrogen provided by the upwelling. While a large fraction of nitrogen is recycled in situ, most of the carbon produced by the upwelling is directed to the biomass of zooplankton consumers, leaving a clear imprint of diatom carbon, as inferred from the significant relationship between diatom abundance and plankton δ13C. Actively-growing diatoms are a source of enriched δ13C for zooplankton, and this feature was used to ascertain diatom importance in plankton food webs [13]. Upwelling events in Galicia, as in other upwelling ecosystems [14], are associated with a large abundance of diatoms [16,53] that in turn are related to the increase in primary production [4,17,38]. Other studies at the same sampling station confirmed the dominance of diatoms in total phytoplankton abundance [41] and biomass [54] through the year, thus supporting their importance for zooplankton feeding. However, because seston contains other organic particles in addition to diatoms, the observed δ13C in seston and sediment trap particles represented a mixture of various carbon sources. A comparison of δ13C values of suspended particles and coastal macrophytes concluded that almost 70% of the carbon collected by sediment traps at this station was provided by macrophytes, mainly in the form of detritus [37]. For this reason, the increase of δ13C in plankton could be due also to the consumption of detrital particles enriched in heavy carbon isotopes because of the loss of light isotopes due to microbial reworking [42], but this is unlikely as a large fraction the material collected in coastal environments by sediment traps is composed of aged, and presumably biologically-refractory, organic matter [55]. The significant relationship between the δ13C of the smallest plankton size fractions and the abundance of diatoms can be explained by the dominance of copepod grazers, like Acartia clausi, during upwelling events [44].
The persistence of the diatom signal in the plankton found in this study allows for the use of δ13C values as baseline reference values to estimate the input of carbon sources derived from the upwelling in upper trophic levels, such as fish and marine mammals. In this way, the influence of upwelling could be better addressed using geographic distributions of plankton δ13C [56]. This approach will improve the resolution of previous studies of plankton consumers based on isotopic values averaged over most of the Galician shelf region, including upwelling and non-upwelling situations [57,58]. In addition, the comparison of lipid-corrected δ13C values of plankton samples from previous or future studies in this ecosystem with the values estimated from the regression line computed in this study will provide a quantitative framework to analyze the influence of upwelling on carbon fluxes through the pelagic food web.

5. Conclusions

The studied station showed the influence of wind on key environmental properties (lowering the temperature and increasing nutrient concentrations of subsurface waters, and increasing water-column integrated chlorophyll and diatom abundance) characteristic of all upwelling ecosystems. However, there was a differential influence on nitrogen and carbon fluxes in plankton and suspended particles. The upwelled nitrogen left an isotopically-enriched signal in seston and sedimented particles and was conserved in the plankton likely by repeated remineralization in the water during alternating upwelling and downwelling sequences. Plankton between 200 and 5000 µm integrated the different nitrogen sources better than short-living seston particles and showed relatively homogeneous δ15N values through the year. In contrast, δ13C patterns indicated a variable mixture of carbon sources in seston and sedimented particles but a clear signal of carbon produced by upwelling events in the form of diatoms that can be tracked in all plankton fractions. The computed linear regressions between seston δ15N or plankton δ13C and the upwelling index integrated over the preceding 15 days, will provide reference baseline values for food web studies and new quantitative procedures for estimating the impact of past and future variations in upwelling intensity in the carbon and nitrogen fluxes in this ecosystem.

Supplementary Materials

The following are available online at https://www.mdpi.com/1424-2818/12/4/121/s1, Supplementary Tables S1 and S2.

Author Contributions

The study was conceived by A.B. and C.M. A.F.L. and C.M. obtained and analyzed the samples. A.B. wrote the manuscript with contributions from all coauthors. All authors have read and agreed to the published version of the manuscript.

Funding

This research was supported in part with funds of projects RADIALES (Instituto Español de Oceanografía, Spain), ANILE (CTM2009-08396 and CTM2010-08804-E) of the Plan Nacional de I+D+i (Spain), and MarRisk (Interreg POCTEP Spain - Portugal, 0262 MARRISK 1 E). C.M. was supported by a FPI fellowship from the Instituto Español de Oceanografía (Spain).

Acknowledgments

We are grateful to the captain and crews of the R/V Lura for their collaboration during sampling. Nutrient determinations were made by R. Carballo and phytoplankton counts by M. Varela. Stable isotope analysis were made at the Servicio de Análisis Instrumental (SAI) of the Universidad de A Coruña (Spain).

Conflicts of Interest

The authors declare no conflict of interest. The founding sponsors had no role in the design of the study; in the collection, analyses, or interpretation of data; in the writing of the manuscript, and in the decision to publish the results.

References

  1. Demarcq, H. Trends in primary production, sea surface temperature and wind in upwelling systems (1998–2007). Prog. Oceanogr. 2009, 83, 376–385. [Google Scholar] [CrossRef]
  2. Capone, D.G.; Hutchins, D.A. Microbial biogeochemistry of coastal upwelling regimes in a changing ocean. Nat. Geosci. 2013, 6, 711–717. [Google Scholar] [CrossRef]
  3. Dugdale, R.C.; Wilkerson, F.P. New production in the upwelling center at Point Conception, California: Temporal and spatial patterns. Deep Sea Res. 1989, 36, 985–1008. [Google Scholar] [CrossRef]
  4. Alvarez-Salgado, X.A.; Gago, J.; Míguez, B.M.; Gilcoto, M.; Pérez, F.F. Surface waters of the NW Iberian margin: Upwelling on the shelf versus outwelling of upwelled waters from the Rias Baixas. Estuar. Coast. Shelf Sci. 2000, 51, 821–837. [Google Scholar] [CrossRef] [Green Version]
  5. Chen, Y.L.L.; Lu, H.B.; Shiah, F.K.; Gong, G.C.; Liu, K.K.; Kanda, J. New production and f-ratio on the continental shelf of the East China Sea: Comparisons between nitrate inputs from the subsurface Kuroshio Current and the Changjiang River. Estuar. Coast. Shelf Sci. 1999, 48, 59–75. [Google Scholar] [CrossRef]
  6. Vincent, W.F.; Chang, F.H.; Cole, A.; Downes, M.T.; James, M.R.; May, L.; Moore, M.; Woods, P.H. Short-term changes in planktonic community structure and nitrogen transfers in a coastal upwelling system. Estuar. Coast. Shelf Sci. 1989, 29, 131–150. [Google Scholar] [CrossRef]
  7. Bakun, A. Global climate change and intensification of coastal upwelling. Science 1990, 247, 198–201. [Google Scholar] [CrossRef] [Green Version]
  8. Chavez, F.P.; Ryan, J.P.; Lluch-Cota, S.E.; Ñiquen, M. From anchovies to sardines and back: Multidecadal change in the Pacific Ocean. Science 2003, 299, 217–221. [Google Scholar] [CrossRef] [Green Version]
  9. Xiu, P.; Chai, F.; Curchitser, E.N.; Castruccio, F.S. Future changes in coastal upwelling ecosystems with global warming: The case of the California Current system. Sci. Rep. 2018, 8, 2866. [Google Scholar] [CrossRef]
  10. Sigman, D.M.; Karsh, K.L.; Casciotti, K.L. Ocean process tracers: Nitrogen isotopes in the ocean. In Encyclopedia of Ocean Sciences, 2nd ed.; Steele, J.H., Ed.; Academic Press: Oxford, UK, 2009; pp. 40–54. [Google Scholar]
  11. Post, D.M. Using stable isotopes to estimate trophic position: Models, methods, and assumptions. Ecology 2002, 83, 703–718. [Google Scholar] [CrossRef]
  12. Vander Zanden, M.J.; Rasmussen, B. Primary consumer δ13C and δ15N and the trophic position of aquatic consumers. Ecology 1999, 80, 1395–1404. [Google Scholar] [CrossRef]
  13. Fry, B.; Wainright, S.C. Diatom sources of 13C-rich carbon in marine food webs. Mar. Ecol. Prog. Ser. 1991, 76, 149–157. [Google Scholar] [CrossRef]
  14. Abrantes, F.; Cermeño, P.; Lopes, C.; Romero, O.; Matos, L.; Van Iperen, J.; Rufino, M.; Magalhães, V. Diatoms si uptake capacity drives carbon export in coastal upwelling systems. Biogeosciences 2016, 13, 4099–4109. [Google Scholar] [CrossRef] [Green Version]
  15. Arístegui, J.; Alvarez-Salgado, X.A.; Barton, E.D.; Figueiras, F.G.; Hernández-León, S.; Roy, C.; Santos, A.M.P. Chapter 23. Oceanography and fisheries of the canary current/iberian region of the eastern north atlantic (18a, e). In The Global Coastal Ocean: Interdisciplinary Regional Studies and Syntheses; Robinson, A.R., Brink, K., Eds.; Harvard University Press: Boston, MA, USA, 2006; Volume 14, pp. 877–931. [Google Scholar]
  16. Pérez, F.F.; Padin, X.A.; Pazos, Y.; Gilcoto, M.; Cabanas, M.; Pardo, P.C.; Doval, M.D.; Farina-Bustos, L. Plankton response to weakening of the iberian coastal upwelling. Glob. Chang. Biol. 2010, 16, 1258–1267. [Google Scholar] [CrossRef] [Green Version]
  17. Figueiras, F.G.; Labarta, U.; Fernández Reiriz, M.J. Coastal upwelling, primary production and mussel growth in the Rías Baixas of Galicia. Hydrobiologia 2002, 484, 121–131. [Google Scholar] [CrossRef]
  18. Viana, I.G.; Bode, A. Variability in δ15N of intertidal brown algae along a salinity gradient: Differential impact of nitrogen sources. Sci. Tot. Environ. 2015, 512–513, 167–176. [Google Scholar] [CrossRef]
  19. Bode, A.; Álvarez, M.; Ruíz-Villarreal, M.; Varela, M.M. Changes in phytoplankton production and upwelling intensity off A Coruña (NW Spain) for the last 28yr. Ocean Dyn. 2019, 69, 861–873. [Google Scholar] [CrossRef] [Green Version]
  20. Buttay, L.; Cazelles, B.; Miranda, A.; Casas, G.; Nogueira, E.; González-Quirós, R. Environmental multi-scale effects on zooplankton inter-specific synchrony. Limnol. Oceanogr. 2017, 62, 1355–1365. [Google Scholar] [CrossRef] [Green Version]
  21. Bode, A.; Varela, M.; Barquero, S.; Alvarez-Ossorio, M.T.; González, N. Preliminary studies on the export of organic matter during phytoplankton blooms off La Coruña (North Western Spain). J. Mar. Biol. Ass. UK 1998, 78, 1–15. [Google Scholar] [CrossRef]
  22. Ng, J.S.S.; Wai, T.C.; Williams, G.A. The effects of acidification on the stable isotope signatures of marine algae and molluscs. Mar. Chem. 2007, 103, 97–102. [Google Scholar] [CrossRef]
  23. Coplen, T.B. Guidelines and recommended terms for expression of stable isotope-ratio and gas-ratio measurement results. Rapid Commun. Mass Spectrom. 2011, 25, 2538–2560. [Google Scholar] [CrossRef] [PubMed]
  24. Fernández, A.; Marañón, E.; Bode, A. Large-scale meridional and zonal variability in the nitrogen isotopic composition of plankton in the Atlantic Ocean. J. Plankton Res. 2014, 36, 1060–1073. [Google Scholar] [CrossRef] [Green Version]
  25. Post, D.M.; Layman, C.A.; Arrington, D.A.; Takimoto, G.; Quattrochi, J.; Montaña, C.G. Getting to the fat of the matter: Models, methods and assumptions for dealing with lipids in stable isotope analyses. Oecologia 2007, 152, 179–189. [Google Scholar] [CrossRef] [PubMed]
  26. González-Nuevo, G.; Gago, J.; Cabanas, J.M. Upwelling index: A powerful tool for marine research in the nw iberian upwelling system. J. Oper. Oceanogr. 2014, 7, 45–55. [Google Scholar] [CrossRef]
  27. Nogueira, E.; Perez, F.F.; Rios, A.F. Seasonal patterns and long-term trends in an estuarine upwelling ecosystem (Ria de Vigo, NW Spain). Estuar. Coast. Shelf Sci. 1997, 44, 285–300. [Google Scholar] [CrossRef] [Green Version]
  28. Hammer, Ø.; Harper, D.A.T.; Ryan, P.D. Past: Paleontological statistics software package for education and data analysis. Palaeontol. Electron. 2001, 4, 9. Available online: http://palaeo-electronica.org/2001_1/past/issue1_01.htm (accessed on 6 March 2020).
  29. Wu, J.P.; Calvert, S.E.; Wong, C.S. Carbon and nitrogen isotope ratios in sedimenting particulate organic matter at an upwelling site off Vancouver Island. Estuar. Coast. Shelf Sci. 1999, 48, 193–203. [Google Scholar] [CrossRef]
  30. Montoya, J.P.; McCarthy, J.J. Isotopic fractionation during nitrate uptake by phytoplankton grown in continuous culture. J. Plankton Res. 1995, 17, 439–464. [Google Scholar] [CrossRef]
  31. Altabet, M.A. Variations in nitrogen isotopic composition between sinking and suspended particles: Implications for nitrogen cycling and particle transformation in the open ocean. Deep Sea Res. 1988, 35, 535–554. [Google Scholar] [CrossRef]
  32. Mahaffey, C.; Williams, R.G.; Wolff, G.A.; Anderson, W.T. Physical supply of nitrogen to phytoplankton in the Atlantic Ocean. Glob. Biogeochem. Cycles 2004, 18. [Google Scholar] [CrossRef] [Green Version]
  33. Fawcett, S.E.; Lomas, M.W.; Casey, J.R.; Ward, B.B.; Sigman, D.M. Assimilation of upwelled nitrate by small eukaryotes in the Sargasso Sea. Nat. Geosci. 2011, 4, 717–722. [Google Scholar] [CrossRef]
  34. Needoba, J.A.; Waser, N.A.; Harrison, P.J.; Calvert, S.E. Nitrogen isotope fractionation in 12 species of marine phytoplankton during growth on nitrate. Mar. Ecol. Prog. Ser. 2003, 255, 81–91. [Google Scholar] [CrossRef]
  35. Mompeán, C.; Bode, A.; Benítez-Barrios, V.M.; Domínguez-Yanes, J.F.; Escánez, J.; Fraile-Nuez, E. Spatial patterns of plankton biomass and stable isotopes reflect the influence of the nitrogen-fixer Trichodesmium along the subtropical North Atlantic. J. Plankton Res. 2013, 35, 513–525. [Google Scholar] [CrossRef]
  36. McKinney, R.A.; Oczkowski, A.J.; Prezioso, J.; Hyde, K.J.W. Spatial variability of nitrogen isotope ratios of particulate material from northwest Atlantic continental shelf waters. Estuar. Coast. Shelf Sci. 2010, 89, 287–293. [Google Scholar] [CrossRef]
  37. Bode, A.; Alvarez-Ossorio, M.T.; Varela, M. Phytoplankton and macrophyte contributions to littoral food webs in the Galician upwelling (NW Spain) estimated from stable isotopes. Mar. Ecol. Prog. Ser. 2006, 318, 89–102. [Google Scholar] [CrossRef] [Green Version]
  38. Bode, A.; Álvarez, M.; Ruiz-Villarreal, M.; Varela, M.M. Time Series of Hydrographic, Chemical and Primary Production Variables for a Shelf Station off A Coruña (NW Spain): 1989–2016; PANGAEA: Bremerhaven, Germany, 2018. [Google Scholar] [CrossRef]
  39. Moreira-Coello, V.; Mouriño-Carballido, B.; Marañón, E.; Fernández-Carrera, A.; Chouciño, P.; Varela, M.M.; Bode, A. Biological N2 fixation in the upwelling region off NW Iberia: Magnitude, relevance and abundance of diazotrophs. Front. Mar. Sci. 2017, 4, 303. [Google Scholar] [CrossRef] [Green Version]
  40. Casas, B.; Varela, M.; Bode, A. Seasonal succession of phytoplankton species on the coast of A Coruña (Galicia, Northwest Spain). Bol. Inst. Esp. Oceanogr. 1999, 15, 413–429. [Google Scholar]
  41. Walker, B.D.; McCarthy, M.D. Elemental and isotopic characterization of dissolved and particulate organic matter in a unique California upwelling system: Importance of size and composition in the export of labile material. Limnol. Oceanogr. 2012, 57, 1757–1774. [Google Scholar] [CrossRef] [Green Version]
  42. Saino, T. 15N and 13C natural abundance in suspended particulate organic matter from a Kuroshio warm-core ring. Deep-Sea Res. 1992, 39 (Suppl. 1), 5347–5362. [Google Scholar] [CrossRef]
  43. Jennings, S.; Maxwell, T.A.D.; Schratzberger, M.; Milligan, S.P. Body-size dependent temporal variations in nitrogen stable isotope ratios in food webs. Mar. Ecol. Prog. Ser. 2008, 370, 199–206. [Google Scholar] [CrossRef]
  44. Bode, A.; Alvarez-Ossorio, M.T. Taxonomic versus trophic structure of mesozooplankton: A seasonal study of species succession and stable carbon and nitrogen isotopes in a coastal upwelling ecosystem. ICES J. Mar. Sci. 2004, 61, 563–571. [Google Scholar] [CrossRef]
  45. Sweeting, C.J.; Barry, J.; Barnes, C.; Polunin, N.V.C.; Jennings, S. Effects of body size and environment on diet-tissue δ15N fractionation in fishes. J. Exp. Mar. Biol. Ecol. 2007, 340, 1–10. [Google Scholar] [CrossRef]
  46. Caut, S.; Angulo, E.; Courchamp, F. Variation in discrimination factors (δ15N and δ13C): The effect of diet isotopic values and applications for diet reconstruction. J. Appl. Ecol. 2009, 46, 443–453. [Google Scholar] [CrossRef]
  47. Gutiérrez-Rodríguez, A.; Décima, M.; Popp, B.N.; Landry, M.R. Isotopic invisibility of protozoan trophic steps in marine food webs. Limnol. Oceanogr. 2014, 59, 1590–1598. [Google Scholar] [CrossRef] [Green Version]
  48. Bode, A.; Barquero, S.; González, N.; Alvarez-Ossorio, M.T.; Varela, M. Contribution of heterotrophic plankton to nitrogen regeneration in the upwelling ecosystem of A Coruña (NW Spain). J. Plankton Res. 2004, 26, 1–18. [Google Scholar] [CrossRef] [Green Version]
  49. Hill, J.M.; McQuaid, C.D. δ13C and δ15N biogeographic trends in rocky intertidal communities along the coast of South Africa: Evidence of strong environmental signatures. Estuar. Coast. Shelf Sci. 2008, 80, 261–268. [Google Scholar] [CrossRef]
  50. Reddin, C.J.; Docmac, F.; O’Connor, N.E.; Bothwell, J.H.; Harrod, C. Coastal upwelling drives intertidal assemblage structure and trophic ecology. PLoS ONE 2015, 10, e0130789. [Google Scholar] [CrossRef] [Green Version]
  51. Vokhshoori, N.L.; McCarthy, M.D. Compound-specific δ15N amino acid measurements in littoral mussels in the california upwelling ecosystem: A new approach to generating baseline delta n-15 isoscapes for coastal ecosystems. PLoS ONE 2014, 9, e98087. [Google Scholar] [CrossRef]
  52. Rau, G.H.; Ohman, M.D.; Pierrot-Bults, A. Linking nitrogen dynamics to climate variability off central California: A 51 year based on 15N/14N in CALCOFI zooplankton. Deep Sea Res. II 2003, 50, 2431–2447. [Google Scholar] [CrossRef]
  53. Varela, M. Upwelling and phytoplankton ecology in Galician (NW Spain) rías and shelf waters. Bol. Inst. Esp. Oceanogr. 1992, 8, 57–74. [Google Scholar]
  54. Otero, J.; Bode, A.; Álvarez-Salgado, X.A.; Varela, M. Role of functional traits variability in the response of individual phytoplankton species to changing environmental conditions in a coastal upwelling zone. Mar. Ecol. Prog. Ser. 2018, 596, 33–47. [Google Scholar] [CrossRef] [Green Version]
  55. Roland, L.A.; McCarthy, M.D.; Guilderson, T. Sources of molecularly uncharacterized organic carbon in sinking particles from three ocean basins: A coupled δ14C and δ13C approach. Mar. Chem. 2008, 111, 199–213. [Google Scholar] [CrossRef]
  56. Bowen, G. Isoscapes: Spatial pattern in isotopic biogeochemistry. Annu. Rev. Earth Planet. Sci. 2010, 38, 161–187. [Google Scholar] [CrossRef] [Green Version]
  57. Bode, A.; Alvarez-Ossorio, M.T.; Carrera, P.; Lorenzo, J. Reconstruction of trophic pathways between plankton and the North Iberian sardine (Sardina pilchardus) using stable isotopes. Sci. Mar. 2004, 68, 165–178. [Google Scholar] [CrossRef] [Green Version]
  58. Méndez-Fernandez, P.; Bustamante, P.; Bode, A.; Chouvelon, T.; Ferreira, M.; López, A.; Pierce, G.J.; Santos, M.B.; Spitz, J.; Vingada, J.V.; et al. Foraging ecology of five toothed whale species in the northwest Iberian Peninsula, inferred using carbon and nitrogen isotope ratios. J. Exp. Mar. Biol. Ecol. 2012, 413, 150–158. [Google Scholar] [CrossRef] [Green Version]
Figure 1. Map of the study site showing the water sampling station (St. E2CO), the position of the sediment trap mooring, and the 1° × 1° cell used to compute the upwelling index (UI).
Diversity 12 00121 g001
Figure 2. The upwelling index (UI, km3 s−1 km−1) averaged over periods of 7, 15, and 30 days prior to each sampling date at St. E2CO.
Diversity 12 00121 g002
Figure 3. Vertical variability of (a) temperature (t, °C), (b) nitrate (NO3-, µM), (c) ammonium (NH4+, µM), and (d) chlorophyll-a (Chla, µg l-1) during the study. The horizontal lines above each panel indicate the upwelling periods (UI15 ≥ 0). The white dots represent the water sampling depths. Interpolations were made using Kriging.
Diversity 12 00121 g003
Figure 4. Relationships between log-transformed bottom (a) temperature (°C), (b) nitrate (µM), (c) phosphate (µM), and (d) 50 m-depth integrated chlorophyll a (mg Chla m−2) and upwelling index (UI15) averaged over 15 d prior to sampling (m3 s−1 km−1). Significant (P < 0.05) regression lines (continuous lines) and 95% confidence limits (dashed lines) are indicated. The red line indicates UI15 = 0. Bottom waters correspond to the deepest (70 m) sample.
Diversity 12 00121 g004
Figure 5. Variability of δ15N and δ13C (‰) in seston or sediment trap collected particles (a,b), and four plankton size-fractions (in µm, c,d) during the study. The horizontal lines above each panel indicate the upwelling periods (UI15 ≥ 0). Values of δ13C in plankton size-fractions were corrected for lipids (see Methods).
Diversity 12 00121 g005
Figure 6. Relationships between log-transformed δ15N (a,c), δ13C (b,d) for seston, sediment trap particles, and plankton size-fractions (µm), and upwelling index (UI15) averaged over 15 d prior to sampling (m3 s−1 km−1). Significant (P < 0.05) regression lines are indicated. Confidence limits for regression lines were omitted for clarity. Values of δ13C in plankton size-fractions were corrected for lipids (see Methods). The red line indicates UI15 = 0.
Diversity 12 00121 g006
Figure 7. Relationships between log-transformed δ13C of plankton size-fractions (µm) and the mean abundance of diatoms in the upper 50 m. Significant (P < 0.05) regression lines are indicated. Confidence limits for regression lines were omitted for clarity. Values of δ13C in plankton size-fractions were corrected for lipids (see Methods).
Diversity 12 00121 g007
Table 1. Mean and sd values of δ15N, δ13C and C:N ratio (by weight) of particles and plankton fractions measured in monthly samples during 2010 and 2011 (n = 24). δ13C of plankton was normalized for lipid content (see Methods).
δ15Nδ13CC:N
MeansdMeansdMeansd
seston5.121.43−22.182.087.461.31
sediment trap particles5.500.73−18.141.9110.381.65
plankton 200–500 µm6.380.70−17.550.384.920.46
plankton 500–1000 µm6.610.58−17.420.294.960.37
plankton 1000–2000 µm7.040.73−17.380.274.710.31
plankton >2000 µm6.850.92−17.220.234.970.69

