Article

Genetic Structure and Phylogeography of Tuber magnatum Populations

1
National Research Council, Institute of Biosciences and Bioresources–Perugia Division, Via Madonna Alta n. 130, 06128 Perugia, Italy
2
Department of Life, Health & Environmental Sciences, University of L’Aquila, 67010 Coppito-L’Aquila, Italy
*
Author to whom correspondence should be addressed.
Diversity 2020, 12(2), 44; https://doi.org/10.3390/d12020044
Submission received: 31 December 2019 / Revised: 21 January 2020 / Accepted: 22 January 2020 / Published: 24 January 2020
(This article belongs to the Special Issue Fungal Diversity in the Mediterranean Area)

Abstract

:
The ectomycorrhizal fungus Tuber magnatum produces the white truffle appreciated worldwide for its unique aroma. With respect to other Tuber spp. of economic interest, T. magnatum presents a narrower geographical range. This species has, in fact, long been considered endemic to Italy. However, over the last few decades several reports have documented the presence of white truffles in different Mediterranean countries and in particular in various areas of south-east Europe. In this study, samples from several Pannonian and Balkan countries such as Hungary, Serbia, Romania, Bulgaria and Greece have been collected and genotyped with microsatellite markers and the data merged with those available for Italian populations. Our objectives were to test whether Italian and south-east European populations are differentiated and to evaluate the genetic diversity of T. magnatum all over its distributional range. We show the genetic structure of T. magnatum populations with the differentiation of four main groups: northern Italy, central-northern Italy, southern Italy and the Balkan/Pannonian region. The present study allowed us to refine the evolutionary history of T. magnatum and track the possible post-glacial expansion route of this species. The assessment of T. magnatum’s genetic structure is not only of scientific relevance, but it is also important for the conservation and market traceability of this prestigious fungus.

Graphical Abstract

1. Introduction

Species of the genus Tuber (Ascomycota, Pezizales, Tuberaceae) establish symbiosis with the roots of several tree and shrub species by forming structures for nutrients exchange, known as ectomycorrhiza [1]. In virtue of this mutualistic relationship these fungi produce hypogeous fruiting bodies (ascomata) known as truffles, that produce their spores sequestered within the surrounding tissues [2]. Tuber spp. thus rely on mycophagists for spore dispersal. Truffles produced by several Tuber spp. hold distinctive aromatic properties, which make them appreciated and marketed worldwide as food delicacies. Among edible Tuber spp. the black truffles harvested in Europe (T. melanosporum Vittad. and T. brumale Vittad.), the black summer truffle T. aestivum Vittad., the whitish truffle T. borchii Vittad. and the white truffle T. magnatum Pico are of particular relevance.
The evaluation of the intraspecific genetic diversity and population genetic structure of a species is crucial to understand its biology and ascertain its origin, history and evolution. By using molecular markers and performing a wide geographical sampling, a fine assessment of the population genetic structure of T. melanosporum, T. brumale, T. indicum, T. aestivum and T. magnatum has been performed [3,4,5,6,7,8,9]. These studies highlighted the presence of geographically structured populations and phylogeographic patterns in these species.
Regarding T. magnatum, its genetic variability was initially investigated over a low number of specimens collected in Italy [10,11] or Italy and Croatia [12], using RAPD (Random Amplification of Polymorphic DNA), ITS-RFLP (Restriction Fragment Length Polymorphism of the Internal Transcribed Spacer of rDNA) and SNPs (Single Nucleotide Polymorphism) either in the ITS region, in the ß-tubulin gene or in a SCAR (Sequence Characterized Amplified Region). All these studies showed a very limited intraspecific polymorphism [13]. A broader investigation was carried out by Frizzi et al. [14] who analyzed the polymorphism of eleven isoenzymes on 139 specimens from 13 Italian populations. The low genetic variability across populations and the lack of an interpretable evolutionary trajectory were thought to be in agreement with a self-reproductive system, a restricted species endemism and a relatively recent differentiation of this taxon [14]. A few years later, by employing seven polymorphic simple sequence repeats (SSR) loci over 316 specimens from Italy and the Istrian peninsula (Croatia and Slovenia), Rubini and colleagues [4] disclosed for the first time an isolation by distance pattern and a phylogeographic structure in T. magnatum, with central Italy that likely represented a refugium for this species during the last ice age. In addition, this study has been instrumental for a deep reevaluation of the life cycle and the reproductive strategies of all Tuber spp. and to prove that truffle ascocarps are mainly made of the haploid, maternal tissue [15].
Around the late 90s of the last century, it became clear that T. magnatum can also be found in the Balkan peninsula and countries nearby [16] and, although more sporadically, in the south-east of France [17] and Switzerland [18]. The recent discovery of natural T. magnatum populations in areas ranging from Greece until Hungary and Romania ([13], and references therein), calls now for studies based on a larger sampling area than before. On these premises, here we employed SSR markers and an extensive sampling on most of the T. magnatum distributional range to shed more light on the genetic structure and phylogeography of this species. In particular, we aimed at evaluating whether Italian and south-east European populations are genetically differentiated and tracking the post-glacial expansion pattern of this species. The Balkan peninsula, like the Italian one, in fact could have represented a glacial refugia for T. magnatum during the last glaciation.
The assessment of the genetic diversity distribution could reveal important findings for aspects spanning from ecology, conservation and marketing of this prestigious fungus.

2. Materials and Methods

2.1. Sample Source and DNA Analysis

Tuber magnatum samples were collected in 2015–2016 with the help of local pickers. Sampling locations were mainly in Pannonian and Balkan countries and more marginally in central and southern Italy (Table 1). Genomic DNA was isolated from freeze-dried and fresh ascocarps (1–5 mg) according to Paolocci et al. [19]. DNA quantity and quality were evaluated using the spectrophotometer Nanodrop (MySpec, Wilmington, DE, USA). The isolated DNA was diluted to 20 ng/μL and stored at −20 °C. All samples were genotyped using eight microsatellite loci previously characterized in this species: the loci MA4, MA7, MA14, MA12, MA19 and MA13 derived from Rubini et al. [20] and the loci MA2-1 and MA5-1 derived from Rubini et al. [4]. The SSR loci were PCR-amplified using multiplex PCR [19]. To this purpose, two panels, each consisting of four loci, were defined (Table S1). PCR conditions were those reported in Rubini et al. [20]. Moreover, the locus MA13 was analyzed in all samples considered by Rubini et al. [4].
The SSR amplicons were analyzed by capillary electrophoresis using an ABI 3130 Genetic Analyzer in presence of the Genescan 500 LIZ size standard (Applied Biosystems, Foster City, CA, USA). Sizing of amplicons and allele scoring were performed using GeneMapper software version 3.7 (Applied Biosystems, Foster City, CA, USA).

2.2. Genetic Diversity Data and Population Structure Analyses

The mean number of alleles (Na) and expected heterozygosity (He) for each locus and for each population were evaluated using GenAlEx v. 6.501 [21]. Allelic richness (Ar) was calculated with the software ADZE [22] using the rarefaction method [23] to correct for differences in sample size. The Ar was weighted to four individuals by excluding calculation for Population 1 and 31, which have a very small sample size. To avoid losing most of the information due to the small sample size of some populations, Ar was also calculated by sorting individuals into eight geographical groups according to their proximity (Figure S1). In this case, it was possible to consider a larger sample size, up to n = 15.
To estimate the degree of differentiation among populations, the analysis of molecular variance (AMOVA) and calculation of Fst and Rst values were performed using Arlequin software, version 3.5.1.2 [24]. These analyses were carried out both by comparing all 36 populations (sampling locations) and two regional groups of populations: Italy and Balkans/Pannonia.
Multilocus version 1.3b [25] was used to calculate the number of multilocus genotypes (MLGs) and genotypic diversity (i.e., the probability that two individuals taken at random have different genotypes). To evaluate if samples sharing the same MLG were true clones or resulted from random mating, the Psex (the probability of obtaining the same MLG from different sexual events) values and their significance levels were calculated with MLGsim software [26]. To test for the presence of an isolation by distance pattern, correlation between genetic and geographic distances was evaluated by performing a Mantel test according to Rousset [27] and using the software GenAlEx. The geographic distance matrix, consisting of the natural logarithm of the pairwise distance among populations, was calculated with GenAlEx considering the average geographic coordinates of each population. A genetic distance matrix consisting of pairwise Rst/(1−Rst) values was calculated using the software SPAGeDi version 1.5 [28].
The genetic structure of T. magnatum populations was evaluated by Bayesian analysis using the software STRUCTURE version 2.3.4 [29] and TESS version 2.3 [30,31]. Five independent runs of STRUCTURE for K (max number of estimated clusters) ranging from 2 to 10 were conducted. For each K, 2000,000 MCMC (Markov Chain Monte Carlo) and a burn-in of 200,000 iterations were performed, respectively. The admixture and no admixture models were tested considering correlated and uncorrelated allele frequencies. The optimal K was determined by comparing both the log-likelihood values and Evanno’s ΔK [32] using the software Structure Harvester [33]. TESS analysis was performed both under the no admixture and the CAR admixture models by conducing 50 runs for each K ranging from 2 to 10 with 50,000 total MCMC steps and a burn-in of 10,000 sweeps. The spatial interaction parameter was set to the default value of 0.6 and the degree of trend to linear. To estimate the best K, the Deviance Information Criterion (DIC) was averaged across runs for each K. The smallest value before reaching a plateau was selected as the best K. Burn-in length and number of MCMC interactions for STRUCTURE and TESS were established by checking the convergence of summary statistics, and by evaluating consistence among runs of different lengths, following the recommendations in the software manuals.
STRUCTURE and TESS results were processed with the software CLUMPP [34] using the Greedy algorithm, random input order of runs and 1000 repeats. CLUMPP results were used to generate bar graphs using DISTRUCT [35]. The ancestry coefficients calculated with STRUCTURE were also plotted into a geographic map using the “POPSutilities” R script [36] according to the interpolation procedure described by Francois [37]. Interpolate values of ancestry coefficients among each pair of samples were calculated with R using the CLUMPP Q-matrix and a spatial grid obtained from the raster map of the area. For each sample, transition between one group (K) to another was displayed with a progressive change in the color intensity. The starting colors are those assigned to the different K.

3. Results

3.1. Genetic Diversity of T. magnatum Populations

SSR data were generated for 111 T. magnatum samples. Most of the samples were from the Balkan/Pannonian region (9 populations, 88 samples) and a few from central (Abruzzo-Molise, 18 samples) and southern Italy (Basilicata and Calabria, 5 samples) (Table S2). SSR analysis always showed the presence of a single allele per locus as expected for haploid organisms. In total, 49 alleles were detected and among them and 12 were new with respect to the alleles previously identified [4] (Table S2). The data obtained in this study were then merged with the data from Rubini et al. [4], which were relative to samples mainly collected in Italy, to end up with a dataset of 429 samples grouped into 36 populations covering almost all of the known T. magnatum distributional area (Table 1 and Figure 1).
Considering this merged dataset, the number of alleles was 77 with a minimum of 3 alleles for the locus MA13 and a maximum of 19 for the locus MA4. The expected heterozygosity (He) ranged from 0.12 (MA13) to 0.84 (MA51) (Table S3). In each population the mean number of alleles ranged from 1.4 to 4.6 and the expected heterozygosity from 0.17 to 0.56 (Table 1). Comparison of allele distribution between samples from the Italian and Balkan/Pannonian regions revealed 10 private alleles specific to Italy and 28 to the Balkans/Pannonia. Some of these 38 alleles were also private for single populations, but their frequency was no higher than 0.041 (Table S4). The remaining 39 alleles were shared between the two regions, the most of them without relevant differences. Only a few showed a biased frequency, this was the case of the alleles 162 and 172 at MA4 and MA14 loci, respectively, being markedly more frequent among the Balkan/Pannonian samples, and the allele 121 at locus MA21 more frequent among Italian samples (Table S4). By combining the allelic profiles at the eight SSR loci, 362 MLGs were identified. Among these MLGs, 48 were shared at least between two individuals, but only a few (9) turned out to be clones as they had Psex values that were significantly lower, thus rejecting the hypothesis of their origin by sexual reproduction (Table S5). These putative clones were detected only within a population. Some MLGs were also shared among both close and distant populations but none of them showed significant Psex values, suggesting that they were generated by chance because of random mating (Table S5). The overall genotypic diversity was 0.998. When plotted against the number of loci, the genotypic diversity reached a value higher than 0.99 at six loci and also slightly increased up to eight loci (Figure S2).
The Ar for each single population ranged from 1.66 to 2.27. The highest values were observed for Abruzzo-Molise (Populations 4, 5 and 7) among the Italian populations and for Greece (Populations 35 and 36) among the Balkan/Pannonian populations (Table 1). Grouping individuals at a large geographical scale (i.e., 8 groups) allowed us to calculate the Ar by means of a rarefaction analysis based on a larger sample size (i.e., n = 15) and to show that the individuals from central-south Italy (Group 2) and those from the southern Balkans (Group 8) had the highest Ar values: 3.50 and 3.66, respectively (Figure S1).

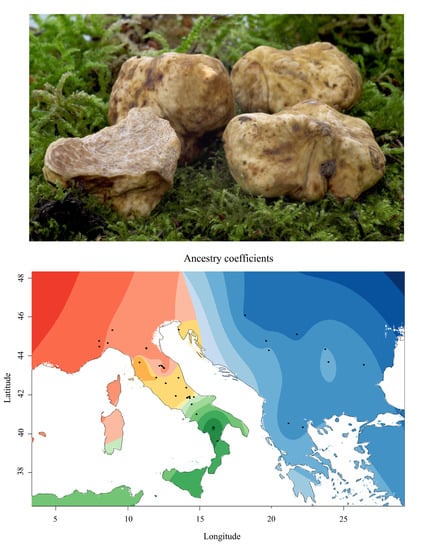
3.2. The Balkan/Pannonian and Italian Populations Were Genetically Differentiated

The presence of a genetic structure was revealed by AMOVA, which showed a marked and significant genetic differentiation between the 36 populations (Fst 0.169, p < 0.001; Rst = 0.422, p < 0.001). A higher significant differentiation (Fst 0.212, p < 0.001; Rst = 0.427, p < 0.001) was detected when two regional groups of populations (Italian and Balkan/Pannonian) were considered (Table S6). Furthermore, the Mantel test showed that the among-populations differentiation significantly increased with geographic distance (R2 = 0.0232, p < 0.005; Figure 2).
To better evaluate the genetic structure of T. magnatum populations, an admixture analysis was performed. Bayesian clustering using the software STRUCTURE, showed that the most probable number of clusters (K) was four (Figure S3A,B).
Three of these clusters were primarily associated with different geographical areas of sample acquisition, with one grouping most of the individuals from southern Italy, one those from central-northern Italy and Istria, and the third those from Balkans/Pannonia. Conversely, neither a specific nor a prevalent geographical provenance emerged within individuals of the fourth cluster (Figure 3A). We also noted that some individuals of Balkans/Pannonia shared common ancestry with those of central-northern Italy, Istria and with Population 1 from southern Italy. Plotting the ancestry coefficients obtained with STRUCTURE into the geographical map produced a better picture of the geographical distribution of individuals belonging to the four genetic clusters since they clearly matched the four distinct geographical areas: south Italy, central Italy, central-northern Italy and Istria as well as the Balkans/Pannonia (Figure 3B). No further relevant differentiation among individuals emerged when a higher value of K was considered (Figure 3A). Similar results were obtained using the no-admixture model considering either correlated or uncorrelated allele frequencies (data not shown). When STRUCTURE was run to analyze the Balkan/Pannonian regional group only, a further sub-structuration, with the differentiation of Greek Populations 35 and 36 starting from K = 3, emerged (Figure S4). Conversely, the same analysis on samples from Italy and Istria did not show any further sub-structuration (data not shown).
The genetic structure of populations was further explored using TESS. Unlike STRUCTURE, this software estimates the number of genetic clusters (K) by taking into account geographical coordinates of individuals to detect discontinuities in allele frequencies. Running TESS, under the admixture model there were three clusters matching; basically, the three main clusters found by STUCTURE (data not shown). The no-admixture model was more informative since, according to the DIC values, the most probable number of clusters was five (Figure 4A). In agreement with STRUCTURE, TESS evidenced a clear differentiation of southern Italian and Balkan/Pannonian populations. Moreover, the same analysis showed a further differentiation between populations of southern-central Italy and those of central and northern Italy. A fifth group was represented by the Balkan Population 35 from Greece and Population 1 from Calabria, which showed partial common ancestry (Figure 4B).

4. Discussion

When T. magnatum is evoked, what comes to mind varies according to people: According to the most gourmets and consumers, T. magnatum is the premium truffle, whereas for mycologists it represents the Tuber species that, among those of economic relevance, has the narrowest distributional range and the least understood autecology [13]. Previous studies revealed the presence of a genetic structure of T. magnatum Italian populations with southernmost and north-westernmost populations genetically differentiated from those of central Italy and Istria [4]. In these studies, only few samples other than those coming from Italy were considered; but, differently from what has been believed in the past, the T. magnatum distributional range is not indeed confined to the Italian peninsula only. Rather, it adds to the trans-Adriatic species as an increasing number of works have recently reported on the recovery of this fungus in different Balkan countries [16]. Thus, here we took advantage of T. magnatum specimens harvested from these new hotspots of white truffle production, spanning from Hungary, the northernmost, to Bulgaria, the easternmost, and down to Greece, to assess the genetic variability of this species and to ascertain whether genetic differentiation exists between populations of the two main regions of the T. magnatum distributional range: Italy and the Balkans/Pannonia. The analysis of more than 400 individuals, distributed into 36 populations located in Italy and the Balkan/Pannonian region and genotyped with eight SSR loci, unveils the presence of a high genetic variability and a clear genetic structure of T. magnatum populations.

4.1. New Insights into Genetic Diversity of White Truffle

The study by Rubini and colleagues [4] conducted over more than 300 T. magnatum samples harvested in Italy and Istria and genotyped by means of a few SSR markers was the first to show the presence of genetically structured populations and the occurrence of an extensive gene flow within and among T. magnatum populations, likely thanks to spore dispersal by mycophagist mammals. With respect to previous studies, not only the higher sample size but also the use of the more informative markers, that is, polymorphic SSRs vs. isoenzymes, RAPD or SNPs on highly conserved loci (i.e., β tubulin), were therefore crucial to these authors to gain first evidence on the abundance and distribution of the genetic variability in this truffle species. Yet, the use of a handful of polymorphic SSR loci coupled to a sampling of T. melanosporum all over the distributional range was sufficient to Riccioni et al. [5] to confute the thesis of a trifling genetic polymorphism in this species [38] and map its possible post glacial recolonization pattern. According to this observation, here we tested the hypothesis that even a relatively small number of polymorphic SSR loci would be sufficient to shed light into T. magnatum genetic diversity, if samples representative of the entire species distributional range are analyzed. Following this rationale, the first goal of the present study was to broaden the T. magnatum sampling areas. Thus, despite the widely known and hard to counteract secrecy of truffle hunters, an extensive sampling of T. magnatum fruitbodies from Bulgaria, Hungary, Romania, Serbia and Greece has been performed. Eighty-eight samples from these countries and a few samples from south Italy have been genotyped for eight SSR loci and these data merged with the SSR profiles retrieved from Rubini et al. [4]. By doing so, the number of alleles detected among the 429 specimens increased up to 77, with 12 new alleles being found, and with the number of alleles per locus (from 3 up to 19) in the same range found for other truffle species, such as T. melanosporum (2–18) and T aestivum (4–15) [39,40].
The value of the He over loci of 0.54 (Table S4) or 0.38, if the average value among populations is considered (Table 1), is much higher than that reported for this species (0.16) when sampling was confined to southern Italy only [41]. This high value of He suggests that at large geographical scale the level of genetic diversity in T. magnatum is comparable with that of other European species with a wider geographical distribution, such as T. melanosporum and T. aestivum, which showed He values of 0.41 and 0.50, respectively [7,39]. The high level of genetic diversity is also confirmed by the high number of MLGs: 332 over 429 fruit bodies analyzed and the overall genotypic diversity of 0.99, a value similar to that found in T. melanosporum and T. aestivum [7,39]. Moreover, the evidence that genotypic diversity reaches a plateau value of 0.99 with just six loci indicates that the number of loci used in this study is adequate to evaluate the genetic variability of T. magnatum.
If the entire sample set is split into two main regions, the Italian and the Balkan/Pannonian ones, then the presence of many private alleles specific to a single region emerges, although with a very low frequency. It is worth mentioning that a few of the shared alleles show a quite different frequency between the two regions. In sum, enlarging the sample size with individuals from the easternmost and southernmost T. magnatum distributional areas has allowed us to disclose new and private alleles and gain a closer look into the population genetics of this species.

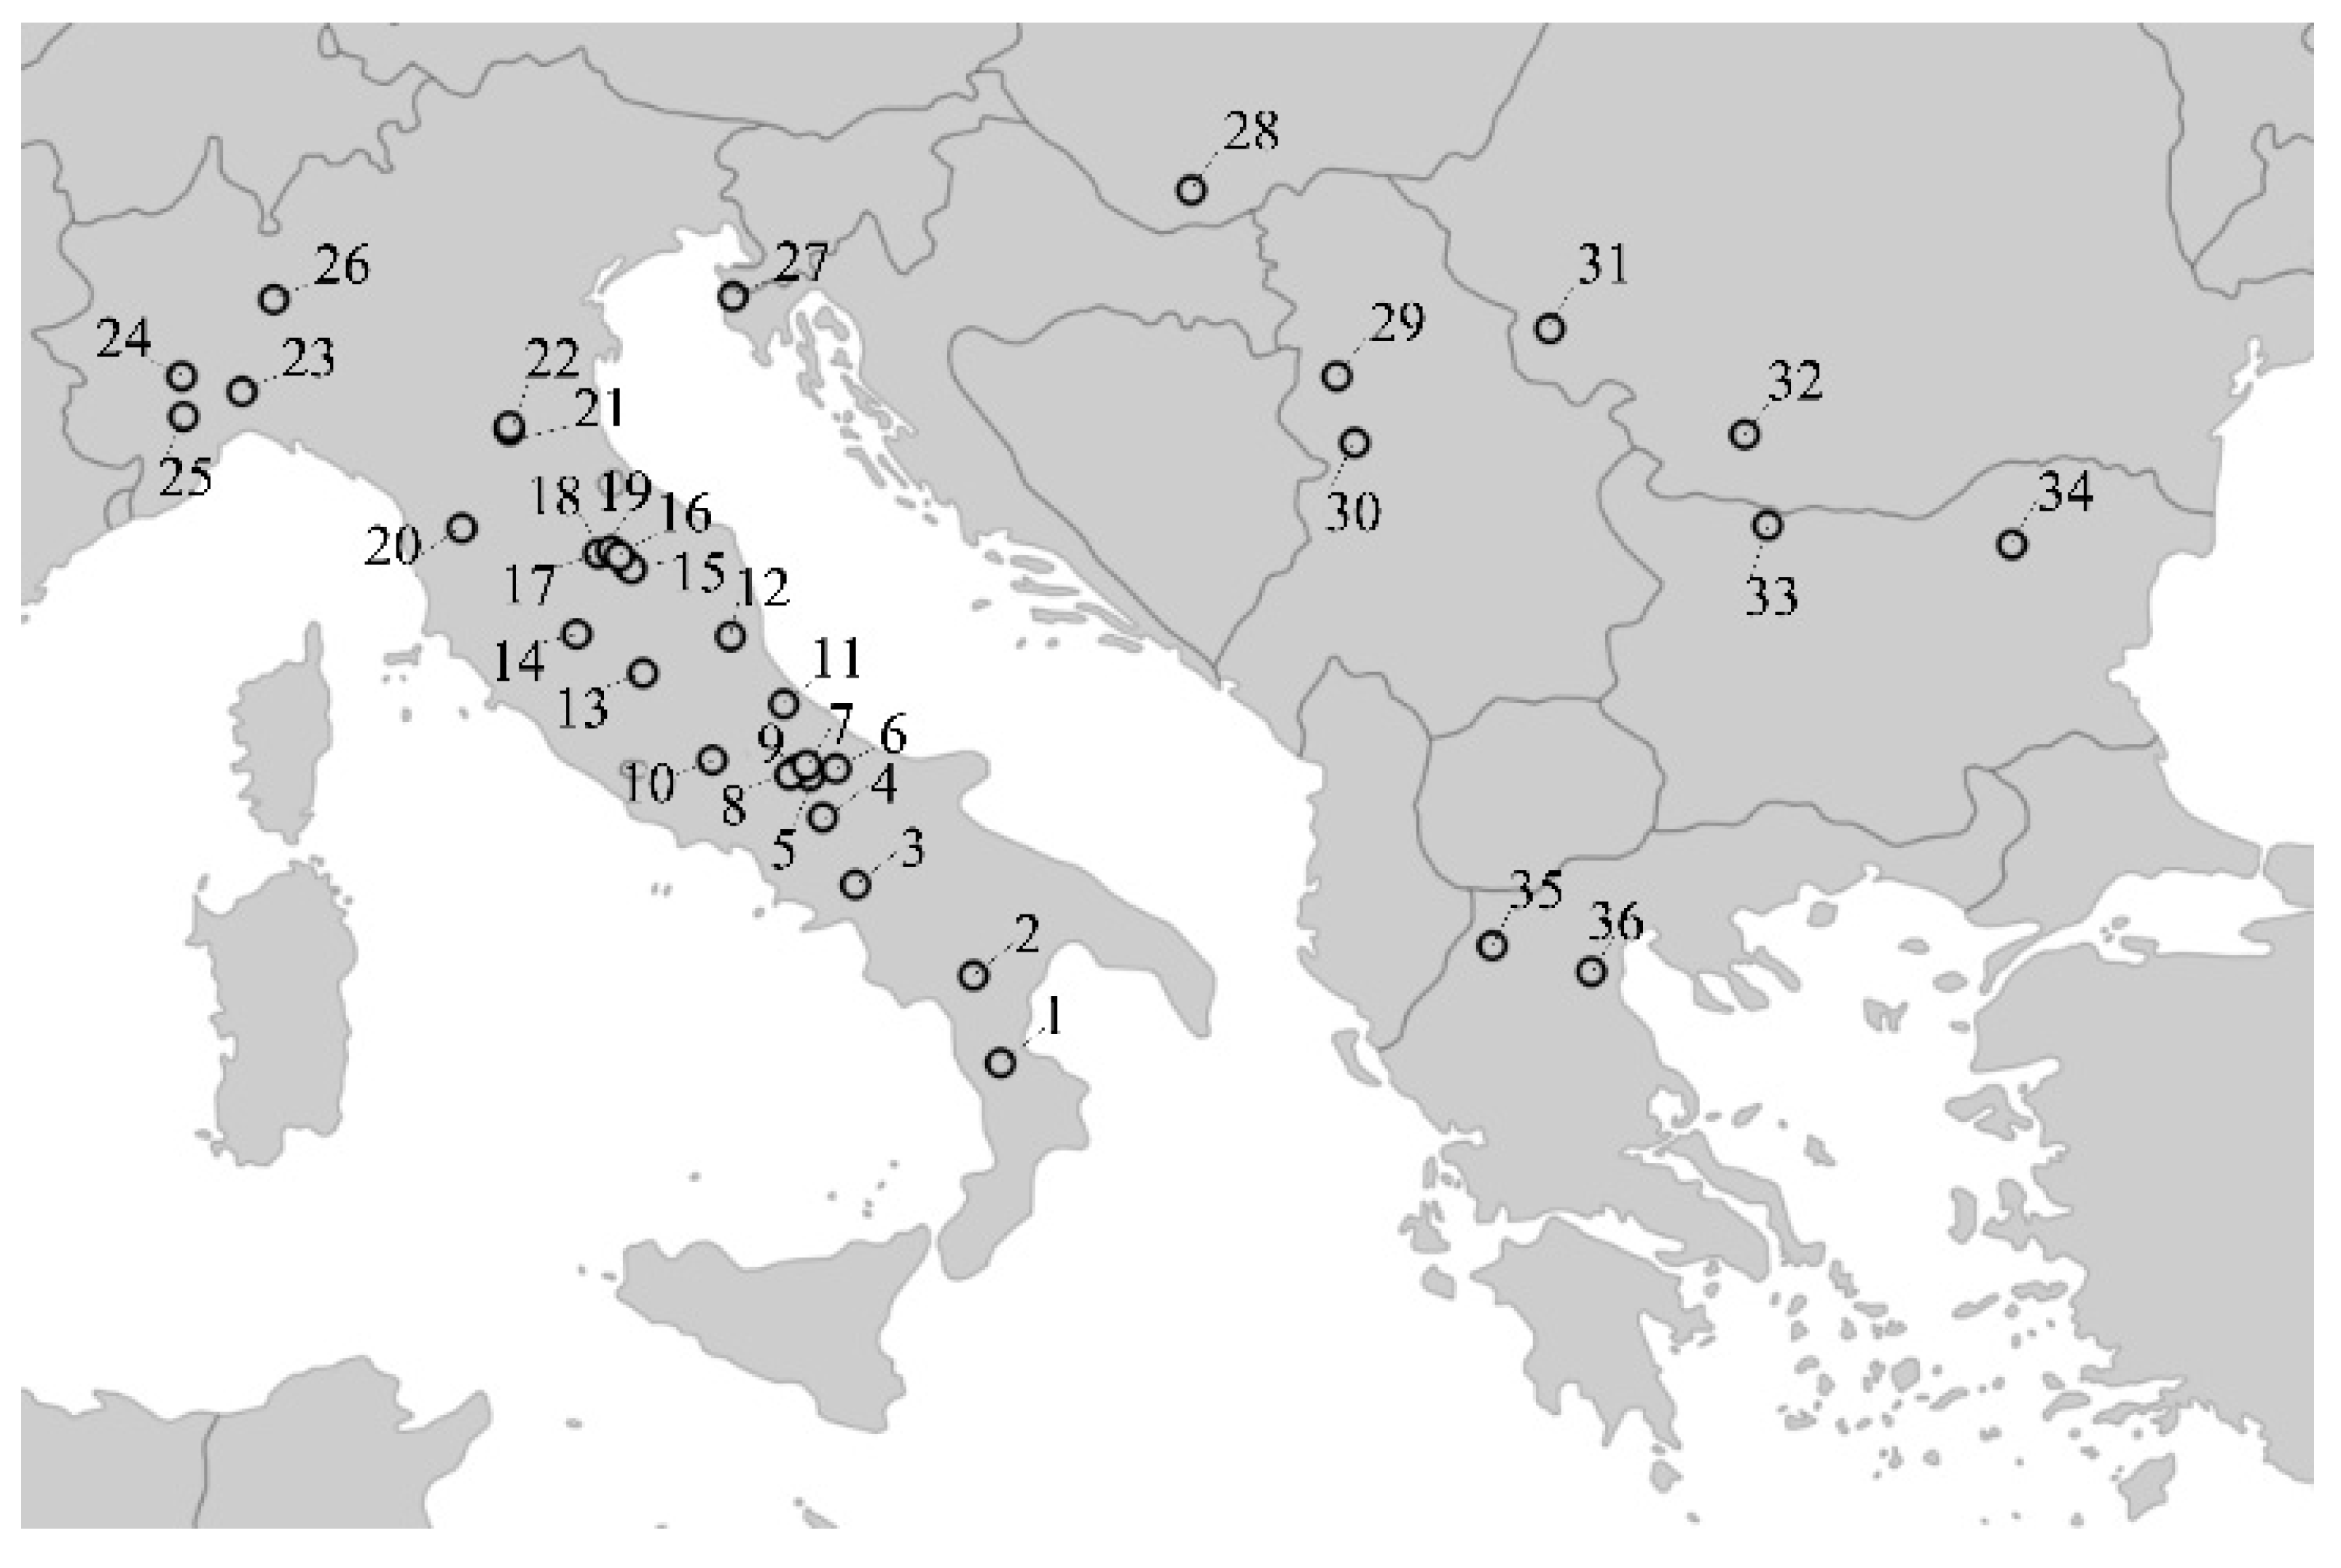
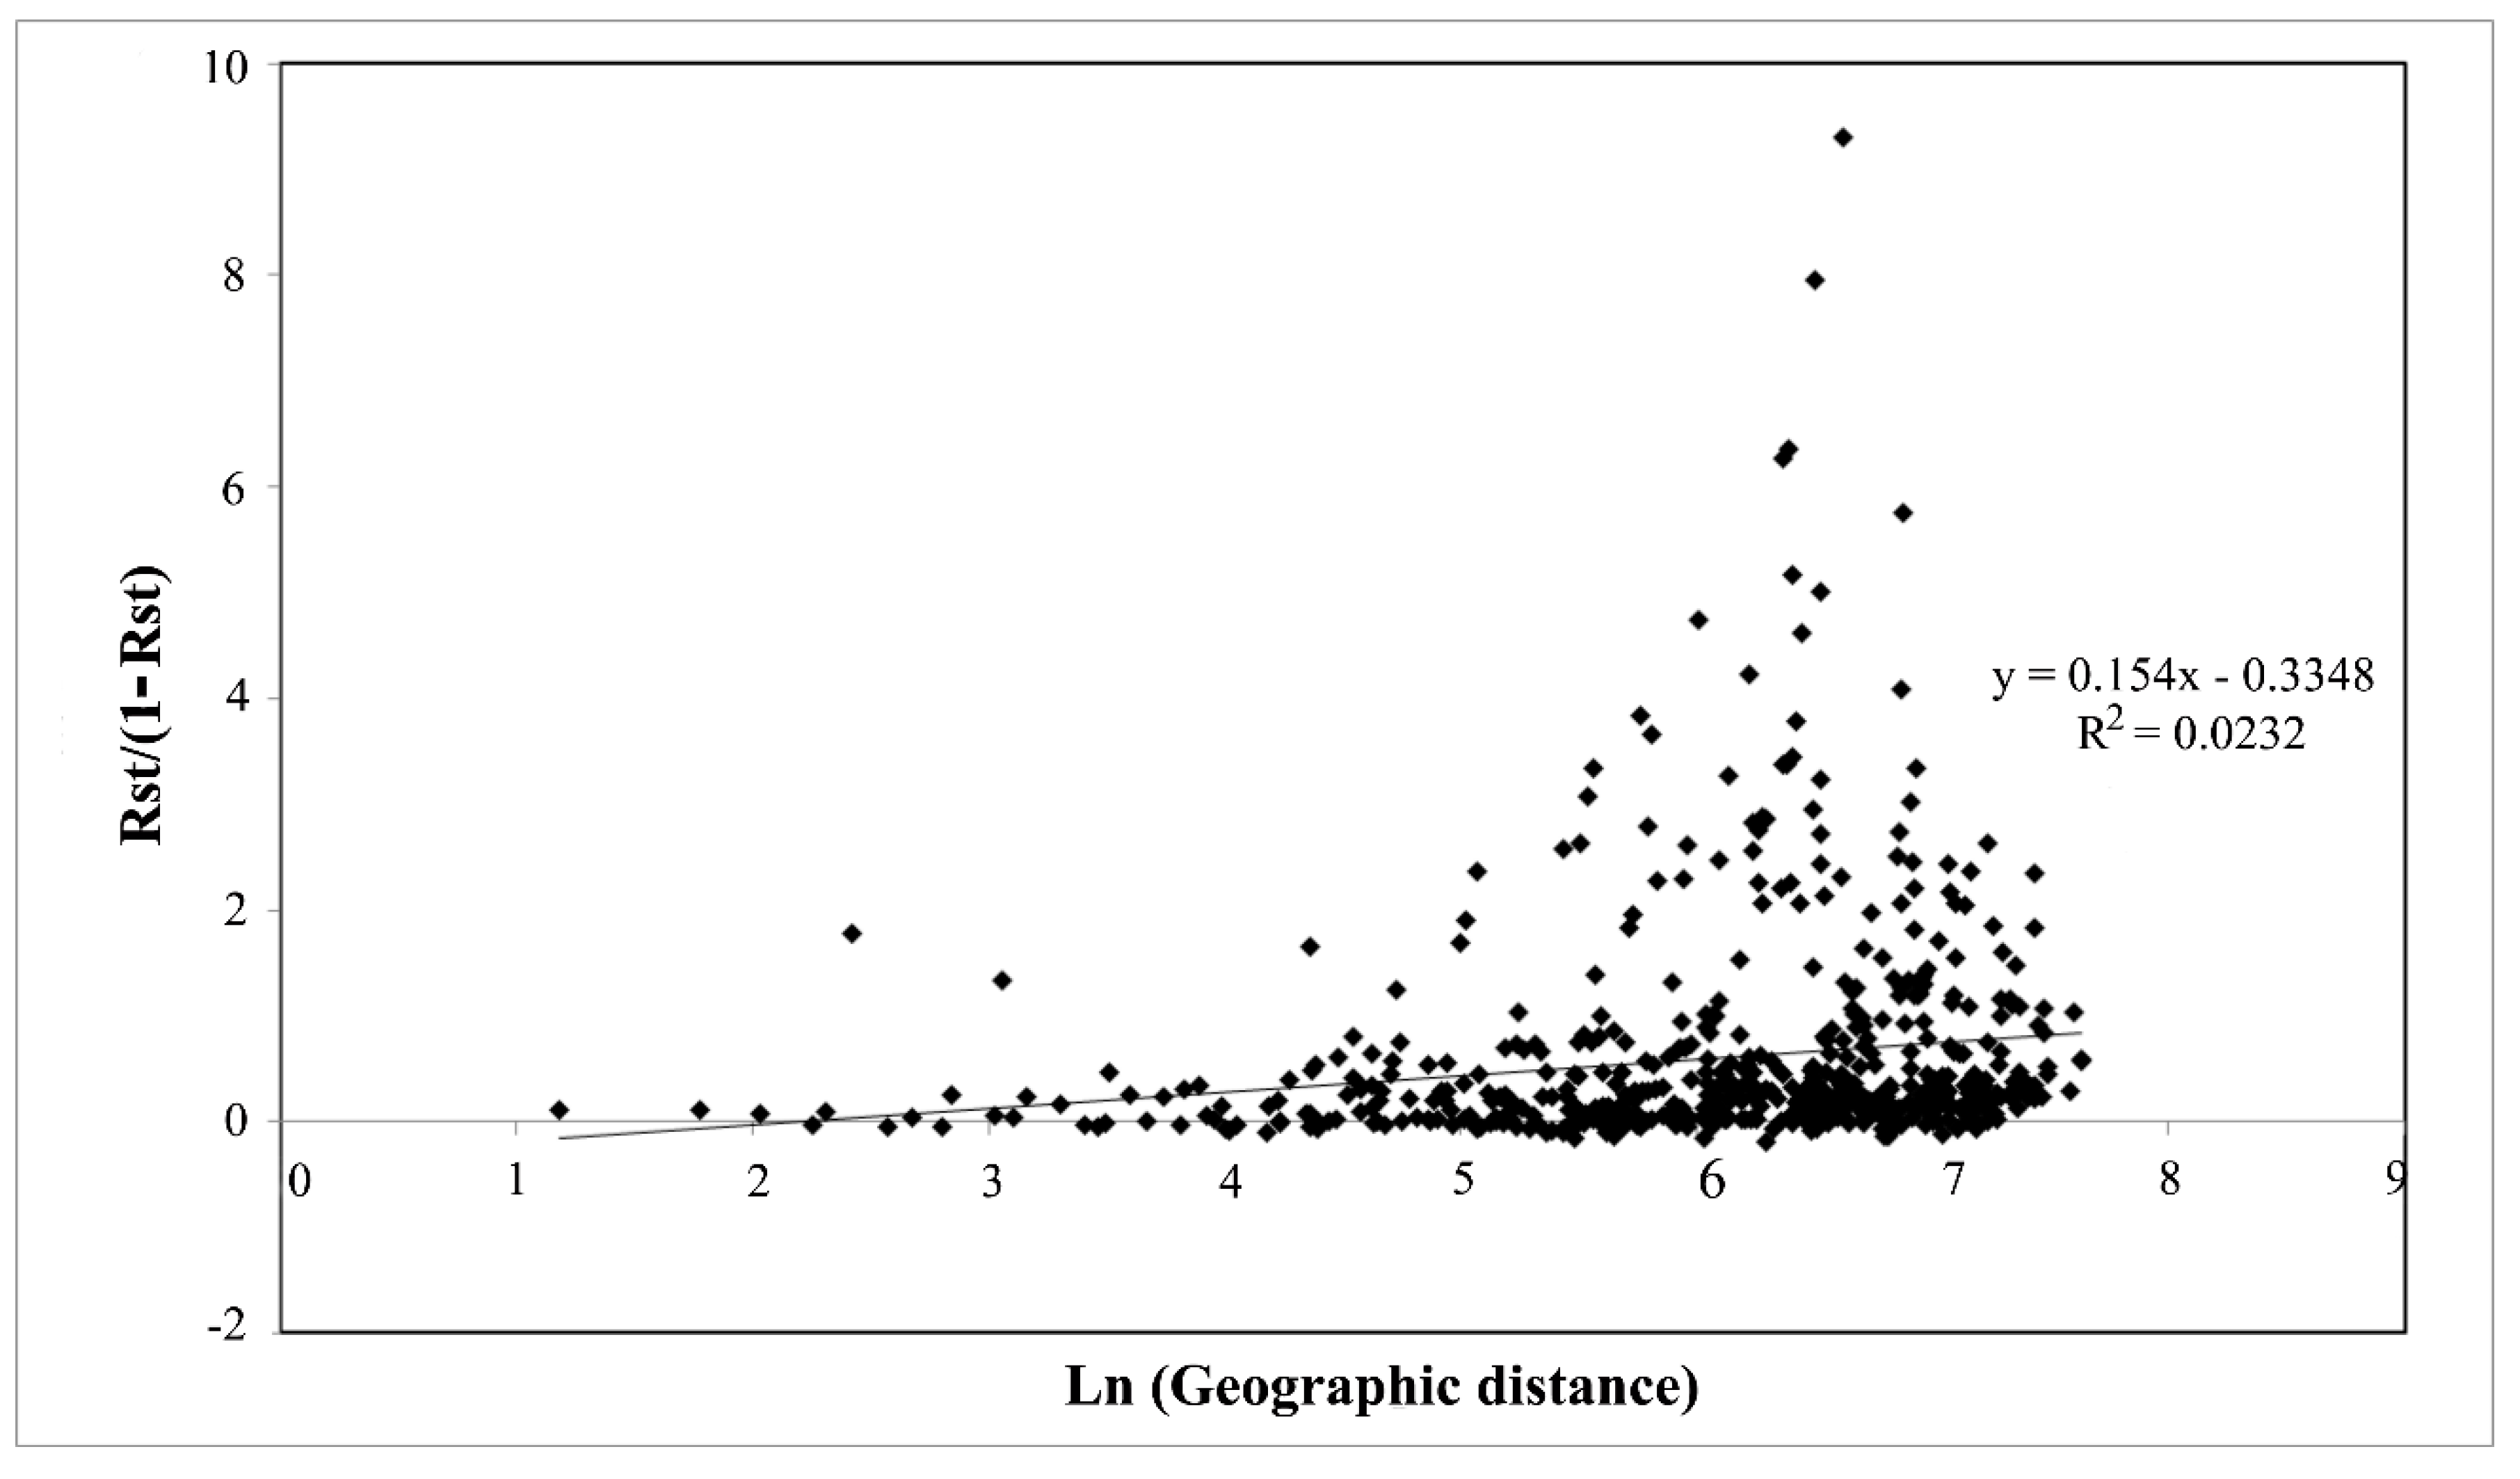
4.2. Large Scale Sampling Reveals a Phylogeographic Structure in T. magnatum

The AMOVA analysis of the SSR data obtained from the 429 samples proves the presence of a genetic structure among populations. The values of Fst and Rst, in fact, are higher in the present research vs. the previous work by Rubini et al. [4], suggesting that the new populations considered, mainly from the Balkans/Pannonia, are genetically differentiated from those of Italy and Istria. This is confirmed by the Fst and Rst values that not only are significant but also increase when two regional groups of populations (Balkan/Pannonia and Italy) are compared. In keeping with this, the Mantel test depicts an isolation by distance pattern (Figure 2).
The presence of a genetic structure has been evaluated more in detail by performing Bayesian analysis. The STRUCTURE algorithm clearly reveals that Balkan/Pannonian and Italian populations are genetically differentiated. Moreover, Italian populations are split into tree genetic clusters: southern, central and central-northern Italy, in agreement with results of Rubini et al. [4].
Historical population expansions and restrictions resulting from climate changes have been reported for plant species, including truffle host species, which experienced population bottlenecks as a consequence of glaciations [42]. In concert with this, the geographical distribution of European truffle species has followed the population expansion and restriction processes of their hosts [38,43]. For example, within the black truffle clade, T. melanosporum survived in refugia located in the Iberian and Italian peninsulas, as inferred by ITS, ISSR and SSR markers [3,5,44]. Conversely the surviving pattern of T. brumale aggr., resulting from the phylogeny of ITS, LSU and PKC loci, was more complex: Within the T. brumale clade A, populations of haplotype I survived the last glaciation in Western Europe, those of haploytpe II in Eastern Europe whereas those of clade B in the Carpathian basin and Balkan region [6]. This latter clade was later proposed as representing a cryptic species, T. cryptobrumale [45]. Concerning the T. aestivum clade, according to the distribution and relatedness of the ITS haplotypes of samples all over Europe and Turkey, it has been suggested that this species survived in Turkey whereas European populations likely experienced a population bottleneck during the last glaciation [9]. The geographic structure of T. magnatum populations from the Italian peninsula, as per SSR analyses, was consistent with the occurrence a glacial refugium in central Italy from which the northernmost and southernmost populations originated [4]. Thanks to the large sampling performed, this hypothesis is here reinforced as among Italian populations, those from the central-southern area exhibit the highest levels of allelic richness. Our study also suggests that the Balkan peninsula may have represented a T. magnatum glacial refugium as well. Our inference stems from the following considerations: (i) Balkan/Pannonian populations, with a few exceptions, belong to a different genetic cluster with respect to Italian specimens, suggesting an independent evolutionary history; (ii) STRUCTURE analysis performed in Balkan/Pannonian populations shows that the individuals from the southernmost populations (Greece) tend to differentiate from the others and the He allelic richness is higher in these populations, a situation frequently expected in correspondence to putative glacial refugia [46]; and (iii) many truffle host plant species, including those that host T. magnatum (i.e., beech and hornbeam spp.) survived the last glaciation in three main Mediterranean peninsulas: the Iberian, Italian and Balkan ones [47,48,49].
It is noteworthy that, although a general phylogeographic pattern emerged from the STRUCTURE analysis, some individual from the Balkan/Pannonian region (e.g., individuals from Populations 30, 32 and 34) share common ancestry with individual from Italian populations. Moreover, analyses that take in account the geographical information (i.e., TESS algorithm), confirm clustering into four groups but also show that the individuals from Population 1 (southern Italy) share partial ancestry with those from Population 35, one of the southernmost populations from the Balkan area.
The finding that individuals across the two shores of the Adriatic sea partially share a common ancestry poses the question whether strain migration occurred from one side of the Adriatic shore to the other. In fact, the hypothesis that, in the past, strains from southern-central Italy moved to the Balkan region or vice versa, cannot be ruled out. Many Mediterranean taxa present disjunct distributions between the west and east Mediterranean, and these disjunct biogeographical patterns are the results of the complex paleogeographic history of the present Mediterranean region [50]. Land bridges between the Italian and Balkan shores of the Adriatic sea occurred in the Neogene through the formation of the Apulo-Dalmatic Realm [51] and likely during the Pleistocene glaciations [52]. Thus, it is conceivable that by enabling the migration of mycophagist animals these geological events may have favored truffle spore dispersal between the two peninsulas. Along the same reasoning, as the two shores of the Adriatic sea shared basically the same climate and soil (calcareous soil of cretaceous origin) conditions [53], it is more than conceivable that whatever the truffle migration direction was, the newly introduced truffle strains encountered host species and pedoclimatic conditions that have favored their settlement. Mycophagist-mediated spore dispersal across the Alps also appears to be the most conceivable explanation of the higher relatedness of Istrian specimens to those from Italy rather than to those from the Balkans. A more extensive sampling of specimens from both sides of the Adriatic sea covering, in particular, the latitudes spanning from 40° to 42° N, coupled with the use of phylogenetically informative functional markers, would help us to further test the “bridge” hypothesis.

4.3. Genetic Structure and Conservation Implications

Unearthing T. magnatum population genetic structure may have important implications for conservation of its biodiversity. Differently from black truffle species, T. magnatum cultivation is not yet established [13]; thus, propagation of this species is almost exclusively natural. In vitro isolation of mycelium strains is also very challenging as this species shows a very slow growth rate and optimal nutritional requirements have not been identified yet. Thus, the preservation of T. magnatum strains ex situ in genetic banks is currently unfeasible. Rather, the most affordable strategy for the conservation of T. magnatum biodiversity relies on the preservation of its natural habitats. On these premises, results of the present study may be of relevance to identify and preserve populations and strains specific and adapted to different environments.

5. Conclusions

Here we have shown that T. magnatum genetic diversity is higher than hitherto thought and geographically structured across the Italian peninsula and Balkan/Pannonia region. Our findings are of relevance to make inferences about the phylogeographic history of this species but also for marketing and conservation purposes. The price of white truffles is traditionally dictated by their geographic provenance; thus, by increasing the number of genetic markers it would be possible, in the near future, to trace the origin of these truffles. This is a prerequisite to promote and sustain local white truffle-linked ecosystem services and economies but also to evaluate if and to what extent genetic determinants concur to shape the aroma variability across white truffles of different provenance. From a conservation point-of-view, the presence of a phylogeographic structure led us to hypothesize that T. magnatum strains of different geographic areas might exhibit different adaptation traits. In the light of the difficulties in its cultivation/propagation and of a global warming scenario, preservation of T. magnatum natural habitats from both Italy and the Balkan/Pannonian countries is therefore crucial to prevent the erosion of its biodiversity.

Supplementary Materials

The following are available online at https://www.mdpi.com/1424-2818/12/2/44/s1, Table S1: Panels of SSR loci used, Table S2: List of the samples considered in this study, Table S3: Polymorphism levels of the 8 SSRs over the entire sample set, Table S4: Allele distribution and frequency in samples from Italian (I) and Balkan/Pannonian regions (B), Table S5: List of MLG and results of MLGsim analysis. Populations are indicated when identical MLG are found, Table S6: AMOVA analysis among all populations and considering two regional groups of populations (Italy, and Balkans/Pannonia), Figure S1: Allelic richness in eight geographical groups. The geographical groups are indicated below the figure. Each geographical group includes all individuals from populations (numbered as in Table 1) reported in parentheses, Figure S2: Average genotypic diversity in function of the number of loci, Figure S3: Estimation of the most probable k. (a) Mean log likelihood over 5 runs (error bars = standard deviations) and (b) ΔK, the second order rate of change in the likelihood at each K, Figure S4: STRUCTURE analysis performed on Balcan/Pannonian populations only, based on admixture model and correlated allele frequencies. Each K is represented by a different color. Populations are indicated below the figure and their geographic origin above.

Author Contributions

Conceptualization, A.R., G.P. and F.P.; methodology, A.R., B.B. and C.R.; investigation, data curation, B.B., V.D., M.L. and C.R.; formal analysis, A.R. and B.B.; resources, G.P. and M.L.; writing—original draft preparation, A.R., G.P., F.P.; writing—review and editing, B.B., V.D., C.R., M.L., G.P., F.P. and A.R. All authors have read and agree to the published version of the manuscript.

Funding

This research received no external funding.

Acknowledgments

We are grateful to Pavlina Kladopoulou, Giorgio Konstanidis, Kiro Prodan, Kenan Kyose, Iordan Taralanski, Dejan Polic, Oszkar Fekete, Istvan Bagi, Silvio Guardiani, Gianni Miglietta, Mario Marchione, Marilena Oddis, Simona Ascione, Domenico Puntillo for providing us with fresh specimens of Tuber magnatum from the Balkans and Hungary and some areas of the Italian peninsula.

Conflicts of Interest

The authors declare no conflict of interest.

References

  1. Smith, S.E.; Read, D.J. Mycorrhizal Symbioses, 3rd ed.; Academic Press: Cambridge, MA, USA, 2008. [Google Scholar]
  2. Trappe, J.M.; Molina, R.; Luoma, D.L.; Cázares, E.; Pilz, D.; Smith, J.E.; Castellano, M.A.; Miller, S.L.; Trappe, M.J. Diversity, Ecology and Conservation of Truffle Fungi in Forests of the Pacific Northwest; Gen. Tech. Rep. PNW-GTR-772; USDA Forest Service, Pacific Northwest Research Station: Portland, OR, USA, 2009.
  3. Murat, C.; Díez, J.; Luis, P.; Delaruelle, C.; Dupré, C.; Chevalier, G.; Bonfante, P.; Martin, F. Polymorphism at the ribosomal DNA ITS and its relation to postglacial re-colonization routes of the Perigord truffle Tuber melanosporum. New Phytol. 2004, 164, 401–411. [Google Scholar] [CrossRef]
  4. Rubini, A.; Paolocci, F.; Riccioni, C.; Vendramin, G.G.; Arcioni, S. Genetic and phylogeographic structures of the symbiotic fungus Tuber magnatum. Appl. Environ. Microbiol. 2005, 71, 6584–6589. [Google Scholar] [CrossRef] [PubMed] [Green Version]
  5. Riccioni, C.; Belfiori, B.; Rubini, A.; Passeri, V.; Arcioni, S.; Paolocci, F. Tuber melanosporum outcrosses: Analysis of the genetic diversity within and among its natural populations under this new scenario. New Phytol. 2008, 180, 466–478. [Google Scholar] [CrossRef] [PubMed]
  6. Merényi, Z.; Varga, T.; Geml, J.; Orczán, Á.K.; Chevalier, G.; Bratek, Z. Phylogeny and phylogeography of the Tuber brumale aggr. Mycorrhiza 2014, 24, 101–113. [Google Scholar] [CrossRef] [PubMed] [Green Version]
  7. Molinier, V.; Murat, C.; Peter, M.; Gollotte, A.; De la Varga, H.; Meier, B.; Egli, S.; Belfiori, B.; Paolocci, F.; Wipf, D. SSR-based identification of genetic groups within European populations of Tuber aestivum Vittad. Mycorrhiza 2016, 26, 99–110. [Google Scholar] [CrossRef] [PubMed]
  8. Qiao, P.; Tian, W.; Liu, P.; Yu, F.; Chen, J.; Deng, X.; Wan, S.; Wang, R.; Wang, Y.; Guo, H. Phylogeography and population genetic analyses reveal the speciation of the Tuber indicum complex. Fungal Genet. Biol. 2018, 113, 14–23. [Google Scholar] [CrossRef]
  9. Riccioni, C.; Rubini, A.; Türkoğlu, A.; Belfiori, B.; Paolocci, F. Ribosomal DNA polymorphisms reveal genetic structure and a phylogeographic pattern in the Burgundy truffle Tuber aestivum Vittad. Mycologia 2019, 111, 26–39. [Google Scholar] [CrossRef]
  10. Gandeboeuf, D.; Dupré, C.; Roeckel-Drévet, P.; Nicolas, P.; Chevalier, G. Grouping and identification of Tuber species using RAPD markers. Can. J. Bot. 1997, 75, 36–45. [Google Scholar] [CrossRef]
  11. Mello, A.; Fontana, A.; Meotto, F.; Comandini, O.; Bonfante, P. Molecular and morphological characterization of T. magnatum mycorrhizas in a long-term survey. Microbiol. Res. 2001, 155, 279–284. [Google Scholar] [CrossRef]
  12. Mello, A.; Murat, C.; Vizzini, A.; Gavazza, V.; Bonfante, P. Tuber magnatum Pico, a species of limited geographical distribution: Its genetic diversity inside and outside a truffle ground. Environ. Microbiol. 2005, 7, 55–65. [Google Scholar] [CrossRef]
  13. Riccioni, C.; Rubini, A.; Belfiori, B.; Gregori, G.; Paolocci, F. Tuber magnatum: The Special One. What Makes It so Different from the Other Tuber spp. In True Truffle (Tuber spp.) in the World: Soil Ecology, Systematics and Biochemistry; Zambonelli, A., Iotti, M., Murat, C., Eds.; Springer: Cham, Switzerland, 2016; pp. 87–103. [Google Scholar] [CrossRef]
  14. Frizzi, G.; Lalli, G.; Miranda, M.; Pacioni, G. Intraspecific isozyme variability in Italian populations of the white truffle Tuber magnatum. Mycol. Res. 2001, 105, 365–369. [Google Scholar] [CrossRef]
  15. Paolocci, F.; Rubini, A.; Riccioni, C.; Arcioni, S. Reevaluation of the life cycle of Tuber magnatum. Appl. Environ. Microbiol. 2006, 72, 2390–2393. [Google Scholar] [CrossRef] [PubMed] [Green Version]
  16. Marjanović, Ž.; Grebenc, T.; Marković, M.; Glišić, A.; Milenković, M. Ecological specificities and molecular diversity of truffles (genus Tuber) originating from mid-west of the Balkan Peninsula. Sydowia 2010, 62, 67–87. [Google Scholar]
  17. Tabouret, P. Exclusif! Description d’un site français producteur de truffe blanche d’Italie. Le Trufficulteur 2011, 78, 18. [Google Scholar]
  18. Tabouret, P. Constitution d’une fédération Suisse de la truffe et de la trufficulture. Le Trufficulteur 2012, 81, 25. [Google Scholar]
  19. Paolocci, F.; Rubini, A.; Granetti, B.; Arcioni, S. Rapid molecular approach for a reliable identification of Tuber spp. ectomycorrhizae. FEMS Microbiol. Ecol. 1999, 28, 23–30. [Google Scholar] [CrossRef]
  20. Rubini, A.; Topini, F.; Riccioni, C.; Paolocci, F.; Arcioni, S. Isolation and characterization of polymorphic microsatellite loci in white truffle (Tuber magnatum). Mol. Ecol. Notes 2004, 4, 116–118. [Google Scholar] [CrossRef]
  21. Peakall, R.; Smouse, P.E. GenAlEx 6.5: Genetic analysis in Excel. Population genetic software for teaching and research—An update. Bioinformatics 2012, 28, 2537–2539. [Google Scholar] [CrossRef] [Green Version]
  22. Szpiech, Z.A.; Jakobsson, M.; Rosenberg, N.A. ADZE: A rarefaction approach for counting alleles private to combinations of populations. Bioinformatics 2008, 24, 2498–2504. [Google Scholar] [CrossRef] [Green Version]
  23. El Mousadik, A.; Petit, R.J. High level of genetic differentiation for allelic richness among populations of the argan tree [Argania spinosa (L.) Skeels] endemic to Morocco. Theor. Appl. Genet. 1996, 92, 832–839. [Google Scholar] [CrossRef]
  24. Excoffier, L.; Lischer, H.E. Arlequin suite ver 3.5: A new series of programs to perform population genetics analyses under Linux and Windows. Mol. Ecol. Resour. 2010, 10, 564–567. [Google Scholar] [CrossRef] [PubMed]
  25. Agapow, P.M.; Burt, A. Indices of multilocus linkage disequilibrium. Mol. Ecol. Notes 2011, 1, 101–102. [Google Scholar] [CrossRef]
  26. Stenberg, P.; Lundmark, M.; Saura, A. MLGsim: A program for detecting clones using a simulation approach. Mol. Ecol. Resour. 2003, 3, 329–331. [Google Scholar] [CrossRef]
  27. Rousset, F. Genetic differentiation and estimation of gene flow from F-statistics under isolation by distance. Genetics 1997, 145, 1219–1228. [Google Scholar] [PubMed]
  28. Hardy, O.J.; Vekemans, X. SPAGEDI: A versatile computer program to analyze spatial genetic structure at the individual or population level. Mol. Ecol. Notes 2002, 2, 618–620. [Google Scholar] [CrossRef] [Green Version]
  29. Pritchard, J.K.; Stephens, M.; Donnelly, P. Inference of population structure using multilocus genotype data. Genetics 2000, 155, 945–959. [Google Scholar]
  30. Chen, C.; Durand, E.; Forbes, F.; Francois, O. Bayesian clustering algorithms ascertaining spatial population structure: A new computer program and a comparison study. Mol. Ecol. Notes 2007, 7, 747–756. [Google Scholar] [CrossRef]
  31. Durand, E.; Jay, F.; Gaggiotti, O.E.; François, O. Spatial inference of admixture proportions and secondary contact zones. Mol. Biol. Evol. 2009, 26, 1963–1973. [Google Scholar] [CrossRef] [Green Version]
  32. Evanno, G.; Regnaut, S.; Goudet, J. Detecting the number of clusters of individuals using the software STRUCTURE: A simulation study. Mol. Ecol. 2005, 14, 2611–2620. [Google Scholar] [CrossRef] [Green Version]
  33. Dent, A.E.; von Holdt, B.M. STRUCTURE HARVESTER: A website and program for visualizing STRUCTURE output and implementing the Evanno method. Conserv. Genet. Resour. 2012, 4, 359–361. [Google Scholar]
  34. Jakobsson, M.; Rosenberg, N.A. CLUMPP: A cluster matching and permutation program for dealing with label switching and multimodality in analysis of population structure. Bioinformatics 2007, 23, 1801–1806. [Google Scholar] [CrossRef] [PubMed] [Green Version]
  35. Rosenberg, N.A. DISTRUCT: A program for the graphical display of population structure. Mol. Ecol. Notes 2004, 4, 137–138. [Google Scholar] [CrossRef]
  36. Jay, F.; Manel, S.; Alvarez, N.; Durand, E.Y.; Thuiller, W.; Holderegger, R.; Taberlet, P.; François, O. Forecasting changes in population genetic structure of alpine plants in response to global warming. Mol. Ecol. 2012, 21, 2354–2368. [Google Scholar] [CrossRef] [PubMed]
  37. How to Display Ancestry Coefficients (Q-matrix) on a Geographic Map. Available online: http://membres-timc.imag.fr/Olivier.Francois/TESS_Plot.html (accessed on 4 November 2019).
  38. Bertault, G.; Raymond, M.; Berthomieu, A.; Callot, G.; Fernandez, D. Trifling variation in truffles. Nature 1998, 394, 734. [Google Scholar] [CrossRef]
  39. Murat, C.; Riccioni, C.; Belfiori, B.; Cichocki, N.; Labbé, J.; Morin, E.; Tisserant, E.; Paolocci, F.; Rubini, A.; Martin, F. Distribution and localization of microsatellites in the Perigord black truffle genome and identification of new molecular markers. Fungal Genet. Biol. 2011, 48, 592–601. [Google Scholar] [CrossRef]
  40. Molinier, V.; Murat, C.; Morin, E.; Gollotte, A.; Wipf, D.; Martin, F. First identification of polymorphic microsatellite markers in the Burgundy truffle, Tuber aestivum (Tuberaceae). Appl. Plant. Sci. 2013, 1, 1200220. [Google Scholar] [CrossRef]
  41. Pomarico, M.; Figliuolo, G.; Rana, G.L. Tuber spp. Biodiversity in one of the southernmost European distribution areas. Biodivers. Conserv. 2007, 16, 3447–3461. [Google Scholar] [CrossRef]
  42. Petit, R.J.; Brewer, S.; Bordács, S.; Burg, K.; Cheddadi, R.; Coart, E.; Cottrel, J.; Csaikl, U.M.; Van Dam, B.; Deans, J.D.; et al. Identification of refugia and post-glacial colonisation routes of European white oaks based on chloroplast DNA and fossil pollen evidence. For Ecol. Manag. 2002, 156, 49–74. [Google Scholar] [CrossRef]
  43. Bertault, G.; Rousset, F.; Fernandez, D.; Berthomieu, A.; Hochberg, M.E.; Callot, G.; Raymond, M. Population genetics and dynamics of the black truffle in a man-made truffle field. Heredity 2001, 86, 451–458. [Google Scholar] [CrossRef] [Green Version]
  44. García-Cunchillos, I.; Sánchez, S.; Barriuso, J.J.; Pérez-Collazos, E. Population genetics of the westernmost distribution of the glaciations-surviving black truffle Tuber melanosporum. Mycorrhiza 2014, 24, 89–100. [Google Scholar] [CrossRef]
  45. Merényi, Z.; Varga, T.; Hubai, A.G.; Pitlik, P.; Erős, Á.; Trappe, J.M.; Bratek, Z. Challenges in the delimitation of morphologically similar species: A case study of Tuber brumale agg. (Ascomycota, Pezizales). Mycol. Prog. 2017, 16, 613. [Google Scholar] [CrossRef]
  46. Widmer, A.; Lexer, C. Glacial refugia: Sanctuaries for allelic richness, but not for gene diversity. Trends Ecol. Evol. 2001, 16, 267–269. [Google Scholar] [CrossRef]
  47. Taberlet, P.; Fumagalli, L.; Wust-Saucy, A.G.; Cosson, J.F. Comparative phylogeography and postglacial colonisation routes in Europe. Mol. Ecol. 1998, 7, 453–464. [Google Scholar] [CrossRef] [PubMed]
  48. Grivet, D.; Petit, R.J. Chloroplast DNA phylogeography of the hornbeam in Europe: Evidence for a bottleneck at the outset of postglacial colonization. Conserv. Genet. 2003, 4, 47–56. [Google Scholar] [CrossRef]
  49. Magri, D. Patterns of post-glacial spread and the extent of glacial refugia of European beech (Fagus sylvatica). J. Biogeogr. 2008, 35, 450–463. [Google Scholar] [CrossRef]
  50. Sanmartín, I. Dispersal vs vicariance in the mediterranean: Historical biogeography of the Paleartic Pachydeminae (Coleoptera, Scarabeodidea). J. Biogeog. 2003, 30, 1883–1897. [Google Scholar] [CrossRef] [Green Version]
  51. De Giuli, C.; Masini, F.; Torre, D. Island endemism in the Eastern Mediterranean mammalian paleofaunas patterns in the Gargano paleo-arcipelago. Atti Accad. Naz. Lin. 1990, 85, 247–262. [Google Scholar]
  52. Kaiser, K. The climate of Europe during the Quaternary Ice Age. In Quaternary Geology and Climate; Wright, H.E., Jr., Ed.; National Academy of Sciences: Washington, DC, USA, 1969. [Google Scholar]
  53. Gridelli, E. IL problema delle specie a diffusione attuale transadriatica con particolare riguardo ai Coleotteri. Ital. J. Zool. 1950, 17, 421–441. [Google Scholar]
Figure 1. Map showing the geographical location of the Tuber magnatum samples analyzed. Populations are indicated with circles and numbered as in Table 1.
Diversity 12 00044 g001
Figure 2. Mantel correlation between the genetic and geographic distances.
Diversity 12 00044 g002
Figure 3. Bayesian analysis of genetic structure. (A) Plot of the ancestry coefficients of each single individual obtained with STRUCTURE based on admixture model and correlated allele frequencies. Each K is represented by a different color. Populations are indicated below the figure and their geographic origin above. (B) Spatial interpolation of population structure inferred for K = 4. Black dots represent the samples locations. The four K groups are represented by green, yellow, red and blue color gradients.
Diversity 12 00044 g003
Figure 4. TESS analysis considering a no-admixture model. (A) Values of DIC in relation to the values of K. (B) Bar plots. Each individual is represented by vertical columns and the proportions of each K are represented by different colors. Populations and their geographic origin are given below and above the figure, respectively.
Diversity 12 00044 g004
Table 1. Tuber magnatum samples considered in this study.
Population No.Population Name (Sampling Location)LocalitySample Size*Mean No. of Alleles**Expected Heterozygosity**Allelic Richness**
1Valle del CratiItaly (Calabria)31.5 ± 0.190.22 ± 0.08ND++
2Potenza Italy (Basilicata)14 (12)2.9 ± 0.350.37 ± 0.061.81 ± 0.15
3Benevento, AvellinoItaly (Campania)(5)2.3 ± 0.370.39 ± 0.092.05 ± 0.29
4Isernia, CampobassoItaly (Molise)(16)3.4 ± 0.530.56 ± 0.062.27 ± 0.18
5AgnoneItaly (Molise)(10)3.4 ± 0.730.46 ± 0.112.21 ± 0.33
6Castel del GiudiceItaly (Molise)(16)2.9 ± 0.480.42 ± 0.091.95 ± 0.23
7Ateleta, SP. AvellanaItaly (Abruzzo-Molise)36 (18)4.6 ± 0.890.50 ± 0.102.17 ± 0.26
8Roio del SangroItaly (Abruzzo-Molise)(10)2.9 ± 0.480.41 ± 0.091.98 ± 0.23
9Quadri, RoselloItaly (Abruzzo)(14)2.9 ± 0.580.44 ± 0.112.04 ± 0.27
10Valle RovetoItaly (Abruzzo)(7)2.3 ± 0.410.34 ± 0.091.83 ± 0.25
11ChietiItaly (Abruzzo)(5)2.3 ± 0.410.37 ± 0.122.08 ± 0.35
12Ascoli PicenoItaly (Marche)(10)2.8 ± 0.560.37 ± 0.111.92 ± 0.30
13MontecastrilliItaly (Umbria)(9)2.8 ± 0.590.42 ± 0.102.06 ± 0.29
14FabroItaly (Umbria)(11)2.8 ± 0.410.42 ± 0.071.96 ± 0.21
15Appennino umbroItaly (Umbria)(9)2.4 ± 0.500.36 ± 0.101.85 ± 0.27
16GubbioItaly (Umbria)(25)3.8 ± 0.750.45 ± 0.091.97 ± 0.22
17Città di CastelloItaly (Umbria)(12)2.9 ± 0.690.39 ± 0.101.93 ± 0.28
18MontemaggioreItaly (Umbria)(12)2.3 ± 0.530.29 ± 0.111.68 ± 0.27
19PietralungaItaly (Umbria)(7)2.4 ± 0.420.36 ± 0.101.92 ± 0.28
20FirenzeItaly (Toscana)(32)4.1 ± 0.900.47 ± 0.082.04 ± 0.21
21Val di ZenaItaly (Emilia-Romagna)(10)2.9 ± 0.580.43 ± 0.102.02 ± 0.27
22PianoroItaly (Emilia-Romagna)(9)2.5 ± 0.530.38 ± 0.111.94 ± 0.20
23AlbaItaly (Piemonte)(7)2.8 ± 0.490.42 ± 0.092.12 ± 0.29
24AstiItaly (Piemonte)(9)2.5 ± 0.420.40 ± 0.101.98 ± 0.27
25LangheItaly (Piemonte)(15)3.0 ± 0.760.42 ± 0.112.01 ± 0.30
26PaviaItaly (Lombardia)(11)2.4 ± 0.420.36 ± 0.101.85 ± 0.26
27IstriaCroatia-Slovenia(17)3.0 ± 0.600.41 ± 0.101.93 ± 0.25
28Southern HungaryHungary143.1 ± 0.740.37 ± 0.111.91 ± 0.30
29ŠabacSerbia62.1 ± 0.440.28 ± 0.111.78 ± 0.31
30ValjevoSerbia72.0 ± 0.330.33 ± 0.101.66 ± 0.27
31AninaRomania31.4 ± 0.180.17 ± 0.08ND++
32CraiovaRomania223.6 ± 0.840.44 ± 0.122.04 ± 0.31
33OryahovoBulgaria62.0 ± 0.270.39 ± 0.091.89 ± 0.22
34RazgradBulgaria61.9 ± 0.400.29 ± 0.111.75 ± 0.32
35KastoriaGreece183.6 ± 0.710.47 ± 0.112.13 ± 0.28
36ElatochoriGreece62.5 ± 0.460.40 ± 0.102.15 ± 0.33
MeanItaly-12.46 ± 1.522.84 ± 0.120.40 ± 0.011.99 ± 0.03
MeanPannonia/Balkans-10.50 ± 2.092.52 ± 0.240.36 ± 0.031.92 ± 0.05
MeanTotal-11.92 ± 1.232.75 ± 0.110.39 ± 0.011.97 ± 0.02
* Samples derived from the dataset of Rubini et al. [4] are indicated in parentheses. ** Standard errors of the means are reported. ND++: Not determined due to the small sample size and presence of missing data.

