Article

Current State and Drivers of Arable Plant Diversity in Conventionally Managed Farmland in Northwest Germany

by
Alexander Wietzke
1,*,
Clara-Sophie van Waveren
2,
Erwin Bergmeier
3,
Stefan Meyer
1 and
Christoph Leuschner
1
1
Department of Plant Ecology and Ecosystems Research, University of Goettingen, Untere Karspüle 2, 37073 Goettingen, Germany
2
Thünen Institute of Biodiversity, Bundesallee 65, 38116 Braunschweig, Germany
3
Department of Vegetation and Phytodiversity Analysis, University of Goettingen, Untere Karspüle 1a, 37073 Goettingen, Germany
*
Author to whom correspondence should be addressed.
Diversity 2020, 12(12), 469; https://doi.org/10.3390/d12120469
Submission received: 23 September 2020 / Revised: 8 December 2020 / Accepted: 9 December 2020 / Published: 11 December 2020
(This article belongs to the Section Biodiversity Loss & Dynamics)

Abstract

:
Agricultural intensification has led to dramatic diversity losses and impoverishment of the arable vegetation in much of Europe. We analyzed the status of farmland phytodiversity and its determinants in 2016 in northwest Germany by surveying 200 conventionally managed fields cultivated with seven crops. The study was combined with an analysis of edaphic (soil yield potential), agronomic (crop cover, fertilizer and herbicide use) and landscape factors (adjacent habitats). In total, we recorded 150 non-crop plant species, many of them nitrophilous generalist species, while species of conservation value were almost completely absent. According to a post-hoc pairwise comparison of the mixed model results, the cultivation of rapeseed positively influenced non-crop plant species richness as compared to winter cereals (wheat, barley, rye and triticale; data pooled), maize or potato. The presence of grassy strips and ditch margins adjacent to fields increased plant richness at field edges presumably through spillover effects. In the field interiors, median values of non-crop plant richness and cover were only 2 species and 0.5% cover across all crops, and at the field edges 11 species and 4% cover. Agricultural intensification has wiped out non-crop plant life nearly completely from conventionally managed farmland, except for a narrow, floristically impoverished field edge strip.

1. Introduction

In recent decades, agricultural production has been greatly intensified in industrialized countries, with the consequence of dramatic biodiversity losses [1,2,3]. Increases in crop yield tend to correlate with decreases in farmland species richness, both in plants and various animal groups [1,4,5]. Plot-level plant species richness in arable fields has decreased by about 70% since the 1950s/1960s in central Germany with accompanying reductions in arable plant cover and regional species pool size [6]. A collapse of farmland phytodiversity has also been documented in many other regions of central and western Europe (e.g., [7,8,9]). Since arable plants provide important functions, such as nutrient retention and erosion reduction in fallow periods as well as the provisioning of food for herbivorous animals and insects (including pollinators), the drastic decline of plant cover and diversity in contemporary arable fields threatens farmland biodiversity and ecosystem functioning [10,11,12]. The large decrease in insect biomass [13] and farmland bird abundance that has been observed in the agricultural landscapes of Europe in recent times [4] can be related to reduced plant resources such as pollen, nectar and seed [12], among other drivers. Continued systematic vegetation monitoring in the farmland is, thus, a prerequisite for measures to halt biodiversity erosion and to maintain at least basic ecosystem functions, such as crop pollination and erosion control, in intensively used agricultural landscapes for the benefit of farmers and the society as a whole [10,11,14].
The main determinants of arable plant diversity and composition are environmental factors (precipitation, temperature, soil pH, soil moisture and soil fertility), the type of cultivated crop (notably summer vs. winter crop) and crop rotation, the associated type of management (application of herbicides and fertilizers and the tillage regime) and the location in the field interior or at the edge [15,16,17]. Management intensification with the intensive use of herbicides and increased competition with denser, shading crop stands due to high fertilizer input has been identified as a key driver of the decline in arable plant diversity [1,17,18]. In many central European farmland regions, the intensively managed field interior nowadays harbors only very few plant species at low cover, while slightly more plants typically persist at the field edges with somewhat lower management intensity and possible spillover from adjacent habitats [8,18].
The pan-European reviews of Storkey et al. [3] and Richner et al. [19] revealed that the plant diversity losses concerned chiefly arable plant species and communities associated with traditional farming practices and from stony calcareous or acidic soils that are less suitable for intensive agriculture. In contrast, increases in absolute or relative terms have been observed in a few arable grasses, neophytes and plants with traits combining high nutrient demand, herbicide resistance and anemochory [19]. While some successful species are herbicide-tolerant (e.g., Alopecurus myosuroides; [20]), others are able to escape herbicide treatment through a broad range of germination temperatures and high phenotypic plasticity [17,21]. As a consequence, the once existing variation in arable vegetation reflecting different crop types and along gradients in climate and soil fertility has largely disappeared [9,22]. Existing synopses of the arable vegetation of central Europe consider farmland plant diversity up to the 1970/1980s (e.g., [23,24,25]) and may serve as references to vegetation change since then.
As about 95% of the arable land in central Europe is managed conventionally [26], modern farmland vegetation surveys have to refer to all kinds of fields and especially the conventionally managed ones, if they are to represent the majority of the cropland. Several recent studies investigated the vegetation of intensively managed fields (e.g., [8,17,27]), but mostly focused on a single crop or a few crops, or different crop species were pooled. Numerous studies addressed wheat fields in central Europe, less often maize, triticale and/or rapeseed, or compared conventional and organic fields for a given crop [27,28], whereas studies on the species richness, composition and vegetation cover of a wider range of conventionally managed crop species in a landscape context are surprisingly scarce [27]. Hence, the status quo of arable plant diversity in central Europe in its dependence on agronomic and environmental factors is insufficiently known to date.
We conducted a survey of arable plant diversity and species composition in an intensively managed farmland region in northwest Germany in fields of seven abundant crop species, including cereal (wheat, barley, rye and triticale), oil (rapeseed) and root crops (maize and potato). This survey was combined with an analysis of edaphic (soil yield potential), agronomic (crop cover, herbicide and fertilizer use) and landscape factors (type of adjacent habitat), which might influence species richness and composition. We tested the following hypotheses: (i) decades of intensive agriculture have resulted in greatly impoverished arable plant communities with much the same composition across crop types and related management regimes (e.g., autumn-sown vs. spring-sown); (ii) the field edges are richer than the field interior, partly due to enrichment by plants from neighboring habitats, while the interior is nowadays nearly free of weeds; (iii) non-crop plant species richness is more influenced by agricultural management (crop cover, herbicide treatment intensity) than by the nature of adjacent habitats and soil factors.

2. Materials and Methods
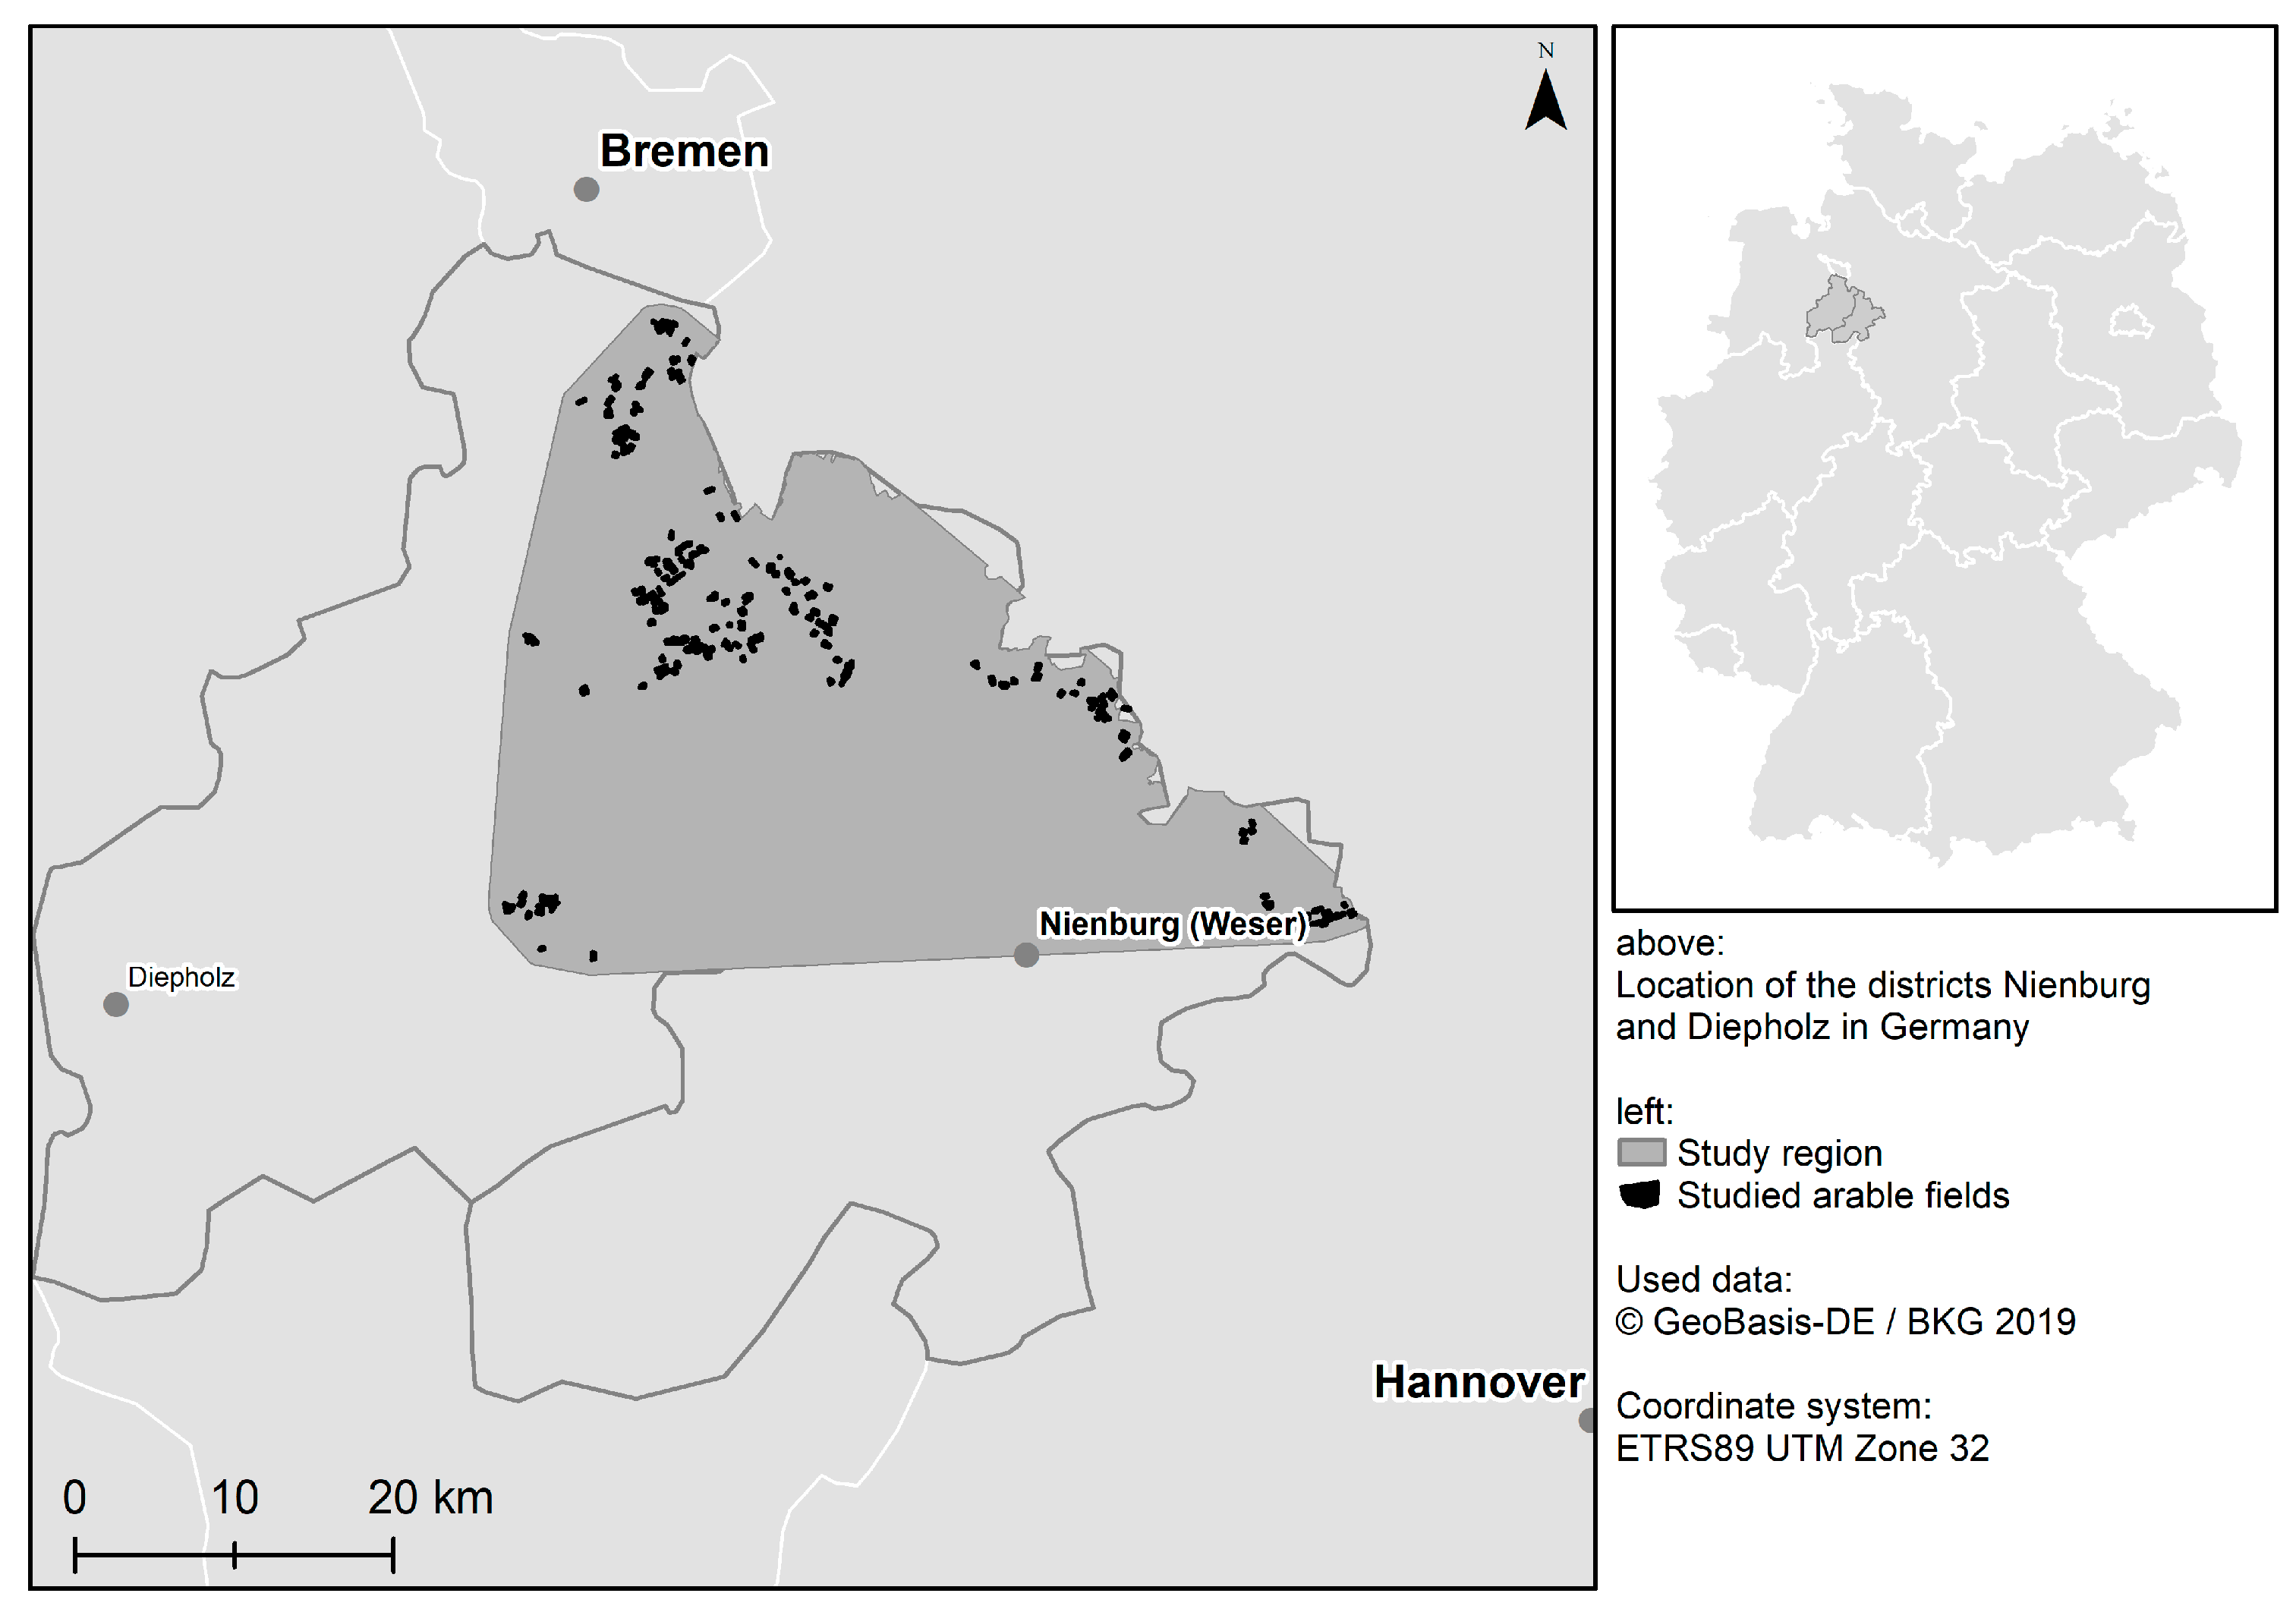
2.1. Study Region

The study was carried out in the north of the districts of Nienburg (centroid: 52°36′32.5334″ N, 9°649.7118′ E) and Diepholz (52°43′41.4940″ N, 8°42′4.1629″ E), Lower Saxony, northwest Germany (Figure 1). The study region is part of the landscapes ‘Ems-Hunte-Geest and Dümmer-Geestniederung’ and ‘Weser-Aller-Flachland’ [29].
Situated in the northern lowland (shaped by the Saale glaciation), the current land cover is predominantly arable land (56.2%), followed by forest (14.5%) and permanent agricultural grassland (12.4%). About 97% of the arable land is managed conventionally. Landscape elements without intensive agricultural management such as grass strips, ditches and hedges cover about 2.4% of the area (Figure S1 and File S1). Annual average precipitation and mean temperature ranges (2013–2017) are 662–684 mm and 10.1–10.3 °C, respectively [30]. The soils in the studied fields developed mostly from sandy to loamy Cambisols or Luvisols, and in a few cases also from Podsols or Gleysols [31,32], depending on the sand content and groundwater level. Soil pH of the studied fields is acidic to neutral (4.1 to 6.7). Summer water deficits may occur more often in arable soils with higher sand content, while they are rare in the loamier soils. According to the assessment by the Chamber of Agriculture, the soils in the study region have a low to medium yield potential. The agricultural yield score (German Ackerwertzahl index), with a range from 1 (extremely poor) to 100 (extremely rich), varies between 20 and 69 in our fields. The altitude of the surveyed arable fields differed only slightly (between 5 to 58 m a.s.l.).
Fifteen farmers from the two districts willing to grant access to their fields were included in the study. Thus, field selection was not fully random, but determined in the first instance by the location of the selected farms and the need to identify a sufficient number of replicate fields of a crop type. As far as possible, the resulting 200 fields (average field size: 5.4 ha) were evenly distributed over the study region, which covered an area of approximately 1300 km2 (Figure 1).

2.2. Vegetation Survey

Herbaceous plant species composition and cover (in percent) of conventionally managed arable fields were studied in relevés of 100 m2 (50 m × 2 m) between the end of May and August 2016. The percental cover of the cultivated crop species was estimated separately from the cover of the segetal vegetation. We chose seven important crop species that together covered almost 90% of the arable land in the study region in 2016: winter wheat (24% of 73,790 ha of arable land in the study region), maize (23%), winter rapeseed (12%), winter barley (11%), winter rye (9%), winter triticale (5%) and potato (5%; Figure S2). The relevés were placed either at the field edge (edge plots, including the outermost furrow of the field) or in the interior at least 20 m distant from the edge. In total, 270 plots were investigated in the 200 studied fields: 200 edge plots (30 plots each in barley, maize, rapeseed, rye and wheat fields, 28 in potato and 22 in triticale fields) and 70 interior plots (10 per crop type). Preliminary studies suggested a smaller number of replicates of interior plots to be sufficient to cover the greatly reduced number of species present. In line with this, Wietzke and Leuschner [33] showed that a sampling effort in the field interior with more than 10 replicates has only a negligible effect on the observed plot-level species richness.
Plot coordinates were determined by GPS (Garmin GPSMAP 64s, Garmin, Olathe, KS, USA). The type of habitat adjacent to edge plots was recorded in the categories hedge, grass strip (usually found along agricultural access tracks and between arable fields), ditch margin or arable field (no other habitat between two fields), in order to analyze possible neighborhood effects on the field vegetation. In addition, 63 plots in habitats directly adjacent to the fields were sampled to provide information on the local non-arable species pool, which would allow assessing spillover effects into the fields (22 hedges:plot size 2 m × 25 m; 21 ditch margins:plot size 2 m × 8 m; 20 grass strips:plot size 1 m × 16 m). The studied hedge plots commonly included a narrow herbaceous fringe of about 0.5 m width. As the adjacent habitats border directly to the fields, some are irregularly disturbed by agricultural machinery or through tillage. Plant species names follow Buttler [34]. Raw vegetation data are presented in Table S1 in the Electronic Supplementary Materials.

2.3. Abiotic and Management Data

The following management-related data were obtained through inquiry of 14 farmers (no data available of the 15th) for the agricultural business year 2015/2016 (post-harvest 2015–harvest 2016): cultivated crops, amount of fertilizers (N, P, K) and herbicides used and soil pH. Information on the soil yield potential (Ackerwertzahl) and soil type were retrieved by intersecting soil (scale 1:1,000,000; [31]) and land-use maps (scale 1:5000; [32]) using ArcMap [35]. Information on the frequency of application and dose of herbicides (‘Herbicide Intensity Index’) were used to calculate the Standardized Treatment Index (STI after [36]). STI values were calculated for every field in relative terms (herbicide amount applied relative to the amount permitted). The maximum permitted amount of herbicides was obtained from the Crop Protection Manager [37]. If the farmer used different herbicides per field within the agricultural business year 2015/2016, the index was calculated by summing up the STI values of the different herbicides (see Table S1 for raw data on abiotic and management variables).

2.4. Statistical Analyses

For the analyses, estimates of total herbaceous vegetation cover in a plot (in %) considered all plants in the herb layer, except the cultivated crop species. Plant species richness data were grouped in (a) all herbaceous plants recorded (excluding tree/shrub seedlings, crops and a few plants not identified to the species level); (b) plant species with close affinity to arable fields (according to Hofmeister and Garve [23]; hereafter termed ‘arable plants sensu stricto’); (c) arable plant species endangered in Lower Saxony [38]; and (d) high-nature-value (HNV) species according to German Federal Agency for Nature Conservation [39] (Table S2). Group (b), arable plants sensu stricto [23], comprise taxa with habitat preference in arable fields. They are mostly widespread species, though partly in decline in central Europe and elsewhere, and many also occur in other anthropogenic, episodically disturbed habitats. Group (d), HNV species, are defined as taxa that are frequently associated with, and thus functioning as indicators of, habitats of increased plant diversity and nature value. For example, the presence of 4–5 HNV species stands for farmland of a moderate nature value, 6–7 species for high and 8 or more species for very high nature value. Fields with three or fewer HNV species were not considered as high-nature-value farmland [39].
Statistical analyses and data visualization were conducted with R 3.5.1 software [40]. We excluded the variable ‘soil type’ from the analysis because soils of the studied arable fields were fairly similar and pre-analysis revealed no significant soil effect on plant diversity. Plant diversity data were analyzed with respect to α-diversity (plot-level species richness), β-diversity (between-field variation in the surveyed communities) and γ-diversity (total species pool of the study region).
Differences in herbaceous plant species richness and cover (in %) between the seven crop types were tested for significance with the Mann-Whitney U test for pairwise comparisons and analyzed separately for field edge and interior plots. In order to unravel the relative influence of biotic-, environmental- and management-related factors on species richness at the plot-level, we calculated a negative binomial generalized mixed effects model [41], that is insensitive to the imbalance in repetitions in interior and edge plots, which affects the standard errors. We used crop species, adjacent habitat, soil yield potential, Herbicide Intensity Index, crop cover and total nitrogen input as fixed factors and farm as a random factor. By including the field interior plots into the explanatory variable ‘adjacent habitat’ (as ‘Field interior,’ i.e., without contact to an adjacent habitat), this variable took into account both the effect of different adjacent habitats (field edge plots adjacent to (i) grass strips; (ii) ditch margins; (iii) hedges; or (iv) other arable fields) and the influence of location in the field (field interior vs. field edge plots). As we expected the invasion of plants from adjacent habitats into the field edge, this allowed for a comparison of relative spill-over effects between the four different field edge-adjacent habitat combinations. Since the autumn-sown cereals wheat, barley, rye and triticale are cultivated in a similar way and have rather similar stand structures, these four winter cereals were pooled (variable ‘cereals’) in order to save degrees of freedom in the analysis. Due to missing information on fertilizer and herbicide treatment, 15 plots (related to 11 fields) were excluded from the analyses of the mixed effects model (eight field edge and three field interior plots of potato, one field edge plot of each maize, rapeseed and wheat and one field interior plot in maize). The data of one of the 15 farms could therefore not be included in this analysis. Due to multicollinearity (significant Spearman’s rank correlation coefficients ≥0.39), we introduced total nitrogen input instead of potassium and phosphorus input, and soil yield potential instead of soil pH in the analysis. Finally, we tested the significance of the response variables by a post-hoc analysis-of-variance (Type II Wald chi-square test) and a post-hoc pairwise comparison of categorial variables (Tukey [42]). Model structure and further statistical results can be found in Table S3 in the Electronic Supplementary Materials.
In an attempt to assign the species assemblages found in the studied crop types and in different locations in the field to phytosociological units (classes, orders, alliances and associations as units with increasing ecological specialization in the hierarchical phytosociological system), we calculated the median numbers of plant species present in the assemblages that were diagnostic for these units [22,24]. We expanded the vegetation analysis from the arable fields to the directly adjacent habitats (grass strips, ditch margins, hedges) and plotted Venn diagrams [43] to express the percent overlap in species pools. The floristic similarity between fields for edge and interior plots was determined with the Sørensen Dissimilarity Index (package vegan [44]). This index ranges from 0 to 1; the higher the value, the more different are the compared plant communities.

3. Results

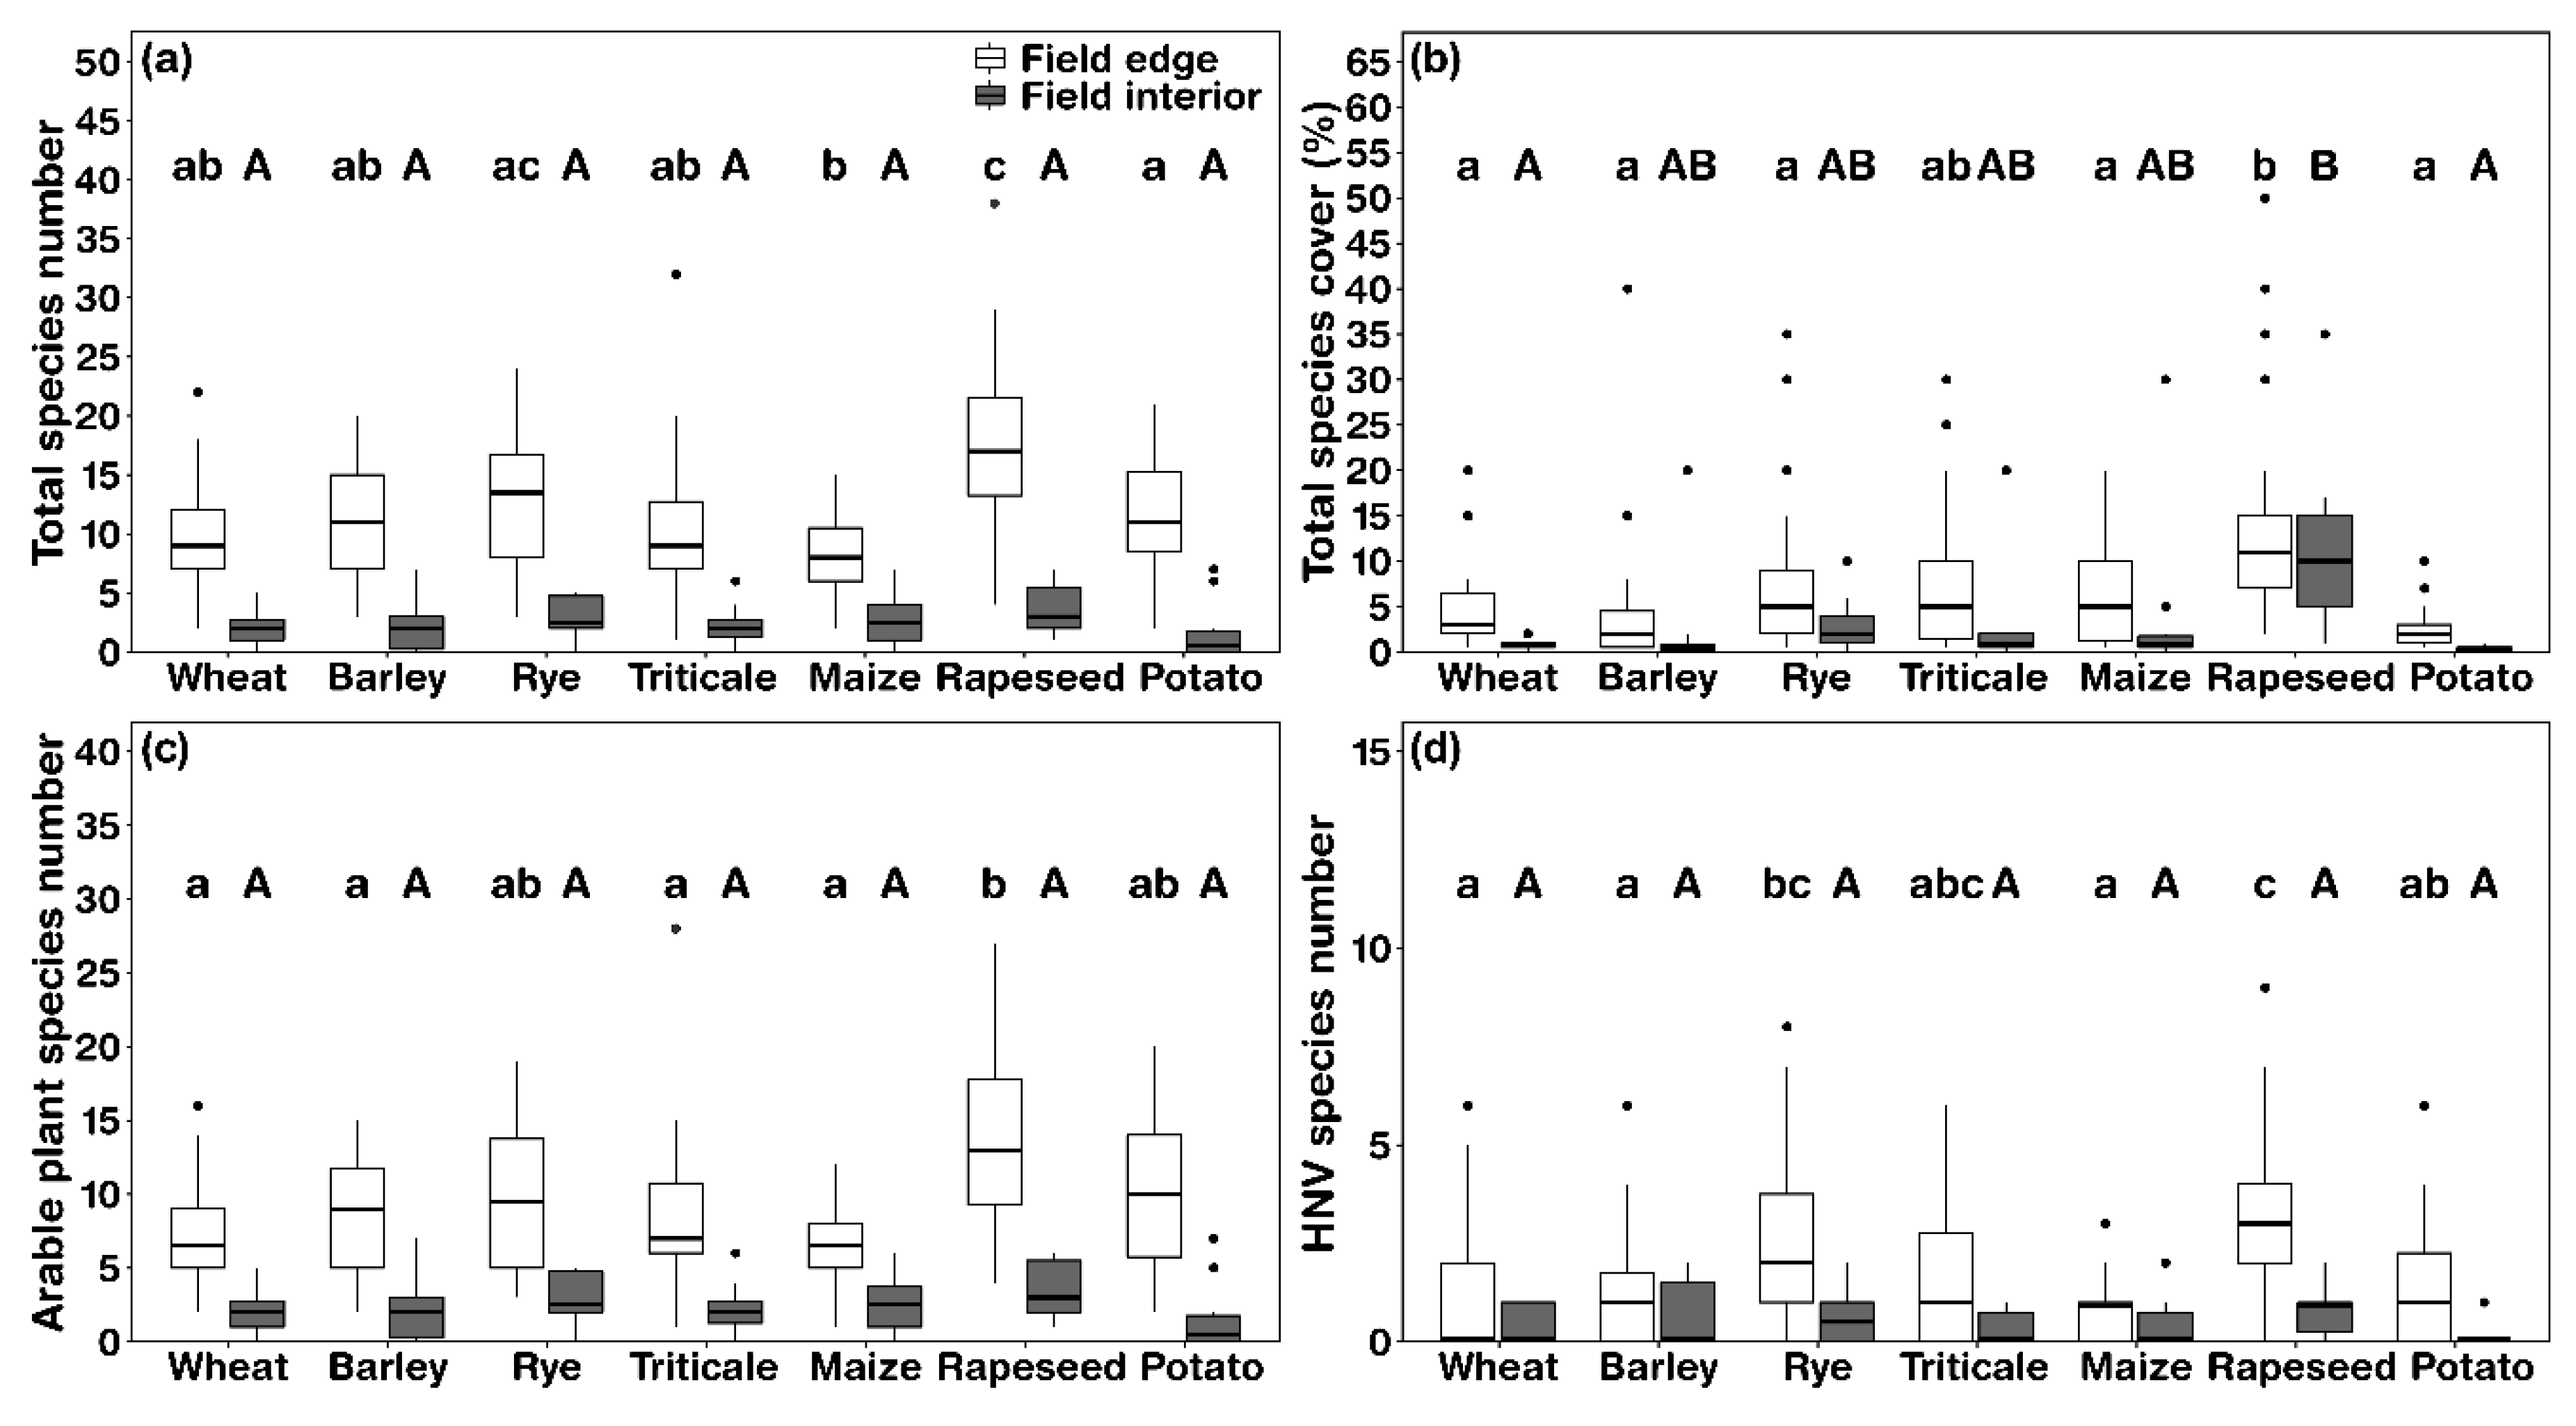
3.1. Patterns of Plant Species Richness and Cover

In total, we observed 150 herbaceous non-crop plant species in the 270 plots examined in 200 arable fields. We take this number as a minimum estimate of the present species pool in the arable fields of the study region of approximately 1300 km2. All 150 species were found at the field edges, while only 41 of them also occurred in the field interior (Table S4). Between-field variation, i.e., β-diversity, was very high (mean Sørensen Dissimilarity Index: 0.86 for interior plots [14 plots without species omitted]) and only slightly lower for edge plots (0.76). Fifty-nine of the 150 species (39%) observed in the edge plots, and 25 of the 41 species (61%) in the interior plots, were found in fewer than 3 of the 200 fields (Table S4). Median species number across all crop types in the edge plots was 11, and only 2 in the field interior plots. Among the seven crop types, the highest number of plant species was found in rapeseed field edge plots (median = 17), whereas maize showed the lowest diversity in the edge (8; Figure 2a). In field interior plots, the median diversity varied between 0 and 3 in the seven crops. The same pattern across crop types was found for the diversity of arable plants sensu stricto (Figure 2c). The number of HNV species of arable land was in general very low (median values between 0 and 3), but showed a tendency for higher values in the edge plots, especially in rapeseed and rye (Figure 2d). We found only one plant species red-listed as Vulnerable in Lower Saxony (Odontites vernus) in a single edge plot (rye).
Crop cover was very high throughout the 270 plots (median of edge plots: 90%; interior: 95%), with the lowest cover recorded for rye and triticale field edges (median: 85%, Figure S3). Non-crop plant cover was in most fields <1% in the interior (median: 0.5%, all crops pooled; Figure 2b) and reached at the field edge a median value of 4%. An exception was rapeseed with medians of 11% (edge) and 10% (interior) of the area covered by non-crop herbaceous species.

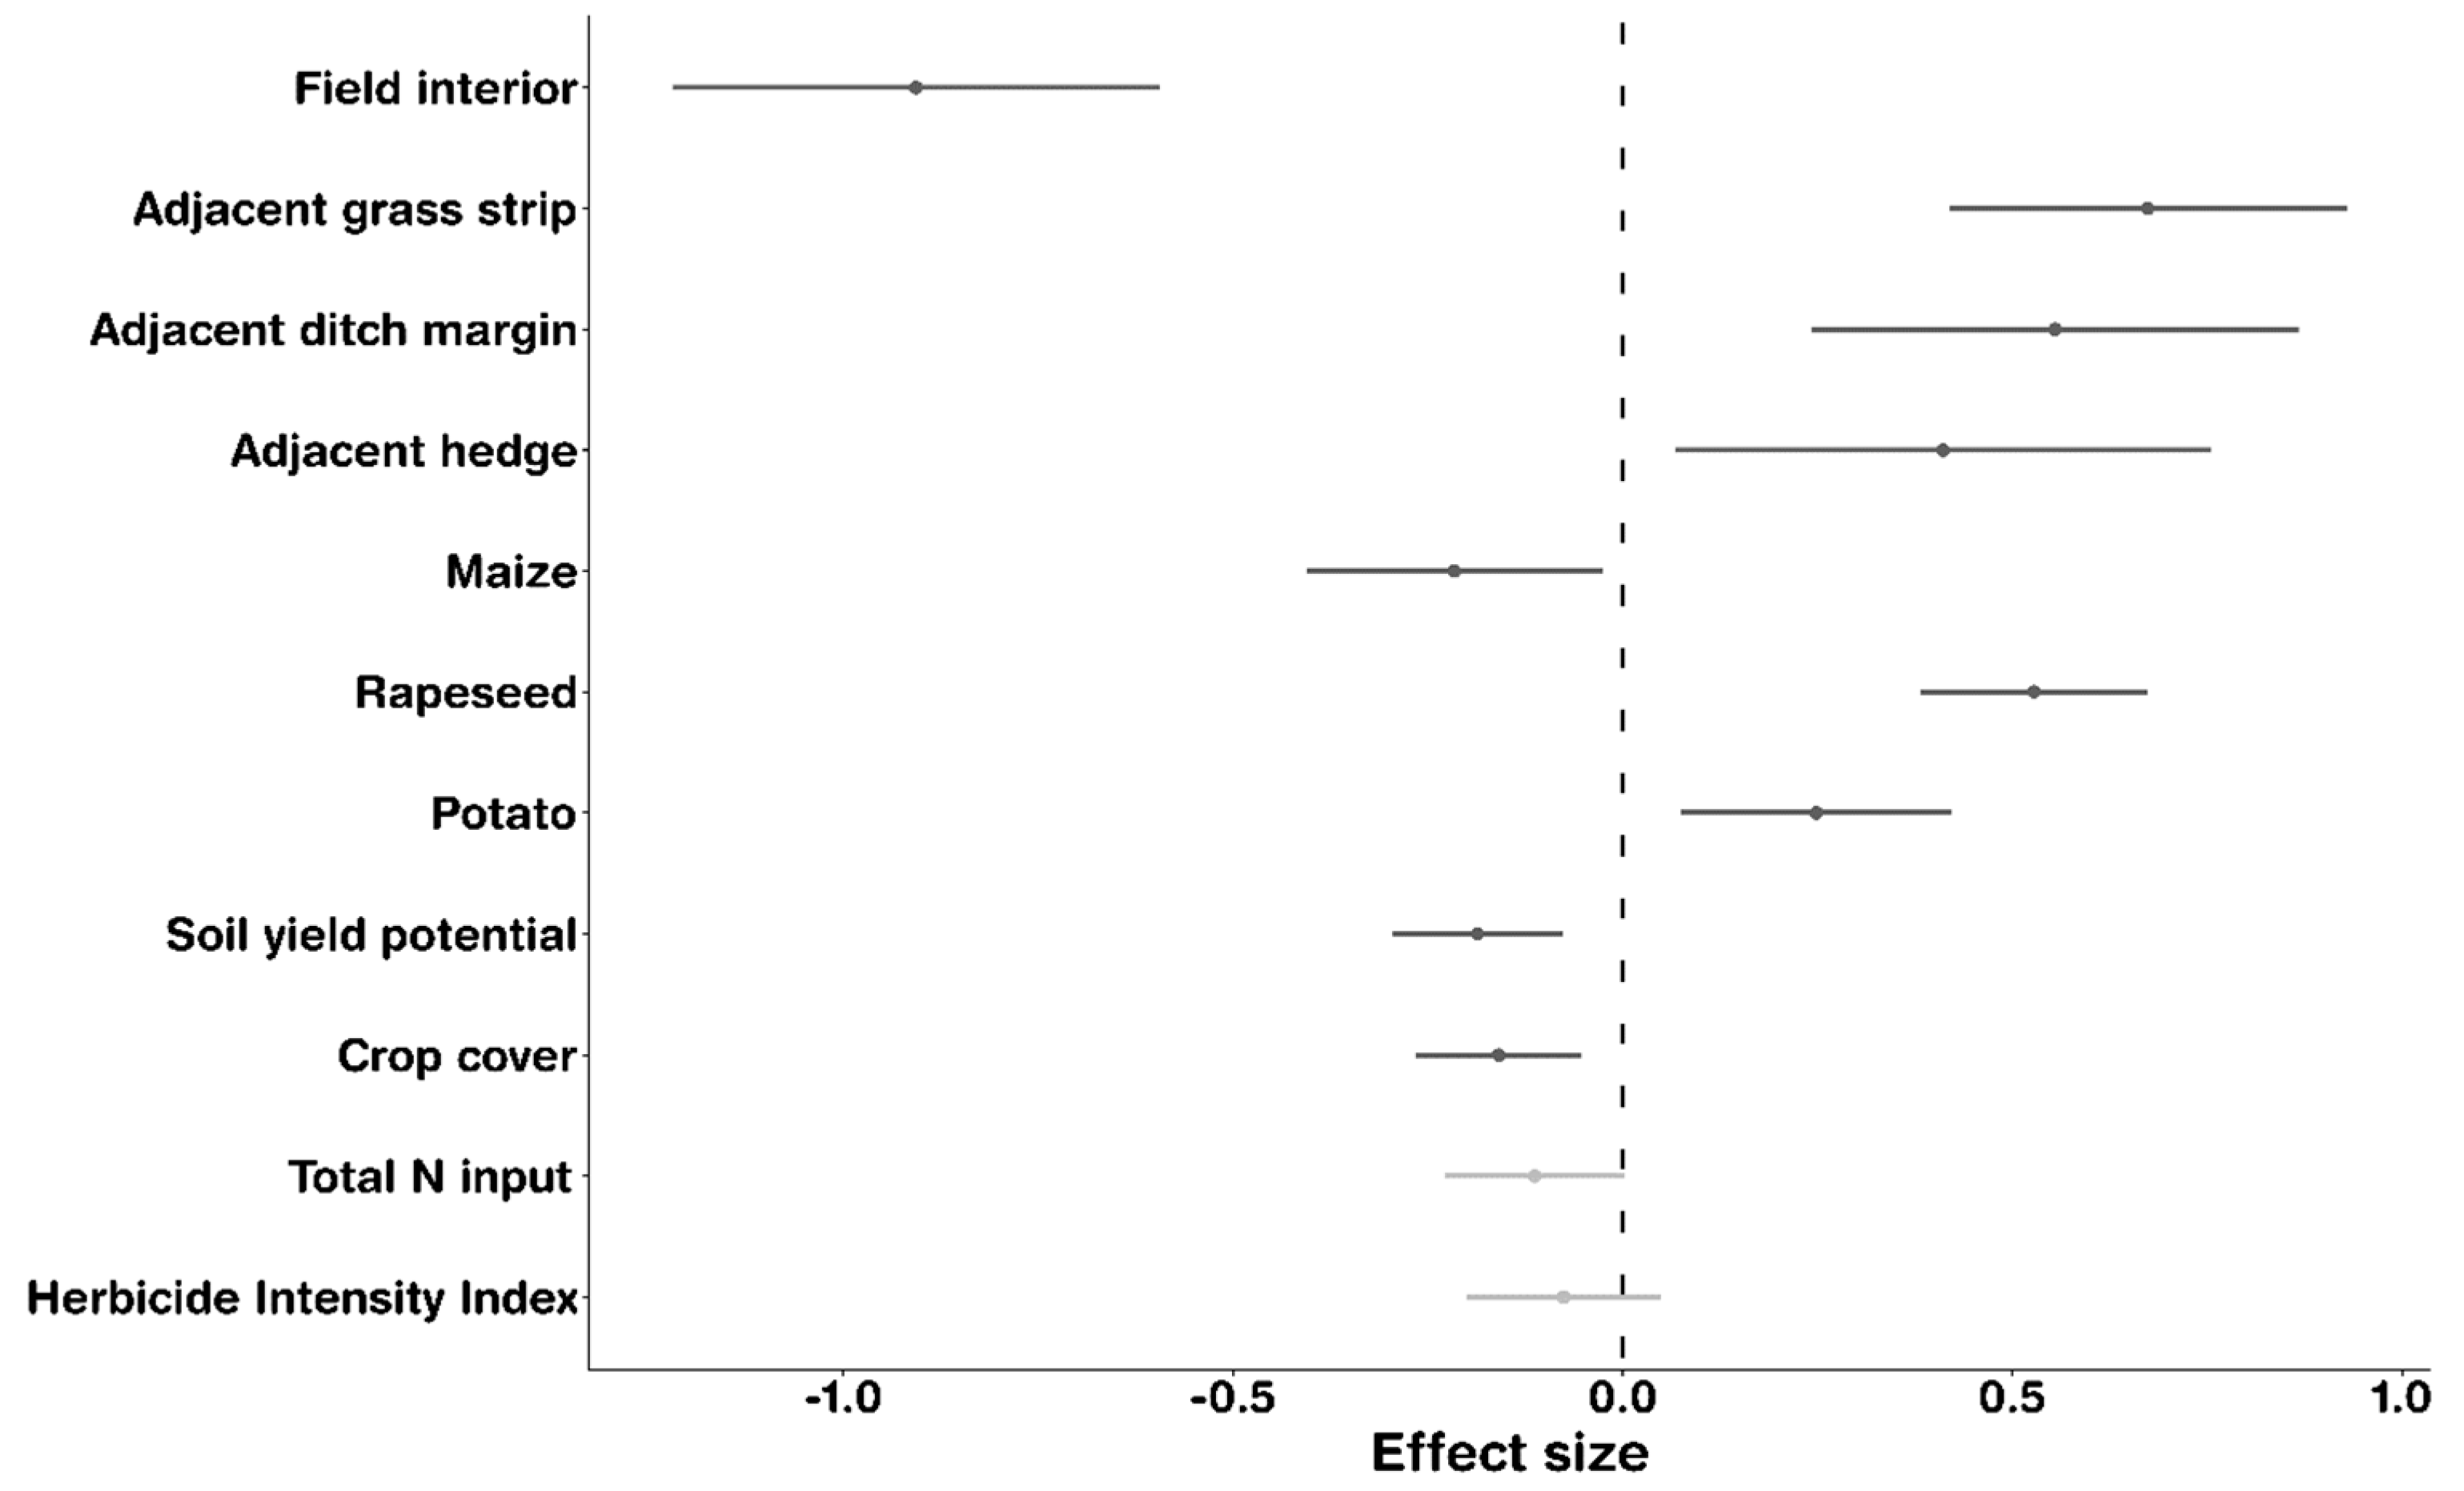
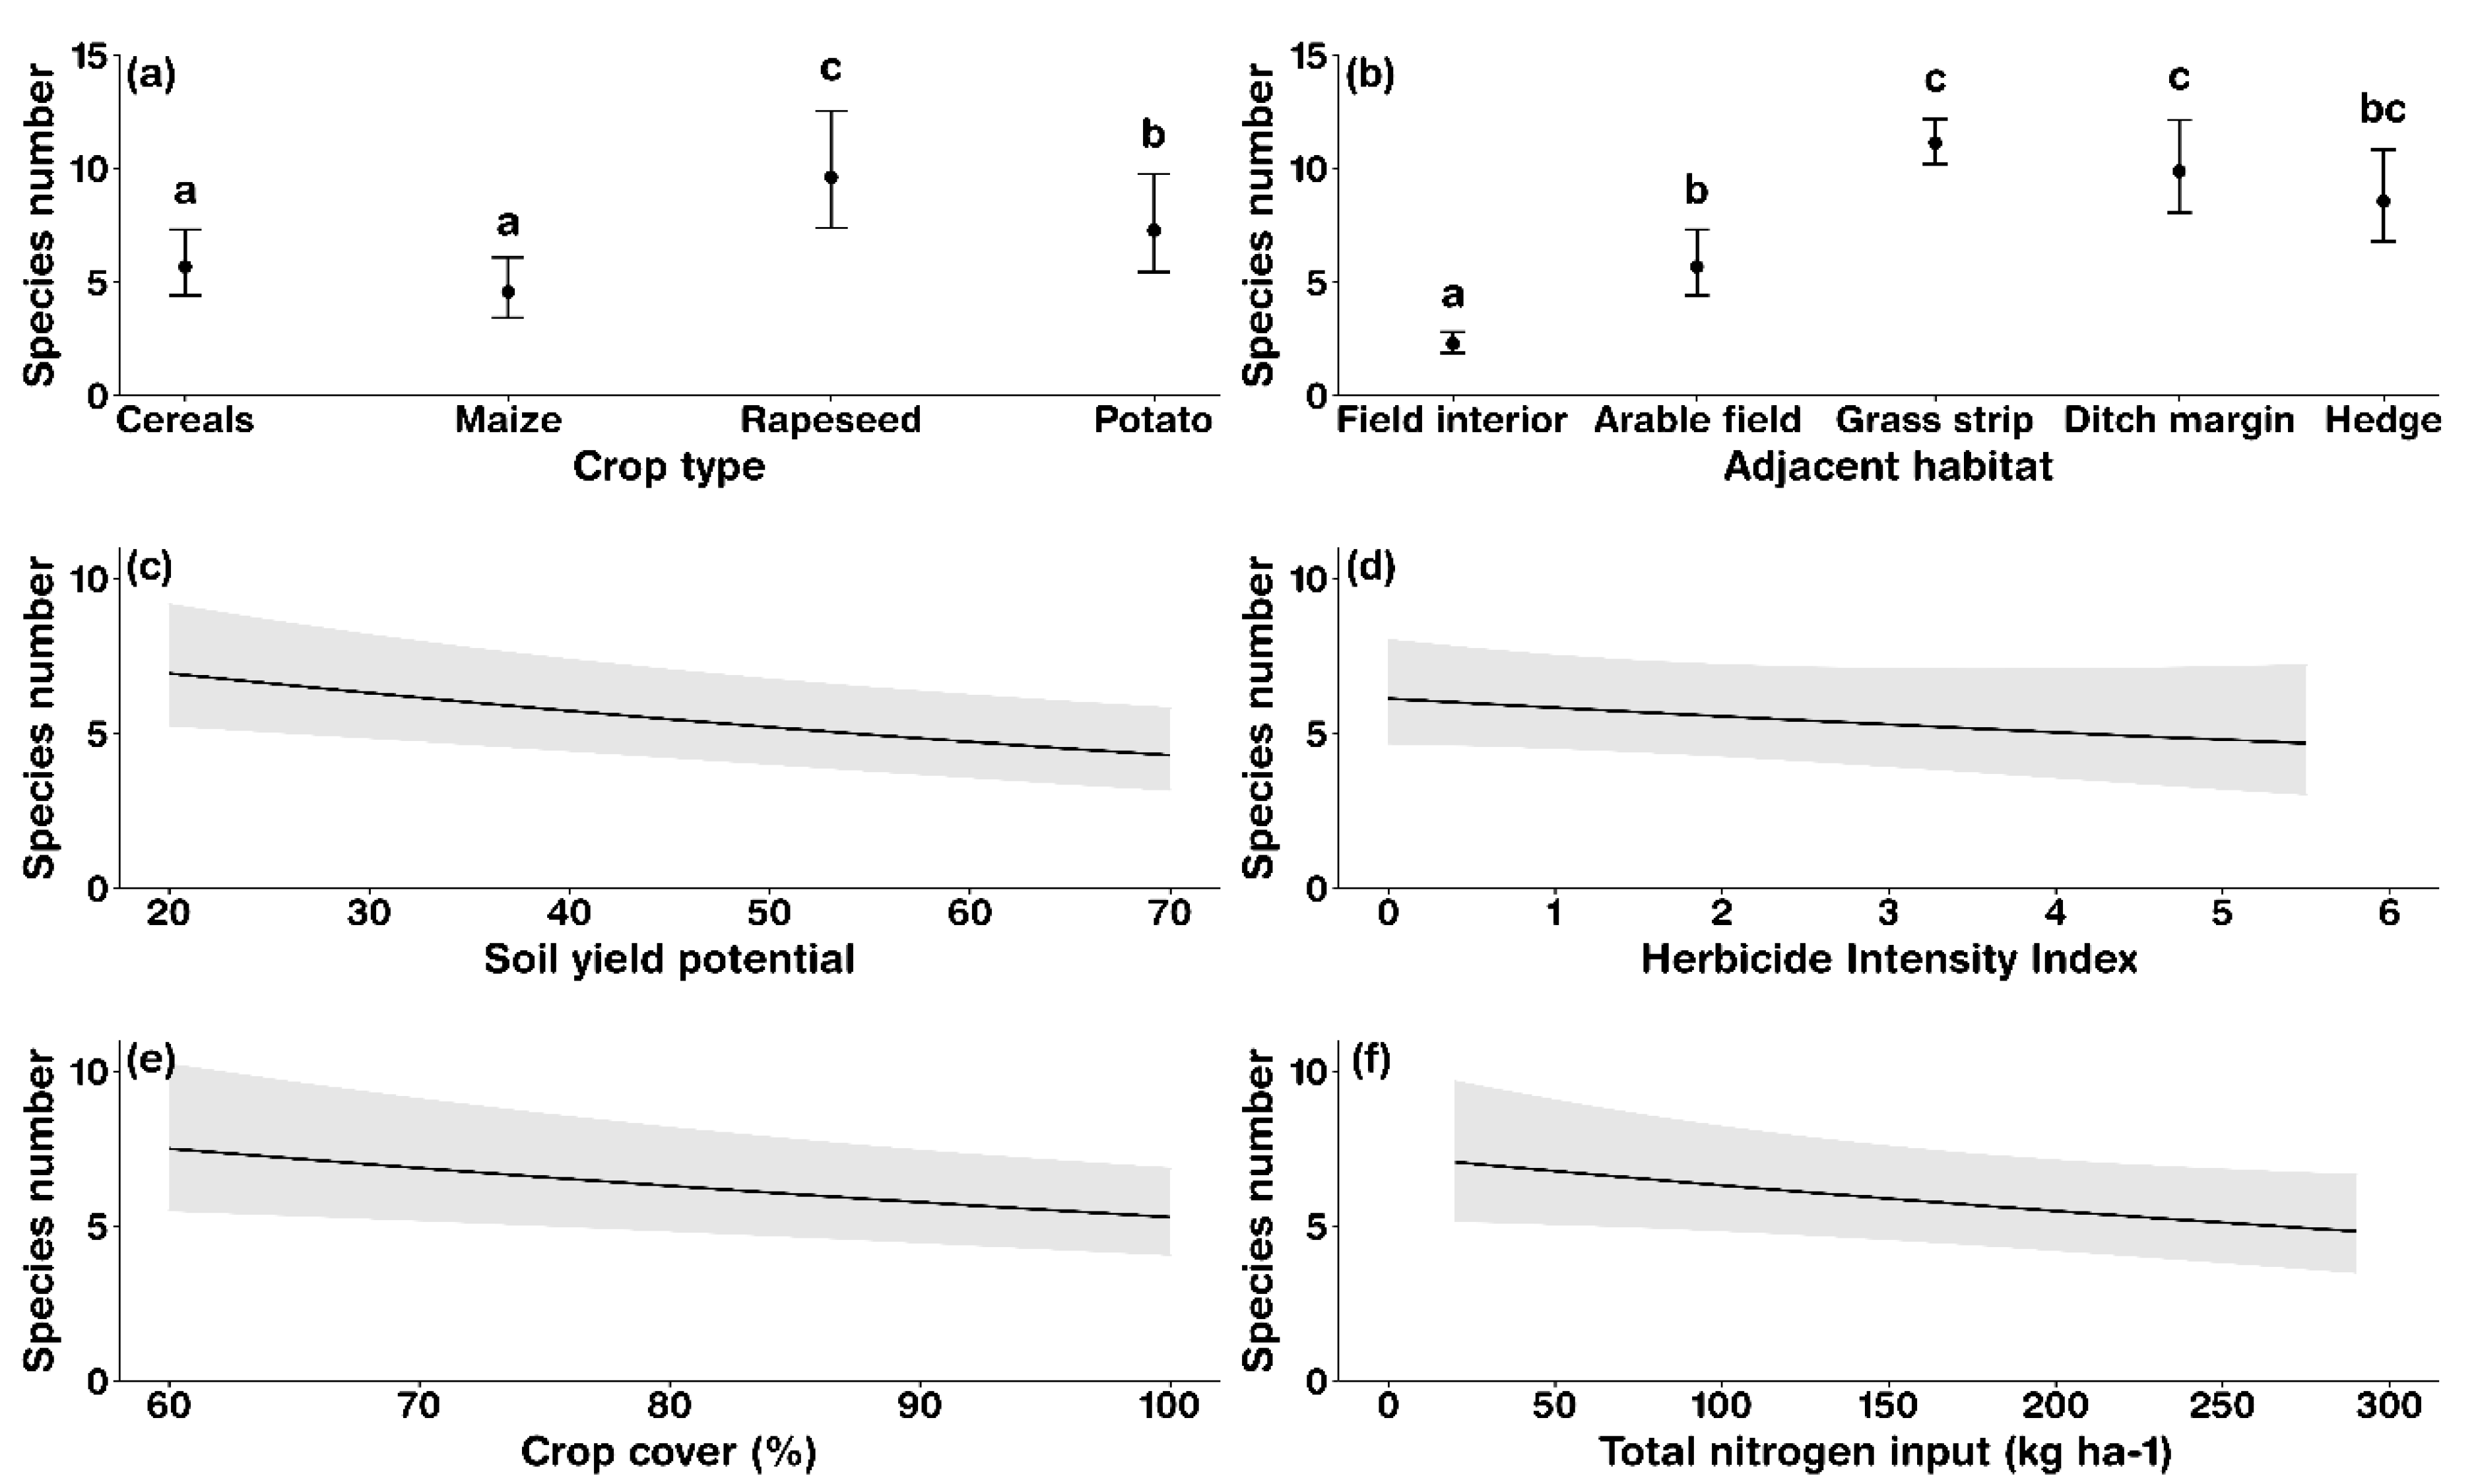
3.2. Factors Determining Arable Plant Species Richness

The generalized mixed effects model showed that plot location in the field (edge vs. interior) was the main factor determining plant diversity across all crop species (Figure 3 and Table S3). Adjacent habitat and crop type also had a positive, but smaller, effect on species richness, whereas soil and management factors had little influence (non-significant in the case of total nitrogen input and Herbicide Intensity Index). Measured against winter cereals (wheat, barley, rye and triticale pooled) as a reference, species richness increased, when rapeseed or potato were planted, while the cultivation of maize reduced diversity. In general, the effect of crop type can be considered as being mainly driven by crop-specific differences in the field edge plots, since the plant species richness of field interior plots was very similar among all crops (Figure 2; field interior and edge plots were pooled for the variable ‘crop type’ in the mixed effects model). In addition, the presence of grass strips, ditch margins and hedges next to field edge plots increased species richness in comparison to field edge plots directly bordering other arable fields. High management intensity, as indicated by high crop cover, and a higher soil yield potential led to decreased plot-level diversity (Figure 4).
Post-hoc pairwise comparisons (Tukey tests) showed that the cultivation of the dicot crops rapeseed and potato also significantly increased species richness compared to maize (Figure 4 and Table S3). However, in comparison to the respective reference levels of the mixed effects model (adjacent habitat ‘arable field’ and cultivated crop ‘cereals’), the influence of adjacent hedges or the cultivation of maize on the observed species richness was weak, since post-hoc pairwise comparisons did not show significant differences (Figure 4 and Table S3). Accordingly, pairwise comparisons with each of the four winter cereals showed a significant decrease in species richness in maize fields in only one case (rye vs. maize field edges; Figure 2). Correspondingly, the relatively weak positive influence of potato fields on species richness as compared to winter cereals (wheat, barley, rye and triticale pooled; Figure 4) is not apparent from the pairwise comparisons with each of the four winter cereals (no significant differences to potato fields, neither at the field edge nor in the interior; Figure 2). These inconclusive results can be attributed to different replicate numbers in the pairwise comparisons of the seven crop species (n = 270) and the mixed effects model (n = 255, 15 plots excluded due to missing values); they indicate a large variability of species numbers in the studied potato fields.

3.3. Variation in Community Composition

Despite a greatly impoverished arable species pool and a low species number at the plot level (α-diversity), species assemblages differed considerably between different crops. Only one species (Elymus repens) occurred in more than half of the plots (52%; edge and interior plots pooled), another seven in more than 30% (in decreasing order Galium aparine, Dactylis glomerata, Matricaria chamomilla, Fallopia convolvulus, Viola arvensis, Polygonum aviculare, Bromus sterilis; Table S5). While 34 herbaceous species were found in all seven crops, 23 were exclusively observed in winter cereals (wheat, barley, rye, triticale), and 16 only in rapeseed (Figure S4). A few species showed a preference for a certain crop, notably Echinochloa crus-galli for the edge of maize and potato fields (total species occurrences at the field edge: ≥9 for maize and potato vs. ≤1 for the other crop species), and Viola arvensis for the edge and interior of rapeseed fields (total species occurrences at the field edge and interior: 29 and 10 for rapeseed vs. ≤15 and ≤2 for the other crop species; Table S5). Yet, the surveyed assemblages in the seven different crop types could not be assigned to defined plant associations because diagnostic species were almost absent (0 to 2; Table 1); diagnostic species of alliances and orders were also commonly underrepresented.
Of the 150 herbaceous plant species found in the fields, 112 (i.e., 74.7%) occurred also in the directly adjacent habitats; 69 of these overlapping species (61.6%) were arable plant species sensu stricto (Table S6). The fraction of species that overlapped between the field edge and adjacent habitats was largest for the grass strips (50.7%, 76 of 150 species); it was 42.7% (64 of 150 species) for ditch margins and also for hedges (Figure 5). These three main neighboring habitats contained 51 species that were not found in the fields. Thus, the adjacent habitats were about as species-rich as the field edges (163 and 150 species, respectively), with roughly two-thirds of the species overlapping.

4. Discussion

4.1. Current State of Phytodiversity in Conventionally Managed Farmland

With a median α-diversity of two species per 100 m2 in the field interior, richness was even lower than in the extensive survey of Meyer et al. [6] conducted in 2009 in 392 arable fields in central Germany (median: seven species). Other studies in intensively managed arable land in central and western Europe used variable plot sizes but found mean species richness at plot level in the field interior of 6 to 10 species [8,46,47,48]. The phytodiversity of field edges in our study area (median: 11 species per plot) is also lower than in the large-scale survey of Meyer et al. [49] in central Germany (median: 18 species per plot). In fact, our richness values are among the lowest recorded so far for central Europe. One likely reason is that, under intensive management, the study region enables high yields due to its humid climate and relatively fertile soils. The once richer arable plant diversity in the region already vanished 50 or more years ago due to the increasingly intensive management regime resulting in dense, shading crop stands [50,51]. In the 1950/1960s, a median plot-level arable plant diversity of 24 species in the field interior was recorded in central Germany [6], which underlines the strong decline in species diversity within the last 60–70 years. An increase in agricultural intensification and chemical weed control in the past years since the above-mentioned vegetation surveys in central Germany and other regions may have caused further phytodiversity erosion.
With only 150 species found in the 200 fields in 2016 (Table S2), the regional species pool (γ-diversity) in the approximately 1300 km2-large study region is certainly very impoverished compared to the situation decades ago, which supports our hypothesis (i) that decades of intensive agriculture have resulted in greatly impoverished arable plant communities. Hofmeister and Garve [23] listed 287 species as typically associated with arable plant communities in Germany. Correspondingly, Meyer et al. [6] gave a regional species pool of 301 taxa found in the 1950/60s in 392 fields in central and north Germany; this number had decreased by 23% to 233 in 2009, which still exceeds by far the number of 150 species found in 2016 in our northwest German study region. While low environmental variation in the study region explains part of the relatively small current species pool, and our survey may have missed a few species with short life cycles (we surveyed each arable field only once between May and August 2016) or that only persist in the diaspore bank, diversity losses in the recent past are indisputable. This is also indicated by the fact that the few species, which occurred more commonly (e.g., Elymus repens, Fallopia convolvulus, Galium aparine, Matricaria chamomilla or Viola arvensis), are agro-tolerant species (i.e., taxa that are nitrophilous, disturbance and/or herbicide-tolerant).

4.2. The Importance of the Field Edge

As we predicted (hypothesis ii), the location in the field, i.e., edge vs. interior, was more important for plant diversity than crop type (Figure 3). This reflects the steep diversity gradient across the first 1 or 2 m in the field margin, where herbicide and fertilizer amounts are often lower and crop densities are reduced (Figure S3). In our fields, the difference in diversity between edge and interior was even greater (from 11 to 2 species; median values) than in the study of Meyer et al. [49] in central Germany (18 to 7 species). In a systematic comparison of field edge and interior plots, Wietzke and Leuschner [33] showed that in conventionally managed fields of northwest Germany, the entire remaining phytodiversity of arable plants is restricted to the small field edge strip, which occupies about 5% of the field area [52]. Thus, in terms of arable plant diversity and abundance, the field interior, i.e., 95% or more of the field, is of no relevance, a finding that is likely to be transferable to most of the conventionally managed arable land in central Europe. Rapeseed fields differed from the other six crops in that the edge-interior gradient existed for species richness but not for plant cover (Figure 2a,b). This was caused by a remarkably high cover of Viola arvensis throughout the field edge and interior; this species seems to tolerate the shading of the closed stand and may profit from the less effective herbicide treatment against dicots in rapeseed.

4.3. Composition of the Recent Arable Vegetation and the Role of Field Neighborhood

Only 96 of the 150 species present in the studied arable fields can be considered as arable plants sensu stricto (according to [23]; Table S2), commonly associated with cultivated land. Just a few of these typical arable plants were found more frequently—all of them nitrophilous and/or herbicide-tolerant non-crop grasses and herbs, such as Elymus repens, Fallopia convolvulus, Galium aparine, Matricaria chamomilla or Viola arvensis. Similarly, the 54 additionally found plant species not characterized as arable plants sensu stricto include many nitrophilous and disturbance-tolerant taxa common in field-adjacent habitats in the farmland, notably eutrophic, irregularly mown grass strips and ditch margins, and fringes of hedges, from where they tend to spill over into the field edge. In general, arable plant assemblages of modern fields are not only much impoverished, they contain a much larger proportion of ubiquitous grasses (such as Elymus repens, Bromus sterilis and Dactylis glomerata) and nitrophilous herbs (such as Galium aparine, Urtica dioica and Rumex obtusifolius) than in vegetation records of northwest German arable fields decades ago [51,53]. Species with a high degree of dependence on edaphic factors (acidic vs. base-rich) and different types of field management (e.g., summer vs. winter crops, and root crops vs. cereals), and with them the characteristic habitat-specific arable plant communities, have largely disappeared [17,19,22]. Correspondingly, we found only a very small number of species that formerly were used as diagnostic species of arable plant associations [51] (see Table 1), similar to what was reported by Meyer et al. [22] for central Germany in 2009. Occasional occurrences of Matricaria chamomilla, Centaurea cyanus, Apera spica-venti and Vicia hirsuta in field edge plots reflect what is left of the Aphano-Matricarietum chamomillae, formerly the most common association in arable fields in the study area and wider northwest Germany [53]. Preliminary analyses, excluded from the present paper for brevity, namely, non-metric multidimensional scaling (NMDS) and cluster analyses to assess relationships between plots in terms of species composition, revealed no interpretable community patterns.
Our mixed model analysis is among the few attempts to disentangle the influences of crop type, edaphic properties, agronomic and landscape factors on arable plant richness. In contradiction to our hypothesis (i), we found that the cultivated crop type remains a relevant determinant of plant diversity in modern arable fields. Compared to fields of winter cereals (pooled), maize and potato, rapeseed positively influenced non-crop plant richness (Figure 4). In a comparison of four crop species, Seifert et al. [18] also found a (non-significant) tendency toward higher species numbers in rapeseed field edges. A likely explanation is that dicot weeds are more difficult to control in dicot crops (such as rapeseed) than in cereals. The lack of a clear effect of potato on non-crop plant species richness as compared to winter cereals can be explained by the cultivation time of potato fields. The late planting of potatoes from May onwards enables effective weed control until shortly before sowing, and thus, to suppress arable plant species that germinate in autumn or early spring (including dicots). Lower species numbers in maize as compared to rapeseed can similarly be explained by the exclusion of species germinating in autumn and early spring, as maize cultivation starts late in spring. Light deficiency may also play a role, which is significantly more pronounced under maize than, for example, under rapeseed [18]; specific herbicide combinations could also be relevant.
Contrary to hypothesis (iii), both soil factors (soil yield potential) and management factors (i.e., crop cover and Herbicide Intensity Index) showed only a weak or insignificant influence on herbaceous plant richness. Location in the field had the strongest impact and the type of habitat adjacent to the field edges had the second strongest effect on plant species richness. Especially grass strips and ditch margins as adjacent habitats positively influenced plant species richness as compared to field edges bordering another field, whereas the effect of adjacent hedges was weaker (Figure 3) and non-significant in post-hoc pairwise comparisons (Figure 4). The weak effect of adjacent hedges, again, may be a result of energy limitation due to shading by the hedge.
Of the 150 species found in the fields, three-quarters co-occurred in the adjacent grassy habitats or hedges, and 69 of them were arable plants sensu stricto (Figure 5 and Table S6). In agreement with hypothesis (ii), this suggests that some arable taxa have refugia in adjacent habitats, and spill over from grass strips, ditch margins or hedges. This may buffer such species against population decreases or local extinctions in fields with adverse growing conditions. Correspondingly, six plant species listed as arable plants sensu stricto by Hofmeister and Garve [23] were solely found in adjacent habitats, including Vicia villosa, a plant well adapted to arable fields [23]. Population genetic studies will have to show whether adjacent habitats usually out of reach of herbicides currently harbor source populations of certain arable plants decimated in the fields, or whether they profit from spillover from the field edge, but in turn do not benefit the field edge populations. The other 43 species found in both field edges and adjacent habitats are disturbance-tolerant and nitrophilous species with main occurrence in fertile and ruderalized grasslands and hedges. They would occasionally spill over into the field edge and then disappear, but they increase the total number of field edge species [54]. At any rate, they are of little conservation value with respect to the arable flora.
In many intensively used central European farmland landscapes, habitats between two neighboring fields occupy about 1–5% of the area. If the grass strips and ditch margins not directly treated with fertilizers and pesticides are enlarged and mown once a year to reduce the nutrients stored in biomass and the competitiveness of some vigorous plants, and optionally supplied with seed mixtures of local origin arable and grassland plants, then these habitats may be revaluated to function as local refuge of a fraction of the farmland phytodiversity, benefiting at the same time farmland birds and insects [55]. Occasional tillage may increase the germination success. Such measures will be especially valuable when appropriate infield measures (such as the protection of extensively managed crop fields, arable fallow and indigenous flower strips) are not implemented. We hardly expect that the diversity of conventionally managed field edges, treated with fertilizers and herbicides, would profit from revaluated grass strips and ditch margins, but landscape-level diversity would, to some extent. To effectively increase both arable and non-arable diversity of farmland landscapes, the improvement and enlargement of adjacent habitats should be combined with infield measures such as non-intensively managed cereal strips at the field edge.

5. Conclusions

This analysis of plant diversity in an intensively managed arable landscape, by all means representative for much of central and western Europe’s farmland, demonstrates the dramatically low level of contemporary farmland phytodiversity. With median non-crop plant cover values of 0.5% in the field interior and 4% at its edge, weed control proves to be highly effective far beyond the level where significant competition of crop plants and wild arable plants would occur. Weed control of such intensity leads to the collapse of arable plant diversity, and moreover, has the potential to wreck important ecosystem functions provided by arable plants, notably the protection from soil erosion and the reduction of nitrate leaching during the non-growth time of crops. Across all crops, species richness has reached historical minima with median values of 11 taxa at the edge and only 2 in the interior. Somewhat higher cover of arable non-crop species was only found in fields of rapeseed, indicating possible gaps in chemical weed control rather than higher plant diversity associated with this crop species. The remaining arable plant species pool has lost nearly all taxa of conservation value. It nowadays mainly consists of agro-tolerant arable plants (i.e., widespread generalist nitrophilous, disturbance/herbicide-tolerant grasses and herbs) that are able to persist in the fields’ seed bank or spill over from adjacent habitats. In arable landscapes, where infield measures to increase biodiversity (such as non-intensively managed field edge cereal strips) are not feasible under current agronomic conditions, we recommend to improve the habitat quality of field-adjacent grassy strips through mowing and, if helpful, tillage and sowing of local arable plant mixtures. Such management of these refugial habitats might result in an increase of the local farmland landscape species pool, but will not compensate for the overall loss of farmland biodiversity. Agricultural policy at national and EU levels must take note of the fact that agrochemical weed control has almost wiped out non-crop plant life in at least 95% of the conventionally managed cropland of central Europe, i.e., the field interior except for a narrow field edge strip, thereby jeopardizing important ecosystem services at the cost of future generations of farmers and the society as a whole.

Supplementary Materials

The following files are available online at https://www.mdpi.com/1424-2818/12/12/469/s1, File S1: Supplementary methods; Supplementary tables: Table S1: Raw data of the vegetation survey (including management and environmental data). Table S2: Categorization of surveyed plant species. Table S3: Summary of model structure and statistical results. Table S4: Species numbers per crop type in field edge and field interior plots and edge and interior pooled. Table S5: Species occurrences in field edge and field interior plots (and edge and interior pooled) by crop type. Table S6: Species occurrences in field edge and adjacent habitat plots; Supplementary figures: Figure S1: Relative frequency of habitat types in the study region in 2016. Figure S2: Proportion of crops in the farmland of the study region in 2016. Figure S3: Crop cover (%) in field edge and field interior plots. Figure S4: Plant species occurring only in one crop or with wider distribution across crop types.

Author Contributions

Conceptualization, A.W. and C.L.; methodology, A.W., C.L., C.-S.v.W., E.B. and S.M.; formal analysis, A.W. and C.-S.v.W.; investigation, A.W.; data curation, A.W. and C.-S.v.W.; writing—original draft preparation, A.W. and C.-S.v.W.; writing—review and editing, A.W., C.L., E.B., C.-S.v.W. and S.M.; project administration, A.W.; funding acquisition, C.L. All authors have read and agreed to the published version of the manuscript.

Funding

The presented study is part of the research project ‘Development of targeted and efficient schemes to increase biodiversity in agricultural landscapes (MEDIATE)’ funded by the German Federal Environmental Foundation (DBU; 32873/01). We acknowledge support by the Open Access Publication Funds of the Göttingen University.

Acknowledgments

Special thanks go to Jens Dauber (Thünen Institute of Biodiversity, Braunschweig, Germany), Marcus Polaschegg and Nora Kretzschmar (Lower Saxony Chamber of Agriculture, Germany), who, together with C.L., conceived the research project and carried out the acquisition of funding. Many thanks to all farmers who granted us access to their fields. In addition, many thanks to Laura Sutcliffe, Stefan Mecke, Friedemann Goral, Jenny Schellenberg and Roman Link for helpful discussions regarding the study design and/or data analysis and to Christina Ewerhardy, Fionn Pape and Svenja Meyer for invaluable support during the field work.

Conflicts of Interest

The authors declare no conflict of interest.

References

  1. Geiger, F.; Bengtsson, J.; Berendse, F.; Weisser, W.W.; Emmerson, M.; Morales, M.B.; Ceryngier, P.; Liira, J.; Tscharntke, T.; Winqvist, C.; et al. Persistent negative effects of pesticides on biodiversity and biological control potential on European farmland. Basic Appl. Ecol. 2010, 11, 97–105. [Google Scholar] [CrossRef]
  2. Stoate, C.; Boatman, N.D.; Borralho, R.J.; Carvalho, C.R.; de Snoo, G.R.; Eden, P. Ecological impacts of arable intensification in Europe. J. Environ. Manag. 2001, 63, 337–365. [Google Scholar] [CrossRef]
  3. Storkey, J.; Meyer, S.; Still, K.S.; Leuschner, C. The impact of agricultural intensification and land-use change on the European arable flora. Proc. R. Soc. B Biol. Sci. 2012, 279, 1421–1429. [Google Scholar] [CrossRef] [PubMed]
  4. Donald, P.F.; Sanderson, F.J.; Burfield, I.J.; van Bommel, F.P.J. Further evidence of continent-wide impacts of agricultural intensification on European farmland birds, 1990–2000. Agric. Ecosyst. Environ. 2006, 116, 189–196. [Google Scholar] [CrossRef]
  5. Gabriel, D.; Sait, S.M.; Kunin, W.E.; Benton, T.G. Food production vs. biodiversity: Comparing organic and conventional agriculture. J. Appl. Ecol. 2013, 50, 355–364. [Google Scholar] [CrossRef]
  6. Meyer, S.; Wesche, K.; Krause, B.; Leuschner, C. Dramatic losses of specialist arable plants in Central Germany since the 1950s/60s—A cross-regional analysis. Divers. Distrib. 2013, 19, 1175–1187. [Google Scholar] [CrossRef]
  7. Cirujeda, A.; Aibar, J.; Zaragoza, C. Remarkable changes of weed species in Spanish cereal fields from 1976 to 2007. Agron. Sustain. Dev. 2011, 31, 675–688. [Google Scholar] [CrossRef]
  8. Fried, G.; Petit, S.; Dessaint, F.; Reboud, X. Arable weed decline in Northern France: Crop edges as refugia for weed conservation? Biol. Conserv. 2009, 142, 238–243. [Google Scholar] [CrossRef]
  9. Leuschner, C.; Ellenberg, H. Ecology of Central European Non-Forest Vegetation: Coastal to Alpine, Natural to Man-Made Habitats: Vegetation Ecology of Central Europe, Volume II; Springer International Publishing: Cham, Switzerland, 2017; ISBN 978-3-319-43046-1. [Google Scholar]
  10. Gholamhoseini, M.; AghaAlikhani, M.; Mirlatifi, S.M.; Sanavy, S.A.M.M. Weeds—Friend or foe? Increasing forage yield and decreasing nitrate leaching on a corn forage farm infested by redroot pigweed. Agric. Ecosyst. Environ. 2013, 179, 151–162. [Google Scholar] [CrossRef]
  11. Hawes, C.; Haughton, A.J.; Osborne, J.L.; Roy, D.B.; Clark, S.J.; Perry, J.N.; Rothery, P.; Bohan, D.A.; Brooks, D.R.; Champion, G.T.; et al. Responses of plants and invertebrate trophic groups to contrasting herbicide regimes in the Farm Scale Evaluations of genetically modified herbicide-tolerant crops. Philos. Trans. R. Soc. B Biol. Sci. 2003, 358, 1899–1913. [Google Scholar] [CrossRef] [Green Version]
  12. Marshall, E.J.P.; Brown, V.K.; Boatman, N.D.; Lutman, P.J.W.; Squire, G.R.; Ward, L.K. The role of weeds in supporting biological diversity within crop fields. Weed Res. 2003, 43, 77–89. [Google Scholar] [CrossRef] [Green Version]
  13. Hallmann, C.A.; Sorg, M.; Jongejans, E.; Siepel, H.; Hofland, N.; Schwan, H.; Stenmans, W.; Müller, A.; Sumser, H.; Hörren, T.; et al. More than 75 percent decline over 27 years in total flying insect biomass in protected areas. PLoS ONE 2017, 12, e0185809. [Google Scholar] [CrossRef] [PubMed] [Green Version]
  14. Duraiappah, A.K.; Naeem, S.; Agardy, T.; Ash, N.J.; Cooper, H.D.; Diaz, S.; Faith, D.P.; Mace, G.; McNeely, J.A.; Mooney, H.A.; et al. Millennium Ecosystem Assessment. In Ecosystems and Human Well-being: Biodiversity Synthesis; World Resources Institute: Washington, DC, USA, 2005; p. 100. [Google Scholar]
  15. Fried, G.; Norton, L.R.; Reboud, X. Environmental and management factors determining weed species composition and diversity in France. Agric. Ecosyst. Environ. 2008, 128, 68–76. [Google Scholar] [CrossRef]
  16. Pinke, G.; Karácsony, P.; Czúcz, B.; Botta-Dukát, Z.; Lengyel, A. The influence of environment, management and site context on species composition of summer arable weed vegetation in Hungary. Appl. Veg. Sci. 2012, 15, 136–144. [Google Scholar] [CrossRef]
  17. Albrecht, H.; Cambecèdes, J.; Lang, M.; Wagner, M. Management options for the conservation of rare arable plants in Europe. Bot. Lett. 2016, 163, 389–415. [Google Scholar] [CrossRef] [Green Version]
  18. Seifert, C.; Leuschner, C.; Meyer, S.; Culmsee, H. Inter-relationships between crop type, management intensity and light transmissivity in annual crop systems and their effect on farmland plant diversity. Agric. Ecosyst. Environ. 2014, 195, 173–182. [Google Scholar] [CrossRef]
  19. Richner, N.; Holderegger, R.; Linder, H.P.; Walter, T. Reviewing change in the arable flora of Europe: A meta-analysis. Weed Res. 2015, 55, 1–13. [Google Scholar] [CrossRef]
  20. Maréchal, P.-Y.; Henriet, F.; Vancutsem, F.; Bodson, B. Ecological review of black-grass (Alopecurus myosuroides Huds.) propagation abilities in relationship with herbicide resistance. Biotechnol. Agron. Soc. Environ. 2012, 16, 103–113. [Google Scholar]
  21. Egan, J.F.; Graham, I.M.; Mortensen, D.A. A comparison of the herbicide tolerances of rare and common plants in an agricultural landscape: Herbicide tolerances of rare and common plants. Environ. Toxicol. Chem. 2014, 33, 696–702. [Google Scholar] [CrossRef]
  22. Meyer, S.; Bergmeier, E.; Becker, T.; Wesche, K.; Krause, B.; Leuschner, C. Detecting long-term losses at the plant community level—Arable fields in Germany revisited. Appl. Veg. Sci. 2015, 18, 432–442. [Google Scholar] [CrossRef]
  23. Hofmeister, H.; Garve, E. Lebensraum Acker; Reprint der 2. neubearbeiteten Auflage; Verlag Kessel: Remagen, Germany, 2006; ISBN 978-3-935638-61-6. [Google Scholar]
  24. Hüppe, J.; Hofmeister, H. Syntaxonomische Fassung und Übersicht über die Ackerunkrautgesellschaften der Bundesrepublik Deutschland. Ber. Reinh.-Tüxen-Ges. 1990, 2, 57–77. [Google Scholar]
  25. Kaussmann, B.; Kudocke, J. Die ökologisch-soziologischen Artengruppen der Ackerunkrautvegetation für den Norden der DDR. Feddes Repert. 1973, 84, 589–605. [Google Scholar] [CrossRef]
  26. Statistical Office of the European Union (EUROSTAT) Main Farmland Use by NUTS 2 Regions & Organic Crop Area by Agricultural Production Methods and Crops. Available online: https://ec.europa.eu/eurostat/web/agriculture/data/database (accessed on 24 October 2018).
  27. Hanzlik, K.; Gerowitt, B. Methods to conduct and analyse weed surveys in arable farming: A review. Agron. Sustain. Dev. 2016, 36. [Google Scholar] [CrossRef] [Green Version]
  28. Batáry, P.; Gallé, R.; Riesch, F.; Fischer, C.; Dormann, C.F.; Mußhoff, O.; Császár, P.; Fusaro, S.; Gayer, C.; Happe, A.-K.; et al. The former Iron Curtain still drives biodiversity–profit trade-offs in German agriculture. Nat. Ecol. Evol. 2017, 1, 1279–1284. [Google Scholar] [CrossRef] [PubMed] [Green Version]
  29. von Drachenfels, O. Überarbeitung der Naturräumlichen Regionen Niedersachsens. Inform. Nat. Niedersachs. 2010, 30, 249–252. [Google Scholar]
  30. German Meteorological Service (DWD) Climate Data (2013–2017) via the CDC FTP Server. Available online: https://opendata.dwd.de/climate_environment/CDC/observations_germany/climate/annual/kl/recent/ & https://www.dwd.de/DE/leistungen/klimadatendeutschland/statliste/statlex_html.html?view=nasPublication&nn=16102 (accessed on 25 October 2018).
  31. Federal Institute for Geosciences and Natural Resources Soil Map of the Federal Republic of Germany 1:1,000,000 (BÜK1000). Available online: https://www.bgr.bund.de/DE/Themen/Boden/Informationsgrundlagen/Bodenkundliche_Karten_Datenbanken/BUEK1000/buek1000_node.html (accessed on 26 October 2016).
  32. State Authority for Mining, Energy and Geology (LBEG) German Soil Assessment Map 1:5000 (BS5). Available online: https://www.lbeg.niedersachsen.de/karten_daten_publikationen/karten_daten/boden/bodenkarten/bodenschaetzungskarte_15000/bodenschaetzungskarte-von-niedersachsen-im-mastab-1--5-000-bs5-681.html (accessed on 26 October 2018).
  33. Wietzke, A.; Leuschner, C. Surveying the arable plant diversity of conventionally managed farmland: A comparison of methods. Environ. Monit. Assess. 2020, 192, 98. [Google Scholar] [CrossRef]
  34. Buttler, K.P. Florenliste von Deutschland—Gefäßpflanzen. Available online: http://www.kp-buttler.de (accessed on 13 February 2019).
  35. Environmental Systems Research Institute (ESRI) ArcGIS Desktop 10.6.1. Available online: https://www.esri.com/en-us/arcgis/products/arcgis-pro/overview (accessed on 26 October 2018).
  36. Roßberg, D.; Gutsche, V.; Enzian, S.; Wick, M. NEPTUN 2000—Erhebung von Daten zum Tatsächlichen Einsatz Chemischer Pflanzenschutzmittel im Ackerbau Deutschlands; Berichte aus der Biologischen Bundesanstalt für Land- und Forstwirtschaft, Heft 98; SaphirVerlag: Ribbesbüttel, Germany, 2002. [Google Scholar]
  37. Land24 GmbH Crop Protection Manger. Available online: https://www.raiffeisen.com/pflanzenschutzmittel (accessed on 26 October 2018).
  38. Garve, E. Rote Liste und Florenliste der Farn- und Blütenpflanzen in Niedersachsen und Bremen, 5. Fassung vom 1.3.2004. Inform. Nat. Niedersachs. 2004, 24, 1–76. [Google Scholar]
  39. German Federal Agency for Nature Conservation High-Nature-Value Farmland, Germany. Available online: https://www.bfn.de/themen/monitoring/monitoring-von-landwirtschaftsflaechen-mit-hohem-naturwert.html (accessed on 19 October 2018).
  40. R Core Team. R: A Language and Environment for Statistical Computing. R Foundation for Statistical Computing, Vienna, Austria. Available online: https://www.R-project.org/ (accessed on 6 November 2018).
  41. Brooks, M.E.; Kristensen, K.; van Benthem, K.J.; Magnusson, A.; Berg, C.W.; Nielsen, A.; Skaug, H.J.; Maechler, M.; Bolker, B.M. glmmTMB Balances Speed and Flexibility Among Packages for Zero-inflated Generalized Linear Mixed Modeling. R. J. 2017, 9, 378–400. [Google Scholar] [CrossRef] [Green Version]
  42. Hothorn, T.; Bretz, F.; Westfall, P. Simultaneous Inference in General Parametric Models. Biom. J. 2008, 50, 346–363. [Google Scholar] [CrossRef] [Green Version]
  43. Chen, H. VennDiagram: Generate High-Resolution Venn and Euler Plots. R Package Version 1.6.20. Available online: https://CRAN.R-project.org/package=VennDiagram (accessed on 7 November 2018).
  44. Oksanen, J.; Blanchet, F.G.; Friendly, M.; Kindt, R.; Legendre, P.; McGlinn, D.; Minchin, P.R.; O’Hara, R.B.; Simpson, G.L.; Solymos, P.; et al. Vegan: Community Ecology Package. R Package Version 2.5-2. Available online: https://CRAN.R-project.org/package=vegan (accessed on 6 November 2018).
  45. Gelman, A. Scaling regression inputs by dividing by two standard deviations. Stat. Med. 2008, 27, 2865–2873. [Google Scholar] [CrossRef]
  46. Chamorro, L.; Masalles, R.M.; Sans, F.X. Arable weed decline in Northeast Spain: Does organic farming recover functional biodiversity? Agric. Ecosyst. Environ. 2016, 223, 1–9. [Google Scholar] [CrossRef]
  47. Kolářová, M.; Tyšer, L.; Soukup, J. Diversity of current weed vegetation on arable land in selected areas of the Czech Republic. Plant Soil Environ. 2013, 59, 208–213. [Google Scholar] [CrossRef] [Green Version]
  48. Kovács-Hostyánszki, A.; Batáry, P.; Báldi, A.; Harnos, A. Interaction of local and landscape features in the conservation of Hungarian arable weed diversity: Weed richness in Hungarian cereal fields. Appl. Veg. Sci. 2011, 14, 40–48. [Google Scholar] [CrossRef]
  49. Meyer, S.; Wesche, K.; Krause, B.; Brütting, C.; Hensen, I.; Leuschner, C. Diversitätsverluste und floristischer Wandel im Ackerland seit 1950. Nat. Landsch. 2014, 89, 392–398. [Google Scholar]
  50. Meisel, K.; von Hübschmann, A. Veränderungen der Acker- und Grünlandvegetation im nordwestdeutschen Flachland in jüngerer Zeit. Schr. Veg. 1976, 10, 109–124. [Google Scholar]
  51. Preising, E.; Vahle, H.-C.; Brandes, D.; Hofmeister, H.; Tüxen, J.; Weber, H.E. Die Pflanzengesellschaften Niedersachsens—Bestandsentwicklung, Gefährdung und Schutzprobleme. Einjährige ruderale Pionier-, Tritt- und Ackerwildkraut- Gesellschaften. Nat. Landsch. Niedersachs. 1995, 20, 1–92. [Google Scholar]
  52. Leuschner, C.; Krause, B.; Meyer, S.; Bartels, M. Structural change in the arable land and grassland of Lower Saxony and Schleswig-Holstein since 1950. Nat. Landsch. 2014, 89, 386–391. [Google Scholar]
  53. Meisel, K. Über die Artenverbindung des Aphanion arvensis J. et R. Tx. 1960 im west-und nordwestdeutschen Flachland. Schr. Veg. 1967, 2, 123–133. [Google Scholar]
  54. Aavik, T.; Augenstein, I.; Bailey, D.; Herzog, F.; Zobel, M.; Liira, J. What is the role of local landscape structure in the vegetation composition of field boundaries? Appl. Veg. Sci. 2008, 11, 375–386. [Google Scholar] [CrossRef]
  55. Vickery, J.A.; Feber, R.E.; Fuller, R.J. Arable field margins managed for biodiversity conservation: A review of food resource provision for farmland birds. Agric. Ecosyst. Environ. 2009, 133, 1–13. [Google Scholar] [CrossRef]
Figure 1. Map of the study region with the districts of Nienburg and Diepholz in Lower Saxony, northwest Germany. The location of the studied fields is indicated by black dots.
Diversity 12 00469 g001
Figure 2. Non-crop plant species richness (a,c,d) and cover (b) in 100 m2-plots in the field interior and at the edge in the seven crop types for all herbaceous species (a,b); arable plant species sensu stricto (c); and high-nature-value (HNV) species of arable land (d). See Section 2.4 for definition of the plant group categories. n = 30 fields for edge plots of wheat, barley, rye, maize and rapeseed, n = 28 for potato, n = 22 for triticale, n = 10 per crop for interior plots. Significant differences in non-crop plant species richness and cover between crop types (according to Mann-Whitney U tests; Table S3) are indicated by different letters: lowercase letters = comparison of the field edge plots between different crop types; capital letters = comparison between the field interior plots of different crop types.
Diversity 12 00469 g002
Figure 3. Effect sizes (mean estimate of the coefficients and 95% confidence intervals) of the influence of adjacent habitat type (field edge plots adjacent to grass strips, ditch margins and hedges or field interior plots, i.e., no adjacent habitat), crop type (maize, potato, rapeseed), management-related factors (Herbicide Intensity Index, crop cover, total nitrogen input) and edaphic properties (soil yield potential) on total herbaceous plant species richness of the surveyed arable fields according to the generalized mixed effects model (n = 255 plots on 14 farms, 15 of 270 plots were excluded due to missing values of management data). The effects of the categorical variables were calculated relative to species richness of the respective reference levels (adjacent habitat type: field edge plots bordering another field; crop type: winter cereal fields (wheat, barley, rye and triticale pooled)). The coefficients for numeric predictors were rescaled by twice of the standard deviation for reasons of comparability [45]. Non-significant effects are highlighted in light grey. See Table S3 for details about the statistical analyses, including original values of all coefficients. Note that the significant effects of maize, potato and adjacent hedge compared to the respective reference level (all cereals pooled or adjacent arable field) were not consistently supported by all statistical analyses (Figure 2 and Figure 4).
Diversity 12 00469 g003
Figure 4. Number of herbaceous plant species (without woody plant seedlings and crops) at the field level for different crop types (all four cereals pooled; field edge and interior pooled) (a), or for plots with different adjacent habitats: field edge plots adjacent to ditch margins, grass strips, hedges and arable fields or field interior plots, i.e., no adjacent habitat, (b), number of plant species (field edge and interior plots pooled) in relation to soil yield potential (Ackerwertzahl) (c), Herbicide Intensity Index (d), crop cover (e) or total nitrogen fertilizer added (f) according to the generalized mixed effects model (n = 255 plots on 14 farms, 15 of 270 plots were excluded due to missing values of management data). Given are predicted means and 95% confidence intervals in (a,b); predicted values (black line) and 95% confidence intervals (grey, cf). Significant differences between crop types and plots bordering different adjacent habitats are highlighted by small letters (multiple comparisons according to post-hoc Tukey tests, α ≤ 0.05). See Table S3 for details about the statistical analyses. Note that statistical results related to the comparison of maize, potato and adjacent hedge with the respective reference level of the model (all cereals pooled or adjacent arable field) were not clearly supported by all statistical analyses (Figure 2 and Figure 3).
Diversity 12 00469 g004
Figure 5. Number of species exclusively occurring at field edges or in three types of adjacent habitats, or that are shared with other habitats in the study region. Indicated are the species number and the proportion of the total species pool (in %) for herbaceous plant species richness (in total 201 species, woody plant seedlings and crops excluded); n: edge plots = 200, ditch margins = 21, grass strips = 20, hedges = 22.
Diversity 12 00469 g005
Table 1. Number of arable plant species sensu stricto (defined by Hofmeister and Garve [23]) and number of species diagnostic for classes, orders, alliances or associations of arable plant communities (defined by Hüppe and Hofmeister [24]). Given are median values; n = 30 for edge plots of barley, maize, rapeseed, rye and wheat, potato = 28, triticale = 22; n = 10 for interior plots per crop.
Plot TypeCropArable PlantsClassOrderAllianceAssociationTotal Number of Diagnostic Species
Field edgeWheat6.500011
Field interiorWheat200001
Field edgeBarley910112.5
Field interiorBarley200001
Field edgeRye9.510214
Field interiorRye2.510001
Field edgeTriticale7000.512
Field interiorTriticale200000
Field edgeMaize6.510012
Field interiorMaize2.500011.5
Field edgeRapeseed1320125
Field interiorRapeseed310012
Field edgePotato10200.514
Field interiorPotato0.500000
Publisher’s Note: MDPI stays neutral with regard to jurisdictional claims in published maps and institutional affiliations.

