Small-Scale Environmental Drivers of Plant Community Structure and Diversity in Neotropical Montane Cloud Forests Harboring Threatened Magnolia dealbata in Southern Mexico


 ,
,  , ,
, , 
Abstract
:
Graphical Abstract
1. Introduction
2. Materials and Methods
2.1. Study Area
2.2. Community Sampling
2.3. Environmental Sampling
2.4. Data Matrices
2.5. Ordination
2.6. Classification
2.7. Diversity and Structure
2.8. Endemism and Conservation
3. Results
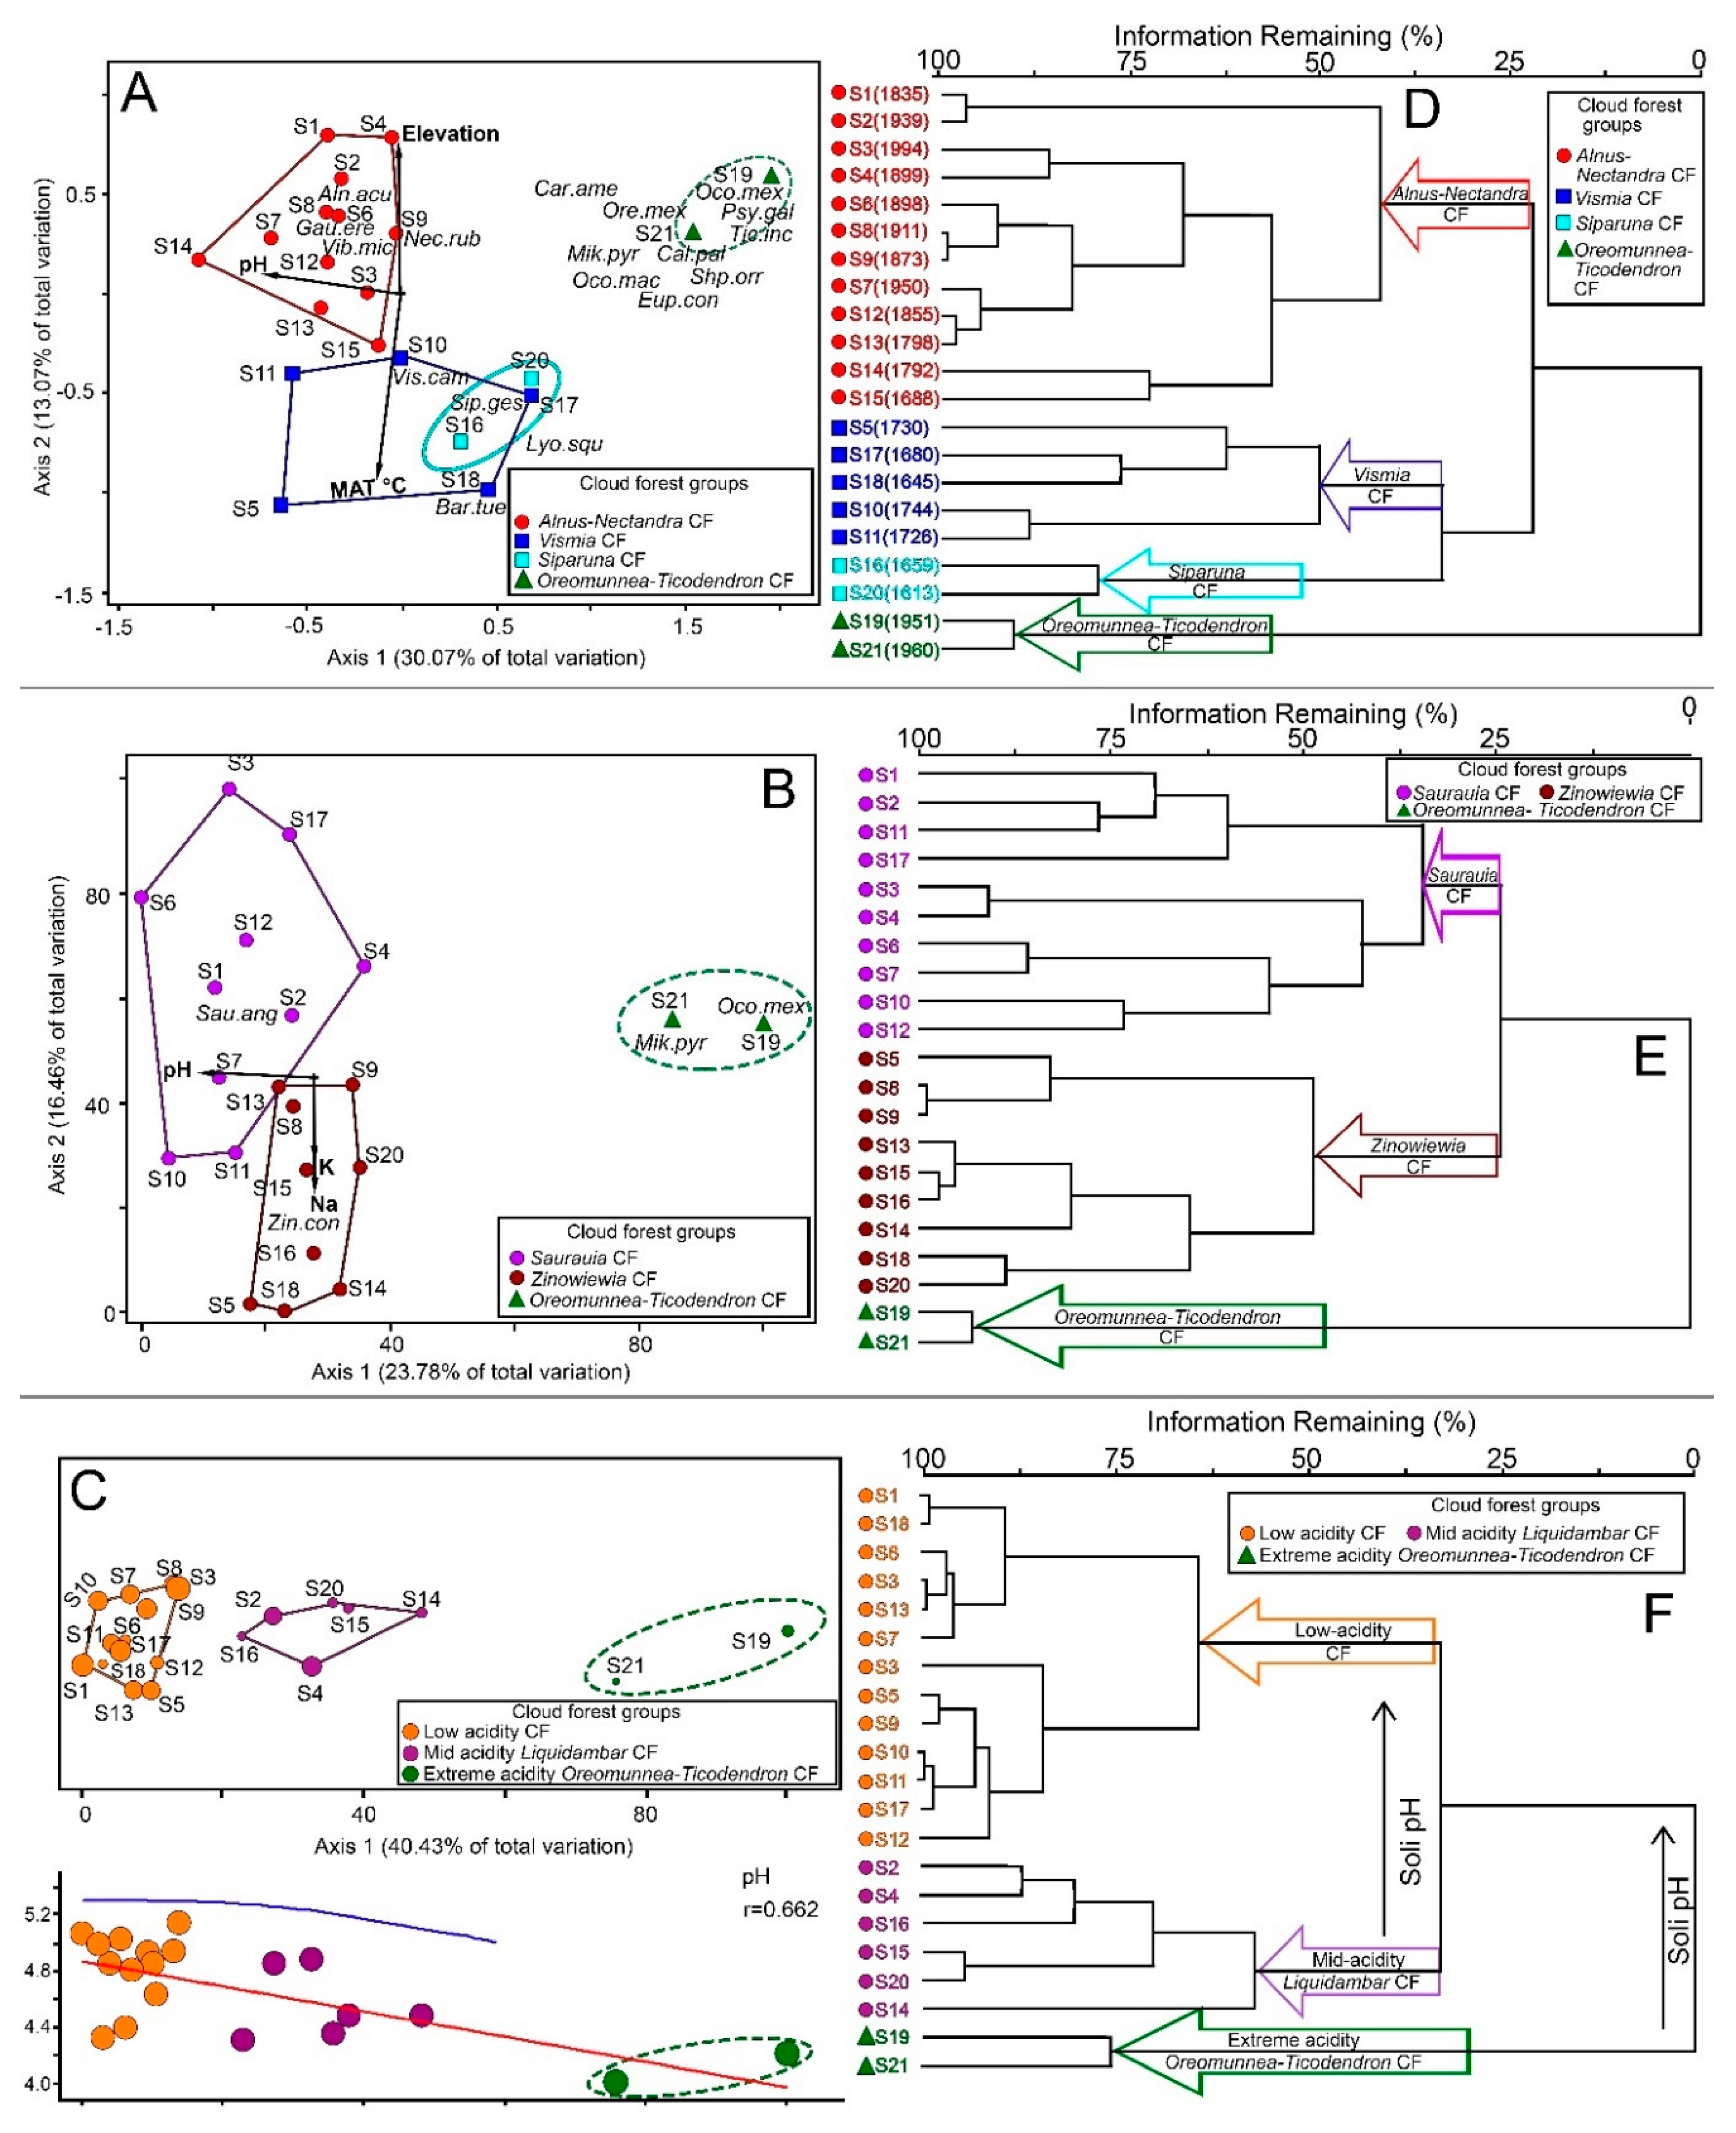
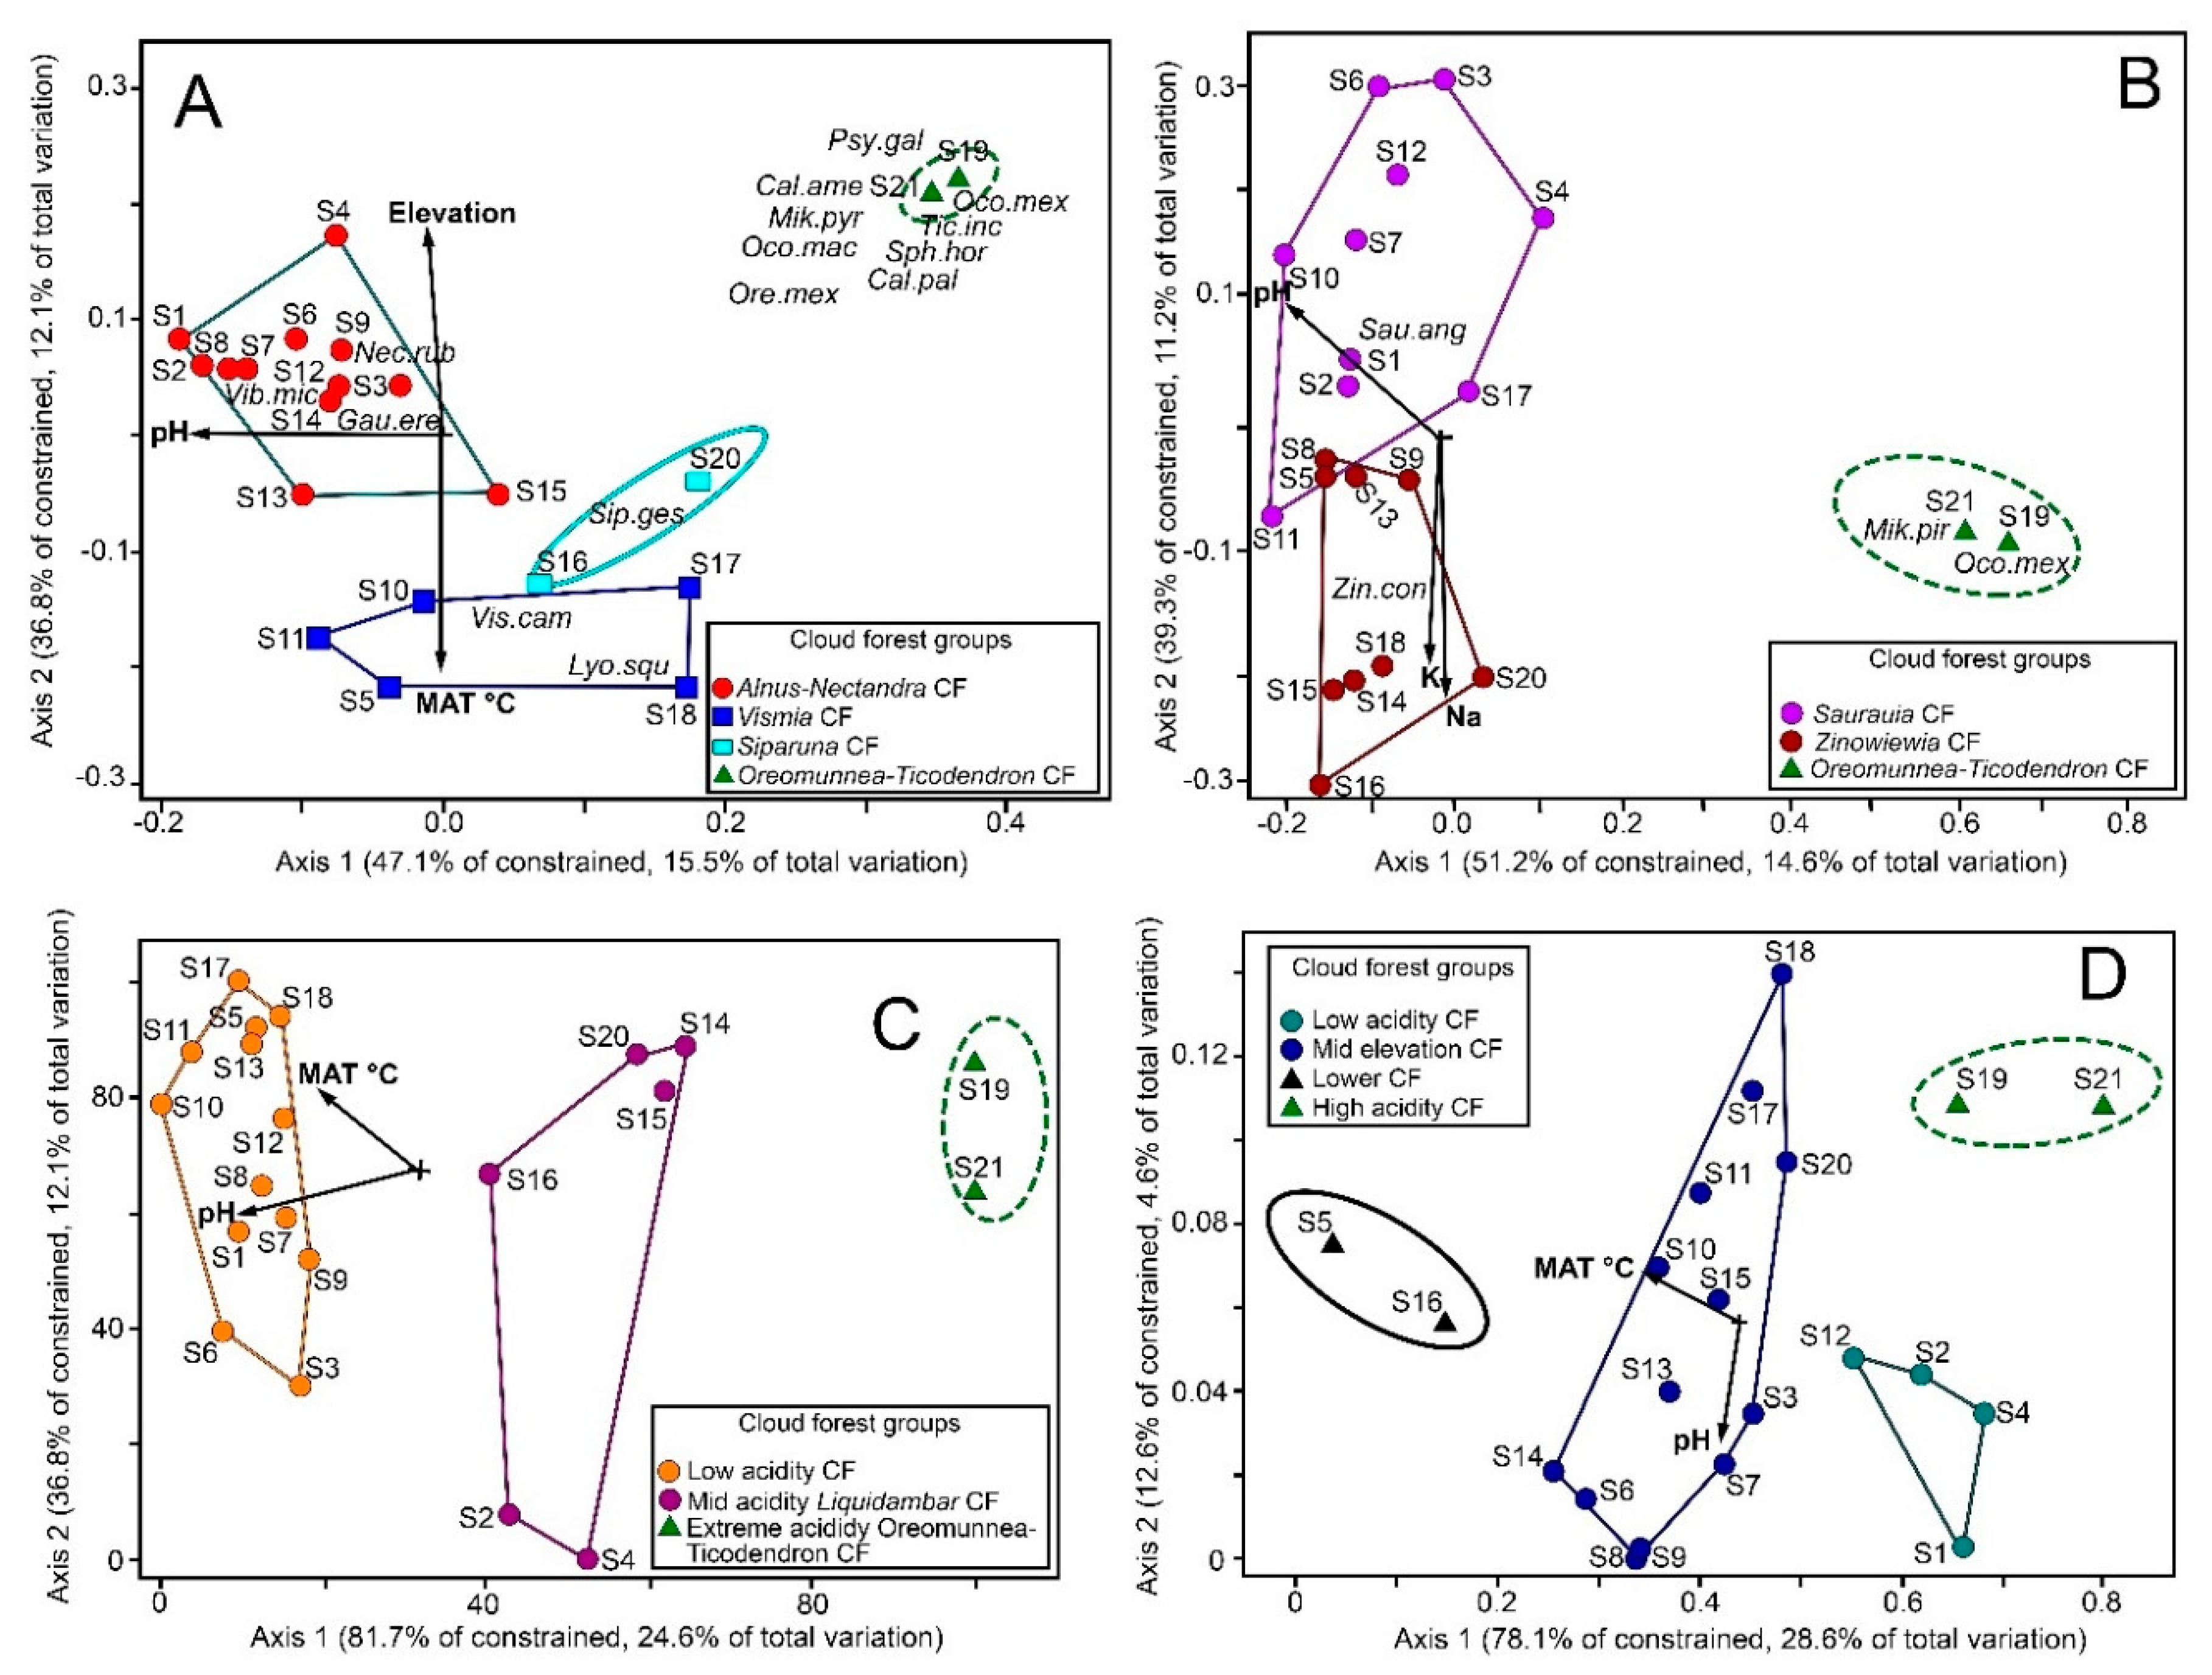
3.1. Ordination
3.2. Classification
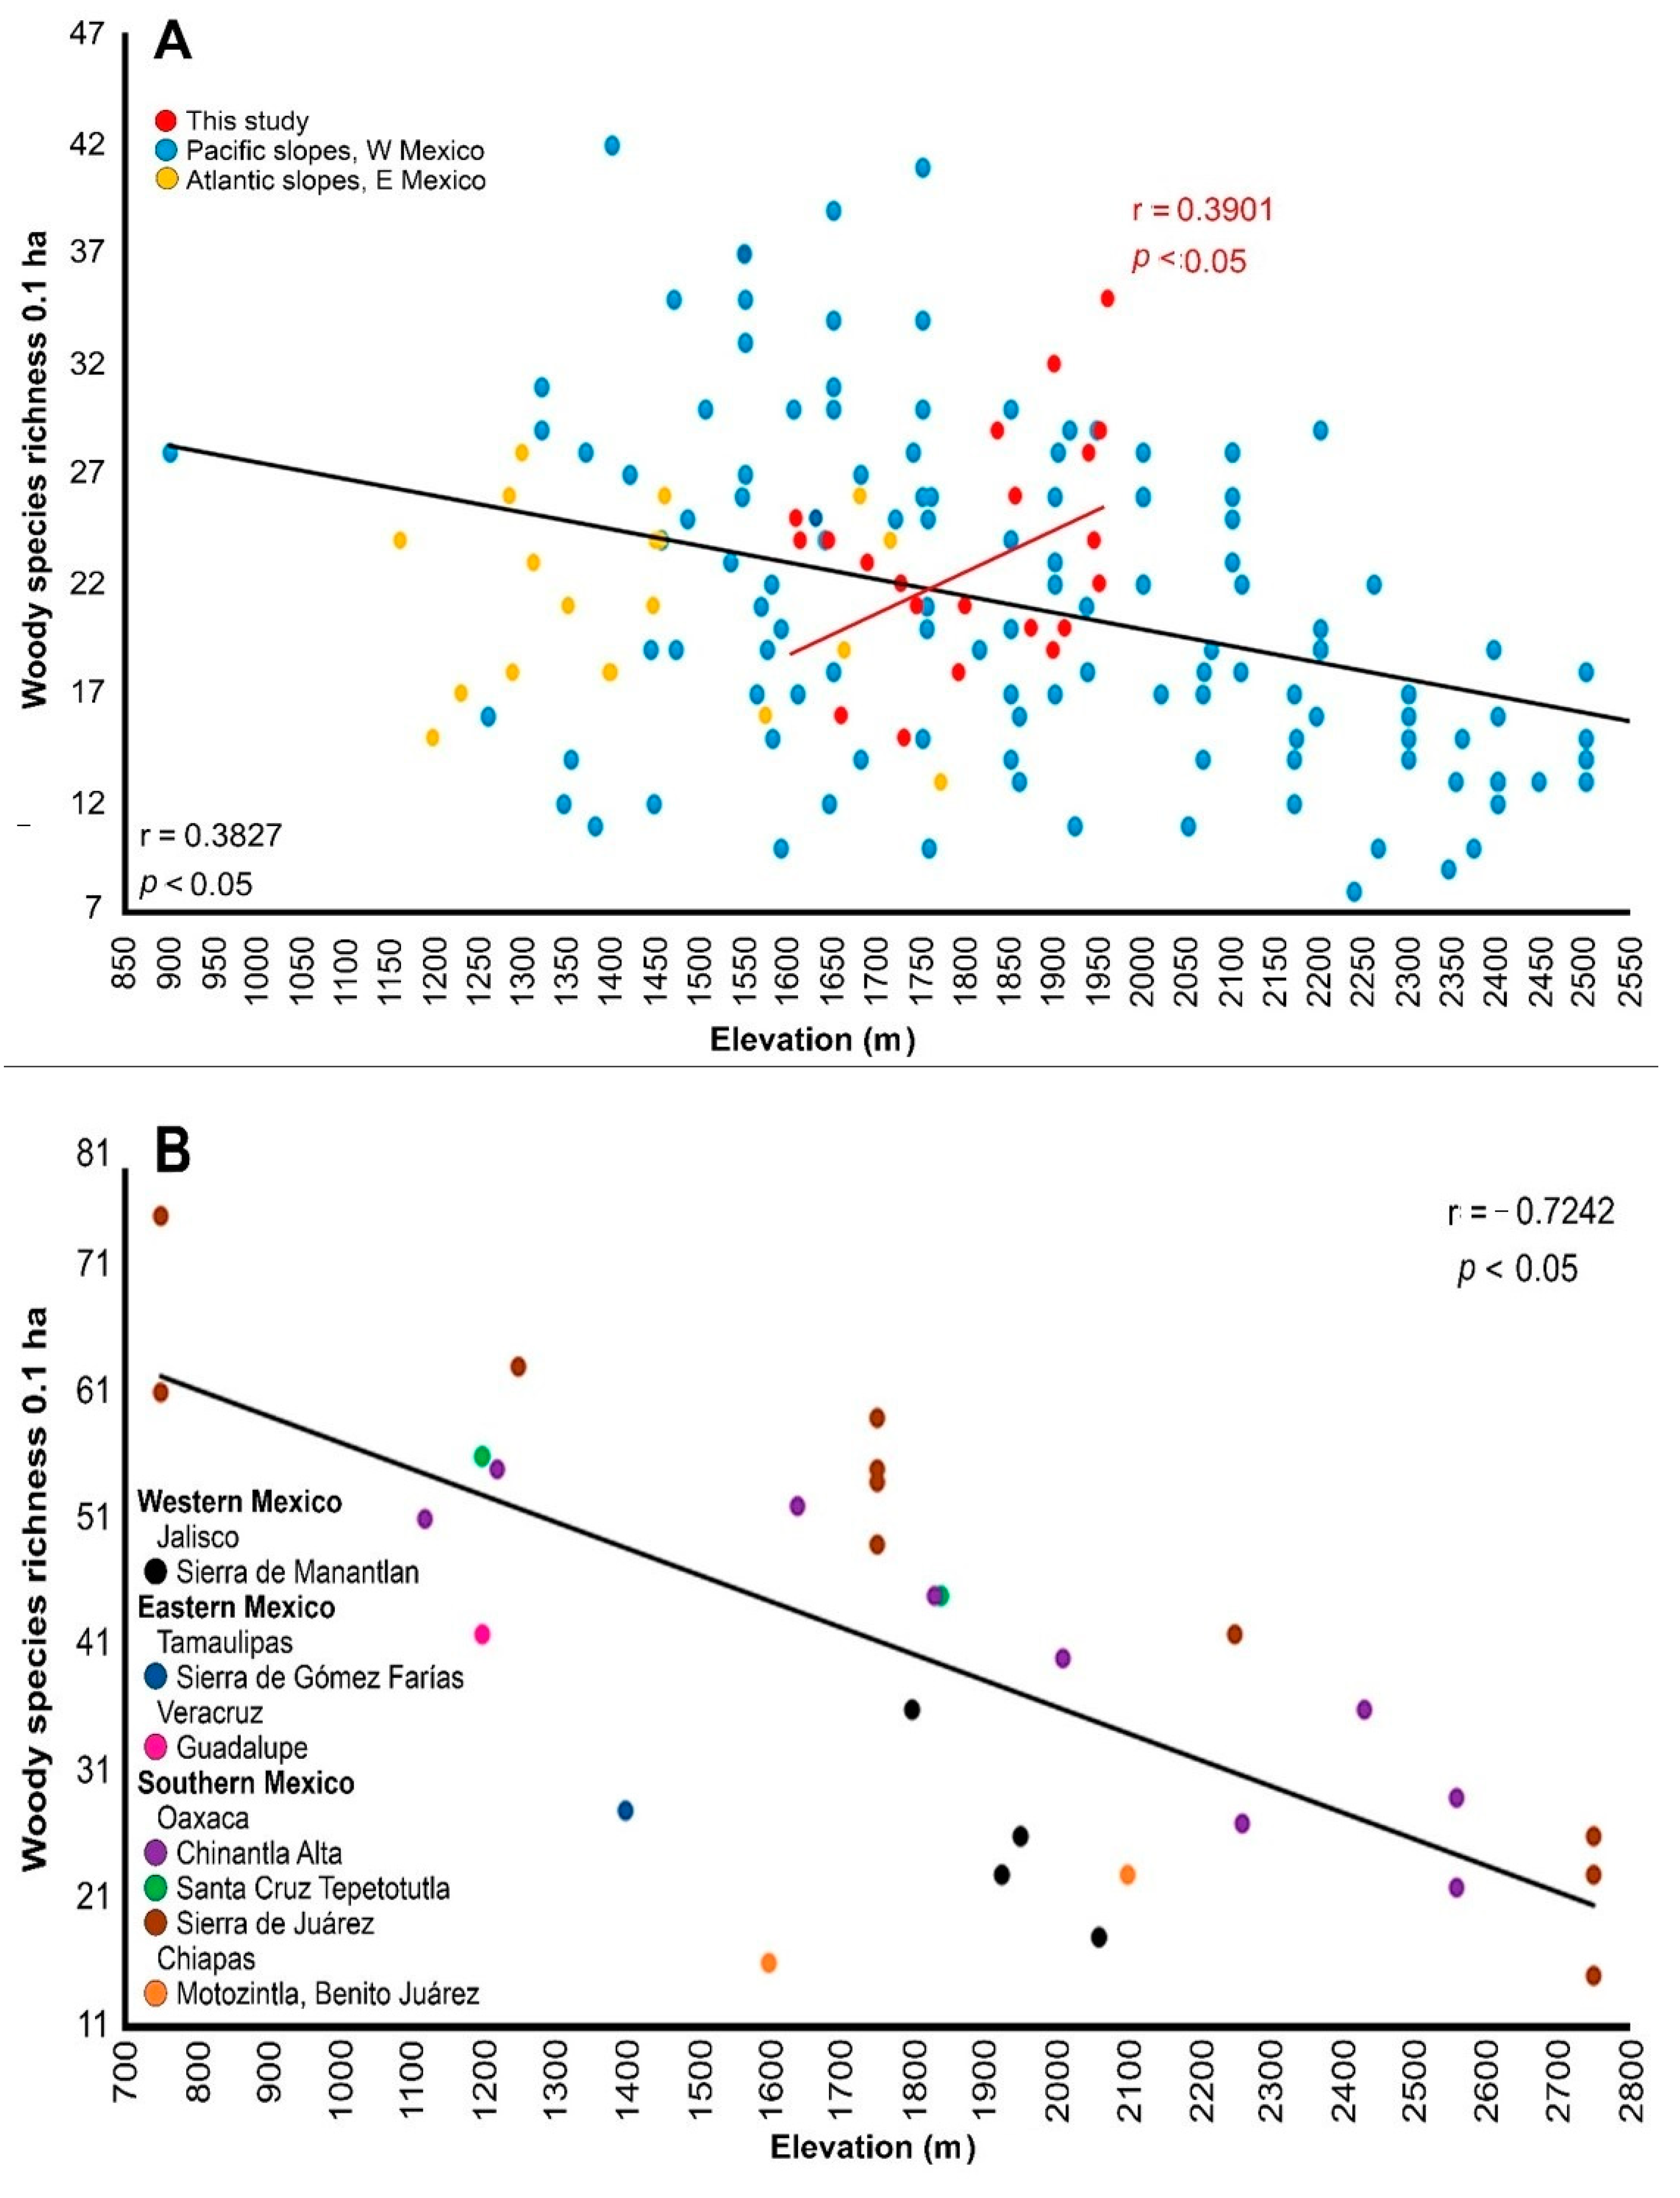
3.3. Diversity
3.4. Structure
3.5. Endemism and Conservation
4. Discussion
4.1. Environmental Community Drivers
4.2. Cloud Forest Types and Relationships
4.3. Diversity
4.3.1. Alpha Diversity
4.3.2. Family Shifts Along Elevation
4.3.3. β-Diversity
4.3.4. γ-Diversity
4.3.5. Floristic Affinities
4.4. Endemism and Conservation
5. Conclusions
Supplementary Materials
Author Contributions
Funding
Acknowledgments
Conflicts of Interest
References
- Gentry, A.H. Changes in plant community diversity and floristic composition on environmental and geographical gradients. Ann. Missouri Bot. Gard. 1988, 75, 1–34. [Google Scholar] [CrossRef]
- LaBastille, A.; Pool, D.J. On the need for a system of cloud-forest parks in Middle America and the Caribbean. Environ. Conserv. 1978, 5, 183–190. [Google Scholar] [CrossRef]
- Luna-Vega, I.; Morrone, J.J.; Ayala, O.A.; Organista, D.E. Biogeographical affinities among Neotropical cloud forests. Plant Syst. Evol. 2001, 228, 229–239. [Google Scholar] [CrossRef]
- Puig, H.; Bracho, R.; Sosa, V. Composición florística y estructura del bosque mesófilo en Gómez Farías, Tamaulipas, México. Biotica 1983, 8, 339–359. [Google Scholar]
- Ramírez-Marcial, N. Diversidad florística del bosque mesófilo en el norte de Chiapas y su relación con México y Centroamérica. Boletín Soc. Botánica México 2001, 69, 63–76. [Google Scholar] [CrossRef]
- Ruiz-Jiménez, C.A.; Téllez-Valdés, O.; Luna-Vega, I. Clasificación de los bosques mesófilos de montaña de México: Afinidades de la flora. Rev. Mex. Biodivers. 2012, 83, 1110–1144. [Google Scholar] [CrossRef] [Green Version]
- Rzedowski, J. Vegetación de México, 1st ed.; Comisión Nacional para el Conocimiento y Uso de la Biodiversidad: Mexico City, Mexico, 2006; p. 504. [Google Scholar]
- Vázquez-García, J.A. Cloud Forest Archipelagos: Preservation of Fragmented Montane Ecosystems in Tropical America. In Tropical Montane Cloud Forests; Hamilton, L., Scatena, F.N., Juvik, J.O., Eds.; Springer: New York, NY, USA, 1995; pp. 315–332. [Google Scholar]
- Challenger, A. Utilización y Conservación de los Ecosistemas Terrestres de México: Pasado Presente y Futuro, 1st ed.; Comisión Nacional para el Conocimiento y uso de la Biodiversidad: Mexico City, Mexico, 1998; p. 847. [Google Scholar]
- Atucha, A.; Merwin, I.A.; Purohit, C.K.; Brown, M.G. Nitrogen dynamics and nutrient budgets in four orchard groundcover management systems. HortScience 2011, 46, 1184–1193. [Google Scholar] [CrossRef] [Green Version]
- Bravo-Espinosa, M.; Mendoza, M.E.; Carlón Allende, T.; Medina, L.; Sáenz-Reyes, J.T.; Páez, R. Effects of converting forest to avocado orchards on topsoil properties in the trans-Mexican volcanic system, Mexico. L. Degrad. Dev. 2014, 25, 452–467. [Google Scholar] [CrossRef]
- Ortíz-Pérez, M.A.; Hernández-Santana, J.R.; Figueroa Mah-Eng, J.M. Reconocimiento Fisiográfico y Geomorfológico. In Biodiversidad de Oaxaca; García-Mendoza, A.J., Ordóñez, M.J., Briones-Salas, M., Eds.; Instituto de Biologia, Universidad Nacional Autonoma de Mexico: Mexico City, Mexico, 2004; pp. 43–54. [Google Scholar]
- Caballero, J.; Cortés, L.; Martínez-Alfaro, M.Á.; Lira-Saade, R. Uso y Manejo tradicional de la Diversidad Vegetal. In Biodiversidad de Oaxaca; García-Mendoza, A.J., Ordóñez, M.d.J., Briones-Salas, M., Eds.; Instituto de Biologia, Universidad Nacional Autonoma de Mexico: Mexico City, Mexico, 2004; pp. 541–564. [Google Scholar]
- Rzedowski, J.; Palacios-Chávez, R. El bosque de Engelhardtia (Oreomunnea) mexicana en la región de la Chinantla (Oaxaca, México). Una reliquia del Cenozoico. Bot. Sci. 1977, 36, 93–127. [Google Scholar] [CrossRef]
- Arellanes, Y. Análisis Estructural de un Bosque Mesófilo de Montaña de Ticodendron incognitum en la Sierra Norte de Oaxaca, México. Bachelor’s Thesis, Universidad Nacional Autónoma de México, Mexico City, Mexico, 2000. [Google Scholar]
- Ruiz-Jiménez, C.A.; Meave, J.; Contreras-Jiménez, J.L. El bosque mesófilo de la región de Puerto Soledad (Oaxaca), México: Análisis estructural. Bot. Sci. 1999, 65, 23–37. [Google Scholar] [CrossRef] [Green Version]
- Boyle, B.L. Changes on Altitudinal and Latitudinal Gradients in Neotropical Montane Forests. Ph.D. Thesis, Washington University, St. Louis Missouri, MO, USA, 1996. [Google Scholar]
- Lorea, F.; Munn, X. Estudio Florístico de los Bosques Mesófilos de la Sierra Mazateca de Oaxaca, México; Inf. Técnico Final; Instituto de Ecologia Xalapa, Veracruz/CONABIO: Mexico City, Mexico, 2005. [Google Scholar]
- Rincón Gutiérrez, A.A. Estructura y Composición Florística de los Bosques Tropicales Húmedos de Montaña de Santa Cruz Tepetotutla, Oaxaca, México. Bachelor’s Thesis, Universidad Nacional Autónoma de México, Mexico City, Mexico, 2007. [Google Scholar]
- González-Espinosa, M.; Meave, J.A.; Lorea-Hernández, F.G.; Ibarra-Manríquez, G.; Newton, A.C. The Red List of Mexican Cloud Forest Trees; Fauna and Flora International: Cambridge, UK, 2011; pp. 1–149. [Google Scholar]
- Rivers, M.; Beech, E.; Murphy, L.; Oldfield, S. The Red List of Magnoliaceae-Revised and Extended; Botanic Gardens Conservation International: Richmond, UK, 2016; p. 60. [Google Scholar]
- SEMARNAT. Secretaria del Medio Ambiente y Recursos Naturales. Norma Oficial Mexicana NOM-059-SEMARNAT-2010. Protección Ambiental-Especies Nativas de México de Flora y Fauna Silvestres-Categorías de Riesgo y Especificaciones para su Inclusión, Exclusión o Cambio—Lista de Especies en Riesgo; Diario Oficial de la Federacion: Mexico City, Mexico, 2010; p. 178. [Google Scholar]
- Vázquez-G, J.A. Magnolia (Magnoliaceae) in Mexico and Central America: A synopsis. Brittonia 1994, 46, 1–23. [Google Scholar] [CrossRef]
- Vázquez-García, J.A.; Neill, D.A.; Asanza, M.; Pérez, Á.J.; Arroyo, F.; Dahua-Machoa, A.; Merino-Santi, R.E. Magnolias de Ecuador: En Riesgo de Extinción; Universidad Estatal Amazónica: Puyo, Ecuador, 2016; p. 66. [Google Scholar]
- Wang, Y.; Liu, B.; Nie, Z.; Chen, H.; Chen, F.; Figlar, R.B.; Wen, J. Major clades and a revised classification of Magnolia and Magnoliaceae based on whole plastid genome sequences via genome skimming. J. Syst. Evol. 2020, 58, 673–695. [Google Scholar] [CrossRef]
- Howard, R.A. The Morphology and Systematics of the West Indian Magnoliaceae. Bull. Torrey Bot. Club 1948, 75, 335–357. [Google Scholar] [CrossRef]
- Vázquez-García, J.A.; Muñiz-Castro, M.Á.; Arroyo, F.; Pérez, Á.J.; Serna, M.; Cuevas-Guzmán, R.; Domínguez-Yescas, R.; De Castro-Arce, E.; Gurrola-Díaz, C.M. Novelties in neotropical Magnolia and an addendum proposal to the IUCN Red List of Magnoliaceae. In Recursos Forestales en el Occidente de México; Salcedo-Pérez, E., Hernández-Álvarez, E., Vázquez-García, J.A., Escoto, T.-G., Echavarría, N.D., Eds.; Universidad de Guadalajara: Guadalajara, Mexico, 2013; pp. 461–496. [Google Scholar]
- Vázquez-García, J.A.; Domínguez-Yescas, R.; Pedraza-Ruiz, R.; Sánchez-González, A.; Muñiz-Castro, M.Á. Magnolia rzedowskiana (Magnoliaceae), a new species from the section Macrophylla in the central part of the Sierra Madre Oriental, Mexico. Acta Bot. Mex. 2015, 2015, 19–36. [Google Scholar] [CrossRef] [Green Version]
- Vázquez-García, J.A.; Domínguez-Yescas, R.; Velazco-Macías, C.; Shalisko, V.; Merino-Santi, R.E. Magnolia nuevoleonensis sp. nov. (Magnoliaceae) from northeastern Mexico and a key to species of section Macrophylla. Nord. J. Bot. 2016, 34, 48–53. [Google Scholar] [CrossRef]
- Velazco-Macías, C.G.; Foroughbakhch-Pournavab, R.; Alanís-Flores, G.J.; Alvarado-Vázquez, M.A. Magnolia dealbata en Nuevo León, México. Rev. Mex. Biodivers. 2008, 79, 459–463. [Google Scholar]
- Domínguez-Yescas, R. Estudio Etnobiológico de Magnolia dealbata Zucc. San Juan Juquila Vijanos, Oaxaca. Bachelor’s Thesis, Universidad de la Sierra de Juárez, Ixtlán de Juárez, México, 2012. [Google Scholar]
- Rodríguez-Ramírez, E.C.; Vázquez-García, J.A.; García-González, I.; Alcántara-Ayala, O.; Luna-Vega, I. Drought effects on the plasticity in vessel traits of two endemic magnolia species in the tropical montane cloud forests of eastern Mexico. J. Plant Ecol. 2020, 13, 331–340. [Google Scholar] [CrossRef]
- Austin, M.P. Continuum concept, ordination methods, and niche theory. Annu. Rev. Ecol. Syst. 1985, 16, 39–61. [Google Scholar] [CrossRef]
- Stohlgren, T.J.; Bachand, R.R. Lodgepole pine (Pinus contorta) ecotones in rocky mountain national park, Colorado, USA. Ecology 1997, 78, 632–641. [Google Scholar] [CrossRef]
- Ter Braak, C.J.F.; Prentice, I.C. A Theory of Gradient Analysis. In Advances in Ecological Research; Begon, M., Fitter, A.H., Ford, E.D., Macfadyen, A., Eds.; Academic Press: London, UK, 1988; pp. 271–317. [Google Scholar]
- Whittaker, R.H. Evolution and measurement of species diversity. Taxon 1972, 21, 213–251. [Google Scholar] [CrossRef] [Green Version]
- Whittaker, R.H. Ordination and Classification of Communities. In Handbook of Vegetation Science; Springer: The Hague, The Netherlands, 1973; p. 737. [Google Scholar]
- Whittaker, R.H. Communities and Ecosystems, 2nd ed.; MacMillan Publishing Co.: New York, NY, USA, 1975; p. 385. [Google Scholar]
- Bray, J.R.; Curtis, J.T. An ordination of the upland forest communities of southern Wisconsin. Ecol. Monogr. 1957, 27, 325–349. [Google Scholar] [CrossRef]
- Ter Braak, C.J.F.; Prentice, I.C. A theory of gradient analysis. Adv. Ecol. Res. 2004, 34, 235–282. [Google Scholar]
- Ter Braak, C.J.F. Canonical correspondence analysis: A new eigenvector technique for multivariate direct gradient analysis. Ecology 1986, 67, 1167–1179. [Google Scholar] [CrossRef] [Green Version]
- Beals, E.W. Bray-Curtis Ordination: An Effective Strategy for Analysis of Multivariate Ecological Data. In Advances in Ecological Research; Macfadyen, A., Ford, E.D., Eds.; Academic Press: London, UK, 1984; p. 55. [Google Scholar]
- Faith, D.P.; Minchin, P.R.; Belbin, L. Compositional dissimilarity as a robust measure of ecological distance. Vegetatio 1987, 69, 57–68. [Google Scholar] [CrossRef]
- Palmer, M.W. Putting things in even better order: The advantages of canonical correspondence analysis. Ecology 1993, 74, 2215–2230. [Google Scholar] [CrossRef]
- Van der Maarel, E. The Braun-Blanquet approach in perspective. Vegetatio 1975, 30, 213–219. [Google Scholar] [CrossRef]
- Hoekstra, T.W.; Flather, C.H. Implicit scaling in ecological research. Bioscience 1991, 41, 148–154. [Google Scholar] [CrossRef]
- Vázquez-García, J.A.; Muñiz-Castro, M.A.; Cuevas-Guzmán, R.; Vargas-Rodríguez, Y.L.; Sahagún-Godínez, E.; Luquín-Sánchez, H.; Cisneros-Lepe, E.A.; Reynoso-Dueñas, J.; Nieves-Hernández, G. Diversidad Alfa de Especies leñosas en Relación con Gradientes Ambientales: Panorámica Preliminar en el Occidente de México y en Mesoamérica a la Escala de 0.1 ha. In Recursos Forestales del Occidente de México: Diversidad, Manejo, Producción, Aprovechamiento y Conservación; Salcedo-Pérez, E., Hernández-Álvarez, E., Vázquez-García, J., Antonio, E.-G., Teofilo, D.-E.N., Eds.; Universidad de Guadalajara: Guadalajara, México, 2012; pp. 5–22. [Google Scholar]
- Al-Shehri, M.A.; El-Sheikh, M.A.; Al-Farhan, A.H.; Arif, I.A.; Rajakrishnan, R.; Alatar, A.A.; Faisal, M.; Basahi, R.A.; Al-Abbadi, G.A. Ecology of endangered Prunus korshinskyi Hand.-Mazz. in Jabal Al-Lauz, Saudi Arabia: Plant associations, size structure, and nutritional screening. Saudi J. Biol. Sci. 2020, 27, 147–156. [Google Scholar] [CrossRef]
- Clinebell, R.R.; Phillips, O.L.; Gentry, A.H.; Stark, N.; Zuuring, H. Prediction of neotropical tree and liana species richness from soil and climatic data. Biodivers. Conserv. 1995, 4, 56–90. [Google Scholar] [CrossRef]
- Huston, M. Soil nutrients and tree species richness in Costa Rican forests. J. Biogeogr. 1980, 7, 147–157. [Google Scholar] [CrossRef]
- Nieves-Hernández, G.; Vázquez-García, J.A.; Vargas-Rodríguez, Y.L.; García-Vázquez, M.; González-Gallegos, J.G. Small-scale environmental gradients in a pine-oak forest community in Nueva Colonia, Mezquitic, Jalisco, Mexico. Polibotánica 2009, 27, 31–52. [Google Scholar]
- Guerrero-Hernández, R.; Muñiz-Castro, M.Á.; Vázquez-García, J.A.; Ruiz-Corral, J.A. Estructura del bosque mesófilo de montaña y su reemplazo por bosque de Abies en dos gradientes altitudinales del occidente de México. Bot. Sci. 2019, 97, 301–322. [Google Scholar] [CrossRef]
- Kitayama, K. An altitudinal transect study of the vegetation on Mount Kinabalu, Borneo. Vegetatio 1992, 102, 149–171. [Google Scholar] [CrossRef]
- Lieberman, D.; Lieberman, M.; Peralta, R.; Hartshorn, G.S. Tropical forest structure and composition on a large-scale altitudinal gradient in Costa Rica. J. Ecol. 1996, 84, 137–152. [Google Scholar] [CrossRef]
- Sahagún-Godínez, E. Ordenación del Bosque Mesófilo en el Cerro de La Mona, Sierra de Coalcomán, México, en el Contexto del Cambio Climático. Ph.D. Thesis, Universidad de Guadalajara, Zapopan, Mexico, 2004. [Google Scholar]
- Vázquez-García, J.A.; Givnish, T.J. Altitudinal gradients in tropical forest composition, structure, and diversity in the Sierra de Manantlán. J. Ecol. 1998, 86, 999–1020. [Google Scholar]
- Vázquez-García, J.A.; Vargas-Rodriguez, Y.L.; Aragón, F. Descubrimiento de un bosque de Acer-Podocarpus-Abies en el municipio de Talpa de Allende, Jalisco, México. Boletín Inst. Botánica Univ. Guadalaj. 2000, 7, 159–183. [Google Scholar]
- Williams-Linera, G.; Toledo-Garibaldi, M.; Hernández, C.G. How heterogeneous are the cloud forest communities in the mountains of central Veracruz, Mexico? Plant Ecol. 2013, 214, 685–701. [Google Scholar] [CrossRef]
- Al Harthy, L.; Grenyer, R. Classification and ordination of the main plant communities of the Eastern Hajar Mountains, Oman. J. Arid Environ. 2019, 169, 1–18. [Google Scholar] [CrossRef]
- Beaman, J.H.; Beaman, R.S. Diversity and distribution patterns in the flora of Mount Kinabalu. In The Plant Diversity of Malesia; Baas, P., Kalkman, K., Geesink, R., Eds.; Kluwer Academic Publishers: Dordrecht, The Netherlands, 1990; pp. 147–160. [Google Scholar]
- Rodríguez-González, J.P. Estructura y Diversidad de las Comunidades de Especies Leñosas de Bosque Mesófilo de Montaña a lo Largo de un Gradiente Altitudinal en la Sierra de Cacoma, Talpa de Allende, Jalisco. Master’s Thesis, Universidad de Guadalajara, Zapopan, Mexico, 2015. [Google Scholar]
- Terborgh, J.; Foster, R.B.; Percy, N.V. Tropical tree communities: A test of the nonequilibrium hypothesis. Ecology 1996, 77, 561–567. [Google Scholar] [CrossRef]
- Phillips, O.L.; Hall, P.; Gentry, A.H.; Sawyer, S.A.; Vasquez, R. Dynamics and species richness of tropical rain forests. Proc. Natl. Acad. Sci. USA 1994, 91, 2805–2809. [Google Scholar] [CrossRef] [Green Version]
- Olvera-Vargas, M.; Figueroa-Rangel, B.L.; Vázquez-López, J.M. Is there environmental differentiation in the Quercus-dominated forests of west-central Mexico? Plant Ecol. 2010, 211, 321–335. [Google Scholar] [CrossRef]
- Toledo-Garibaldi, M.; Williams-Linera, G. Tree diversity patterns in successive vegetation types along an elevation gradient in the Mountains of Eastern Mexico. Ecol. Res. 2014, 29, 1097–1104. [Google Scholar] [CrossRef]
- Palacios Chávez, R.; Rzedowski Rotter, J. Estudio palinológico de las floras fósiles del Mioceno inferior y principios del Mioceno medio de la región de Pichucalco, Chiapas, México. Acta Botánica Mex. 1993, 24, 1–96. [Google Scholar] [CrossRef] [Green Version]
- Puig, H.; Bracho, R.; Sosa, V.J. El bosque mesofilo de Montaña: Composicion floristica y estructura. In El Bosque Mesófilo de Montaña de Tamaulipas; Puig, E., Bracho, R., Eds.; Instituto de Ecología: Mexico City, Mexico, 1987; pp. 55–79. [Google Scholar]
- Cruz-Peña, N. Estructura, Diversidad y Distribución de Comunidades de Bosque Mesófilo de Montaña y de Abies en un Gradiente Altitudinal del Volcán Nevado de Colima y su Vulnerabilidad ante el Cambio Climático. Master’s Thesis, Universidad de Guadalajara, Zapopan, Mexico, 2017. [Google Scholar]
- Vazquez-García, J.A.; Givnish, T.J. Vegetation of the cerro Grande massif, Sierra de Manantlan, Mexico: Ordination of a long altitudinal gradient with high species turnover. Bol. Inst. Bot. Univ. Guadalaj. 2000, 6, 227–250. [Google Scholar]
- McCain, C.M.; Grytnes, J. Elevational Gradients in Species Richness. In Encyclopedia of Life Sciences (ELS); John Wiley & Sons, Ltd.: Chichester, UK, 2010; pp. 1–10. [Google Scholar]
- Eilertsen, O.; Okland, R.H.; Okland, T.; Pedersen, O. Data manipulation and gradient length estimation in DCA ordination. J. Veg. Sci. 1990, 1, 261–270. [Google Scholar] [CrossRef]
- Hirst, C.N.; Jackson, D.A. Reconstructing community relationships: The impact of sampling error, ordination approach, and gradient length. Divers. Distrib. 2007, 13, 361–371. [Google Scholar] [CrossRef]
- INEGI; Instituto Nacional de Estadística y Geografía. Prontuario de Información Geográfica Municipal de los Estados Unidos Mexicanos. San Juan JuquilaVijanos, Oaxaca, 1st ed.; Instituto Nacional de Estadística y Geografía: Mexico City, Mexico, 2005; p. 8. [Google Scholar]
- Centeno-García, E. Configuración Geológica del Estado. In Biodiversidad de Oaxaca; García-Mendoza, A.J., Ordóñez, M.J., Briones-Salas, M., Eds.; Instituto de Biologia, Universidad Nacional Autonoma de Mexico: Mexico City, Mexico, 2004; pp. 29–42. [Google Scholar]
- Argote, L.A.D. Geología preliminar de la secuencia volcanosedimentaria y serpentinitas asociadas del Jurásico (?) del área de Cuicatlán-Concepción Pápalo, Oaxaca. Rev. Mex. Ciencias Geol. 1988, 7, 127–135. [Google Scholar]
- Del Castillo, R.F.; Ríos, M.A.P. Changes in seed rain during secondary succession in a tropical montane cloud forest region in Oaxaca, Mexico. J. Trop. Ecol. 2008, 24, 433–444. [Google Scholar] [CrossRef] [Green Version]
- Bautista Cruz, A.; del Castillo Sánchez, R.F.; Gutiérrez Castorena, C. Patrones de desarrollo del suelo asociados con sucesión secundaria en un área originalmente ocupada por bosque mesófilo de montaña. Ecosistemas 2003, 3, 1–8. [Google Scholar]
- Bautista-Cruz, A.; Del Castillo, R.F. Soil changes during secondary succession in a tropical montane cloud forest area. Soil Sci. Soc. Am. J. 2005, 69, 906–914. [Google Scholar] [CrossRef]
- Cordova, J.; Del Castillo, R.F. Changes in epiphyte cover in three chronosequences in a tropical montane cloud forest in Mexico. Life Forms Dyn. Trop. For. J. Cramer Gerbrüder Borntraeger Verl. Berlin 2001, 346, 79–94. [Google Scholar]
- Webster, G.L. The Panorama of Neotropical Cloud Forests. In Biodiversity and Conservation of Neotropical Montane Forest; Churchill, S.P., Balslev, H., Forero, E., Luteyn, J.L., Eds.; The New York Botanical Garden: New York, NY, USA, 1995; pp. 53–78. [Google Scholar]
- Blanco-Macias, A.M. Análisis Sucesional del Bosque Mesófilo de Montaña en El Rincón, Sierra Norte de Oaxaca. Bachelor’s Thesis, Facultad de Estudios Superiores Iztacala, Los Reyes Iztacala, Mexico, 2001. [Google Scholar]
- Del Castillo, R.F.; Blanco-Macías, A. Secondary Succession under a Slash-and-burn Regime in a Tropical Montane Cloud Forest: Soil and Vegetation Characteristics. In Biodiversity Loss and Conservation in Fragmented Forest Landscapes. The Forests of Montane Mexico and Temperate South America; Newton, A., Ed.; CABI: Wallingford, UK, 2007; pp. 158–180. [Google Scholar]
- Tropicos.org. Missouri Botanical Garden. Available online: http://www.tropicos.org>/ (accessed on 20 February 2019).
- POWO. Plants of the World Online. Bringing Kew’s Science Data Online by 2020 Home Page. Available online: http://www.plantsoftheworldonline.org/ (accessed on 20 February 2019).
- IPNI. International Plant Name Index Home Page. Available online: https://www.ipni.org/ (accessed on 21 February 2019).
- Hijmans, R.J.; Cameron, S.E.; Parra, J.L.; Jones, P.G.; Jarvis, A. Very high resolution interpolated climate surfaces for global land areas. Int. J. Climatol. 2005, 25, 1965–1978. [Google Scholar] [CrossRef]
- McCune, B.; Keon, D. Equations for potential annual direct incident radiation and heat load. J. Veg. Sci. 2002, 13, 603–606. [Google Scholar] [CrossRef]
- SEMARNAT. Norma Oficial Mexicana NOM-021-RECNAT-2000. Especificaciones de Fertilidad, Salinidad y Clasificación de Suelos, Estudio, Muestreo y Análisis; Secretaría del Medio Ambiente y Recursos Naturales: Mexico City, Mexico, 2002; p. 85. [Google Scholar]
- Walkley, A.; Black, I.A. An examination of the Degtjareff method for determining soil organic matter, and a proposed modification of the chromic acid titration method. Soil Sci. 1934, 37, 29–38. [Google Scholar] [CrossRef]
- Bradstreet, R.B. Kjeldahl method for organic nitrogen. Anal. Chem. 1954, 26, 185–187. [Google Scholar] [CrossRef]
- Frazer, G.W.; Canham, C.D.; Lertzman, K.P. Gap Light Analyzer (GLA), Version 2.0: Imaging Software to Extract Canopy Structure and Gap Light Transmission Indices from True-Colour Fisheye Photographs, Users Manual and Program Documentation, 1st ed.; Simon Fraser University, Burnaby, British Columbia, and the Institute of Ecosystem Studies: Millbrook, NY, USA, 1999; 40p. [Google Scholar]
- Frazer, G.W.; Fournier, R.A.; Trofymow, J.A.; Hall, R.J. A comparison of digital and film fisheye photography for analysis of forest canopy structure and gap light transmission. Agric. For. Meteorol. 2001, 109, 249–263. [Google Scholar] [CrossRef]
- Roxburgh, J.R.; Kelly, D. Uses and limitations of hemispherical photography for estimating forest light environments. N. Zealand J. Ecol. 1995, 19, 213–217. [Google Scholar]
- Mir, A.H.; Upadhaya, K.; Odyuo, N.; Tiwari, B.K. Rediscovery of Magnolia rabaniana (Magnoliaceae): A threatened tree species of Meghalaya, northeast India. J. Asia-Pac. Biodivers. 2017, 10, 127–131. [Google Scholar] [CrossRef]
- Roberts, D.W. Comparison of distance-based and model-based ordinations. Ecology 2020, 101, e02908. [Google Scholar] [CrossRef]
- McCune, B.; Grace, J.B.; Urban, D.L. Analysis of Ecological Communities; MjM Software Design: Gleneden Beach, OR, USA, 2002; 307p. [Google Scholar]
- McCune, B.; Mefford, J.M. PC-ORD. Multivariate Analysis of Ecological Data, Version 7, 1st ed.; MjM Software Design: Gleneden Beach, OR, USA, 2016; p. 20. [Google Scholar]
- Jupke, J.F.; Schäfer, R.B. Should ecologists prefer model- over distance-based multivariate methods? Ecol. Evol. 2020, 10, 2417–2435. [Google Scholar] [CrossRef]
- Legendre, P.; Anderson, M.J. Distance-based redundancy analysis: Testing multispecies responses in multifactorial ecological experiments. Ecol. Monogr. 1999, 69, 1–24. [Google Scholar] [CrossRef]
- Dufrêne, M.; Legendre, P. Species assemblages and indicator species: The need for a flexible asymmetrical approach. Ecol. Monogr. 1997, 67, 345–366. [Google Scholar] [CrossRef]
- Tichy, L.; Chytry, M. Statistical determination of diagnostic species for site groups of unequal size. J. Veg. Sci. 2006, 17, 809–818. [Google Scholar] [CrossRef]
- IUCN. The IUCN Red List of Threatened Species. Available online: https://www.iucnredlist.org/ (accessed on 12 April 2020).
- Bailey, S.W.; Horsley, S.B.; Long, R.P.; Hallett, R.A. Influence of edaphic factors on sugar maple nutrition and health on the Allegheny Plateau. Soil Sci. Soc. Am. J. 2004, 68, 243–252. [Google Scholar] [CrossRef]
- Djordjević, V.; Tsiftsis, S.; Lakušić, D.; Jovanović, S.; Stevanović, V. Factors affecting the distribution and abundance of orchids in grasslands and herbaceous wetlands. Syst. Biodivers. 2016, 14, 355–370. [Google Scholar] [CrossRef]
- Djordjević, V.; Tsiftsis, S.; Lakušić, D.; Jovanović, S.; Jakovljević, K.; Stevanović, V. Patterns of distribution, abundance and composition of forest terrestrial orchids. Biodiv. Conserv. 2020, 29, 1–24. [Google Scholar] [CrossRef]
- Rodriguez-Ramirez, E.C.; Sanchez-Gonzalez, A.; Angeles-Perez, G. Relationship between vegetation structure and microenvironment in Fagus grandifolia subsp. mexicana forest relicts in Mexico. J. Plant Ecol. 2018, 11, 237–247. [Google Scholar] [CrossRef] [Green Version]
- Dames, J.F.; Scholes, M.C.; Straker, C.J. Litter production and accumulation in Pinus patula plantations of the Mpumalanga Province, South Africa. Plant Soil 1998, 203, 183–190. [Google Scholar] [CrossRef]
- Lilienfein, J.; Wilcke, W.; Ayarza, M.A.; Vilela, L.; do Carmo Lima, S.; Zech, W. Soil acidification in Pinus caribaea forests on Brazilian savanna Oxisols. For. Ecol. Manag. 2000, 128, 145–157. [Google Scholar] [CrossRef]
- Urrego, J.B. La reforestación con coníferas y sus efectos sobre la acidificación, podsolización y pérdida de fertilidad en los suelos (parte I). Inf. Agron 1997, 28, 6–12. [Google Scholar]
- Sánchez, M.A.V.; Barra, J.D.E. Relación entre el uso de la tierra y su fertilidad en las laderas de la Sierra Norte de Oaxaca, México. Agrociencia 2006, 40, 557–567. [Google Scholar]
- Brady, N.C.; Weil, R.R. The Nature and Properties of Soils, 13th ed.; Prentice Hall: Upper Saddle River, NJ, USA, 2007; 1071p. [Google Scholar]
- Noble, A.D.; Gillman, G.P.; Ruaysoongnern, S. A cation exchange index for assessing degradation of acid soil by further acidification under permanent agriculture in the tropics. Eur. J. Soil Sci. 2000, 51, 233–243. [Google Scholar] [CrossRef]
- Djordjevi´c, V.; Tsiftsis, S. The role of Ecological Factors in Distribution and Abundance of Terrestrial Orchids. In Orchids Phytochemistry, Biology and Horticulture; Reference Series in Phytochemistry; Mérillion, J.-M., Kodja, H., Eds.; Springer International Publishing: Basel, Switzerland, 2020; pp. 1–71. [Google Scholar]
- Bruijnzeel, L.A.; Proctor, J. Hydrology and Biogeochemistry of Tropical Montane Cloud Forests: What Do We Really Know. In Tropical Montane Cloud Forests; Hamilton, L.S., Juvik, J.O., Scatena, F.N., Eds.; Springer: New York, NY, USA, 1995; Volume 110, pp. 38–78. [Google Scholar]
- Williams-Linera, G. Tree species richness complementarity, disturbance and fragmentation in a Mexican tropical montane cloud forest. Biodivers. Conserv. 2002, 11, 1825–1843. [Google Scholar] [CrossRef]
- Meave, J.; Angel, S.M.; Calvo, I.L.M.; Paz, H.H.; Susana, V.A. Análisis sinecológico del bosque mesófilo de montaña de Omiltemi, Guerrero. Boletín Soc. Botánica México 1992, 52, 31–77. [Google Scholar]
- Santiago-Pérez, A.L.; Jardel-Peláez, E.J.; Cuevas-Guzmán, R.; Huerta-Martínez, F.M. Vegetación de bordes en un bosque mesófilo de montaña del occidente de México. Boletín Soc. Botánica México 2009, 85, 31–49. [Google Scholar] [CrossRef]
- Curtis, J.T.; McIntosh, R.P. An upland forest continuum in the prairie-forest border region of Wisconsin. Ecology 1951, 32, 476–496. [Google Scholar] [CrossRef]
- Naranjo-Luna, F.J. Ecología y Genética de Oreomunnea mexicana (Standl.) JF Leroy (Junglandaceae), Especie Relicto del Bosque de Niebla de la Sierra Juárez, Oaxaca. Master’s Thesis, Universidad de la Sierra de Juárez, Ixtlán de Juárez, Mexico, 2014. [Google Scholar]
- Alfonso-Corrado, C.; Naranjo-Luna, F.; Clark-Tapia, R.; Campos, J.E.; Rojas-Soto, O.R.; Luna-Krauletz, M.D.; Bodenhorn, B.; Gorgonio-Ramírez, M.; Pacheco-Cruz, N. Effects of environmental changes on the occurrence of Oreomunnea mexicana (Juglandaceae) in a biodiversity hotspot cloud forest. Forests 2017, 8, 216. [Google Scholar] [CrossRef]
- Meave, J.; Gallardo, C.; Rincón, A. Plantas leñosas raras del bosque mesófilo de montaña II. Ticodendron incognitum Gómez-Laurito & Gómez, P. (Ticodendraceae). Bot. Sci. 1996, 59, 149–152. [Google Scholar]
- Bhattarai, K.R.; Vetaas, O.R.; Grytnes, J.A. Fern species richness along a central Himalayan elevational gradient, Nepal. J. Biogeogr. 2004, 31, 389–400. [Google Scholar] [CrossRef]
- Funnell, D.; Parish, R. Mountain Environments and Communities, 1st ed.; Routtledge & Taylor & Francis Group: London, UK; New York, NY, USA, 2001; p. 339. [Google Scholar]
- Körner, C. Alpine Plant Life: Functional Plant Ecology of High Mountain Ecosystems; With 47 Tables; Springer: Berlin/Heidelberg, Germany; New York, NY, USA, 2003; ISBN 3540003479. [Google Scholar]
- Lomolino, M.V. Elevation gradients of species-density: Historical and prospective views. Glob. Ecol. Biogeogr. 2001, 10, 3–13. [Google Scholar] [CrossRef]
- Holdridge, L.R. Life Zone Ecology; Tropical Science Center: San Jose, Costa Rica, 1967. [Google Scholar]
- Grubb, P.J. Interpretation of the ‘Massenerhebung’effect on tropical mountains. Nature 1971, 229, 44–45. [Google Scholar] [CrossRef] [PubMed]
- Cirimwami, L.; Doumenge, C.; Kahindo, J.-M.; Amani, C. The effect of elevation on species richness in tropical forests depends on the considered lifeform: Results from an East African mountain forest. Trop. Ecol. 2019, 60, 473–484. [Google Scholar] [CrossRef] [Green Version]
- Kessler, M.; Parris, B.S.; Kessler, E. A comparison of the tropical montane pteridophyte floras of Mount Kinabalu, Borneo, and Parque Nacional Carrasco, Bolivia. J. Biogeogr. 2001, 28, 611–622. [Google Scholar] [CrossRef]
- Kessler, M.; Kluge, J.; Hemp, A.; Ohlemüller, R. A global comparative analysis of elevational species richness patterns of ferns. Glob. Ecol. Biogeogr. 2011, 20, 868–880. [Google Scholar] [CrossRef]
- Rahbek, C. The role of spatial scale and the perception of large-scale species-richness patterns. Ecol. Lett. 2005, 8, 224–239. [Google Scholar] [CrossRef]
- Grytnes, J.A.; Beaman, J.H. Elevational species richness patterns for vascular plants on Mount Kinabalu, Borneo. J. Biogeogr. 2006, 33, 1838–1849. [Google Scholar] [CrossRef]
- Gentry, A.H. Patterns of Diversity and Floristic Composition in Neotropical Montane Forests. In Biodiversity and Conservation of Neotropical Montane Forests; New York Botanical Garden: New York, NY, USA, 1995; pp. 103–126. [Google Scholar]
- Quedensley, T.S.; Bragg, T.B. The Asteraceae of northwestern Pico Zunil, a cloud forest in western Guatemala. Lundellia 2007, 2007, 49–70. [Google Scholar] [CrossRef]
- Shen, Y.; Li, C.; Zhou, S.; Pang, E.; Story, D.; Xue, C. Chemistry and Bioactivity of Flos Magnoliae, A Chinese Herb for Rhinitis and Sinusitis. Curr. Med. Chem. 2008, 15, 1616–1627. [Google Scholar] [CrossRef]
- Xiao-Tao, L.; Jiang-Xia, Y.; Jian-Wei, T. Diversity and composition of understory vegetation in the tropical seasonal rain forest of Xishuangbanna, SW China. Rev. Biol. Trop. 2011, 59, 455–463. [Google Scholar]
- Vogelmann, H.W. Fog precipitation in the cloud forests of eastern Mexico. Bioscience 1973, 23, 96–100. [Google Scholar] [CrossRef]
- Lawton, R.O.; Nair, U.S.; Pielke, R.A.; Welch, R.M. Climatic impact of tropical lowland deforestation on nearby montane cloud forests. Science 2001, 294, 584–587. [Google Scholar] [PubMed]
- Mbatudde, M.; Mucunguzi, P.; Lye, K.A. Diversity and distribution of Asteraceae along a rainfall gradient in Uganda. Afr. J. Ecol. 2007, 45, 52–56. [Google Scholar] [CrossRef]
- Gillman, L.N.; Wright, S.D.; Cusens, J.; McBride, P.D.; Malhi, Y.; Whittaker, R.J. Latitude, productivity and species richness. Glob. Ecol. Biogeogr. 2015, 24, 107–117. [Google Scholar] [CrossRef]
- Cevallos-Ferriz, S.R.S.; Ramírez, J.L. Bosquejo de la Evolución Florística. In Biodiversidad de Oaxaca; García-Mendoza, A.J., Ordóñez, M.J., Briones-Salas, M., Eds.; Instituto de Biologia, Universidad Nacional Autonoma de Mexico: Mexico City, Mexico, 2004; pp. 87–104. [Google Scholar]
- Graham, A. Factores Históricos de la Diversidad Biológica de México. In Diversidad Biológica de México: Orígenes y Distribución; Ramamoorthy, T.P., Bye, R., Lot, A., Fa, J., Eds.; Instituto de Biología, Universidad Nacional Autonoma de Mexico: Mexico City, Mexico, 1998; pp. 689–713. [Google Scholar]
- Rzedowski, J. El endemismo en la flora fanerogámica mexicana: Una apreciación analítica preliminar. Acta Bot. Mex. 1991, 15, 47–64. [Google Scholar] [CrossRef] [Green Version]
- Ferrusquilla-Villafranca., I. Geología de México. In Diversidad Biológica de México: Orígenes y Distribución; Ramamoorthy, T.P., Bye, R., Lot, A., Fa, J., Eds.; Instituto de Biología, Universidad Nacional Autonoma de Mexico: Mexico City, Mexico, 1998; pp. 3–108. [Google Scholar]
- Miranda, F.; Sharp, A.J. Characteristics of the vegetation in certain temperate regions of eastern Mexico. Ecology 1950, 31, 313–333. [Google Scholar] [CrossRef]
- Rodríguez-Correa, H.; Oyama, K.; Quesada, M.; Fuchs, E.J.; Quezada, M.; Ferrufino, L.; Valencia-Ávalos, S.; Cascante-Marín, A.; González-Rodríguez, A. Complex phylogeographic patterns indicate Central American origin of two widespread Mesoamerican Quercus (Fagaceae) species. Tree Genet. Genomes 2017, 13, 62. [Google Scholar] [CrossRef]
- Comisión Nacional para el Conocimiento y Uso de la Biodiversidad (CONABIO). El Bosque Mesófilo de Montaña en México: Amenazas y Oportunidades para su Conservación y Manejo Sostenible; Comisión Nacional para el Conocimiento y Uso de la Biodiversidad: Mexico City, Mexico, 2010; p. 197. [Google Scholar]
- Castellanos, S.A. Plantas vasculares raras, amenazadas, o en peligro de extinción del estado de Oaxaca, un panorama preliminar. Polibotánica 2002, 13, 47–82. [Google Scholar]


| Variable Name | Acronym | Method/Database/ Software | Measured Units and/or Categories |
|---|---|---|---|
| Climatic | |||
| 1. Mean Annual Temperature | MAT * | WorldClim v.1.4 | °C |
| 2. Precipitation of Wettest Month | PWEM | WorldClim v.1.4 | mm |
| 3. Precipitation of Driest Month | PDM | WorldClim v.1.4 | mm |
| 4. Precipitation of Driest Quarter | PDQ | WorldClim v.1.4 | mm |
| 5. Precipitation of Coldest Quarter | PCQ | WorldClim v.1.4 | mm |
| Topographic | |||
| 6. Elevation | ELE * | GPS | m |
| 7. Potential Annual Direct Incident Radiation | RAD | McCune and Keon 2002 [87] | MJ cm−² yr−¹ |
| 8. Head Load Index | HLI | McCune and Keon 2002 [87] | |
| 9. Topographic Position | TP | 1—Valley; 2—Low slope; 3—Mid slope | |
| Edaphic | |||
| 10. Apparent Density | APD | Test tube | g/cm³ |
| 11. Sand | SAND | Bouyoucos | % |
| 12. Silt | SILT | Bouyoucos | % |
| 13. Clay | CLAY | Bouyoucos | % |
| 14. Usable Water | USWT | % | |
| 15. Organic Matter Content | OMC | Walkley and Black | % |
| 16. Nitrogen | N | Kjeldahl | % |
| 17. Calcium | Ca | Volumetry | Meq/100 g |
| 18. Magnesium | Mg | Calculated | Meq/100 g |
| 19. Sodium | Na* | Flamometry | Meq/100 g |
| 20. Potassium | K* | Flamometry | Meq/100 g |
| 21. Phosphorus | P | Kjeldahl | Mg/k |
| 22. pH | pH* | Potentiometer | Logarithmic units (0–14) |
| 23. Electric Conductivity | EC | Conductimeter | Mili-mhos/cm at 25 °C |
| Canopy Structure | |||
| 24. Mask Area | MASKA | Gap Light Analyzer software | % |
| 25. Canopy Openness | CANOP | Gap Light Analyzer software | % |
| 26. Leaf Area Index | LAI5 | Gap Light Analyzer software | Angle 0–75° |
| Disturbance | |||
| 27. Wood Extraction | WEXT | Disturbance index | Scores 0 to 10 |
| 28. Firewood Extraction | FEXT* | Disturbance index | Scores 0 to 10 |
| 29. Collection of Non-Timber Forest Products | NTFP | Disturbance index | Scores 0 to 10 |
| 30. Grazing | GRA | Disturbance index | Scores 0 to 10 |
| 31. Fire | FIRE | Disturbance index | Scores 0 to 10 |
| SITES | |||||||||||||||||||||
|---|---|---|---|---|---|---|---|---|---|---|---|---|---|---|---|---|---|---|---|---|---|
| Variable Name | 1 | 2 | 3 | 4 | 5 | 6 | 7 | 8 | 9 | 10 | 11 | 12 | 13 | 14 | 15 | 16 | 17 | 18 | 19 | 20 | 21 |
| ELE (m a.s.l.) | 1835 | 1939 | 1944 | 1899 | 1730 | 1898 | 1950 | 1911 | 1873 | 1744 | 1726 | 1855 | 1798 | 1792 | 1688 | 1659 | 1608 | 1645 | 1951 | 1613 | 1960 |
| MAT (°C) | 15.2 | 15.2 | 15.7 | 15.7 | 17.3 | 15.7 | 15.7 | 15.7 | 15.7 | 17.3 | 17.3 | 16 | 16 | 16 | 16 | 16 | 17 | 17 | 15.2 | 16 | 15.2 |
| PWEM (mm) | 151 | 151 | 151 | 148 | 148 | 144 | 144 | 144 | 144 | 144 | 144 | 143 | 143 | 141 | 141 | 141 | 141 | 141 | 141 | 140 | 140 |
| PDM (mm) | 28 | 28 | 27.1 | 27.1 | 28.6 | 27.1 | 27.1 | 27.1 | 27.1 | 28.6 | 28.6 | 26.1 | 26.1 | 26.1 | 26.1 | 26.1 | 26.3 | 26.3 | 27 | 26.1 | 27 |
| PDQ (mm) | 7.5 | 7.5 | 7.3 | 7.3 | 8.3 | 7.3 | 7.3 | 7.3 | 7.3 | 8.3 | 8.3 | 7.2 | 7.2 | 7.2 | 7.2 | 7.2 | 7.5 | 7.5 | 7.1 | 7.2 | 7.1 |
| PCQ (mm) | 15.2 | 15.2 | 14.7 | 14.7 | 14.7 | 14.7 | 14.7 | 14.7 | 14.7 | 14.7 | 14.7 | 14.1 | 14.1 | 14.1 | 14.1 | 14.1 | 13.2 | 13.2 | 14.3 | 14.1 | 14.3 |
| RAD (MJ cm−² yr−¹) | 0.8 | 0.75 | 0.74 | 0.83 | 1.05 | 1.14 | 1.14 | 0.81 | 0.91 | 1.06 | 1.11 | 1.08 | 0.86 | 0.83 | 1 | 0.72 | 0.89 | 1.07 | 0.94 | 0.89 | 0.78 |
| HLI | 0.65 | 0.6 | 0.59 | 0.69 | 0.89 | 1.07 | 1.08 | 0.93 | 1.06 | 0.97 | 1.04 | 1 | 0.71 | 0.69 | 1.1 | 0.56 | 0.75 | 0.94 | 0.82 | 0.75 | 0.62 |
| TP | 2 | 3 | 3 | 3 | 2 | 2 | 2 | 2 | 2 | 3 | 2 | 3 | 3 | 2 | 3 | 1 | 1 | 3 | 3 | 1 | 3 |
| SAND (%) | 54.3 | 56.3 | 39.3 | 50.3 | 51.3 | 59.3 | 53.3 | 52.3 | 57.3 | 49.3 | 48.3 | 48.3 | 59.9 | 50.9 | 64.9 | 61.9 | 58.9 | 48.9 | 46.9 | 49.9 | 66.9 |
| SILT (%) | 32.6 | 30.6 | 37.6 | 33.6 | 30.6 | 24.6 | 31.6 | 30.6 | 24.6 | 25.6 | 28.6 | 31 | 19 | 28 | 22 | 27 | 27 | 31 | 29 | 35 | 26 |
| CLAY (%) | 13.1 | 13.1 | 23.1 | 16.1 | 18.1 | 16.1 | 15.1 | 17.1 | 18.1 | 25.1 | 23.1 | 20.1 | 21.1 | 21.1 | 13.1 | 11.1 | 14.1 | 20.1 | 24.1 | 15.1 | 7.08 |
| USWT (%) | 15 | 14 | 21 | 16 | 17 | 15 | 16 | 16 | 16 | 20 | 19 | 18 | 17 | 18 | 13 | 13 | 14 | 19 | 20 | 16 | 10 |
| OMC (%) | 9.64 | 11.8 | 5.03 | 10.7 | 9.7 | 8.85 | 6.43 | 6.61 | 11.3 | 6.36 | 13 | 9.64 | 12.9 | 10.9 | 13.2 | 12.5 | 13.1 | 8.73 | 8 | 10 | 7.27 |
| N (%) | 0.17 | 0.26 | 0.15 | 0.25 | 0.16 | 0.23 | 0.18 | 0.15 | 0.2 | 0.15 | 0.14 | 0.2 | 0.28 | 0.23 | 0.28 | 0.27 | 0.22 | 0.22 | 0.2 | 0.26 | 0.22 |
| Ca (Meq/100 g) | 0.83 | 0.83 | 0.83 | 0.41 | 1.24 | 0.83 | 0.41 | 0.41 | 0.41 | 0.83 | 0.41 | 0.42 | 0.83 | 0.42 | 0.41 | 0.83 | 0.41 | 0.42 | 0.83 | 0.83 | 0.83 |
| Mg (Meq/100 g) | 1.24 | 1.66 | 1.66 | 2.08 | 0.83 | 0.41 | 0.41 | 0.83 | 0.83 | 0.83 | 0.83 | 0.42 | 0.41 | 0.42 | 0.83 | 0.77 | 0.83 | 0.42 | 0.41 | 0.41 | 0.41 |
| Na (Meq/100 g) | 0.19 | 0.19 | 0.16 | 0.16 | 0.19 | 0.16 | 0.16 | 0.16 | 0.19 | 0.19 | 0.23 | 0.19 | 0.19 | 0.27 | 0.23 | 0.31 | 0.19 | 0.31 | 0.19 | 0.23 | 0.19 |
| K (Meq/100 g) | 0.22 | 0.2 | 0.15 | 0.2 | 0.22 | 0.2 | 0.17 | 0.17 | 0.2 | 0.17 | 0.22 | 0.17 | 0.22 | 0.25 | 0.31 | 0.31 | 0.17 | 0.22 | 0.17 | 0.22 | 0.22 |
| P (Mg/k) | 5.3 | 5.87 | 6.92 | 3.01 | 3.96 | 4.05 | 3.58 | 4.82 | 5.3 | 2.62 | 7.58 | 3.48 | 5.01 | 3.29 | 8.73 | 5.39 | 0.01 | 5.68 | 5.3 | 5.58 | 12.3 |
| pH (Logarithmic units, 0–14) | 5.07 | 4.86 | 4.94 | 4.88 | 4.86 | 4.84 | 4.8 | 4.93 | 5.14 | 4.99 | 5.02 | 4.64 | 4.8 | 4.47 | 4.48 | 4.3 | 4.4 | 4.32 | 4.2 | 4.35 | 4 |
| EC (Mili-mhos/cm at 25 °C) | 0.07 | 0.08 | 0.07 | 0.08 | 0.09 | 0.07 | 0.08 | 0.07 | 0.07 | 0.09 | 0.08 | 0.04 | 0.05 | 0.06 | 0.05 | 0.1 | 0.06 | 0.04 | 0.06 | 0.06 | 0.07 |
| MASKA (%) | 0.1 | 0.1 | 0.1 | 0.11 | 0.12 | 0.11 | 0.12 | 0.09 | 0.11 | 0.12 | 0.11 | 0.12 | 0.12 | 0.11 | 0.1 | 0.12 | 0.12 | 0.09 | 0.11 | 0.11 | 0.11 |
| CANOP (%) | 9.51 | 12.9 | 16.3 | 11.4 | 15.2 | 16 | 15.5 | 11.4 | 22.5 | 26.8 | 18.7 | 10.5 | 5.24 | 6.69 | 18.7 | 12 | 8.1 | 17 | 6.02 | 7.95 | 9.45 |
| LAI 5 (angle 0–75°) | 2.52 | 2.14 | 1.89 | 2.28 | 2.01 | 1.9 | 1.91 | 2.37 | 1.62 | 1.4 | 1.8 | 2.47 | 3.33 | 2.89 | 1.79 | 2.26 | 2.72 | 1.9 | 3.09 | 2.73 | 2.53 |
| WEXT (Scores, 0–10) | 0 | 0 | 5 | 5 | 5 | 1 | 0 | 5 | 5 | 5 | 5 | 0 | 5 | 0 | 5 | 0 | 0 | 10 | 5 | 0 | 0 |
| FEXT (Scores, 0–10) | 5 | 5 | 0 | 5 | 5 | 1 | 1 | 5 | 5 | 5 | 5 | 10 | 5 | 1 | 10 | 1 | 1 | 10 | 10 | 5 | 10 |
| NTFP (Scores, 0–10) | 1 | 2 | 1 | 5 | 5 | 1 | 1 | 1 | 1 | 5 | 5 | 10 | 10 | 0 | 10 | 0 | 0 | 1 | 0 | 5 | 0 |
| GRA (Scores, 0–10) | 0 | 0 | 0 | 0 | 5 | 0 | 0 | 0 | 0 | 0 | 0 | 0 | 0 | 0 | 1 | 0 | 0 | 5 | 0 | 0 | 0 |
| FIRE (Scores, 0–10) | 1 | 0 | 1 | 0 | 0 | 0 | 0 | 0 | 0 | 0 | 0 | 1 | 1 | 0 | 0 | 0 | 0 | 0 | 0 | 0 | 0 |
| Distance Matrix | Dimensions | p | Stress | Final Instability | Iterations | Proportion of Variance Accounted | ||
|---|---|---|---|---|---|---|---|---|
| Axis 1 | Axis 2 | Axis 3 | ||||||
| Presence Absence | 3 | 0.004 | 10.26 | <1 × 10−⁶ | 151 | 0.608 | 0.181 | 0.107 |
| Density | 2 | 0.004 | 14.50 | <1 × 10−⁶ | 375 | 0.672 | 0.123 | 0 |
| Basal Area | 1 | 0.004 | 11.97 | <1 × 10−⁶ | 281 | 0.81 | 0 | 0 |
| Distance Matrix | Variables | Axis 1 | Axis 2 |
|---|---|---|---|
| Presence Absence | pH | −0.694 | 0.255 |
| Elevation | −0.012 | −0.806 | |
| MAT | −0.204 | −0.805 | |
| Density | pH | 0.658 | −0.184 |
| Na | 0.046 | 0.699 | |
| Basal Area | pH | −0.609 | 0 |
| Distance Matrix | Cumulative Explained Variance (%) | Explained from Total Variation (%) | Strongest Inter-Set with Correlations (r) | |
|---|---|---|---|---|
| Canonical Axis 1 Predictor/r/Biplot Scores | Canonical Axis 2 Predictor/r/Biplot Scores | |||
| Presence-Absence | 32.9 | 15.5 | pH (0.845), 0.1820 | Elevation (0.818), 0.1705 MAT (−0.886), −0.2000 |
| Density | 28.5 | 14.6 | pH (−0.613), −0.0499 | Na (−0.788), −0.0542 K (0.554), −0.0501 |
| Basal Area | 30.1 | 24.6 | pH (−0.709), 0.2562 | MAT (0.516), 0.1637 |
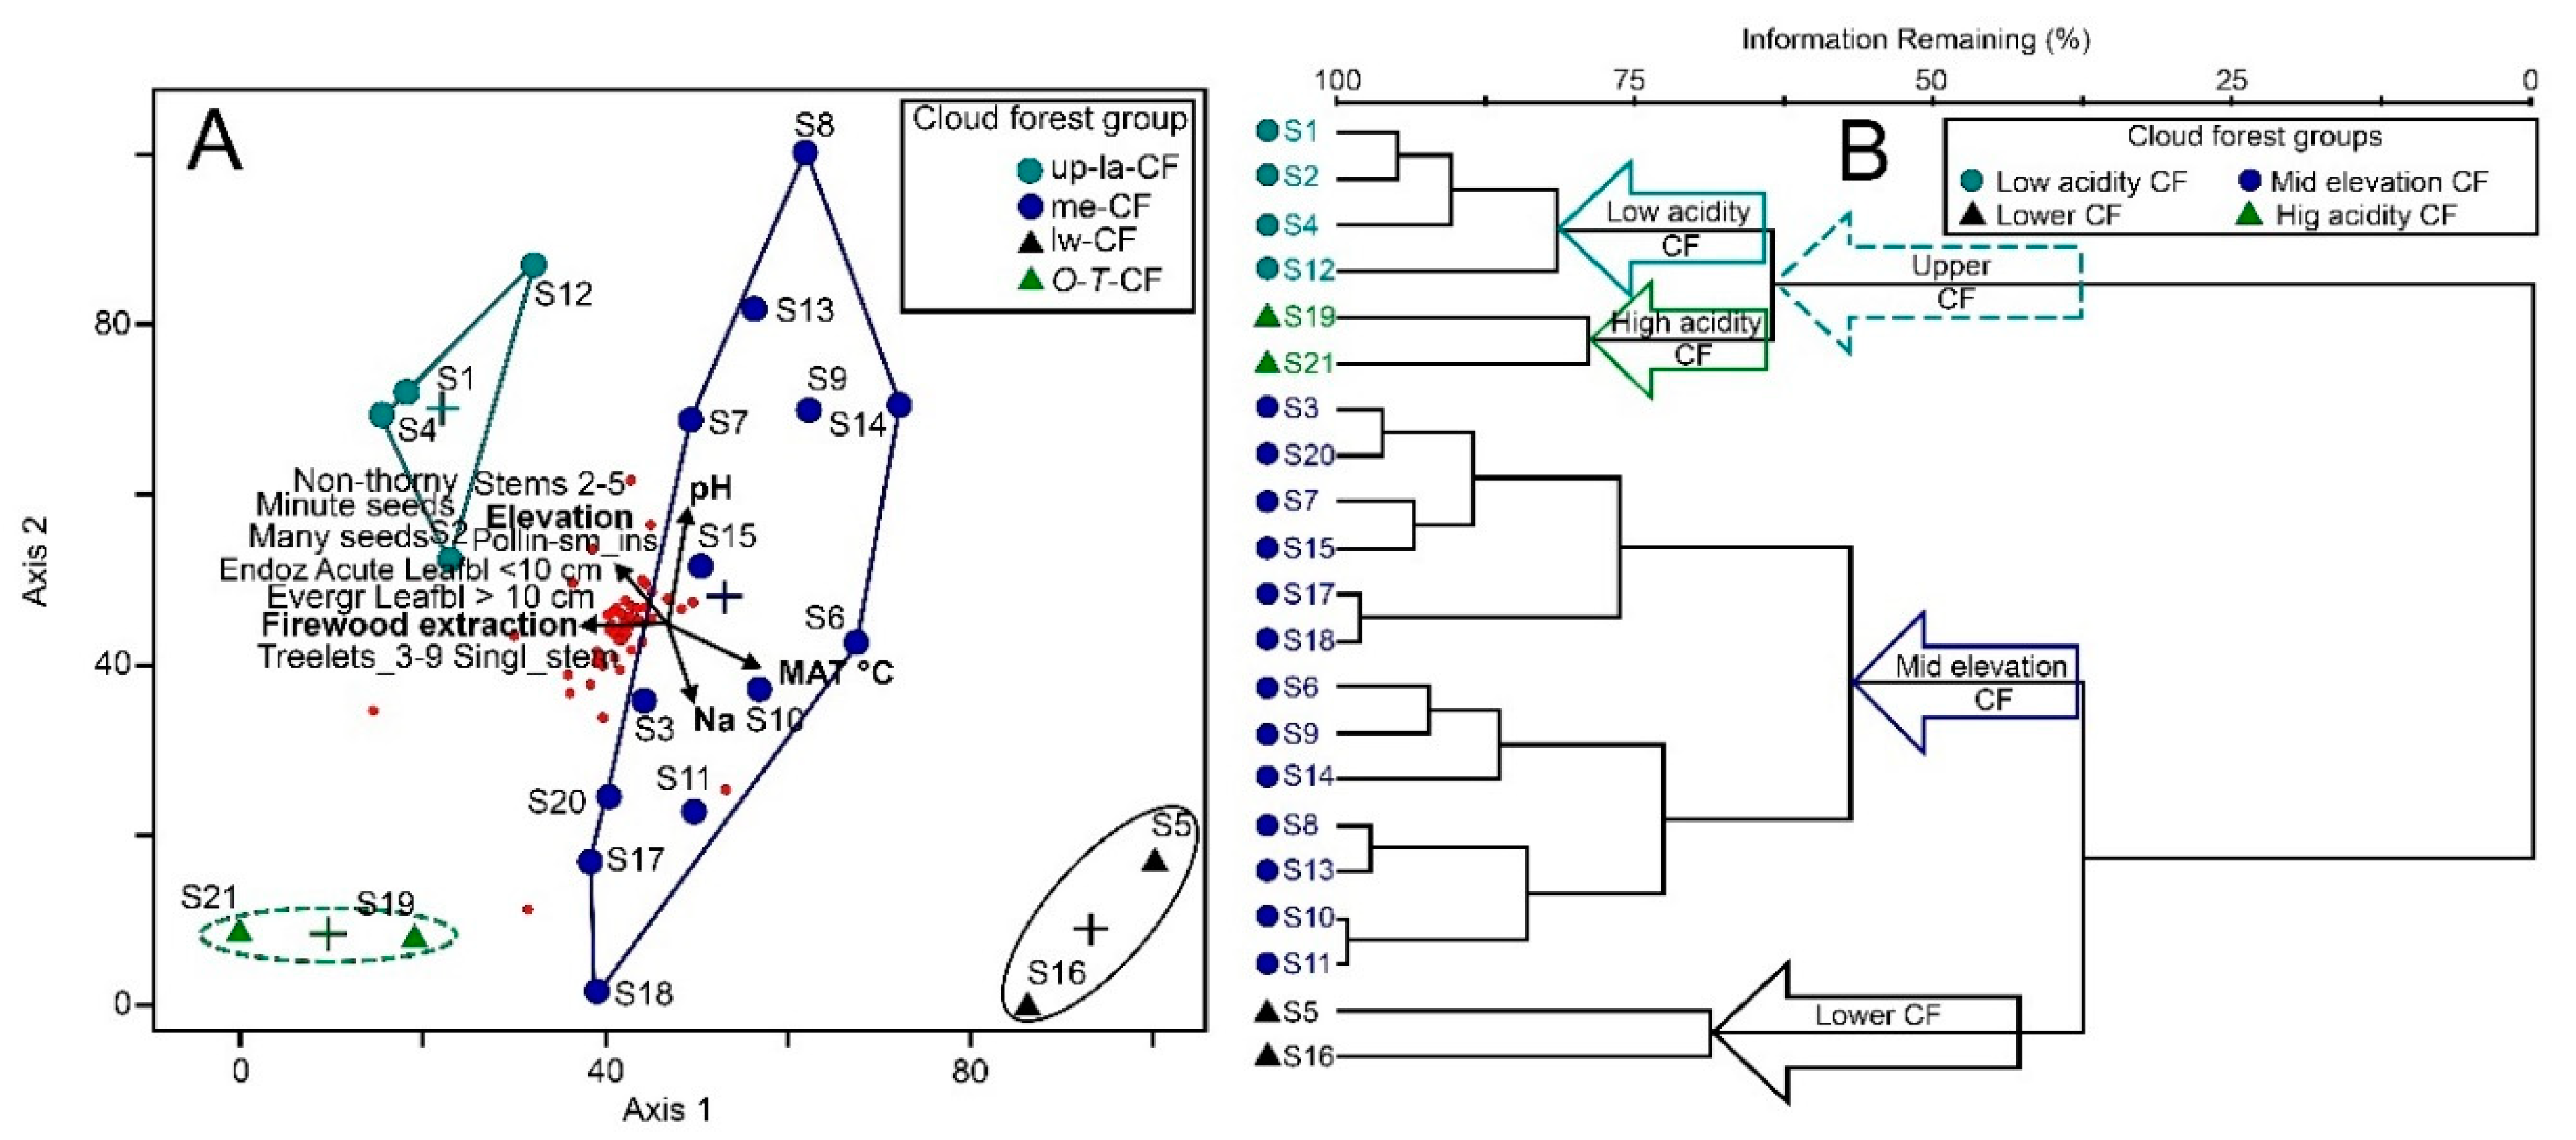
| Guilds | 36.6 | 28.6 | MAT (0.525), 0.0586 | pH (0.680), 0.0983 |
| Distance Matrix | Spp. or Guild # with Significant IV | Lowest Average p-Value | Suggested Group Number | Cloud Forest Group Names | MRPP T/p/A |
|---|---|---|---|---|---|
| Presence-Absence | 16 | 0.4307 | 4 | (1) Alnus-Nectandra (A-N-CF), (2) Vismia (V-CF), (3) Siparuna (Si-CF), (4) Oreomunea-Ticodendron (OT-CF) | −8.14/7.4 × 10−⁷/0.21 |
| Density | 4 | 0.2258 | 4, three interpretable | (1) Sarauia (Sa-CF), (2) Zinowiewia (Z-CF), (3) Oreomunea-Ticodendron (OT-CF). | −9.87/2.01 × 10−⁶/0.18 |
| Basal Area | 0 | 0.1822 | 5, three interpretable | (1) Low acidity (la-CF), (2) Mid acidity (ma-CF), and (3) extreme acidity (O-T-CF) | −10.25/3 × 10−⁸/0.34. |
| Guilds | 0 | 0.0325 | 5, four interpretable | (1) Upper, low acidity (up-la-CF), (2) Upper, high acidity (O-T-CF), (3) Mid elevation (me-CF), and (4) Low (lw-CF) | −8.12/6.8 × 10−⁷/0.34 |
| Distance Matrix | Species | Group | (IV) | p-Value |
|---|---|---|---|---|
| Presence-Absence | Viburnum microcarpum | 1 | 0.683 | 0.001 |
| Alnus acuminata | 1 | 0.775 | 0.002 | |
| Gaultheria erecta | 1 | 0.615 | 0.002 | |
| Nectandra rubriflora | 1 | 0.556 | 0.033 | |
| Vismia camparaguey | 2 | 0.798 | 0.001 | |
| Lyonia squamulosa | 2 | 0.577 | 0.061 | |
| Siparuna gesnerioides | 3 | 1 | 0.008 | |
| Ocotea mexicana var. diminuta | 4 | 1 | 0.009 | |
| Psychotria galeottiana | 4 | 1 | 0.009 | |
| Ticodendronincognitum | 4 | 1 | 0.009 | |
| Oreomunnea mexicana | 4 | 0.905 | 0.03 | |
| Calyptranthes pallens | 4 | 0.905 | 0.033 | |
| Sphaeropteris horrida | 4 | 0.905 | 0.033 | |
| Cartrema americana | 4 | 0.825 | 0.048 | |
| Eupatorium constipatiflorum | 4 | 0.825 | 0.055 | |
| Mikania pyramidata | 4 | 0.825 | 0.059 | |
| Density | Saurauia angustifolia | 1 | 50 | 0.042 |
| Zinowiewia concinna | 2 | 44.4 | 0.049 | |
| Ocotea mexicana var. diminuta | 3 | 100 | 0.008 | |
| Mikania pyramidata | 3 | 75 | 0.033 |
Publisher’s Note: MDPI stays neutral with regard to jurisdictional claims in published maps and institutional affiliations. |
© 2020 by the authors. Licensee MDPI, Basel, Switzerland. This article is an open access article distributed under the terms and conditions of the Creative Commons Attribution (CC BY) license (http://creativecommons.org/licenses/by/4.0/).
Share and Cite
Domínguez-Yescas, R.; Vázquez-García, J.A.; Muñiz-Castro, M.Á.; Hernández-Vera, G.; Salcedo-Pérez, E.; Rodríguez-Pérez, C.; Gallardo-Yobal, S.I. Small-Scale Environmental Drivers of Plant Community Structure and Diversity in Neotropical Montane Cloud Forests Harboring Threatened Magnolia dealbata in Southern Mexico. Diversity 2020, 12, 444. https://doi.org/10.3390/d12120444
Domínguez-Yescas R, Vázquez-García JA, Muñiz-Castro MÁ, Hernández-Vera G, Salcedo-Pérez E, Rodríguez-Pérez C, Gallardo-Yobal SI. Small-Scale Environmental Drivers of Plant Community Structure and Diversity in Neotropical Montane Cloud Forests Harboring Threatened Magnolia dealbata in Southern Mexico. Diversity. 2020; 12(12):444. https://doi.org/10.3390/d12120444
Chicago/Turabian StyleDomínguez-Yescas, Reyna, José Antonio Vázquez-García, Miguel Ángel Muñiz-Castro, Gerardo Hernández-Vera, Eduardo Salcedo-Pérez, Ciro Rodríguez-Pérez, and Sergio Ignacio Gallardo-Yobal. 2020. "Small-Scale Environmental Drivers of Plant Community Structure and Diversity in Neotropical Montane Cloud Forests Harboring Threatened Magnolia dealbata in Southern Mexico" Diversity 12, no. 12: 444. https://doi.org/10.3390/d12120444