Article

Intraspecific Trait Variation Dilutes Deterministic Processes in Community Assembly of Arid Shrubs across Multiple Scales

1
Key Laboratory of Resource Biology and Biotechnology in Western China, Ministry of Education, Northwest University, Xi’an 710069, China
2
School of Life Sciences, Northwest University, Xi’an 710069, China
3
Institute of Earth Environment, Chinese Academy of Sciences, Xi’an 710061, China
4
Xi’an Botanical Garden of Shaanxi Province, Institute of Botany of Shaanxi Province, Xi’an 710061, China
*
Author to whom correspondence should be addressed.
J.X. and H.D. contributed equally to this work and should be considered co-first authors.
Diversity 2020, 12(12), 447; https://doi.org/10.3390/d12120447
Submission received: 17 August 2020 / Revised: 9 November 2020 / Accepted: 23 November 2020 / Published: 26 November 2020
(This article belongs to the Special Issue Vascular Plant Diversity at Different Scales)

Abstract

:
Trait-based approaches present a promising avenue for improving our understanding of species coexistence and community assembly, while intraspecific trait variation (ITV) across different spatial scales is important in trait-based community assembly mechanisms, especially in extreme environments. In this study, we focused on the functional diversity and community assembly patterns of a desert community across different spatial scales and investigated whether ITV plays a significant role in community assembly processes in arid habitats. A 50 m × 50 m plot with different small quadrats was established in a typical desert community at the transition zone between the Tengger Desert and Loess Plateau in China. A total of 14 traits were selected to assess the trait-based functional diversity and assembly processes in the community. We found that functional diversity showed different patterns when considering ITV and related to different types of traits (chemical traits or morphological traits) and some soil factors (pH and nitrate nitrogen). Plant communities in this study showed stochastic distribution patterns and similar functional diversity patterns based on functional trait approaches, regardless of spatial scales. Also, the effect of ITV on community assembly did not show more effect with increasing scales. These results indicated that ITV diluted deterministic processes in community assembly across scales in arid habitats.

1. Introduction

Community assembly is the process that shapes the structure and composition of plant communities, which describes the mechanism of diversity maintenance in a community [1,2]. Approaches based on functional traits have been widely used to demonstrate these assembly processes and diversity patterns [3,4,5,6,7,8]. However, the dominant trait-based community assembly or diversity studies have focused largely on trait differences among species [9], but there has recently been renewed interest in the role of intraspecific trait variation (ITV, [9,10,11]), which is extensive in nature and plays a significant role in trait-based community ecology [10,11,12]. A recent study by Siefert et al. (2015) estimated that an average of 25% of all trait variation in plant communities is intraspecific variation. Plants often show strong intraspecific variation in functional traits, and this variation influences plant response to environmental filters and biotic interactions [13,14,15]. Moreover, the role of ITV in community assembly is not well understood as well [16,17,18], but ITV has been proved to increase community coexistence and shape local to regional scale biodiversity [1].
Previous studies have found that ITV patterns are heavily associated with spatial scale [19,20,21]. Recent studies have shown that patterns of diversity and community assembly may change across spatial scales [22,23,24,25,26,27]. Thus, considering spatial scale effects is helpful to understand assembly processes [19,22,28], because different forces shape the different patterns of distribution and the abundance of organisms across spatial scales [19,29,30]. In general, at small spatial scales, coexistent species would show trait divergence [31,32] or trait randomized patterns [33], which may be driven by limiting similarity or stochastic dispersal processes [16,34,35]. In contrast, at large spatial scales, coexistent species would show trait convergence, which is probably driven by environmental filters [36,37,38]. However, there is no evidence of whether functional diversity or community assembly patterns would change when considering ITV and scale effects simultaneously.
A previous study has found that ITV plays an important role in species-poor regions [12], such as desert habitats. Desert represents one of the extreme ecosystems currently facing selection pressures due to water and/or temperature stresses [39]. On the other hand, owing to the relatively homogeneous condition (but heterogeneous in microhabitat), ITV may play a role in adapting to certain environments [16]. Thus, a desert habitat provides a suitable system to understand community assembly and diversity patterns when considering ITV [26]. In this study, we established a 50 m × 50 m sampling site which was divided into 100 small quadrats. Here, we used trait-based approaches to assess diversity and community assembly patterns in a desert when considering ITV across different scales. In particular, we proposed the following hypotheses:
When considering ITV, the community assembly process may show more stochastic patterns than without considering ITV, thus leading to different functional diversity patterns especially across different scales. To test these hypotheses, we designed this experiment.

2. Methods

2.1. Study Area

The study area is situated in Jingtai County, Gansu Province, China (103°33′–104°43′ E, 36°43′–37°38′ N). The site is located at the transition zone among the Tengger Desert, Qilian Mountains, and the Loess Plateau [40]. This area has a temperate continental arid climate. The main geomorphological types are erosion-prone hills and piedmont pluvial and sloping alluvial plains. The mean annual precipitation is 183.5 mm, which mainly falls between June and September. The mean annual temperature is 8.1 °C. The mean annual total potential evapotranspiration is 3038 mm, and the frost-free period is 141 days [41]. The land surface is extremely dry, with severe desertification. Woody vegetation is dominated by small shrubs [42]. The dominant shrub species is Reaumuria soongorica, in the family Tamaricaceae.

2.2. Sampling Site Establishment

To examine the availability of sampling sites, we established three 50 m × 50 m sites across the Tengger Desert in Jingtai County (in the northern part of Jingtai County, the Tengger Desert stretches for about 16 km. Site 1 in Baidunzi at 104°08′15.55″ E, 37°21′49.99″ N; Site RE-1 in Chaijiazhuang at 104°03′43.56″ E, 37°22′13.80″ N; Site RE-2 in Hongwawa at 103°58′06.6″ E, 37°23′00.96″ N. Each site is 7.8 km apart, we established three sites randomly within the target range of 100 m). We also obtained soil samples and documented the species information in preliminary experiments in the summer of 2016. In extremely dry deserts, habitats are largely homogeneous at the landscape scale (see Supplementary Materials Table S1). The pre-analysis proved that the three sites contain mostly redundant information because there were very similar habitat indicators (Supplementary Materials Table S1). In addition, this study set up the biggest scale of 25 m × 25 m, the target species in this research area (50 m × 50 m) are enough (see Supplementary Materials Table S2, the target species had a relatively small individual canopy range in this desert habitat. In this study area, most of the woody species are undershrubs or subshrubs, with a height of only 5 cm and canopy diameter of less than 30 cm. Many more species are herbaceous, or small shrubs that appear only once. Thus, even within a 5 m × 5 m scale, the species richness or abundance that can be obtained is sufficient), so again, in the final analysis, one 50 m × 50 m site (104°08′15.55″ E, 37°21′49.99″ N, see Supplementary Materials Figure S1) was selected because this site has the greatest species richness, which can cover more regional species pool information (see Supplementary Materials Table S1, the richness of this site is 14 vs. 12 and 13 in RE-1 and RE-2). Although there was just one 50 m × 50 m plot, we treated it as a sampling site area or a frame of reference rather than a repeatable plot. We divided the plot into non-overlapping square quadrats of 5 m × 5 m, 10 m × 10 m, 15 m × 15 m, 20 m × 20 m, or 25 m × 25 m scales (25, 100, 225, 400, and 625 m2, respectively; Figure 1). The number of each scale plot was 100, 25, 5, 4, and 4, respectively. Community investigation was confined to the shrub and herbaceous layer. Each species in 50 m × 50 m was identified and documented with its abundance, coverage, plant height (H), and canopy range (CR, calculated by length and width). Also, the abundance and coverage of species in 5 m × 5 m, 10 m × 10 m, 15 m ×15 m, 20 m ×20 m, and 25 m × 25 m were documented. In total seven shrub species with 2412 individuals and seven herbaceous species with 3839 individuals were documented (See Supplementary Materials Table S2).

2.3. Soil Sample Characteristics Measurement

We collected soil samples (three repetitions from different aspects of each hole) from 0–20 cm below the ground from the center of each 5 m × 5 m sub-plot. After sampling, we analyzed the soil water content (SWC), pH, and contents of ammonium nitrogen (AN), nitrate nitrogen (NN), and rapidly available phosphorus (RAP) based on the average of three soil sample repetitions to determine the impact of soil character on the community. For 10 m × 10 m, 15 m × 15 m, 20 m × 20 m, 25 m × 25 m scales, these soil characters were averaged by 5 m × 5 m sub-plots at four corners of each plot. These stoichiometric factors of soil are measured by a chemical analyzer (Cleverchem 200+, EuroVector Inc., Pavia, Italy) and a spectrophotometric method. We also recorded the altitude, longitude, and latitude of the soil sampling site, which were all obtained by a GPS recorder (ProMark 100, Ash Tech, Inc., Winthrop, MA, USA).

2.4. Plant Sampling and Trait Measurement

Research on functional trait needs to maximize the dimension of traits but minimize the number of traits. Thus, traits belonging to the leaf, stem, and root should be contained (Laughlin 2014). In this study, both morphological and stoichiometric traits were considered. We recorded the plant height (H) and coverage (CR) of every woody individual occurring in the plots. For each woody species occurring in the 5 m × 5 m sub-plots, we collected no less than 20 fully mature leaves from as many individuals as possible. Stems and roots of woody species were collected from each sampled individual. For each herbaceous species, we collected 5–10 whole plants and then divided them into leaf, stem, and root sections. For 10 m × 10 m, 15 m × 15 m, 20 m × 20 m, 25 m × 25 m scales, samples belonging to each 5 m × 5 m sub-plot which was made up of whole bigger plots. The central 15 m × 15 m plot (See Figure 1) was resampled according to the above standard. Every leaf we collected was scanned by Epson Perfection (V-700 Photo, Epson Inc., Nagano, Japan). The leaf area (LA) and leaf length (LL) were measured by Motic Images Plus 2.0 (Motic Digital Microscopy Co., Xiamen, China). In addition, we measured the specific leaf area (SLA), leaf dry matter content (LDMC), stem dry matter content (SDMC), and root dry matter content (RDMC) following standard methods [43]. We also measured the stoichiometric traits of plant samples. The leaf nitrogen content (LNC), leaf carbon content (LCC), stem nitrogen content (SNC), stem carbon content (SCC), root nitrogen content (RNC), and root carbon content (RCC) were measured by the elemental analyzer (EA3000, EuroVector, Inc., Pavia, Italy), whereas the leaf phosphorus content (LPC) was measured by CleverChem 2000 (Dechem-Tech, Inc., Hamburg, Germany) using standard methods [44]. In addition, we established a “multiple-trait” [45,46], which may reflect the response of the community traits to the environments directly as it was a unidimensional value. To avoid collinear redundancy, each above trait underwent principal component analysis (PCA, see Supplementary Materials Table S2). Finally, we selected LA, LDMC, RDMC, LNC, SNC, RCC, and LPC to calculate the multiple-trait value of one community by multidimensional hypervolume algorithm based on Euclidean distance among these traits [47].

2.5. Functional Diversity

We calculated Mason’s functional α-diversity (Fα) [48] and Mason’s functional β-diversity (Fβ) [49]. The functional diversity of each scale of communities with and without considering for ITV (method with/without ITV, see [50,51,52]). Functional diversity was calculated by using the “FD” package in R 3.6.1. The algorithms of Fα and Fβ, are as follows:
F α = P i ( x i x ¯ )
F β = 1 n ( x ¯ k x ¯ region )
Without considering ITV, Pi is the relative abundance of species i, xi is the functional trait value of species i, x ¯ is the mean functional trait value of all species, x ¯ k is the community weighted mean trait value of community k, and x ¯ region is the mean functional trait value of the whole study region. Considering ITV, Pi = 1, xi is the functional trait value of individual i, x ¯ is the mean functional trait value of all individuals, x ¯ k is the mean functional trait value of individuals in community k, and x ¯ region is the mean functional trait value of the whole study region. For plots at each scale, we calculated the functional diversities both with and without ITV and analyzed the significance of difference values between with/without ITV by paired t-test. The t-test was run on the STATISTICA 6.0 Program. All scatter diagrams were constructed with Origin Pro 8.0 software.

2.6. Functional Trait-Based Community Assembly Pattern

At each sampled spatial scale, we calculated the standardized effect size (SES) which represents the deviation of traits with/without considering ITV [52]. The SES described the level of trait convergence or divergence compared to the null model. We calculated these values applied in the R-package “Picante” with 999 repetitions [31,53]. Note that the SES values of traits were weighted by each species’ relative abundance. A negative SES (especially SES < −1.96) value indicates that the functional diversity is lower than the expected random distribution, while a positive SES (especially SES > 1.96) value indicates that the functional diversity is higher than the expected random distribution [54]. For plots at each scale, we calculated the SES both with and without ITV and analyzed the significance of the difference between values with/without ITV by paired t-test. The t-test was run at STATISTICA 6.0 Program (Statsoft Inc., Las Vegas, NV, USA). All scatter diagrams were constructed with Origin Pro 8.0 software (OriginLab Co., Studio City, CA, USA).

2.7. Effect of Environmental Conditions on Functional Diversity

To reveal whether extreme environmental conditions affect the diversity and community assembly patterns, we used multiple regression considering alpha and beta diversity as response variables and the first axis of the PCA including soil physical and chemical variables (e.g., AN, NN, pH, RAP, and SWC) as factors. A PCA of the five soil traits (including AN, NN, pH, RAP, and SWC) was performed to represent the complex soil factors at five spatial scales. As response variables, we used the functional alpha and beta diversity indices at each sampled spatial scale. A PCA was conducted with SPSS 19.0 software (IBM, Armonk, NY, USA).

3. Results

3.1. Functional Diversity and Community Assembly Patterns

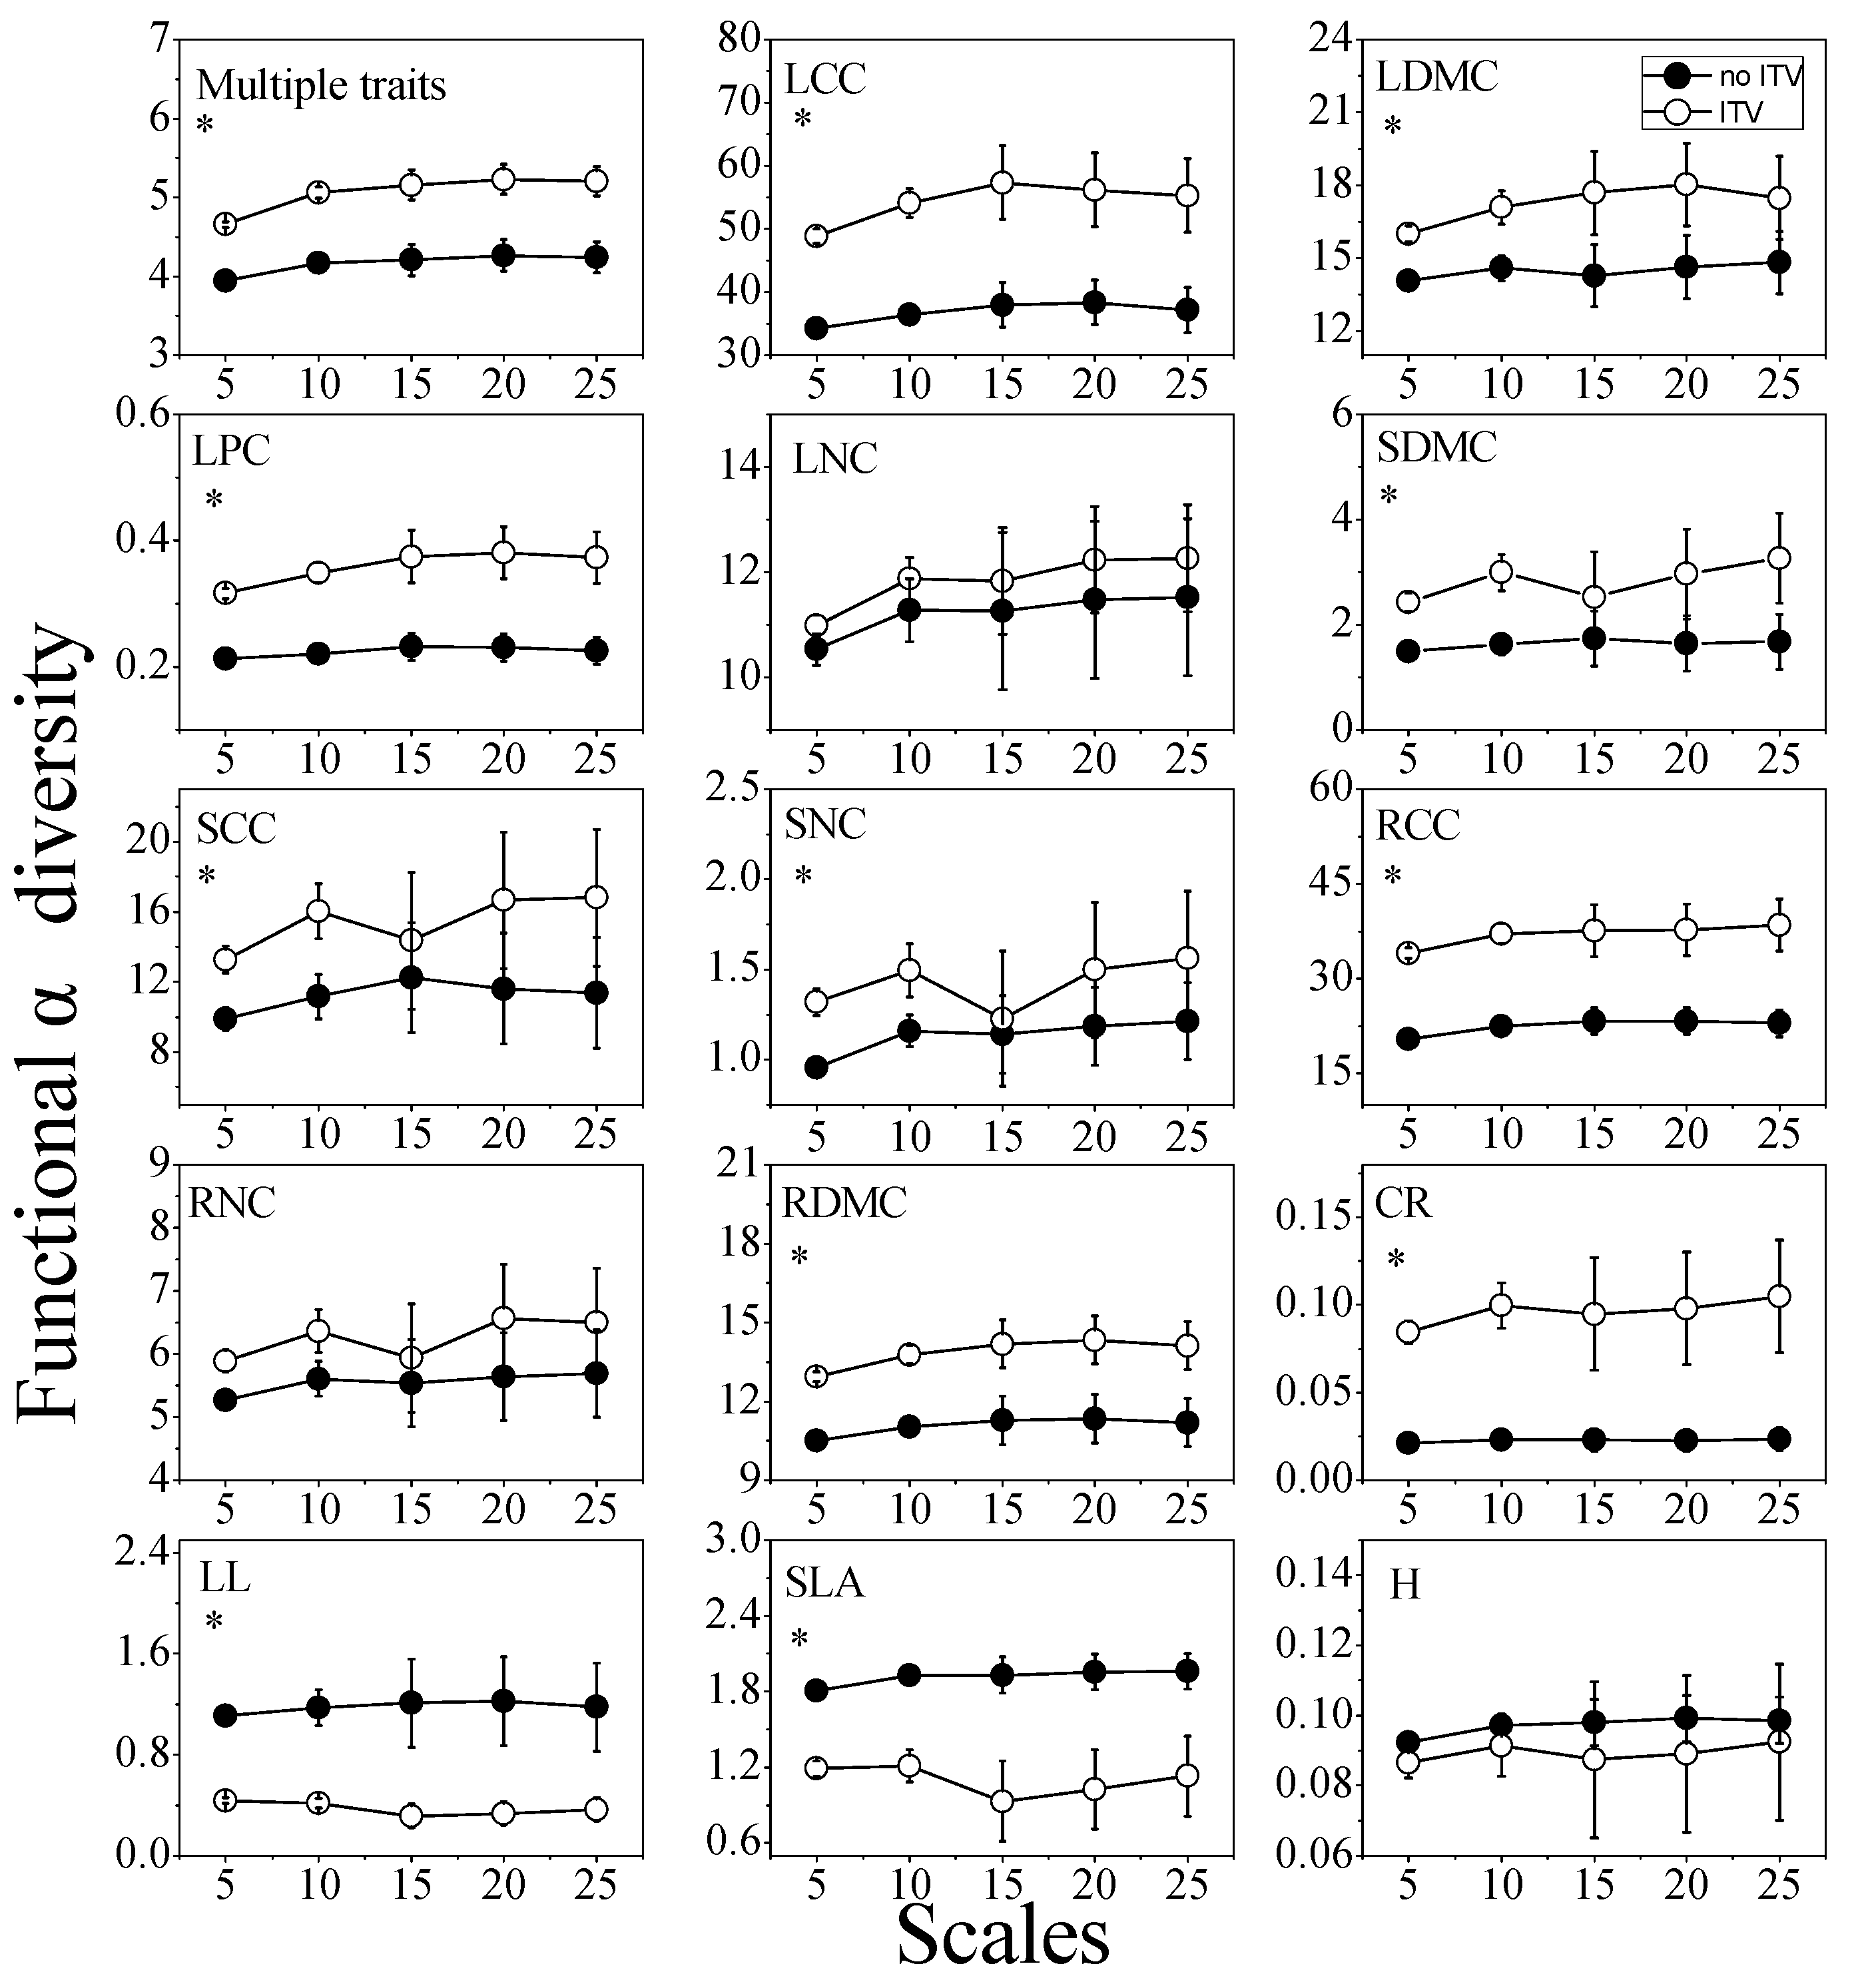
When considering ITV, there is a higher functional alpha diversity in multiple-traits and most single-traits (such as LCC, LDMC, LPC, LNC, SDMC, SCC, SNC, RCC, RNC, RDMC, and CR) than that in the analysis without considering ITV (Figure 2). Moreover, our results from analyses considering ITV showed lower functional alpha diversity for some single-traits (such as LL, SLA, and H) than that in analyses without ITV (Figure 2).
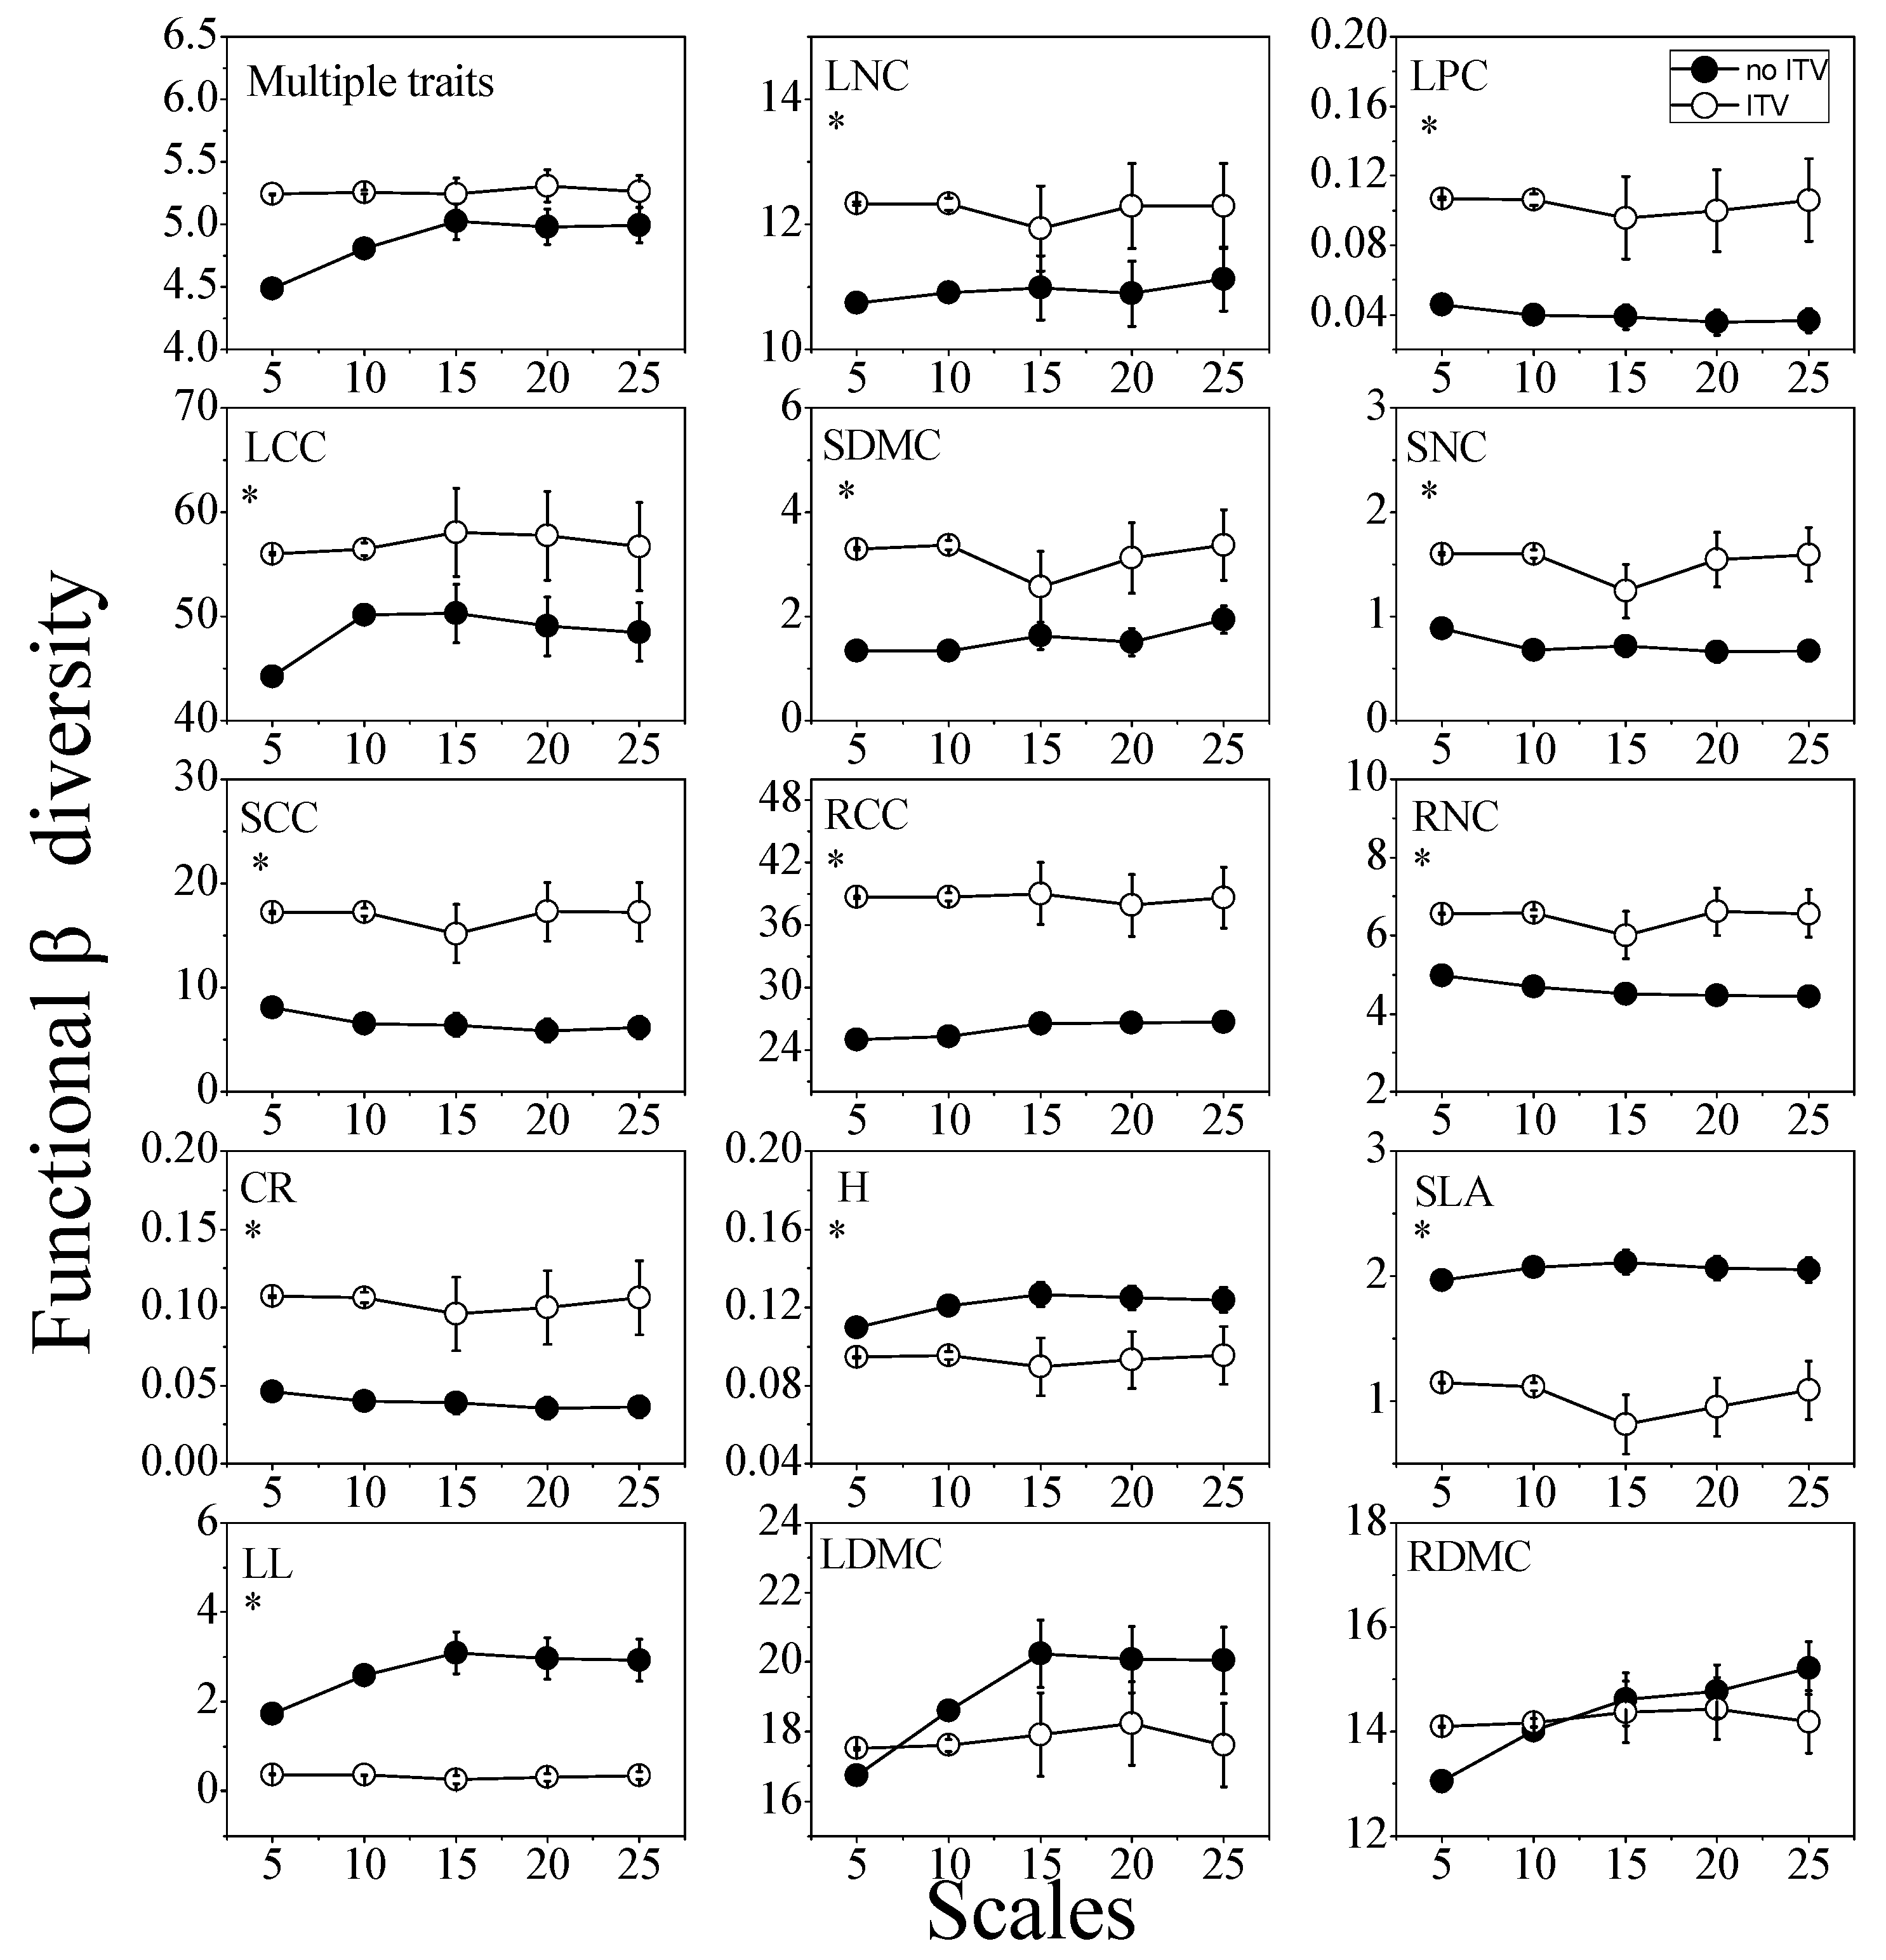
We found that considering ITV would result in higher functional beta diversity both in multiple-trait and some single-trait analyses (such as LNC, LPC, LCC, SDMC, SNC, SCC, RCC, RNC, and CR) than that in the analysis without ITV (Figure 3). On the other hand, our results from analyses considering ITV showed lower functional beta diversity for a few single-trait analyses (such as SLA, LL, and H) than that in the analysis without ITV. In addition, some single-trait analyses (such as LDMC and RDMC) showed no significant difference for functional beta diversity with considering ITV to those without considering ITV (Figure 3).
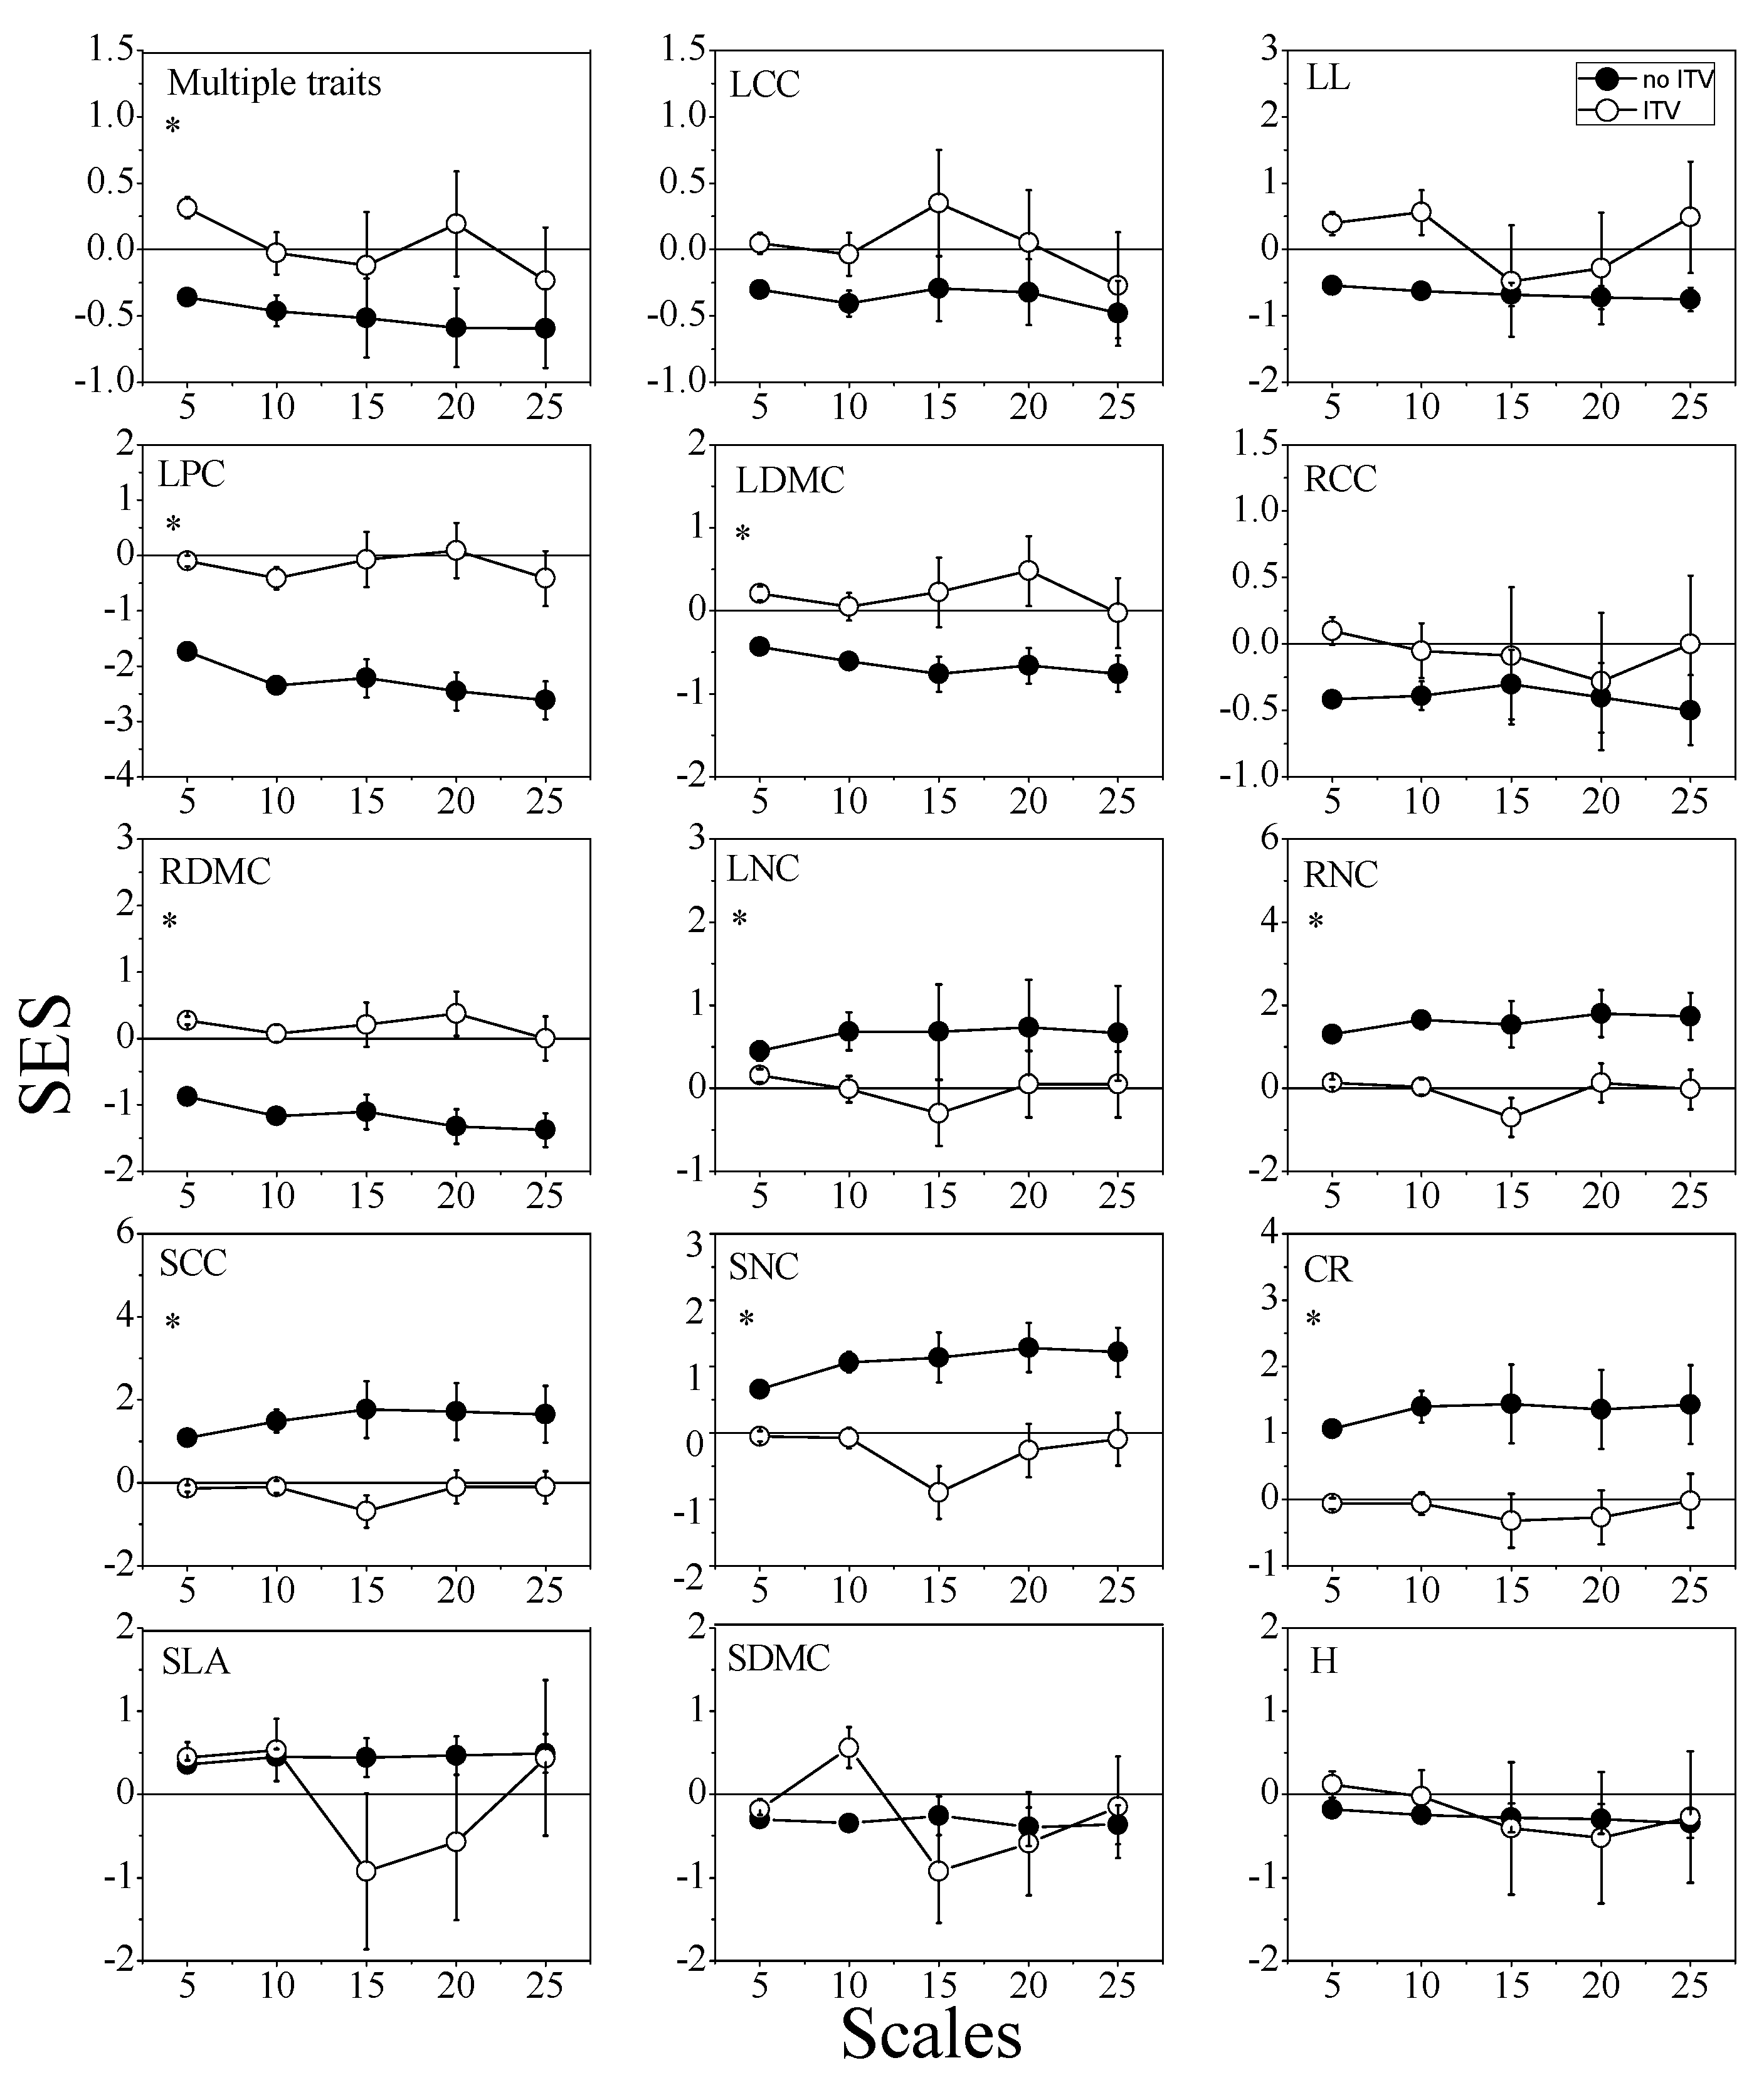
The SES of traits with ITV/without ITV were significantly different from each other. We also found that considering ITV could produce a higher SES for both multiple traits and some single traits (such as LCC, LL, LPC, LDMC, RCC, and RDMC) than those without ITV. However, our results also indicated that considering ITV could produce a lower SES for a few of the single traits (such as LNC, RNC, SCC, SNC, and CR) than those without ITV. In addition, some single traits (SLA, SDMC, and H) showed no significant trend for SES when comparing analyses with ITV to those without ITV (Figure 4). In addition, when considering ITV, SCC showed a significant divergent assembly pattern (SES > 1.96), while LPC showed a significant convergent assembly pattern (SES < −1.96).

3.2. The Effects of the Soil Environmental Factors on Functional Diversity

The effect of environmental conditions on the functional alpha diversity was analyzed for multiple soil traits (PCA1, see Supplementary Materials Tables S3 and S4) and each single soil trait (such as AN, NN, pH, RAP, and SWC) at each spatial scale (Supplementary Materials Figure S2). There was a negative correlation between PCA1 and the functional alpha diversity with/without ITV at the 10 × 10 m2 spatial scale, as was observed with pH. Additionally, there was a negative correlation between NN and functional alpha diversity with ITV at the 10 × 10 m2 spatial scale only. At the other spatial scales, we found no significant correlation between environmental heterogeneity and functional alpha diversity (Supplementary Materials Figure S2).
We found weak correlations between functional beta diversity and some soil factors with or without ITV at the 5 m × 5 m spatial scale (e.g., RAP, pH and AN; Supplementary Materials Figure S3) and 10 × 10 m2 spatial scale (e.g., PCA1, NN, AN, SWC, and RPC; Supplementary Materials Figure S4). However, for other scales, we found no significant correlations between environmental heterogeneity and functional beta diversity.

3.3. Functional Diversity and Community Assembly Patterns across Scales

The effects of spatial scale and ITV on the functional diversity within microsites (alpha diversity) were analyzed for multiple traits and every single trait at different spatial scales with and without ITV (Figure 2). Functional alpha diversity had no significant differences across each spatial scale with or without ITV. The relationship between spatial scales and functional alpha diversity significantly differed between that with ITV and that without ITV for most functional traits (Figure 2).
Our results showed that the functional beta diversity did not significantly differ across each spatial scale with or without ITV (Figure 3). The observed functional beta diversity, the relationship between spatial scale and functional beta diversity, significantly differed between analyses with ITV and those without ITV for most functional traits (Figure 3).
The SES of functional traits did not significantly differ across each spatial scale with or without ITV (Figure 4). Almost all SESs of traits showed random assembly patterns across scales, regardless of considering ITV or not. SES of SLA showed different patterns at 15 m × 15 m, 20 m × 20 m scales when comparing to other scales. SES of SDMC showed different patterns at 10 m × 10 m, 15 m × 15 m scales when comparing to other scales.

4. Discussion

As expected, our study emphasizes the importance of considering ITV when studying functional diversity patterns in an arid ecosystem with species-poor communities. In addition, our results showed that ITV could influence the observed functional diversity patterns [55,56,57]. As well as at small scales at which plant species manifest with competitive and facilitative interactions through phenotypic plasticity.
Some previous studies considered that the importance with/without ITV was highly dependent on the spatial scale [23,26]. A previous study has found in tropical forests that both habitat associations and niche differentiation shape species co-occurrence patterns from small to intermediate spatial scales [19]; Münkemüller et al. [58] suggested that scale choice is decisive in revealing signals in diversity patterns in European Alps. Nevertheless, these patterns show inconsistent results from our study. Our results indicated that ITV significantly affects functional diversity at any spatial scale, and considering ITV for every single trait does not lead to consistent results within plant communities. Functional alpha diversity based on leaf “chemical” traits tended to have higher alpha diversity when considering ITV in plant communities, which agrees with previous studies that found a high ITV in leaf chemical traits [21,26,59]. In contrast, morphological traits with ITV (such as LL, SLA, and H) showed lower functional alpha diversity than those without ITV (Figure 2), which may be due to high ITV. The pattern of functional beta diversity is similar to that of functional alpha diversity; beta diversity was higher based on chemical traits but lower based on morphological traits with ITV, suggesting a consistent trend for functional alpha and beta diversity beyond scales. In addition, among spatial scales, the functional alpha and beta diversities hardly shifted, suggesting that the traits that we selected were conservative; otherwise the habitat conditions were too homogeneous across scales based on our sampling design, which was confirmed by our pre-analysis.
In addition, environmental factors could also influence functional diversity, for example, Shiono et al. [60] reported that species richness decreases with increasing climate harshness in temperature and precipitation seasonality zones. The extremely dry conditions in our study area led to distinctive patterns of functional diversity. In our study, we measured five soil factors as direct environmental factors. We found that functional alpha diversity decreased as the variation in soil PC1 scores and NN increased, whereas alpha diversity increased along with pH (Supplementary Materials Figure S2). However, functional beta diversity changed weakly along several soil variation gradients (Supplementary Materials Figures S3 and S4). For other soil factors, there were no significant trends with functional beta diversity, indicating very weak relationships between functional beta diversity and soil factors resulting from the homogeneous conditions in our study.
In most previous studies, researchers generally paid great attention to the community assembly mechanism in tropical forests, which have high species richness, few restrictive factors, and rare niche differentiation [61,62]. The pattern of community assembly influences the diversity pattern. Tirado et al. [63] found through investigating the neighbor effect that positive interactions among species prevail in communities where positive species associations dominate; the appearance of benefactor species in patches increases species richness compared with that in the surrounding inter-shrub spaces in different semi-arid habitats in southeast Spain. Chalmandrier et al. [21] found that, at large spatial scales, the importance of the imprint of environmental filtering on functional diversity increases with increasing stress, while the effect of intraspecific variability on assembly rules is noticeable only at a small spatial scale in grassland communities [21]. In this study, a null model approach was used to test for trait-based assembly processes of shrub communities in an arid environment. When considering ITV, dissimilar trait-based assembly patterns would be shown based on different traits, in order to adapt to some environmental factors in an extreme arid condition. Here, LCC and RCC were convergent considering ITV, while SCC was divergent. Without considering ITV, filtering processes based on traits related to carbon (except SCC) were observed, while divergence patterns based on all traits related to nitrogen were observed, which may be caused by species interaction or even environmental filtering [64,65,66]. These results suggested that the carbon content was relatively conservative between different species, whereas the nitrogen content showed great variation since nitrogen participates in many plant metabolic processes. The SES based on the dry matter content (except SDMC) also showed filtering processes, indicating that desert plants have a tendency to adapt to the environment under water stress (dry matter content and moisture content are weighted against each other). The patterns of SCC and SDMC were obviously different from those in leaves and roots, which indicated that the stem traits of desert plants may be different from traits of leaves and roots, which is worth further study. Without considering ITV, the SES of multiple traits showed filtering patterns at different spatial scales. This result indicated that the extreme environment in the desert would result in a more consistent combination of traits, that is, environmental filtering may dominate the community assembly mechanism in this study area.
Besides, we found no significant change tendency in relationships of diversity and assembly pattern when considering ITV and without considering ITV across different scales. It indicated that the effect of ITV which influencing functional diversity and community assembly would not change with increasing scales.
For a community assembly study, there may be different results with or without considering ITV, suggesting that ITV is important for studying assembly patterns [10,11,24,26]. On the other hand, since more data enter the functional structure model when considering ITV, considering ITV seems more realistic than not considering it. Interestingly, in our study, almost all traits (including multiple-traits) exhibited a stochastic distribution when considering ITV. In other words, when considering ITV, community functional trait distributions may shift towards the opposite direction regardless of whether these traits have convergent or divergent patterns comparing to those without considering ITV. This phenomenon may lead to a consistent pattern of SES of these traits. Our results may draw a more “stochastic” pattern when considering ITV. Therefore, the neutral-like assembly pattern may be diluted by ITV, rather than by ecological processes. In general, in extreme environments, we used to expect the assembly pattern to be deterministic, but the current results suggest that the assembly pattern becomes more stochastic when ITV is considered. These results suggest that environmental filtering screens the weighted mean of community traits, but not individual trait values. Under extreme conditions, individuals still need to generate enough intraspecific variation to better occupy a limited niche. Therefore, when ITV is considered, traits that have been screened in the community may be masked, and the variation of traits displayed by individuals may lead to stochastic assembly patterns. Based on our findings, it is necessary to consider ITV when studying community assembly in arid regions in the future. Considering ITV can provide more information and a new perspective for studying the succession and development of communities in arid regions.

5. Conclusions

Our study in an extremely arid environment demonstrates the importance of ITV in diversity and community assembly analyses based on functional traits. Considering ITV greatly impacts functional diversity, and this effect is related to different types of traits (chemical traits or morphological traits). Specifically, our results indicate that the ITV effect does not change with increasing scales in community assembly. In addition, an extreme environment shapes specific combinations of traits. Our results also show that the community assembly process may be neutral at some levels and requires further study. When considering ITV in our study, the community assembly process may have been diluted, suggesting that ITV is important for studying assembly mechanisms in species-poor communities.

Supplementary Materials

The following are available online at https://www.mdpi.com/1424-2818/12/12/447/s1, Figure S1: Landscape vegetation distribution, Figure S2: Influence of environmental heterogeneity on functional alpha diversity, Figure S3: Influence of environmental heterogeneity on functional beta diversity, Figure S4: Influence of environmental heterogeneity on functional beta diversity, Table S1: Soil factors and species richness of each plot, Table S2: The species of this study, Table S3: PCA loadings of each functional trait on PCA 1 axis and PCA 2 axis, Table S4: PCA loadings of each soil factors on PCA 1 axis.

Author Contributions

M.Y. and Y.C. conceived and designed the experiments. T.T., M.L. and J.Q. performed the experiments. H.D., X.L., J.X. and Y.G. analyzed the data. H.D. and J.X. wrote the manuscript, J.X. and H.D. contributed equally to this work and should be considered co-first authors; the other authors provided editorial advice. All authors have read and agreed to the published version of the manuscript.

Funding

This study was financially supported by the National Natural Science Foundation of China (41571500, 31600337, 41871036), China Postdoctoral Science Foundation (2018M643717), and the Shaanxi Science and technology program (2020JQ-580).

Conflicts of Interest

The authors declare no conflict of interest.

Data Accessibility Statement

We will make sure to archive our data in a publicly accessible repository such as Dryad, FigShare, GenBank, etc. upon acceptance.

References

  1. Chesson, P. Mechanisms of maintenance of species diversity. Annu. Rev. Ecol. Evol. Syst. 2000, 31, 343–366. [Google Scholar] [CrossRef] [Green Version]
  2. McIntire, E.J.; Fajardo, A. Beyond description: The active and effective way to infer processes from spatial patterns. Ecology 2009, 90, 46–56. [Google Scholar] [CrossRef] [PubMed]
  3. Bellwood, D.R.; Klanten, S.; Cowman, P.F.; Pratchett, M.S.; Konow, N.; van Herwerden, L. Evolutionary history of the butterflyfishes (f: Chaetodontidae) and the rise of coral feeding fishes. J. Evol. Biol. 2010, 23, 335–349. [Google Scholar] [CrossRef] [PubMed]
  4. Ingram, T.; Shurin, J.B. Trait-based assembly and phylogenetic structure in northeast pacific rockfish assemblages. Ecology 2009, 90, 2444–2453. [Google Scholar] [CrossRef] [PubMed]
  5. Villéger, S.; Miranda, J.R.; Hernández, D.F.; Mouillot, D. Contrasting changes in taxonomic vs. functional diversity of tropical fish communities after habitat degradation. Ecol. Appl. 2010, 20, 1512–1522. [Google Scholar] [CrossRef]
  6. Paine, C.E.T.; Baraloto, C.; Chave, J.; Hérault, B. Functional traits of individual trees reveal ecological constraints on community assembly in tropical rain forests. Oikos 2011, 120, 720–727. [Google Scholar] [CrossRef]
  7. Laughlin, D.C.; Laughlin, D.E. Advances in modeling trait-based plant community assembly. Trends Plant Sci. 2013, 18, 584–593. [Google Scholar] [CrossRef]
  8. Rolhauser, A.G.; Pucheta, E. Annual plant functional traits explain shrub facilitation in a desert community. J. Veg. Sci. 2016, 27, 60–68. [Google Scholar] [CrossRef]
  9. McGill, B.J.; Enquist, B.J.; Weiher, E.; Westoby, M. Rebuilding community ecology from functional traits. Trends Ecol. Evol. 2006, 21, 178–185. [Google Scholar] [CrossRef]
  10. Bolnick, D.I.; Amarasekare, P.; Araújo, M.S.; Bürger, R.; Levine, J.M.; Novak, M.; Rudolf, V.H.W.; Schreiber, S.J.; Urban, M.C.; Vasseur, D.A. Why intraspecific trait variation matters in community ecology. Trends Ecol. Evol. 2011, 26, 183–192. [Google Scholar] [CrossRef] [Green Version]
  11. Violle, C.; Enquist, B.J.; Mcgill, B.J.; Jiang, L.; Albert, C.H.; Hulshof, C.; Jung, V.; Messier, J. The return of the variance: Intraspecific variability in community ecology. Trends Ecol. Evol. 2012, 27, 244–252. [Google Scholar] [CrossRef] [PubMed]
  12. Fajardo, A.; Piper, F.I. Intraspecific trait variation and covariation in a widespread tree species (Nothofagus pumilio) in southern Chile. New Phytol. 2011, 189, 259–271. [Google Scholar] [CrossRef] [PubMed]
  13. Fridley, J.D.; Grime, J.P.; Bilton, M. Genetic identity of interspecific neighbours mediates plant responses to competition and environmental variation in a species-rich grassland. J. Ecol. 2007, 95, 908–915. [Google Scholar] [CrossRef]
  14. Fridley, J.D.; Grime, J.P. Community and ecosystem effects of intraspecific genetic diversity in grassland microcosms of varying species diversity. Ecology 2010, 91, 2272–2283. [Google Scholar] [CrossRef] [PubMed]
  15. Jung, V.; Violle, C.; Mondy, C. Intraspecific variability and trait-based community assembly. J. Ecol. 2010, 98, 1134–1140. [Google Scholar] [CrossRef]
  16. Bergholz, K.; May, F.; Giladi, I. Environmental heterogeneity drives fine-scale species assembly and functional diversity of annual plants in a semi-arid environment. Perspect. Plant Ecol. Evol. Syst. 2017, 24, 138–146. [Google Scholar] [CrossRef]
  17. Shao, X.; Brown, C.; Worthy, S.J.; Liu, L.; Cao, M.; Li, Q.; Lin, L.; Swenson, N.G. Intra-specific relatedness, spatial clustering and reduced demographic performance in tropical rainforest trees. Ecol. Lett. 2018, 21, 1737–1751. [Google Scholar] [CrossRef]
  18. Chase, J.M.; Mcgill, B.J.; Thompson, P.L.; Antão Laura, H.; Bates, A.E.; Blowes, S.A. Species richness change across spatial scales. Oikos 2019, 128, 1079–1091. [Google Scholar] [CrossRef] [Green Version]
  19. Kraft, N.J.; Ackerly, D.D. Functional trait and phylogenetic tests of community assembly across spatial scales in an Amazonian forest. Ecol. Monogr. 2010, 80, 401–422. [Google Scholar] [CrossRef]
  20. Soliveres, S.; Smit, C.; Maestre, F.T. Moving forward on facilitation research: Response to changing environments and effects on the diversity, functioning and evolution of plant communities. Biol. Rev. 2015, 90, 297–313. [Google Scholar] [CrossRef] [Green Version]
  21. Koleff, P.; Gaston, K.J.; Lennon, J.J. Measuring beta diversity for presence–absence data. J. Anim. Ecol. 2003, 72, 367–382. [Google Scholar] [CrossRef] [Green Version]
  22. Swenson, N.G.; Enquist, B.J.; Thompson, J.; Zimmerman, J.K. The influence of spatial and size scale on phylogenetic relatedness in tropical forest communities. Ecology 2007, 88, 1770–1780. [Google Scholar] [CrossRef] [Green Version]
  23. Albert, C.H.; Grassein, F.; Schurr, F.M.; Vieilledent, G.; Violle, C. When and how should intraspecific variability be considered in trait-based plant ecology? Perspect. Plant Ecol. Evol. Syst. 2011, 13, 217–225. [Google Scholar] [CrossRef]
  24. Auger, S.; Shipley, B. Inter-specific and intra-specific trait variation along short environmental gradients in an old-growth temperate forest. J. Veg. Sci. 2013, 24, 419–428. [Google Scholar] [CrossRef]
  25. Yang, J.; Zhang, G.; Ci, X.; Swenson, N.G.; Cao, M.; Sha, L.; Li, J.; Baskin, C.C.; Slik, J.W.F.; Lin, L.; et al. Functional and phylogenetic assembly in a Chinese tropical tree community across size classes, spatial scales and habitats. Funct. Ecol. 2014, 28, 520–529. [Google Scholar] [CrossRef]
  26. Siefert, A.; Violle, C.; Chalmandrier, L.; Albert, C.H.; Taudiere, A.; Fajardo, A.; Aarssen, L.W.; Baraloto, C.; Carlucci, M.B.; Cianciaruso, M.V.; et al. A global meta-analysis of the relative extent of intraspecific trait variation in plant communities. Ecol. Lett. 2015, 18, 1406–1419. [Google Scholar] [CrossRef] [Green Version]
  27. Spasojevic, M.J.; Turner, B.L.; Myers, J.A. When does intraspecific trait variation contribute to functional beta-diversity? J. Ecol. 2016, 104, 487–496. [Google Scholar] [CrossRef] [Green Version]
  28. Siefert, A.; Fridley, J.D.; Ritchie, M.E. Community functional responses to soil and climate at multiple spatial scales: When does intraspecific variation matter? PLoS ONE 2014, 9, e111189. [Google Scholar] [CrossRef]
  29. Emerson, B.C.; Gillespie, R.G. Phylogenetic analysis of community assembly and structure over space and time. Trends Ecol. Evol. 2008, 23, 619–630. [Google Scholar] [CrossRef]
  30. Giladi, I.; Ziv, Y.; May, F.; Jeltsch, F. Scale-dependent determinants of plant species richness in a semi-arid fragmented agro-ecosystem. J. Veg. Sci. 2011, 22, 983–996. [Google Scholar] [CrossRef]
  31. Bernard-Verdier, M.; Garnier, E. Community assembly along a soil depth gradient: Contrasting patterns of plant trait convergence and divergence in a Mediterranean rangeland. J. Ecol. 2012, 100, 1422–1433. [Google Scholar] [CrossRef]
  32. de Bello, F.; Lavorel, S.; Lavergne, S.; Albert, C.H.; Boulangeat, J.; Mazel, F.; Thuiller, W. Hierarchical effects of environmental filters on the functional structure of plant communities: A case study in the French Alps. Ecography 2013, 36, 393–402. [Google Scholar] [CrossRef]
  33. Thompson, A.J.; Lester, H.A.; Lummis, S.C. The structural basis of function in Cys-loop receptors. Q. Rev. Biophys. 2010, 43, 449–499. [Google Scholar] [CrossRef] [PubMed] [Green Version]
  34. Weiher, E.; Freund, D.; Bunton, T.; Stefanski, A.; Lee, T.; Bentivenga, S. Advances, challenges and a developing synthesis of ecological community assembly theory. Philos. Trans. R. Soc. B-Biol. Sci. 2011, 366, 2403–2413. [Google Scholar] [CrossRef] [PubMed]
  35. Götzenberger, L.; de Bello, F.; Bråthen, K.A.; Davison, J.; Dubuis, A.; Guisan, A.; Lepš, J.; Lindborg, R.; Moora, M.; Pärtel, M.; et al. Ecological assembly rules in plant communities-approaches, patterns and prospects. Biol. Rev. 2012, 87, 111–127. [Google Scholar] [CrossRef]
  36. Cavender-Bares, J.; Kozak, K.H.; Fine, P.V.; Kembel, S.W. The merging of community ecology and phylogenetic biology. Ecol. Lett. 2009, 12, 693–715. [Google Scholar] [CrossRef] [PubMed]
  37. Laliberté, E.; Norton, D.A.; Scott, D. Contrasting effects of productivity and disturbance on plant functional diversity at local and metacommunity scales. J. Veg. Sci. 2013, 24, 834–842. [Google Scholar] [CrossRef]
  38. Xu, J.S.; Chen, Y.; Zhang, L.X.; Chai, Y.F.; Wang, M.; Guo, Y.X.; Li, T.; Yue, M. Using phylogeny and functional traits for assessing community assembly along environmental gradients: A deterministic process driven by elevation. Ecol. Evol. 2017, 7, 5056–5069. [Google Scholar] [CrossRef] [Green Version]
  39. Aguiar, M.R.; Sala, O.E. Patch structure, dynamics and implications for the functioning of arid ecosystems. Trends Ecol. Evol. 1999, 14, 273–277. [Google Scholar] [CrossRef]
  40. Chen, S.; Xu, K.; Dong, A.; Xia, Q. Analysis on spatial distribution of cumulonimbus and its circulation characteristics over the Qilian Mountains. Arid Zone Res. 2010, 27, 114–120. [Google Scholar] [CrossRef]
  41. Wei, G.; Chen, S.; Zhang, Y. Sandstorms changing characteristics in the south edge of the Tengger Desert-Jingtai County, Gansu province as a case study. Arid Zone Res. 2015, 32, 1133–1139. [Google Scholar]
  42. Kong, L.; Shen, J. Analysis on species diversity of plant communities. J. Ningxia Agric. Coll. 2003, 24, 25–28. [Google Scholar]
  43. Cornelissen, J.H.C.; Lavorel, S.; Garnier, E.; Díaz, S.; Buchmann, N.; Gurvich, D.E.; Reich, P.B.; Steege, H.; Morgan, H.D.; Heijden, M.G.A.; et al. A handbook of protocols for standardised and easy measurement of plant functional traits worldwide. Aust. J. Bot. 2003, 51, 335–380. [Google Scholar] [CrossRef] [Green Version]
  44. Chacón-Labella, J.; Cruz, M.D.L.; Pescador, D.S.; Escudero, A. Individual species affect plant traits structure in their surroundings: Evidence of functional mechanisms of assembly. Oecologia 2016, 180, 975–987. [Google Scholar] [CrossRef] [PubMed]
  45. Xu, J.S.; Dang, H.; Wang, M.; Chai, Y.F.; Yue, M. Is phylogeny more useful than functional traits for assessing diversity patterns under community assembly processes? Forests 2019, 10, 1159. [Google Scholar] [CrossRef] [Green Version]
  46. Díaz, A.; Macnair, M.R. The effect of plant size on the expression of cleistogamy in Mimulus nasutus. Funct. Ecol. 1998, 12, 92–98. [Google Scholar] [CrossRef]
  47. Blonder, B.; Lamanna, C.; Violle, C.; Enquist, B.J. The n-dimensional hypervolume. Glob. Ecol. Biogeogr. 2014, 23, 595–609. [Google Scholar] [CrossRef]
  48. Mason, N.W.H.; MacGillivray, K.; Steel, J.B. An index of functional diversity. J. Veg. Sci. 2003, 14, 571–578. [Google Scholar] [CrossRef]
  49. Mason, N.W.H.; Mouillot, D.; Lee, W.G.; Wilson, J.B. Functional richness, functional evenness and functional divergence: The primary components of functional diversity. Oikos 2005, 111, 112–118. [Google Scholar] [CrossRef]
  50. Mouchet, M.A.; Villéger, S.; Mason, N.W.; Mouillot, D. Functional diversity measures: An overview of their redundancy and their ability to discriminate community assembly rules. Funct. Ecol. 2010, 24, 867–876. [Google Scholar] [CrossRef]
  51. Swenson, N.G.; Stegen, J.C.; Davies, S.J.; Erickson, D.L.; Forero-Montaña, J.; Hurlbert, A.H.; Kress, W.J.; Thompson, J.; Uriarte, M.; Wright, S.J.; et al. Temporal turnover in the composition of tropical tree communities: Functional determinism and phylogenetic stochasticity. Ecology 2012, 93, 490–499. [Google Scholar] [CrossRef] [PubMed]
  52. de Bello, F.; Price, J.N.; Münkemüller, T.; Liira, J.; Zobel, M.; Thuiller, W.; Gerhold, P.; Götzenberger, L.; Lavergne, S.; Leps, J.; et al. Functional species pool framework to test for biotic effects on community assembly. Ecology 2012, 93, 2263–2273. [Google Scholar] [CrossRef] [PubMed] [Green Version]
  53. Chalmandrier, L.; Münkemüller, T.; Colace, M.P.; Renaud, J.; Aubert, S.; Carlson, B.Z.; Clément, J.C.; Legay, N.; Pellet, G.; Saillard, A.; et al. Spatial scale and intraspecific trait variability mediate assembly rules in alpine grasslands. J. Ecol. 2017, 105, 277–287. [Google Scholar] [CrossRef] [Green Version]
  54. Chalmandrier, L.; Münkemüller, T.; Gallien, L.; de Bello, F.; Mazel, F.; Lavergne, S.; Thuiller, W. A family of null models to distinguish between environmental filtering and biotic interactions in functional diversity patterns. J. Veg. Sci. 2013, 24, 853–864. [Google Scholar] [CrossRef] [PubMed]
  55. García-Cervigón, A.I.; Linares, J.C.; Aibar, P.; Olano, J.M. Facilitation promotes changes in leaf economics traits of a perennial forb. Oecologia 2015, 179, 103–116. [Google Scholar] [CrossRef] [PubMed]
  56. Violle, C.; Castro, H.; Richarte, J.; Navas, M.L. Intraspecific seed trait variations and competition: Passive or adaptive response? Funct. Ecol. 2009, 23, 612–620. [Google Scholar] [CrossRef]
  57. Gubsch, M.; Buchmann, N.; Schmid, B.; Schulze, E.D.; Lipowsky, A.; Roscher, C. Differential effects of plant diversity on functional trait variation of grass species. Ann. Bot. 2011, 107, 157–169. [Google Scholar] [CrossRef] [Green Version]
  58. Münkemüller, T.; Gallien, L.; Lavergne, S.; Renaud, J.; Roquet, C.; Abdulhak, S.; Dullinger, S.; Garraud, L.; Guisan, A.; Lenoir, J.; et al. Scale decisions can reverse conclusions on community assembly processes. Glob. Ecol. Biogeogr. 2014, 23, 620–632. [Google Scholar] [CrossRef] [Green Version]
  59. Kazakou, E.; Violle, C.; Roumet, C.; Navas, M.L.; Vile, D.; Kattge, J.; Garnier, E. Are trait-based species rankings consistent across data sets and spatial scales? J. Veg. Sci. 2014, 25, 235–247. [Google Scholar] [CrossRef]
  60. Shiono, T.; Kusumoto, B.; Maeshiro, R.; Fujii, S.J.; Götzenberger, L.; de Bello, F.; Kubota, Y. Climatic drivers of trait assembly in woody plants in Japan. J. Biogeogr. 2015, 42, 1176–1186. [Google Scholar] [CrossRef]
  61. Kraft, N.J.; Valencia, R.; Ackerly, D.D. Functional traits and niche-based tree community assembly in an Amazonian forest. Science 2008, 322, 580–582. [Google Scholar] [CrossRef] [PubMed] [Green Version]
  62. Baraloto, C.; Hérault, B.; Cet, P.; Zimmerman, B.L. Contrasting taxonomic and functional responses of a tropical tree community to selective logging. J. Appl. Ecol. 2012, 49, 861–870. [Google Scholar] [CrossRef]
  63. Tirado, R.I.; Pugnaire, F. Community structure and positive interactions in constraining environments. Oikos 2005, 111, 437–444. [Google Scholar] [CrossRef]
  64. Mayfield, M.M.; Levine, J.M. Opposing effects of competitive exclusion on the phylogenetic structure of communities. Ecol. Lett. 2010, 13, 1085–1093. [Google Scholar] [CrossRef]
  65. Dante, S.K.; Schamp, B.S.; Aarssen, L.W. Evidence of deterministic assembly according to flowering time in an old-field plant community. Funct. Ecol. 2013, 27, 555–564. [Google Scholar] [CrossRef]
  66. Laliberté, E.; Zemunik, G.; Turner, B.L. Environmental filtering explains variation in plant diversity along resource gradients. Science 2014, 345, 1602–1605. [Google Scholar] [CrossRef]
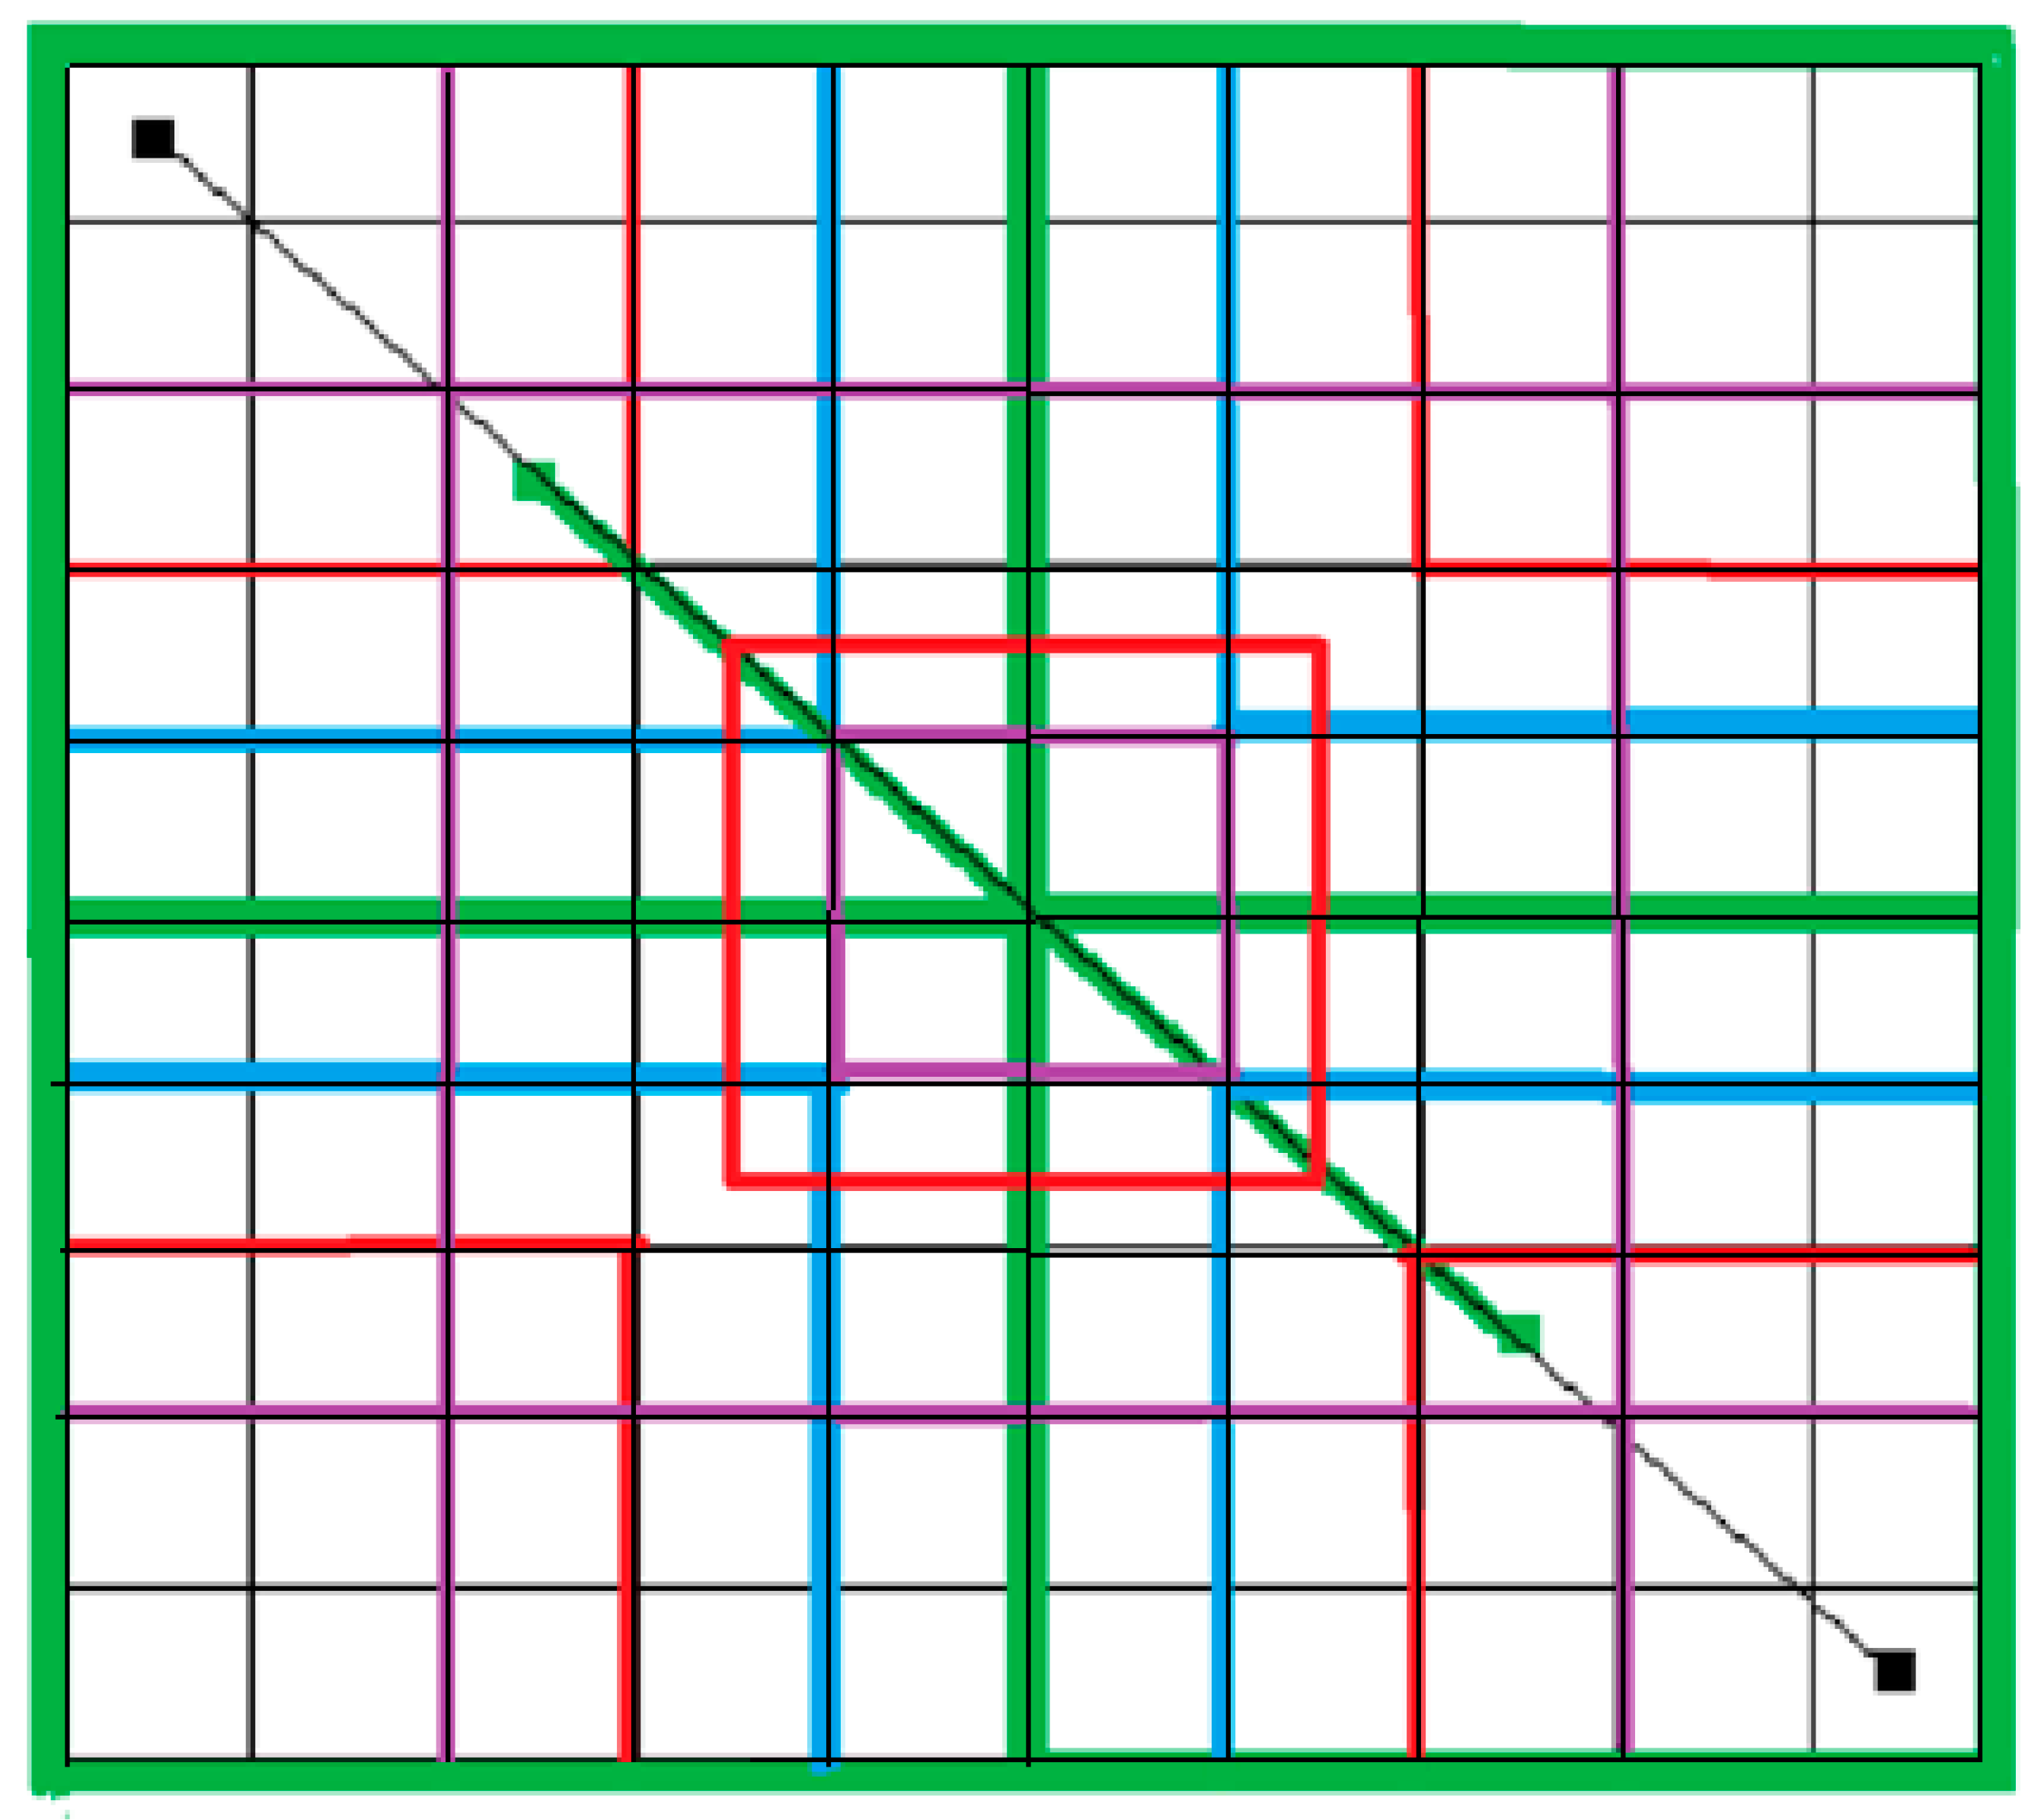
Figure 1. Sampling design. Each black square represents a 5 m × 5 m plot. The purple square represents a 10 m × 10 m plot; the red square represents a 15 m × 15 m plot; the blue square represents 20 m × 20 m plot; the green squares represent 25 m × 25 m plots. For 5 m × 5 m, 10 m × 10 m, 15 m × 15 m and 20 m × 20 m scales, not all side is exhibited here to avoid visual interference. The black plots represent the soil collection sites of the 5 m × 5 m plots, the green plots represent the soil collection sites of the 25 m × 25 m plots. The black straight line represents the farthest distance of a 5 m × 5 m plot-pair, and the green straight line represents the farthest distance of a 25 m × 25 m plot-pair.
Diversity 12 00447 g001
Figure 2. Influence of spatial scales and intraspecific trait variation (ITV) on the functional alpha diversity (mean ± SE). There are five spatial settings: 5 m × 5 m, 10 m × 10 m, 15 m × 15 m, 20 m × 20 m, 25 m × 25 m. The functional alpha diversity of multiple traits for different spatial scales is shown in the top left panel. Functional alpha diversity of single traits for different spatial scales are shown in their respective panels (including leaf carbon content (LCC), leaf dry matter content (LDMC), leaf phosphorus content (LPC), leaf nitrogen content (LNC), stem dry matter content (SDMC), stem carbon content (SCC), stem carbon content (SNC), root carbon content (RCC), root nitrogen content (RNC), root dry matter content (RDMC), canopy range (CR), leaf length (LL), specific leaf area (SLA), and height (H)). Hollow black point: including ITV; solid black point: not including ITV, * means p < 0.05.
Diversity 12 00447 g002
Figure 3. Influence of spatial scales and intraspecific trait variation (ITV) on the functional beta diversity (mean ± SE). There are five spatial settings: 5 m × 5 m, 10 m × 10 m, 15 m × 15 m, 20 m × 20 m, 25 m × 25 m. Functional beta diversity of multiple traits for different spatial scales is shown in the top left panel. Functional beta diversity of single traits for different spatial scales are shown in their respective panels (including leaf carbon content (LCC), leaf dry matter content (LDMC), leaf phosphorus content (LPC), leaf nitrogen content (LNC), stem dry matter content (SDMC), stem carbon content (SCC), stem carbon content (SNC), root carbon content (RCC), root nitrogen content (RNC), root dry matter content (RDMC), canopy range (CR), leaf length (LL), specific leaf area (SLA), and height (H)). Hollow black point: including ITV; solid black point: not including ITV, * means p < 0.05.
Diversity 12 00447 g003
Figure 4. Influence of spatial scales on the standard effect size of functional diversity (SES, mean ± SE). SES represents the deviation of functional diversities of a plot at a given spatial scale from its null distributions. There are five spatial settings: 5 m × 5 m, 10 m × 10 m, 15 m × 15 m, 20 m × 20 m, 25 m × 25 m. The SES of multiple traits for different spatial scales is shown in the top left panel. The SESs of single traits for different spatial scales are shown in their respective panels (including leaf carbon content (LCC), leaf dry matter content (LDMC), leaf phosphorus content (LPC), leaf nitrogen content (LNC), stem dry matter content (SDMC), stem carbon content (SCC), stem carbon content (SNC), root carbon content (RCC), root nitrogen content (RNC), root dry matter content (RDMC), canopy range (CR), leaf length (LL), specific leaf area (SLA), and height (H)). Hollow black point: including ITV; solid black point: not including ITV, * means p < 0.05.
Diversity 12 00447 g004
Publisher’s Note: MDPI stays neutral with regard to jurisdictional claims in published maps and institutional affiliations.