Article

Plasticity in Three-Dimensional Geometry of Branching Corals Along a Cross-Shelf Gradient

by
Neil E. Doszpot
1,
Michael J. McWilliam
2,
Morgan S. Pratchett
2,
Andrew S. Hoey
2 and
Will F. Figueira
1,*
1
School of Life and Environmental Sciences, University of Sydney, Sydney, NSW 2006, Australia
2
ARC Centre of Excellence for Coral Reef Studies, James Cook University, Townsville, QLD 4811, Australia
*
Author to whom correspondence should be addressed.
Diversity 2019, 11(3), 44; https://doi.org/10.3390/d11030044
Submission received: 31 January 2019 / Revised: 7 March 2019 / Accepted: 13 March 2019 / Published: 21 March 2019

Abstract

:
Scleractinian corals often exhibit high levels of morphological plasticity, which is potentially important in enabling individual species to occupy benthic spaces across a wide range of environmental gradients. This study tested for differences in the three-dimensional (3D) geometry of three branching corals, Acropora nasuta, Pocillopora spp. and Stylophora pistillata among inner-, mid- and outer-shelf reefs in the central Great Barrier Reef, Australia. Important attributes of coral morphology (e.g., surface area to volume ratio) were expected to vary linearly across the shelf in accordance with marked gradients in environmental conditions, but instead, we detected non-linear trends in the colony structure of A. nasuta and Pocillopora spp. The surface area to volume ratio of both A. nasuta and Pocillopora spp. was highest at mid-shelf locations, (reflecting higher colony complexity) and was significantly lower at both inner-shelf and outer-shelf reefs. The branching structure of these corals was also far more tightly packed at inner-shelf and outer-shelf reefs, compared to mid-shelf reefs. Apparent declines in complexity and inter-branch spacing at inner and outer-shelf reefs (compared to conspecifics from mid-shelf reefs) may reflect changes driven by gradients of sedimentation and hydrodynamics. The generality and explanations of observed patterns warrant further investigation, which is very feasible using the 3D-photogrammetry techniques used in this study.

1. Introduction

Variability in traits is known to influence species’ functional importance in ecosystems [1]. Trait plasticity among individuals of the same species constitutes a major component of this variation [2], however intraspecific variability is often ignored due to difficulties in measuring the traits of individuals at large scales and with readily quantifiable metrics. On tropical coral reefs, morphological variation among reef-building corals is a conspicuous and functionally important source of trait variation. Coral morphology is associated with critical attributes including growth [3], photosynthesis [4], fecundity [5], susceptibility to disturbance [6] and life history [7]. The structural complexity, surface area and hole size of corals can also influence the diversity and abundance of associated reef fish species [8,9]. It is not surprising, therefore, that previous measures of trait diversity in corals are heavily focused on among-species differences in morphology [10,11]. Nevertheless, our understanding of morphological plasticity within species is still emerging, putting into question the true extent of inter-specific differences and the capacity for corals to modify their functional attributes in response to changing environmental conditions [12].
Morphological plasticity in scleractinian corals can be substantial [12] and is most often linked to variation in light and/or water flow [13,14,15]. Marked inter- and intra-specific differences in the growth and morphology of scleractinian corals have been documented with depth, which is generally attributed to changing light conditions (e.g., references [14,16,17]). Anthony et al. [16] showed that variation in the morphology of Turbinaria mesenterina optimizes within-colony irradiance along gradients of depth and light, shifting from tightly spaced whorls in shallow, high light environments to horizontal plates in deeper, low light environments. Changes to coral morphology can also occur in response to water flow. In Hawaii, Lesser et al. [18] observed that Pocillopora damicornis collected from high flow environments had thicker branches, compared to conspecifics from low flow environments, which is likely to increase resistance to more extreme flow conditions. Importantly, erect branching corals are extremely vulnerable to breakage and dislodgement from large storm-generated waves [19]. Morphological plasticity may allow coral species to tolerate a much wider range of environmental conditions and thereby greatly extend their capacity to occupy different environments. There are however few efficient, universal, quantifiable measures of morphology and the mechanistic drivers of this variation are yet to be explored.
Although not tested, coral morphology is also likely to vary along cross-shelf (inshore to offshore) gradients, reflecting changes in sediment loads [20], light penetration [21,22], input of terrestrial nutrients [23], and wave exposure [24]. Such differences in colony morphology may in turn influence the functional role of corals (e.g., influencing occupation by coral-dwelling fishes [25]) as well as their vulnerability to disturbance (e.g., reference [19]). While there are conspicuous cross-shelf differences in the species composition of coral assemblages and relative abundance of different corals (e.g., references [26,27]), some coral species do occur across inner-, mid- and outer-shelf reefs (e.g., reference [28]). Corals living on outer-reefs are likely to experience much higher wave exposure and water movement [24], whereas corals in inner-shelf reefs will be much more exposed to land-based sources of nutrients, sediments and pollutants [29,30]. As such, we would expect that corals would be more compact in response to increasing mechanical exposure, from inshore to offshore [31,32]. Conversely, corals from inner-shelf, near shore environments might be expected to have more simple structures and lower surface area compared to conspecifics from outer-shelf reefs, reflecting increased reliance on heterotrophy and greater capacity for sediment shedding [13,22,33].
This study explores variation in the three-dimensional structure of three species of coral, Acropora nasuta, Pocillopora spp. and Stylophora pistillata among inner--, mid-- and outer-shelf reefs in the central Great Barrier Reef (GBR), Australia. Specifically, this study tests two potentially competing hypotheses regarding cross-shelf variation in colony structure. Notably, increasing mechanical exposure at offshore reefs may lead to more compact or robust morphologies, but also high levels of sedimentation and turbidity in near shore environments may lead to reduced complexity and surface area of coral colonies. This study is novel because rather than using standard morphometric measurements, variation in colony structure is discerned using high resolution 3D photogrammetric modeling (e.g., references [34,35]) with novel metrics used to characterize important attributes of colony structure. This study will further highlight how 3D photogrammetric modeling can be applied to examine the biology and ecology of scleractinian corals. Importantly, differences in colony structure may have important effects on demography and population dynamics in different habitats [19,28] as well as influencing key ecological functions (e.g. predation [36], physical refuge and spatial competition [2,37]) of branching corals [25,38].

2. Materials and Methods

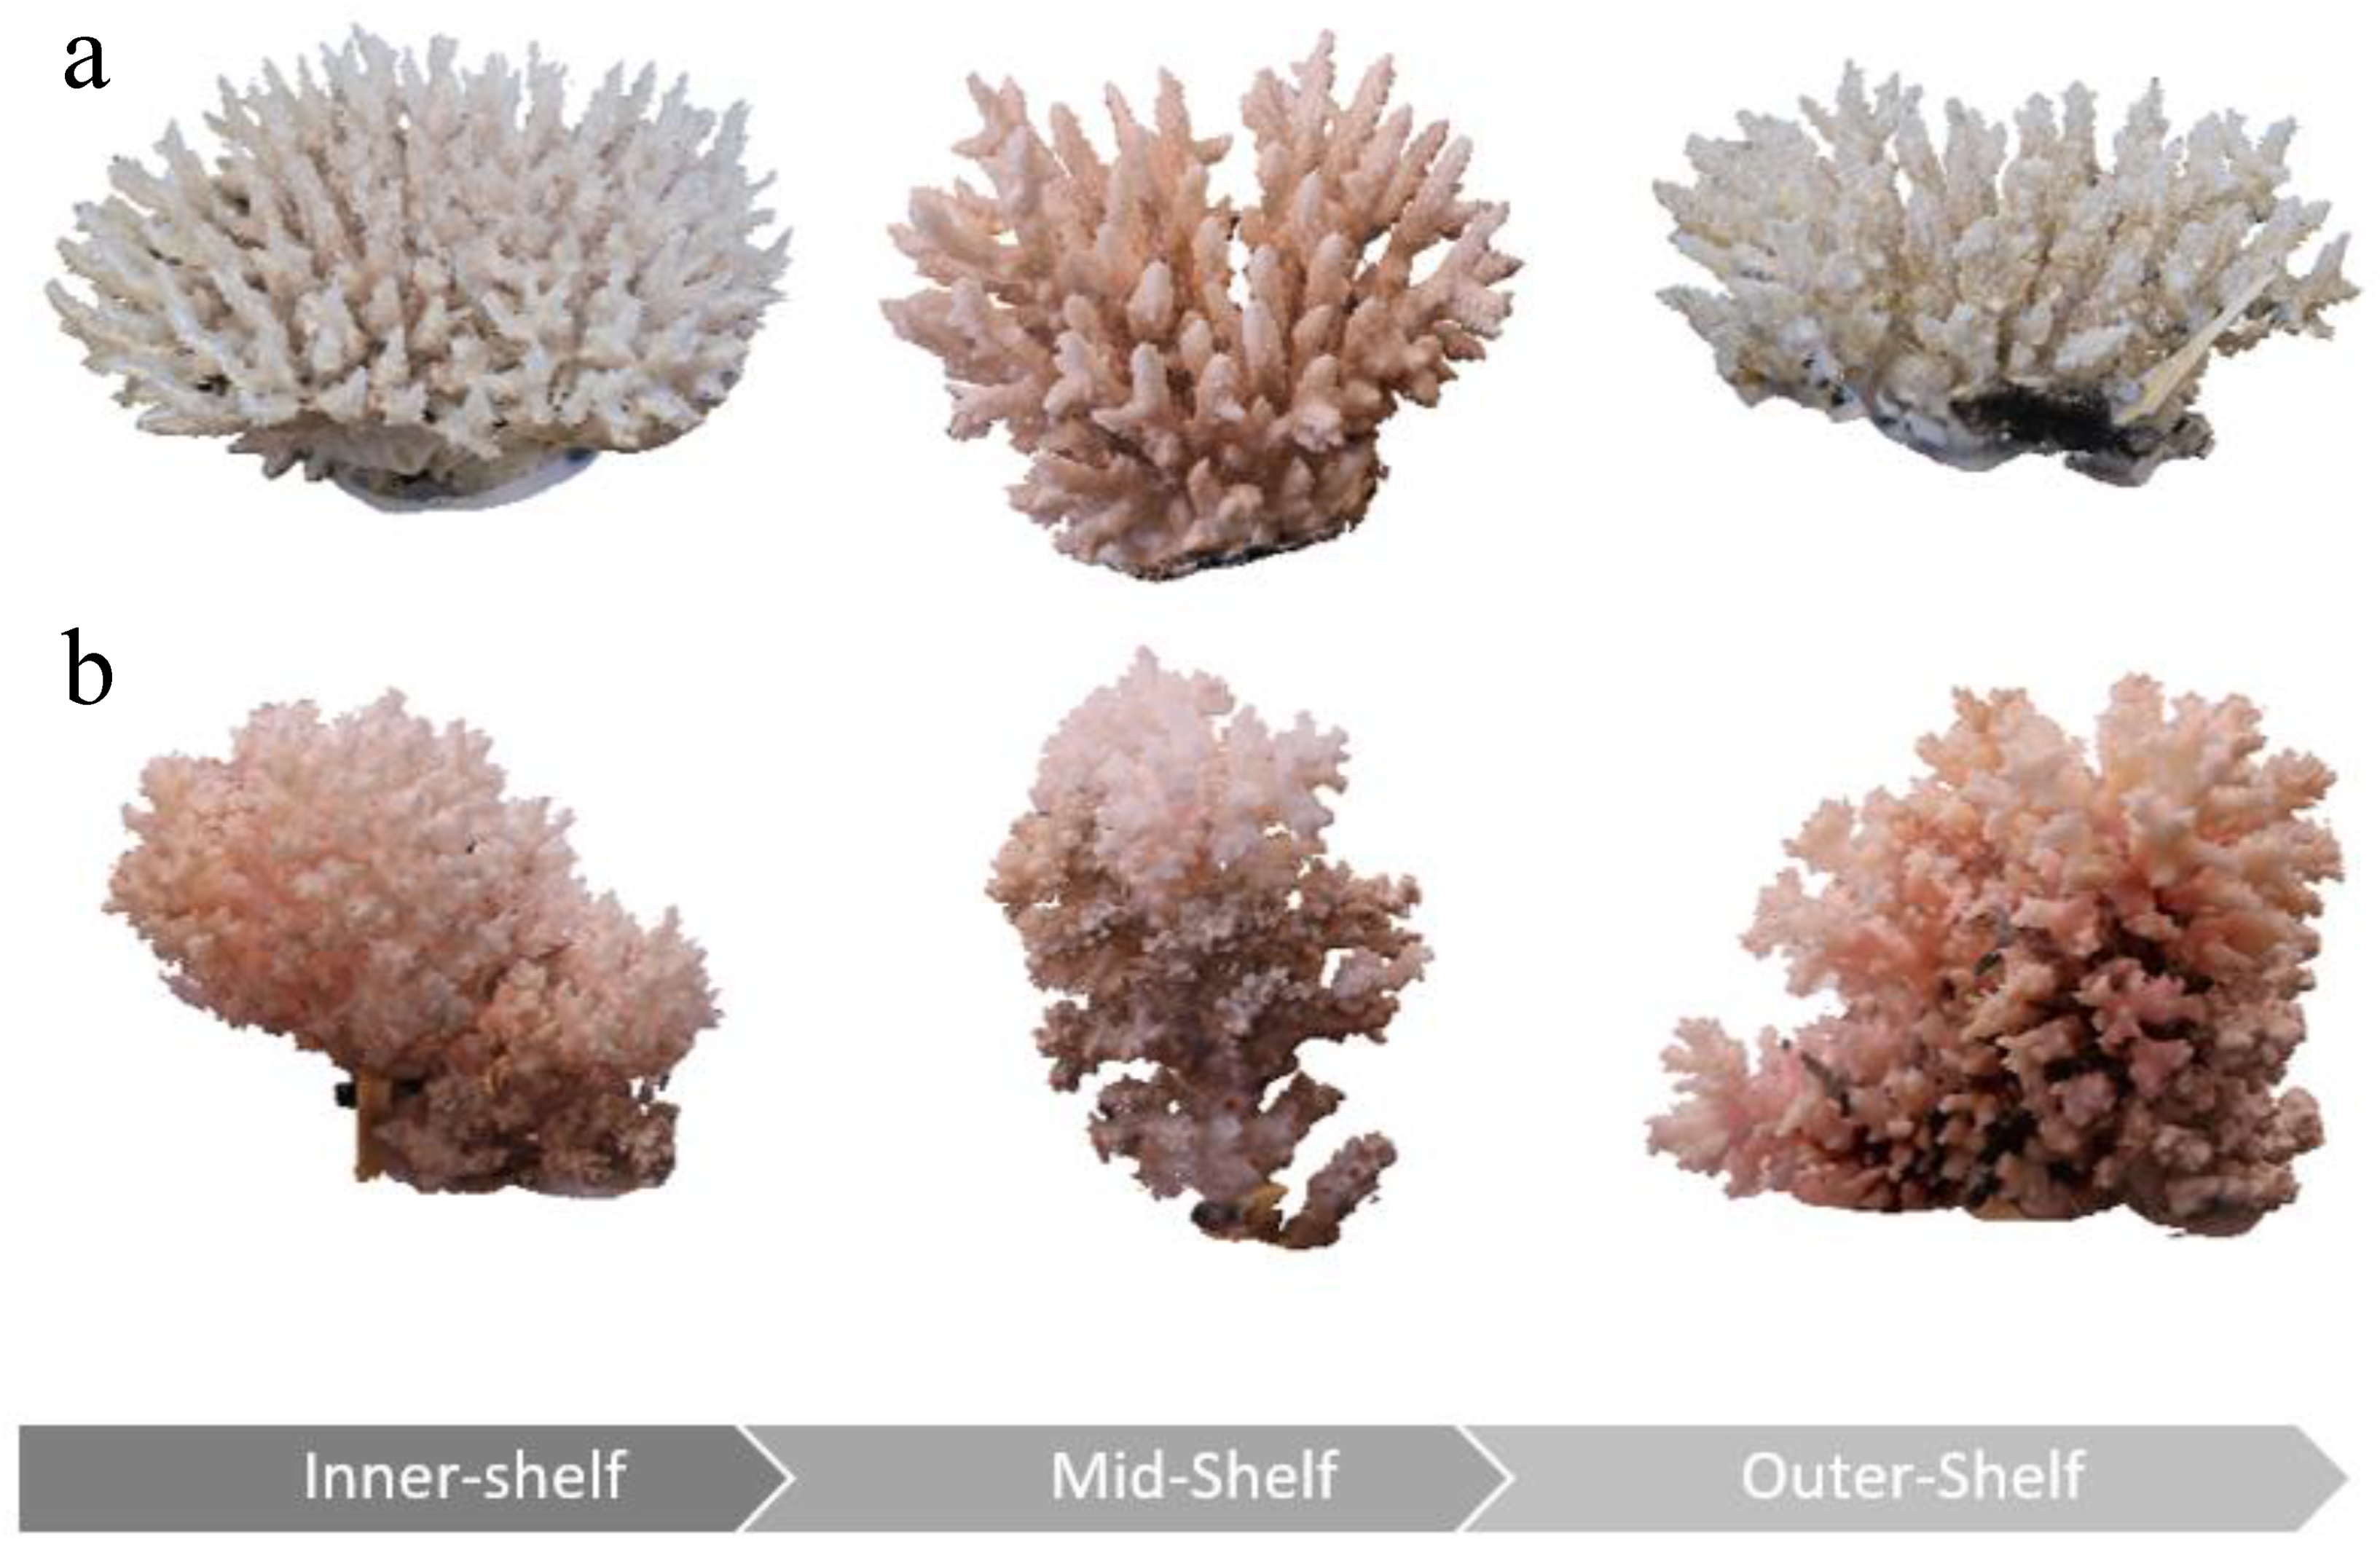
2.1. Sample Size and Collection

Replicate coral colonies of each of three different coral species (Acropora nasuta, Pocillopora spp., and Stylophora pistillata) were collected during December 2016 at six reefs in the central GBR deemed representative of inner-shelf (Pelorus and Orpheus), mid-shelf (Bramble and Truck) and outer-shelf (Pith and Unnamed) locations. All sampling was conducted on the western margin of each reef, to standardize local exposure to south-easterly swells, although there are still expected to be increases in wave exposure and water movement with distance offshore [24]. Corals used in this study were collected primarily to test for cross-shelf variation in coral growth using staining [28]. Inherent differences in coral abundance and survival of stained colonies led to uneven sampling among locations; a total of 96 corals were successfully collected, bleached, transported to Townsville and imaged for photogrammetry (Table 1). Most notably, samples of S. pistillata at inner-shelf or mid-shelf reefs were very limited, due to low abundance and poor survival of these corals, respectively [28]. These data are nonetheless included, to test for intra-specific variation in colony attributes.

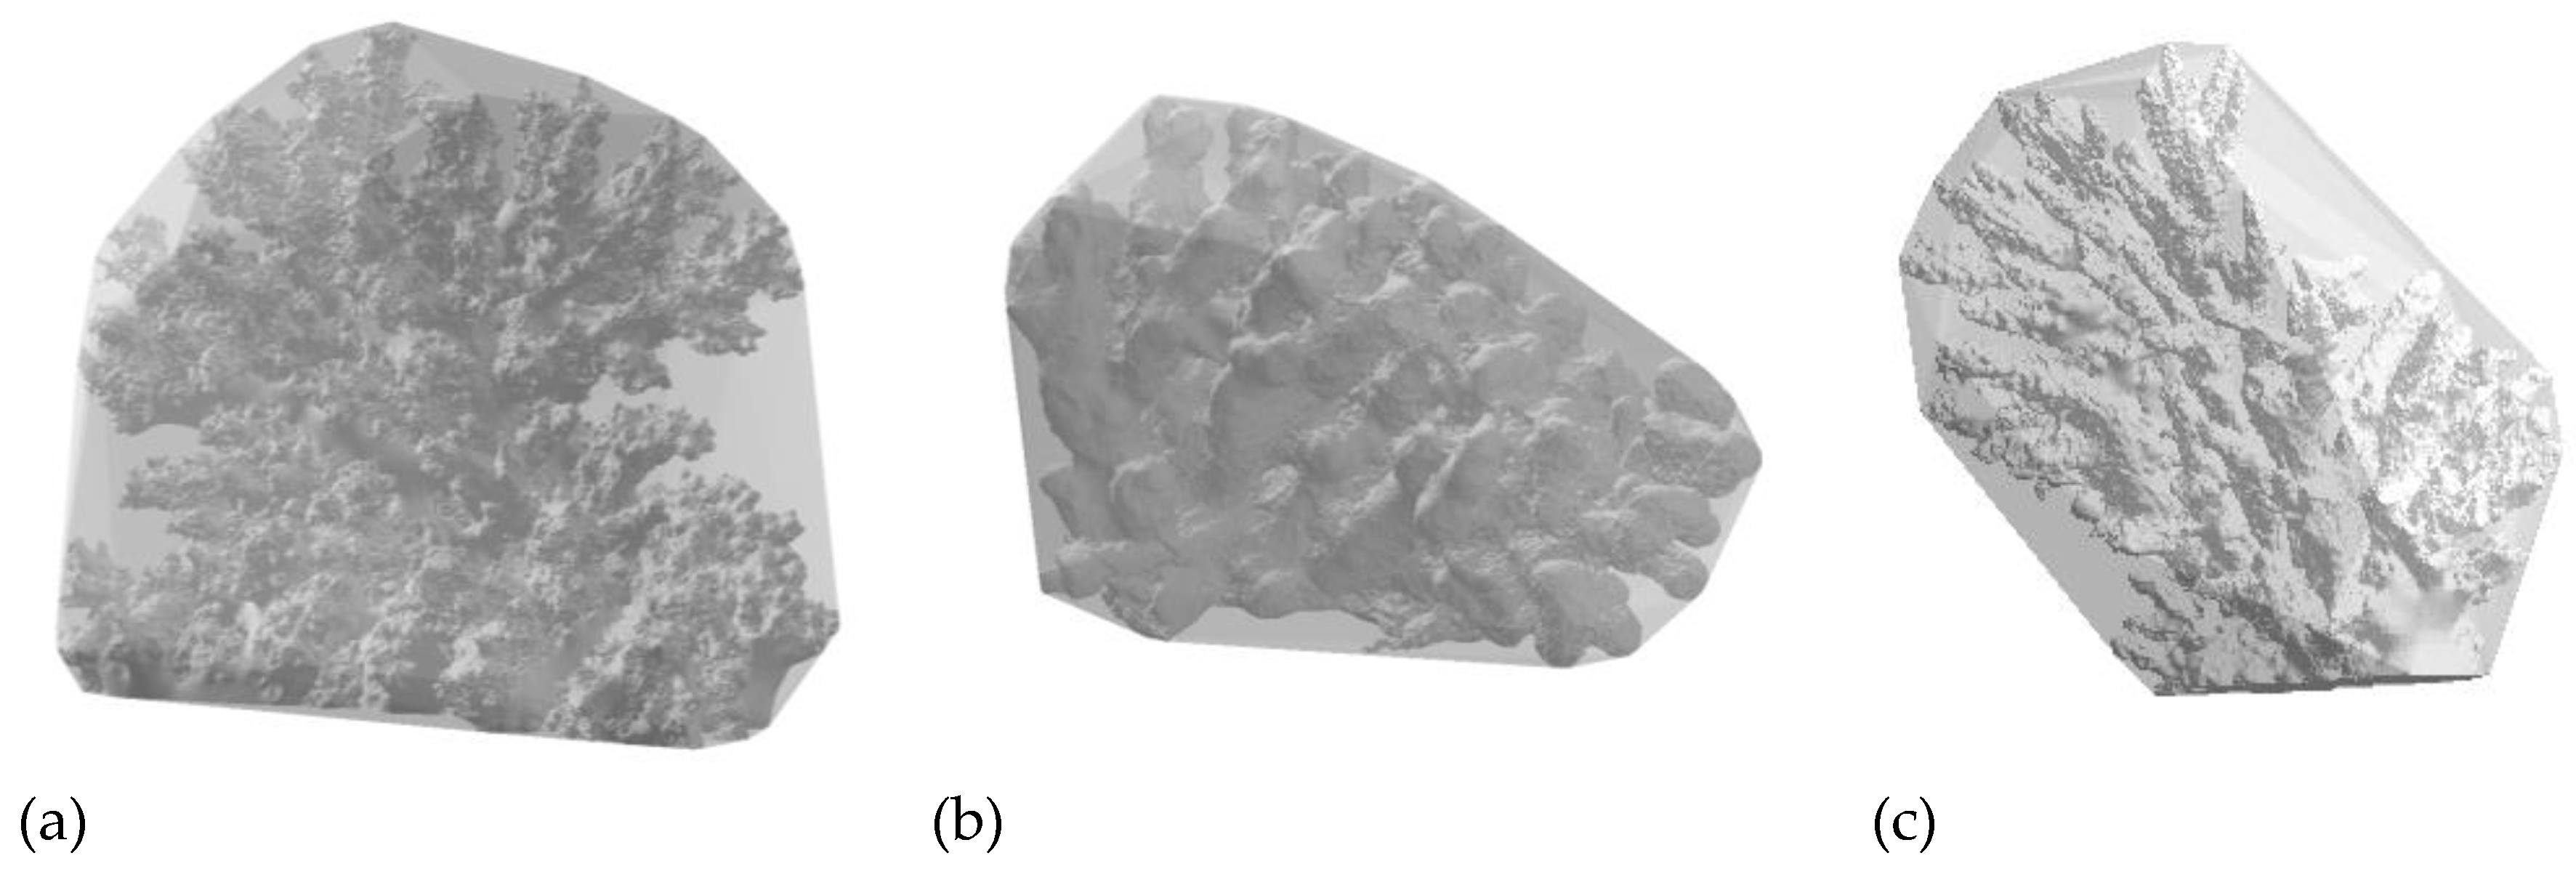
2.2. Photogrammetry & Measurements of Complexity

This study was opportunistic, making use of coral skeletons where coral colonies were collected and sacrificed to document growth rates [28]. All colonies were therefore, imaged under lab conditions. Individual coral colonies were oriented as they grew naturally on a table and imaged in air using a Cannon Powershot Gx7 handheld camera (‘Auto’ setting, 9 mm focal length, 20MP, 5472 × 3648), with two scale features (Rubik’s Cubes and set squares) of known size (55 mm and 127 mm respectively) included in the scene. Image capture followed a hemispherical pattern as described in Figueira et al. [34], providing approximately 100 images captured from various angles with >80% overlap amongst adjacent images. Images were taken from similar distances (~500 mm) to the colony however, where necessary, the distance of the camera was adjusted to ensure that the colony remained the dominant feature of each image.
Three-dimensional (3D) models of each colony were built using the software Photoscan Professional (V1.4.1, Agisoft LLC, St. Petersburg, Russia) as per Ferrari et al. [35]. Images were initially filtered for suitability using the “Estimate Image Quality” tool with low quality images (typically quality value < 0.5) removed from consideration. Model building generally followed the standard photogrammetry methodology (see Table 2 for parameter values) though the dense cloud was trimmed to include just the coral model prior to building of the mesh. The model was scaled at the dense cloud stage using two separate objects of known size (Rubik Cube, 55 mm), one in the horizontal and one in the vertical dimension.
Once complete, coral meshes were exported from Photoscan Professional (V1.4.1, Agisoft LLC, St. Petersburg, Russia) and imported to GeoMagic Control (V2015, 3D Systems, Rock Hill, USA). Self-intersections, non-manifold edges, small holes and small features were eliminated via the ‘Mesh Doctor’ function then surface area and volume measurements were taken and the ratio of surface area to volume (SAV) was calculated. ArcScene (V10.5, ESRI. Redlands, USA) was used to construct and measure the volume of a 3D minimum bounding convex hull (Figure 1). From this the proportion occupied (Coral Volume/Convex Hull Volume) was calculated. High proportion occupied (PrOcc) ratios indicates less free space between coral branches, which suggests a more compact or club-like growth structure.

2.3. Statistical Analysis

General Linear Models (GLM) were used to evaluate the effect of Shelf Position (fixed, three levels) and Species (fixed, two levels) on the two metrics of structural complexity considered here, PrOcc and SAV. Reef was included as a random nested factor within Shelf Position. Samples ranged in physical size (here expressed in ‘bounding volume’) from 0.155 × 10³–4.702 × 10³ m3. To control for the possibility that the interior regions of larger corals may be more poorly resolved (leading to overestimated PrOcc and underestimated SAV values) as they are not as clearly visualized by photographs, we included the volume of the minimum convex hull as a covariate in the statistical model. This is also appropriate to deal with the known relationship between colony size and SAV. Normality was assessed using Shapiro-Wilks with SAV data requiring a logarithmic transformation. Homogeneity of variance was evaluated using Cochran C tests with no transformations required. Tukey’s Post Hoc analyses were used to assess differences amongst treatment groups as needed. All analyses were conducted in Statistica (V12, TIBCO Software Inc., Palo Alto, USA). Stylophora pistillata was excluded from statistical analyses due to low samples sizes at inshore and mid-shelf locations (Table 1), though results are displayed graphically for comparison.

3. Results

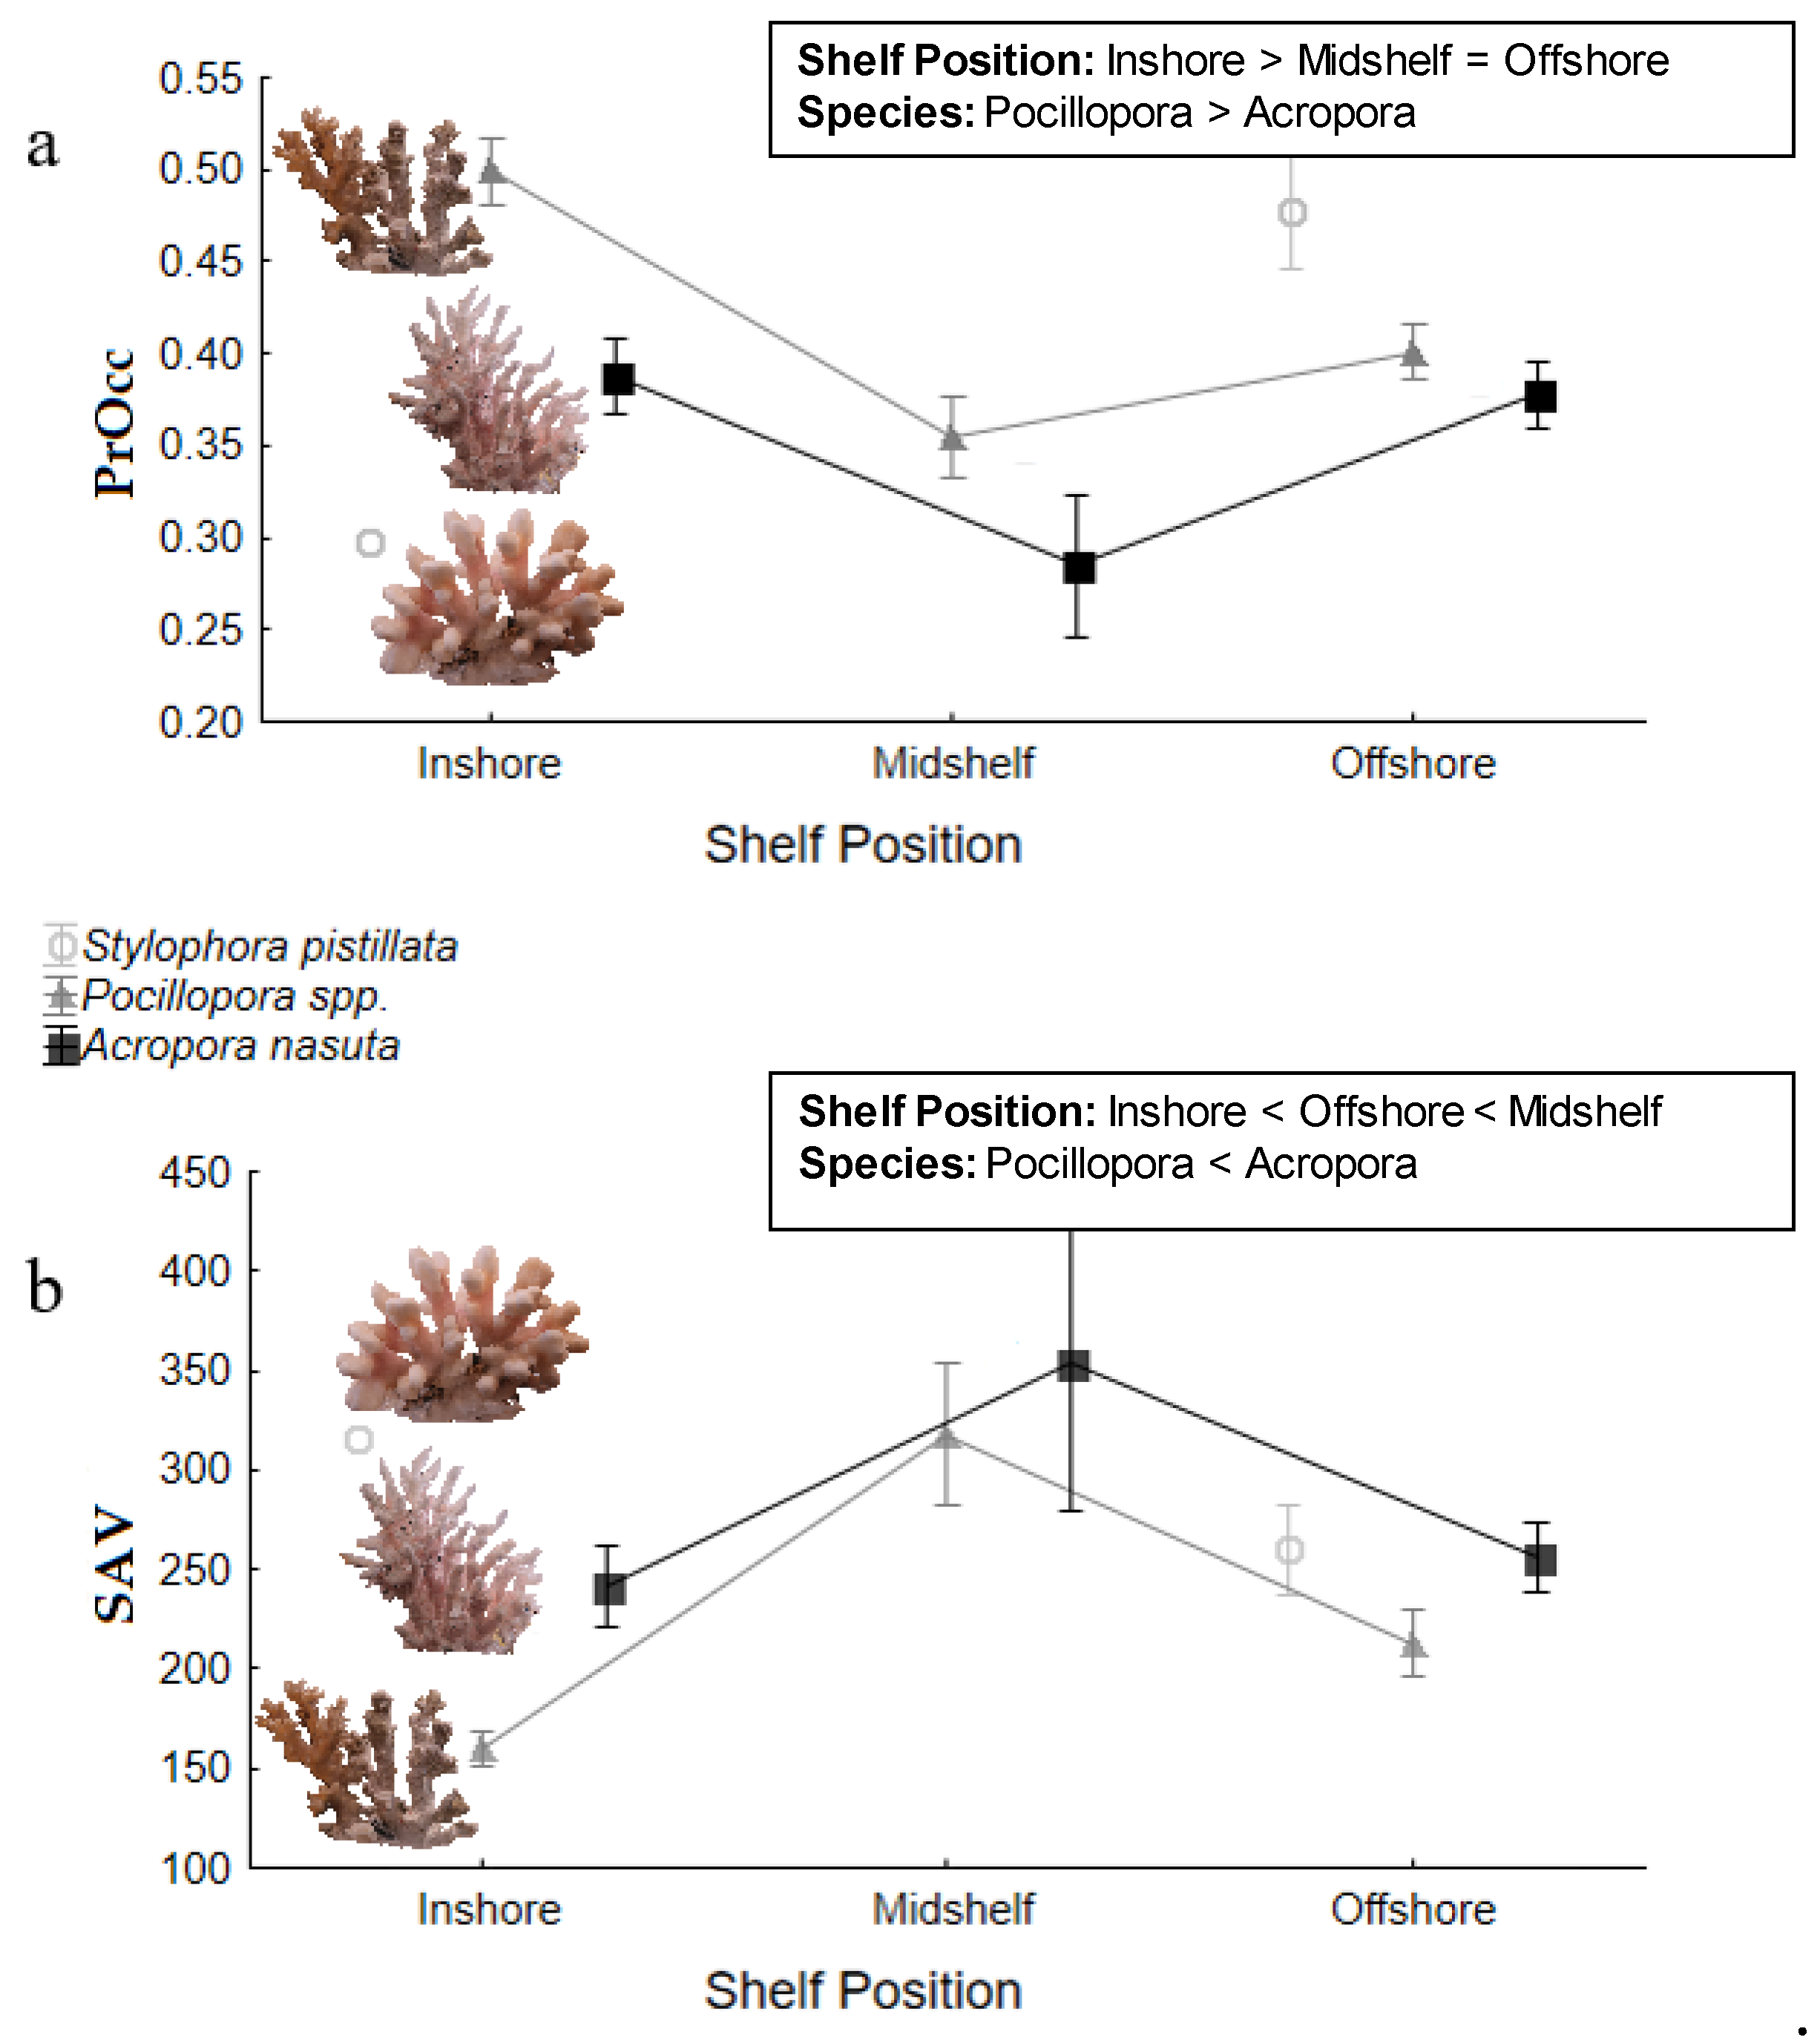
3.1. Proportion Occupied (PrOcc)

The GLM indicated that the proportion of 3D space occupied (PrOcc) was significantly higher in Pocillopora spp. than A. nasuta (significant effect of Species; F1,73 = 10.89, p = 0.001; Figure 2a; Figure 3) and that this was consistent among shelf locations (no Shelf Position*Species interaction; F2,73 = 2.10, p = 0.13). Despite this, the individual colony minimum PrOcc for Pocillopora spp. (Mid-shelf; 16.8%) was lower than that of A. nasuta (Inshore; 18.2%) while the maximum value was higher in Pocillopora spp. (Inshore; 59.8%) compared to A. nasuta (Inshore; 53.6%), indicating a greater overall range of PrOcc values among Pocillopora spp. colonies. Offshore S. pistillata, colonies proved to have the highest PrOcc, and therefore most compact growth forms, of all spices considered here while at inshore sites they had the lowest values observed. There were significant differences in PrOcc amongst Shelf Positions (F2,73 = 12.82, p = 0.014) with post-hoc tests indicating that inshore colonies of both species had higher PrOcc values than either mid-shelf (p < 0.001) or offshore (p = 0.017) colonies. While there was a trend for PrOcc values to be higher in the offshore than midshelf region, this was not statistically significant (p = 0.07; Figure 3). There was no effect of Site[Shelf Position] (F1,73 = 0.80, p = 0.495) or colony size (F1,73 = 0.82, p = 0.369) on PrOcc values.

3.2. Surface Area: Volume Ratio (SAV)

The GLM indicated that the SAV of A. nasuta was significantly higher than that of Pocillopora spp. (F1,73 = 6.08, p = 0.016), a pattern which was consistent across all shelf positions (no Shelf Position*Species interaction; F2,73 = 1.50, p = 0.229; Figure 2b; Figure 3). Nevertheless, Pocillopora spp. proved to have the greatest range in SAV of the species tested, with an inner-shelf colony and mid-shelf colony showing the lowest (111.4) and highest (653.8) SAV respectively (Figure 3). SAV for S. pistillata tended to be most similar to A. nasuta, with a greater SAV than Pocillopora spp. however as no statistical tests were applied, we cannot determine if this difference was significant. There was a significant effect of the Shelf Position on the SAV of colonies (F2,73 = 11.45, p = 0.012). Post-hoc tests indicated that the SAV of inner-shelf colonies (Pocillopora spp.: 159.9; A. nasuta: 240.9) were significantly lower than mid-shelf (p < 0.001; Pocillopora spp.: 318.0; A. nasuta: 353.4) and outer-shelf (p = 0.015; Pocillopora spp.: 213.1; A. nasuta: 256.2) colonies, and that outer-shelf values were significantly lower than the mid-shelf (p < 0.001). Consequently, mid-shelf colonies had the greatest SAV and this pattern was consistent across both species. There was no effect of Site[Shelf Position] (F1,73 = 0.58, p = 0.627) however the co-variate for colony size (Bvol) was significant (F1,73 = 56.35, p < 0.001), a pattern that was expected due to the known relationship between surface area and size.

4. Discussion

High resolution 3D photogrammetric modelling is greatly enhancing the study and understanding of morphological variation in scleractinian corals [34,35]. In this study, 3D photogrammetric modeling, combined with novel metrics of colony attributes, revealed non-linear changes in the structure across a cross-shelf gradient. Notably, the SAV of both these species was highest at mid-shelf locations, (reflecting higher colony complexity) and was much lower at both inner-shelf and outer-shelf reefs (Figure 2b). Similarly, colonies of both Pocillopora spp. and A. nasuta were much more open (or less compact) at mid-shelf reefs, based on higher levels of PrOcc at both inner-shelf and outer-shelf reefs. These non-linear relationships may reflect synergistic outcomes of cross shelf gradients with opposing effects on the structure of coral colonies.
Near shore marine environments are increasingly impacted by anthropogenic modification of coastal and catchment systems, resulting in widespread transformation and degradation of marine habitats [39,40,41]. For inner-shelf reefs, high levels of suspended sediments, nutrients and pollutants have resulted in localized coral loss in some cases [39,42,43], though direct effects of these environmental stressors on coral morphology are largely unknown. In this study, colonies of both Pocillopora spp. and A. nasuta were less complex (lower SAV) with more tightly packed (or possibly thicker) branches (higher PrOcc) at inner-shelf reefs compared to mid-shelf reefs, which may reflect morphological adaptations to higher sedimentation, nutrients and reduced light availability [22,44]. We did not however, explicitly measure the environmental conditions at individual study locations, and the specific drivers of observed differences will need to be investigated experimentally. This trend also does not continue universally across the shelf gradient, with a drop in SAV and increase in PrOcc at offshore sites compared to mid-shelf. It has been suggested, that even for mid-shelf morphs of some branching species (Pocillopora damicornis and Acropora milepora), sediment shedding ability is greater than any natural nearshore sedimentation rate, even when tested in static flow [45]. It is therefore possible that morphology of nearshore colonies examined in this paper are not significantly affected by a need to shed terrestrial sediments; but may be more closely linked with other factors such as nutrient availability, light and active predation [46,47]. Porter et al. [48] hypothesized that interspecies morphs with lower SAV would have a greater propensity for heterotrophic feeding as opposed to more photic-reliant branching (high SAV) morphs. Interspecific variation was found between feeding activity in branching (high SAV) and mound (low SAV) species with high feeding activity in those with low SAV. Similarly, intraspecific plasticity in feeding behavior with depth, and therefore possibly light, was found in some species, including P. damicornis [13,44].
Erect, branching corals are extremely vulnerable to hydrodynamic forces generated by large waves [49,50] which accounts for changes in morphological structure along gradients of mechanical exposure [18]. Most notably, corals are expected to have thicker, stronger branches in high energy environments [18], which may be consistent with observed increases in PrOcc between mid-shelf and outer-shelf reefs for both Pocillopora spp. and A. nasuta. Colonies of these corals also had lower complexity (lower SAV) at outer- versus mid-shelf reefs, however higher complexity was shown (higher SAV) at outer- versus inner-shelf reefs. High PrOcc coupled with low SAV may suggest thicker branches while the same PrOcc and high SAV would more likely suggest smaller tightly packed branches. These results indicate the possibility in this study of thicker branches at inner- compared to outer-shelf reefs, which is contrary to the majority of the literature [18,44,51].
As a sister study to a growth rate experiment [28], collection of corals used in this paper were limited to the methodologies required to measure growth. This resulted in a very small sample of S. pistillata and a reduced number of mid-shelf A. nasuta samples (Table 1). Relatively high variance was observed in SAV for mid-shelf A. nasuta. While SAV for these samples ranged from 237.5–551.4, there were no distinct outliers with samples spread evenly across this range. Despite the relatively high variance, significance was still detected, highlighting the large effect size at this shelf position.
The non-linear variation in the 3D structure of corals along cross-shelf gradients in this study is best explained by considering synergistic effects of different environmental factors, which lead to lower complexity and more tightly packed or thicker branches at inner- versus outer-shelf reefs. It is, however, also possible that these patterns reflect non-linear changes in environmental conditions. Nutrient concentrations, for example may be higher on inner- and outer shelf reefs, compared to mid-shelf reefs, albeit for very different reasons [46]. As discussed in Wolanski et al. [52], complex hydrodynamic forces may be responsible for nutrient upwelling at off shore sites. This would decrease the need for autotrophy allowing for offshore morphs to have similar characteristics to nearshore colonies [46]. Despite this, upwelling has also been shown to limit active predation rates in P. damicornis either as a function of slowed polyp reaction with reduced temperature, or higher nutrition per zooplankton encounter [44]. Observed patterns of morphological variation may also be independent of environmental gradients. It is likely that over such a vast and abstract gradient, multiple cryptic drivers, including non-environmental ones, are interacting to produce the observed patterns. While morphological plasticity in response to local conditions is often regarded as a driver for within-species structural variation [53,54], increased awareness and ability to detect genetic divergence has allowed for cryptic species complexes to be identified [55,56]. Discovery of cryptic species complexes in scleractinian and gorgonian corals including P. damicornis and Eunicea flexuosa hint at potentially less flexible phenotypes coupled with independent evolutionary lineages in some species where plasticity has previously been suggested [55,56]. Indeed, in this study, P. damicornis (heralded as a prime example of morphological plasticity) was labeled Pocillopora spp., as we could not 100% guarantee the species identity of all samples. It is possible therefore that observed variation in morphology is not primarily driven by plastic responses to environmental gradients [14].
Morphological variation among scleractinian corals is a functionally-important component of coral reef trait diversity [57] which accounts for many ecological and macroevolutionary differences among species. However, rigorous measurements and readily quantifiable measures of coral morphology are lacking [5,57]. In this study, we show that 3D photogrammetry provides an extremely practical and tractable method for quantifying coral morphology. Importantly, the surface area to volume ratio, which has been proposed as a highly informative trait for scleractinian corals [57], can be readily calculated from 3D reconstructions of individual colonies and captures both inter- and intra-specific variation in colony morphology. We have shown that photogrammetric methods and novel proxies relating to structure are able to identify intraspecific changes in coral colony morphology. The pattern observed using these high-resolution metrics—increased structural complexity and openness of corals on the mid-shelf as opposed to in- and off-shore areas—is intriguing and suggests an interacting role of nearshore terrestrial run-off and offshore wave energy. Such dynamics may also be important in explaining patterns of other coral species across shelf gradients, as well as the ultimate drivers of trait variation within different groups of benthic organisms.

Author Contributions

Conceptualization, M.S.P., A.S.H. and W.F.F.; Methodology, N.E.D. and W.F.F.; Formal Analysis, N.E.D. and W.F.F.; Resources, M.S.P., A.S.H. and W.F.F.; Writing-Original Draft Preparation, N.E.D., M.J.M., M.S.P. and W.F.F.; Writing-Review & Editing M.S.P., A.S.H. and W.F.F.; Funding Acquisition, A.S.H.

Funding

This research was funded through the Australian Research Council award to the ARC Centre of Excellence for Coral Reef Studies [CE14010002] and an Australian Research Council Discovery Early Career Researcher Award to A.S.H. [DE130100688].

Acknowledgments

The authors acknowledge the staff and crew responsible for the effective operation of the R.V. James Kirby, which was fundamental in conducting this research. Coral photographs were taken by D.J. Pratchett and C.A. Thompson.

Conflicts of Interest

The authors declare no conflict of interest.

References

  1. Hillebrand, H.; Matthiessen, B. Biodiversity in a complex world: Consolidation and progress in functional biodiversity research. Ecol. Lett. 2009, 12, 1405–1419. [Google Scholar] [CrossRef]
  2. Messier, J.; McGill, B.J.; Lechowicz, M.J. How do traits vary across ecological scales? A case for trait-based ecology. Ecol. Lett. 2010, 13, 838–848. [Google Scholar] [CrossRef] [PubMed]
  3. Pratchett, M.S.; Anderson, K.; Hoogenboom, M.O.; Widman, E.; Baird, A.H.; Pandolfi, J.M.; Edmunds, P.J.; Lough, J.M. Spatial, Temporal and Taxonomic Variation in Coral Growth–Implications for the Strucutre and Function of Coral Reef Ecosystems. Oceanogr. Mar. Biol. 2015, 53. [Google Scholar]
  4. McWilliam, M.; Chase, T.J.; Hoogenboom, M.O. Neighbor Diversity Regulates the Productivity of Coral Assemblages. Curr. Biol. 2018, 28, 3634–3639.e3. [Google Scholar] [CrossRef] [PubMed]
  5. Alvarez-Noriega, M.; Baird, A.H.; Dornelas, M.; Madin, J.S.; Cumbo, V.R.; Connolly, S.R. Fecundity and the demographic strategies of coral morphologies. Ecology 2016, 97, 3485–3493. [Google Scholar] [CrossRef] [Green Version]
  6. Madin, J.S.; Hoogenboom, M.O.; Connolly, S.R. Integrating physiological and biomechanical drivers of population growth over environmental gradients on coral reefs. J. Exp. Biol. 2012, 215, 968–976. [Google Scholar] [CrossRef] [PubMed] [Green Version]
  7. Jackson, J.B.; Hughes, T.P. Adaptive strategies of coral-reef invertebrates: Coral-reef environments that are regularly disturbed by storms and by predation often favor the very organisms most susceptible to damage by these processes. Am. Sci. 1985, 73, 265–274. [Google Scholar]
  8. Hixon, M.A.; Beets, J.B. Predation, prey refuges and the strugure of coral reef fish assemblages. Ecol. Monogr. 1993, 63, 77–101. [Google Scholar] [CrossRef]
  9. Dustan, P.; Doherty, O.; Pardede, S. Digital reef rugosity estimates coral reef habitat complexity. PLoS ONE 2013, 8, e57386. [Google Scholar] [CrossRef]
  10. Bellwood, D.R.; Hughes, T.P.; Folke, C.; Nystrom, M. Confronting the coral reef crisis. Nature 2004, 429, 827–833. [Google Scholar] [CrossRef]
  11. McWilliam, M.; Hoogenboom, M.O.; Baird, A.H.; Kuo, C.Y.; Madin, J.S.; Hughes, T.P. Biogeographical disparity in the functional diversity and redundancy of corals. Proc. Natl. Acad. Sci. USA 2018, 115, 3084–3089. [Google Scholar] [CrossRef]
  12. Todd, P.A. Morphological plasticity in scleractinian corals. Biol. Rev. Camb. Philos. Soc. 2008, 83, 315–337. [Google Scholar] [CrossRef]
  13. Foster, A.B. Environmental variation in skeletal morphology within the Caribbean Reef corals Montastrea annularis and Siderastrea siderea. Bull. Mar. Sci. 1980, 30, 687–709. [Google Scholar]
  14. Willis, B.L. Phenotypic plasticity versus phenotypic stability in the reef corals Turbinaria mesenterina and Pavona catus. In Proceedings of the 5th International Coral Reef Congress, Tahiti, French Polynesia, 27 May–1 June 1985; pp. 107–112. [Google Scholar]
  15. Brown, B.E. Adaptations of reef corals to physical environmental stress. Adv. Mar. Biol. 1997, 31, 221–229. [Google Scholar]
  16. Anthony, K.R.N.; Hoogenboom, M.O.; Baird, A.H.; Kuo, C.Y.; Madin, J.S.; Hughes, T.P. Adaptive variation in coral geometry and the optimization of internal colony light climates. Biol. Rev. 2005, 19, 17–26. [Google Scholar] [CrossRef] [Green Version]
  17. Hoogenboom, M.O.; Connolly, S.R.; Anthony, K.R. Interactions between morphological and physiological plasticity optimize energy acquisition in corals. Ecology 2008, 89, 1144–1154. [Google Scholar] [CrossRef]
  18. Lesser, M.P.; Weis, V.M.; Patterson, M.R.; Jokiel, P.L. Effects of morphology and water motion on carbon delivery and productivity in the reef coral, Pocillopora damicornis (Linnaeus): Diffusion barriers, inorganic carbon limitation, and biochemical plasticity. J. Exp. Mar. Biol. Ecol. 1994, 178, 153–179. [Google Scholar] [CrossRef]
  19. Madin, J.S. Mechanical limitations of reef corals during hydrodynamic disturbances. Coral Reefs 2005, 24, 630–635. [Google Scholar] [CrossRef]
  20. Tebbett, S.B.; Goatley, C.H.R.; Bellwood, D.R. Algal turf sediments across the Great Barrier Reef: Putting coastal reefs in perspective. Mar. Pollut. Bull. 2018, 137, 518–525. [Google Scholar] [CrossRef]
  21. Fabricius, K.E.; Logan, M.; Weeks, J.J.; Lewis, S.E.; Brodie, J. Changes in water clarity in response to river discharges on the Great Barrier Reef continental shelf: 2002–2013. Est. Coast. Shelf Sci. 2016, 173, A1–A15. [Google Scholar] [CrossRef] [Green Version]
  22. Storlazzi, C.D.; Norris, B.K.; Rosenberger, K.J. The influence of grain size, grain color, and suspended-sediment concentration on light attenuation: Why fine-grained terrestrial sediment is bad for coral reef ecosystems. Coral Reefs 2015, 34, 967. [Google Scholar] [CrossRef]
  23. Brodie, J.E.; Kroon, F.J.; Schaffelke, B.; Wolanski, E.C.; Lewis, S.E.; Devlin, M.J.; Bohnet, I.C.; Bainbridge, Z.T.; Waterhouse, J.; Davis, A.M. Terrestrial pollutant runoff to the Great Barrier Reef: An update of issues, priorities and management responses. Mar. Pollut. Bull. 2012, 65, 81–100. [Google Scholar] [CrossRef]
  24. Bellwood, D.R.; Wainwright, P. Locomotion in labrid fishes: Implications for habitat use and cross-shelf biogeography on the Great Barrier Reef. Coral Reefs 2001, 20, 139–150. [Google Scholar] [CrossRef]
  25. Noonan, S.H.; Jones, G.P.; Pratchett, M.S. Coral size, health and structural complexity: Effects on the ecology of a coral reef damselfish. Mar. Ecol. Prog. Ser. 2012, 456, 127–137. [Google Scholar] [CrossRef]
  26. Jupiter, S.; Roff, G.; Marion, G.; Henderson, M.; Schramever, V.; McCulloch, M.; Hoegh-Guldberg, O. Linkages between coral assemblages and coral proxies of terrestrial exposure along a cross-shelf gradient on the southern Great Barrier Reef. Coral Reefs 2008, 27, 887–903. [Google Scholar] [CrossRef]
  27. Emslie, M.J.; Pratchett, M.S.; Cheal, A.J.; Osborne, K. Great Barrier Reef butterflyfish community structure: The role of shelf position and benthic community type. Coral Reefs 2010, 29, 705–715. [Google Scholar] [CrossRef]
  28. Burn, D.; Pratchett, M.S.; Heron, S.F.; Thompson, C.A.; Pratchett, D.; Hoey, A.S. Limited Cross-Shelf Variation in the Growth of Three Branching Corals on Australia’s Great Barrier Reef. Diversity 2018, 10, 122. [Google Scholar] [CrossRef]
  29. Hughes, T.P.; Day, J.C.; Brodie, J. Securing the future of the Great Barrier Reef. Nat. Clim. Change 2015, 5, 508–511. [Google Scholar] [CrossRef]
  30. Kroon, F.J.; Thorburn, P.; Schaffelke, B.; Whitten, S. Towards protecting the Great Barrier Reef from land-based pollution. Glob. Chang. Biol. 2016, 22, 1985–2002. [Google Scholar] [CrossRef] [Green Version]
  31. De Clippele, L.H.; Huvenne, V.A.I.; Lundalv, T.; Fox, A.; Hennig, S.J.; Roberts, J.M. The effect of local hydrodynamics on the spatial extent and morphology of cold-water coral habitats at Tisler Reef, Norway. Coral Reefs 2018, 37, 253–266. [Google Scholar] [CrossRef]
  32. Chindapol, N.; Kaandorp, J.A.; Cronemberger, C.; Mass, T.; Genin, A. Modelling growth and form of the scleractinian coral Pocillopora verrucosa and the influence of hydrodynamics. PLoS Comput. Biol. 2013, 9, e1002849. [Google Scholar] [CrossRef]
  33. Erftemeijer, P.A.L.; Riegl, B.; Hoeksema, B.W.; Todd, P.A. Environmental impacts of dredging and other sediment disturbanes on corals: A review. Mar. Pollut. Bull. 2012, 64, 1737–1765. [Google Scholar] [CrossRef]
  34. Figueira, W.; Ferrari, R.; Weatherby, E.; Porter, A.; Hawes, S.; Byrne, M. Accuracy and Precision of Habitat Structural Complexity Metrics Derived from Underwater Photogrammetry. Remote Sensing 2015, 7, 16883–16900. [Google Scholar] [CrossRef] [Green Version]
  35. Ferrari, R.; Figueira, W.F.; Pratchett, M.S.; Boube, T.; Adam, A.; Kobelkowsky-Vidrio, T.; Doo, S.S.; Atwood, T.B.; Byrne, M. 3D photogrammetry quantifies growth and external erosion of individual coral colonies and skeletons. Sci. Rep. 2017, 7, 16737. [Google Scholar] [CrossRef] [Green Version]
  36. Gochfeld. Predation-induced morphological and behavioral defenses in a hard coral: Implications for foraging behavior of coral-feeding butterflyfishes. Mar. Ecol. Prog. Ser. 2004, 267, 145–158. [Google Scholar] [CrossRef]
  37. Roberts, C.M.; Ormond, R.F.G. Habitat complexity and coral reef fish diversity and abundance on Red Sea fringing reefs. Mar. Ecol. Prog. Ser. 1987, 41, 1–8. [Google Scholar] [CrossRef]
  38. Kerry, J.T.; Bellwood, D.R. The effect of coral morphology on shelter selection by coral reef fishes. Coral Reefs 2012, 31, 415–424. [Google Scholar] [CrossRef]
  39. Valadez-Rocha, V.; Ortiz-Lozano, L. Spatial and temporal effects of port facilities expansion on the surface area of shallow coral reefs. Environ. Manag. 2013, 52, 250–260. [Google Scholar] [CrossRef]
  40. Waycott, M.; Duarte, C.M.; Carruthers, T.J.; Orth, R.J.; Dennison, W.C.; Olyarnik, S.; Calladine, A.; Fourqurean, J.W.; Heck, K.L., Jr.; Hughes, A.R.; et al. Accelerating loss of seagrasses across the globe threatens coastal ecosystems. Proc. Natl. Acad. Sci. USA 2009, 106, 12377–12381. [Google Scholar] [CrossRef] [Green Version]
  41. Airoldi, L. The effects of sedimentation on rocky coast assemblages. Oceanogr Mar Biol Ann Rev 2003, 41. [Google Scholar]
  42. Pratchett, M.S.; Bay, L.K.; Gehrke, P.C.; Koehn, J.D.; Osborne, K.; Pressey, R.L.; Sweatman, H.P.A.; Wachenfeld, D. Contribution of climate change to degradation and loss of critical fish habitats in Australian marine and freshwater environments. Mar. Freshw. Res. 2011, 62, 1062–1081. [Google Scholar] [CrossRef]
  43. Osborne, K.; Dolman, A.M.; Burgess, S.C.; Johns, K.A. Disturbance and the Dynamics of Coral Cover on the Great Barrier Reef (1995–2009). PLoS ONE 2011, 6, e17516. [Google Scholar] [CrossRef]
  44. Palardy, J.E.; Grottoli, A.G.; Matthews, K.A. Effects of upwelling, depth, morphology and polyp size on feeding in three species of Panamanian corals. Mar. Ecol. Prog. Ser. 2005, 300, 79–89. [Google Scholar] [CrossRef] [Green Version]
  45. Duckworth, A.; Giofre, N.; Jones, R. Coral morphology and sedimentation. Mar. Pollut. Bull. 2017, 125, 289–300. [Google Scholar] [CrossRef]
  46. Anthony, K.R.; Fabricius, K.E. Shifting roles of heterotrophy and autotrophy in coral energetics under varying turbidity. J. Exp. Mar. Bio. Ecol. 2000, 252, 221–253. [Google Scholar] [CrossRef]
  47. Amaral, F.D. Morphological variation in the reef coral Montastrea cavernosa in Brazil. Coral Reefs 1994, 13, 113–117. [Google Scholar] [CrossRef]
  48. Porter, J.W. Autotrophy, heterotrophy and resource partitioning in Caribbean reef-building corals. Am. Nat. 1976. [Google Scholar] [CrossRef]
  49. Madin, J.S.; Connolly, S.R. Ecological consequences of major hydrodynamic disturbances on coral reefs. Nature 2006, 444, 477–480. [Google Scholar] [CrossRef]
  50. Baldock, T.E.; Karampour, H.; Sleep, R.; Vyltla, A.; Albermani, F.; Golshani, A.; Callaghan, D.P.; Roff, G.; Mumby, P.J. Resilience of branching and massive corals to wave loading under sea level rise—A coupled computational fluid dynamics-structural analysis. Mar. Pollut. Bull. 2014, 86, 91–101. [Google Scholar] [CrossRef]
  51. Brazeau, D.A.; Lasker, H.R. Inter- and intraspecific variation in gorgonian colony morphology: Quantifying branching patterns in arborescent animals. Coral Reefs 1988, 7, 139–143. [Google Scholar] [CrossRef]
  52. Wolanski, E.C.; Drew, E.; Abel, K.M.; O’Brien, J. Tidal jets, nutrient upwelling and their influence on the productivity of the alga Halimeda in the Ribbon Reefs, Great Barrier Reef. Estuar. Coast Shelf Sci. 1988, 26, 169–2001. [Google Scholar] [CrossRef]
  53. Bay, L.K.; Ulstrup, K.E.; Nielsen, H.B.; Jarmer, H.; Goffard, N.; Willis, B.L.; Miller, D.J.; Van Oppen, M.J. Microarray analysis reveals transcriptional plasticity in the reef building coral Acropora millepora. Mol. Ecol. 2009, 18, 3062–3075. [Google Scholar] [CrossRef]
  54. Marti-Puig, P.; Forsman, Z.H.; Haverkort-Yeh, R.D.; Knapp, I.S.S.; Maragos, J.E.; Toonen, R.J. Extreme phenotypic polymorphism in the coral genus Pocillopora; micro-morphology corresponds to mitochondrial groups, while colony morphology does not. Bull of Mar. Sci. 2014, 90, 211–231. [Google Scholar] [CrossRef]
  55. Schmidt-Roach, S.; Miller, K.J.; Andreakis, N. Pocillopora aliciae: A new species of scleractinian coral (Scleractinia, Pocilloporidae) from subtropical Eastern Australia. Zootaxa 2013, 3626, 576–582. [Google Scholar] [CrossRef]
  56. Prada, C.; Schizas, N.V.; Yoshioka, P.M. Phenotypic plasticity or speciation? A case from a clonal marine organism. BMC Evol. Biol. 2008, 8, 47. [Google Scholar] [CrossRef]
  57. Madin, J.S.; Hoogenboom, M.O.; Connolly, S.R.; Darling, E. A trait-based approach to advance coral reef science. Trends Ecol. Evol. 2016, 31, 419–428. [Google Scholar] [CrossRef]
Figure 1. 2D views of representative colonies of (a) Pocillopora spp. (b) S. pistillata and (c) A. nasuta, each encased by minimum bounding convex hull. Note that metrics were derived in 3D.
Diversity 11 00044 g001
Figure 2. Mean (±SE) values for each metric of structural complexity derived from 3D models of colonies of each species evaluated in this study; (a) proportion of minimum convex hull occupied (PrOcc) and (b) surface area to volume ratio (SAV). Results for Shelf Position and Species groups are shown; there was no interaction between these two factors. Factor-level comparisons based on post-hoc tests are given in the inset boxes for reference. Data for Stylophora is also included for reference but was not tested statistically due to low sample sizes.
Diversity 11 00044 g002
Figure 3. Representative examples of variation in colonies of A. nasuta (a) and Pocillopora spp. (b) along the cross shelf gradient.
Diversity 11 00044 g003
Table 1. Summary of coral colonies of each species sampled from each location in this study.
SpeciesInner-ShelfMid-ShelfOuter-Shelf
Acropora nasuta16412
Pocillopora spp181716
Stylophora pistillata1010
Table 2. Summary of parameters (from Agisoft Photoscan Professional, V1.4.1, St. Petersburg, Russia) used to construct 3D models of corals in this study.
ProcessSettings
Photo alignmentHigh accuracy, pair and reference preselection disabled, key point limit 40,000, tie point limit 4000, features not constrained by mask, no adaptive camera model fitting
Sparse point cloudAll optimisation properties ‘yes’ except fit b1, b2, k4, p3, p4, adaptive camera model fitting
Dense point cloudHigh quality *, moderate depth filtering, do not reuse depth maps, calculate point colors
MeshArbitrary surface type, source data-dense cloud, face count high, interpolation enabled, all point classes, don’t reuse depth maps
TextureGeneric mapping mode, texture from all cameras, mosaic blending mode, texture size 8192, texture count 1, hole filling
* Ultra high dense cloud was used in a few cases where Photoscan assigned a disproportionate number of points to the periphery of the model such that a model of equivalent resolution was obtained.

