Article

Crypsis Decreases with Elevation in a Lizard

by
Gregorio Moreno-Rueda
*,
Laureano G. González-Granda
,
Senda Reguera
,
Francisco J. Zamora-Camacho
and
Elena Melero
Departamento de Zoología, Facultad de Ciencias, Universidad de Granada, E-18071 Granada, Spain
*
Author to whom correspondence should be addressed.
Diversity 2019, 11(12), 236; https://doi.org/10.3390/d11120236
Submission received: 7 November 2019 / Revised: 22 November 2019 / Accepted: 5 December 2019 / Published: 7 December 2019
(This article belongs to the Special Issue Predators as Agents of Selection and Diversification)

Abstract

:
Predation usually selects for visual crypsis, the colour matching between an animal and its background. Geographic co-variation between animal and background colourations is well known, but how crypsis varies along elevational gradients remains unknown. We predict that dorsal colouration in the lizard Psammodromus algirus should covary with the colour of bare soil—where this lizard is mainly found—along a 2200 m elevational gradient in Sierra Nevada (SE Spain). Moreover, we predict that crypsis should decrease with elevation for two reasons: (1) Predation pressure typically decreases with elevation, and (2) at high elevation, dorsal colouration is under conflicting selection for both crypsis and thermoregulation. By means of standardised photographies of the substratum and colourimetric measurements of lizard dorsal skin, we tested the colour matching between lizard dorsum and background. We found that, along the gradient, lizard dorsal colouration covaried with the colouration of bare soil, but not with other background elements where the lizard is rarely detected. Moreover, supporting our prediction, the degree of crypsis against bare soil decreased with elevation. Hence, our findings suggest local adaptation for crypsis in this lizard along an elevational gradient, but this local adaptation would be hindered at high elevations.

1. Introduction

Predation is the major cause of animal mortality in the wild [1], thereby being one of the main selective pressures in nature. Given that predation reduces residual fitness of prey to zero, potential prey are selected for a number of anti-predation adaptations [2,3,4,5]. The primary way to avoid predation is to elude detection by predators; hence, predation frequently selects for prey camouflage [2,6,7]. Camouflage includes a number of different strategies [8], the simplest one being background colour matching, in which potential prey display a colouration resembling that of the background where they are most exposed to potential predators [9]. Therefore, the smaller the colour difference between animal and background—from the predator’s viewpoint—the greater the degree of crypsis [10].
Visual crypsis by colour matching has long received considerable attention [7]. Experimental evidence supports that predators prey more frequently on conspicuous prey rather than on cryptic prey, favouring those whose colours better match the background [11,12,13,14,15,16,17,18,19]. Moreover, some field studies evidence that prey survival improves with visual crypsis [20,21,22]. Consequently, given that substrate colouration varies geographically, natural selection is expected to cast parallel variations in the colouration of prey species. Indeed, geographic covariation between background and animal colouration has long been reported [23,24,25,26,27,28,29,30,31]. These parallel gradients in background and animal colourations can illustrate how species are adapted to varying conditions (local adaptation), typically being considered as an evidence of natural selection for crypsis [32]. Some studies, even, show that a geographic variation in colouration is associated to genetic differentiation, strongly supporting diversifying selection [33,34].
Despite the abundant literature about geographic covariation between background and animal colouration, little is known about how crypsis varies along elevational gradients. Elevational gradients commonly display huge variation in environmental conditions—and thus in selective pressures—in relatively short distances [35], which facilitates the study of local adaptation [36]. Therefore, if background colouration varies with altitude, one should expect a concomitant variation in animal cryptic colouration. In addition, elevational gradients may show particular patterns of crypsis variation. Specifically, we hypothesised that crypsis should decrease with elevation for two reasons. Firstly, crypsis is expectably lower under reduced predation pressure [32]. Supporting this idea, sexual ornaments are more conspicuous where predation pressure is lower [37]. Given that predation pressure typically decreases with elevation [38], we predict that crypsis should decline with elevation, tracing the reduction in predation pressure. Secondly, animal colouration may be affected by selective pressures in addition to predation [39]. Concretely, colouration can become darker in high mountains in order to improve warming by heliothermy [40] or protection against UV radiation [41]. In such a case, selection for darker colouration might conflict with selection for crypsis, resulting in reduced crypsis.
Reptile dorsum surface usually shows dull and cryptic colourations, probably as a result of selection for crypsis by predation [23], whereas the ventral and lateral body parts usually show colourful patches, typically involved in social communication [42]. Cryptic dorsal colouration is strongly selected for in reptiles as a consequence of their need for long basking periods due to their ectothermic nature, which increases their exposure to predators [43]. For example, in the lizard Sceloporus woodi, dorsal colouration is less bright in zones where predation risk is higher, strongly suggesting that predators select for cryptic lizards [44].
In a previous study on dorsal colouration of the lizard Psammodromus algirus [45], we reported that hue, a component of colouration, was correlated with substrate hue along an elevational gradient, suggesting that dorsal colouration varied along the ecological gradient in order to favour crypsis at a local scale. Nonetheless, this was only suggested by a single correlation. Here, we formally test the hypothesis that dorsal colour in this lizard varies along the elevational gradient becoming locally cryptic. Psammodromus algirus basks mainly on bare soil, and is rarely found on rocks or on vegetation [46]. The optimal crypsis should resemble the background at the time and location in which predation risk is highest [32]. Hence, if dorsal colour in this lizard has evolved as a consequence of selection by visual predators, we predict (i) that dorsal colour will be more similar to bare soil colour than to the colour of rocky substrate or grass, and (ii) that along the elevational gradient, dorsal colour of the lizard will covary mainly with bare soil colour, covariation with rocky substrate and grass colour being smaller or absent. Moreover, we predict (iii) that the degree of crypsis should decrease with elevation, as a consequence of reduced predation pressure (see above), and because the lizard P. algirus shows darker colouration with increased elevation, presumably to improve thermoregulation and/or protection against UV radiation [45], which may conflict with crypsis at high elevations.

2. Materials and Methods
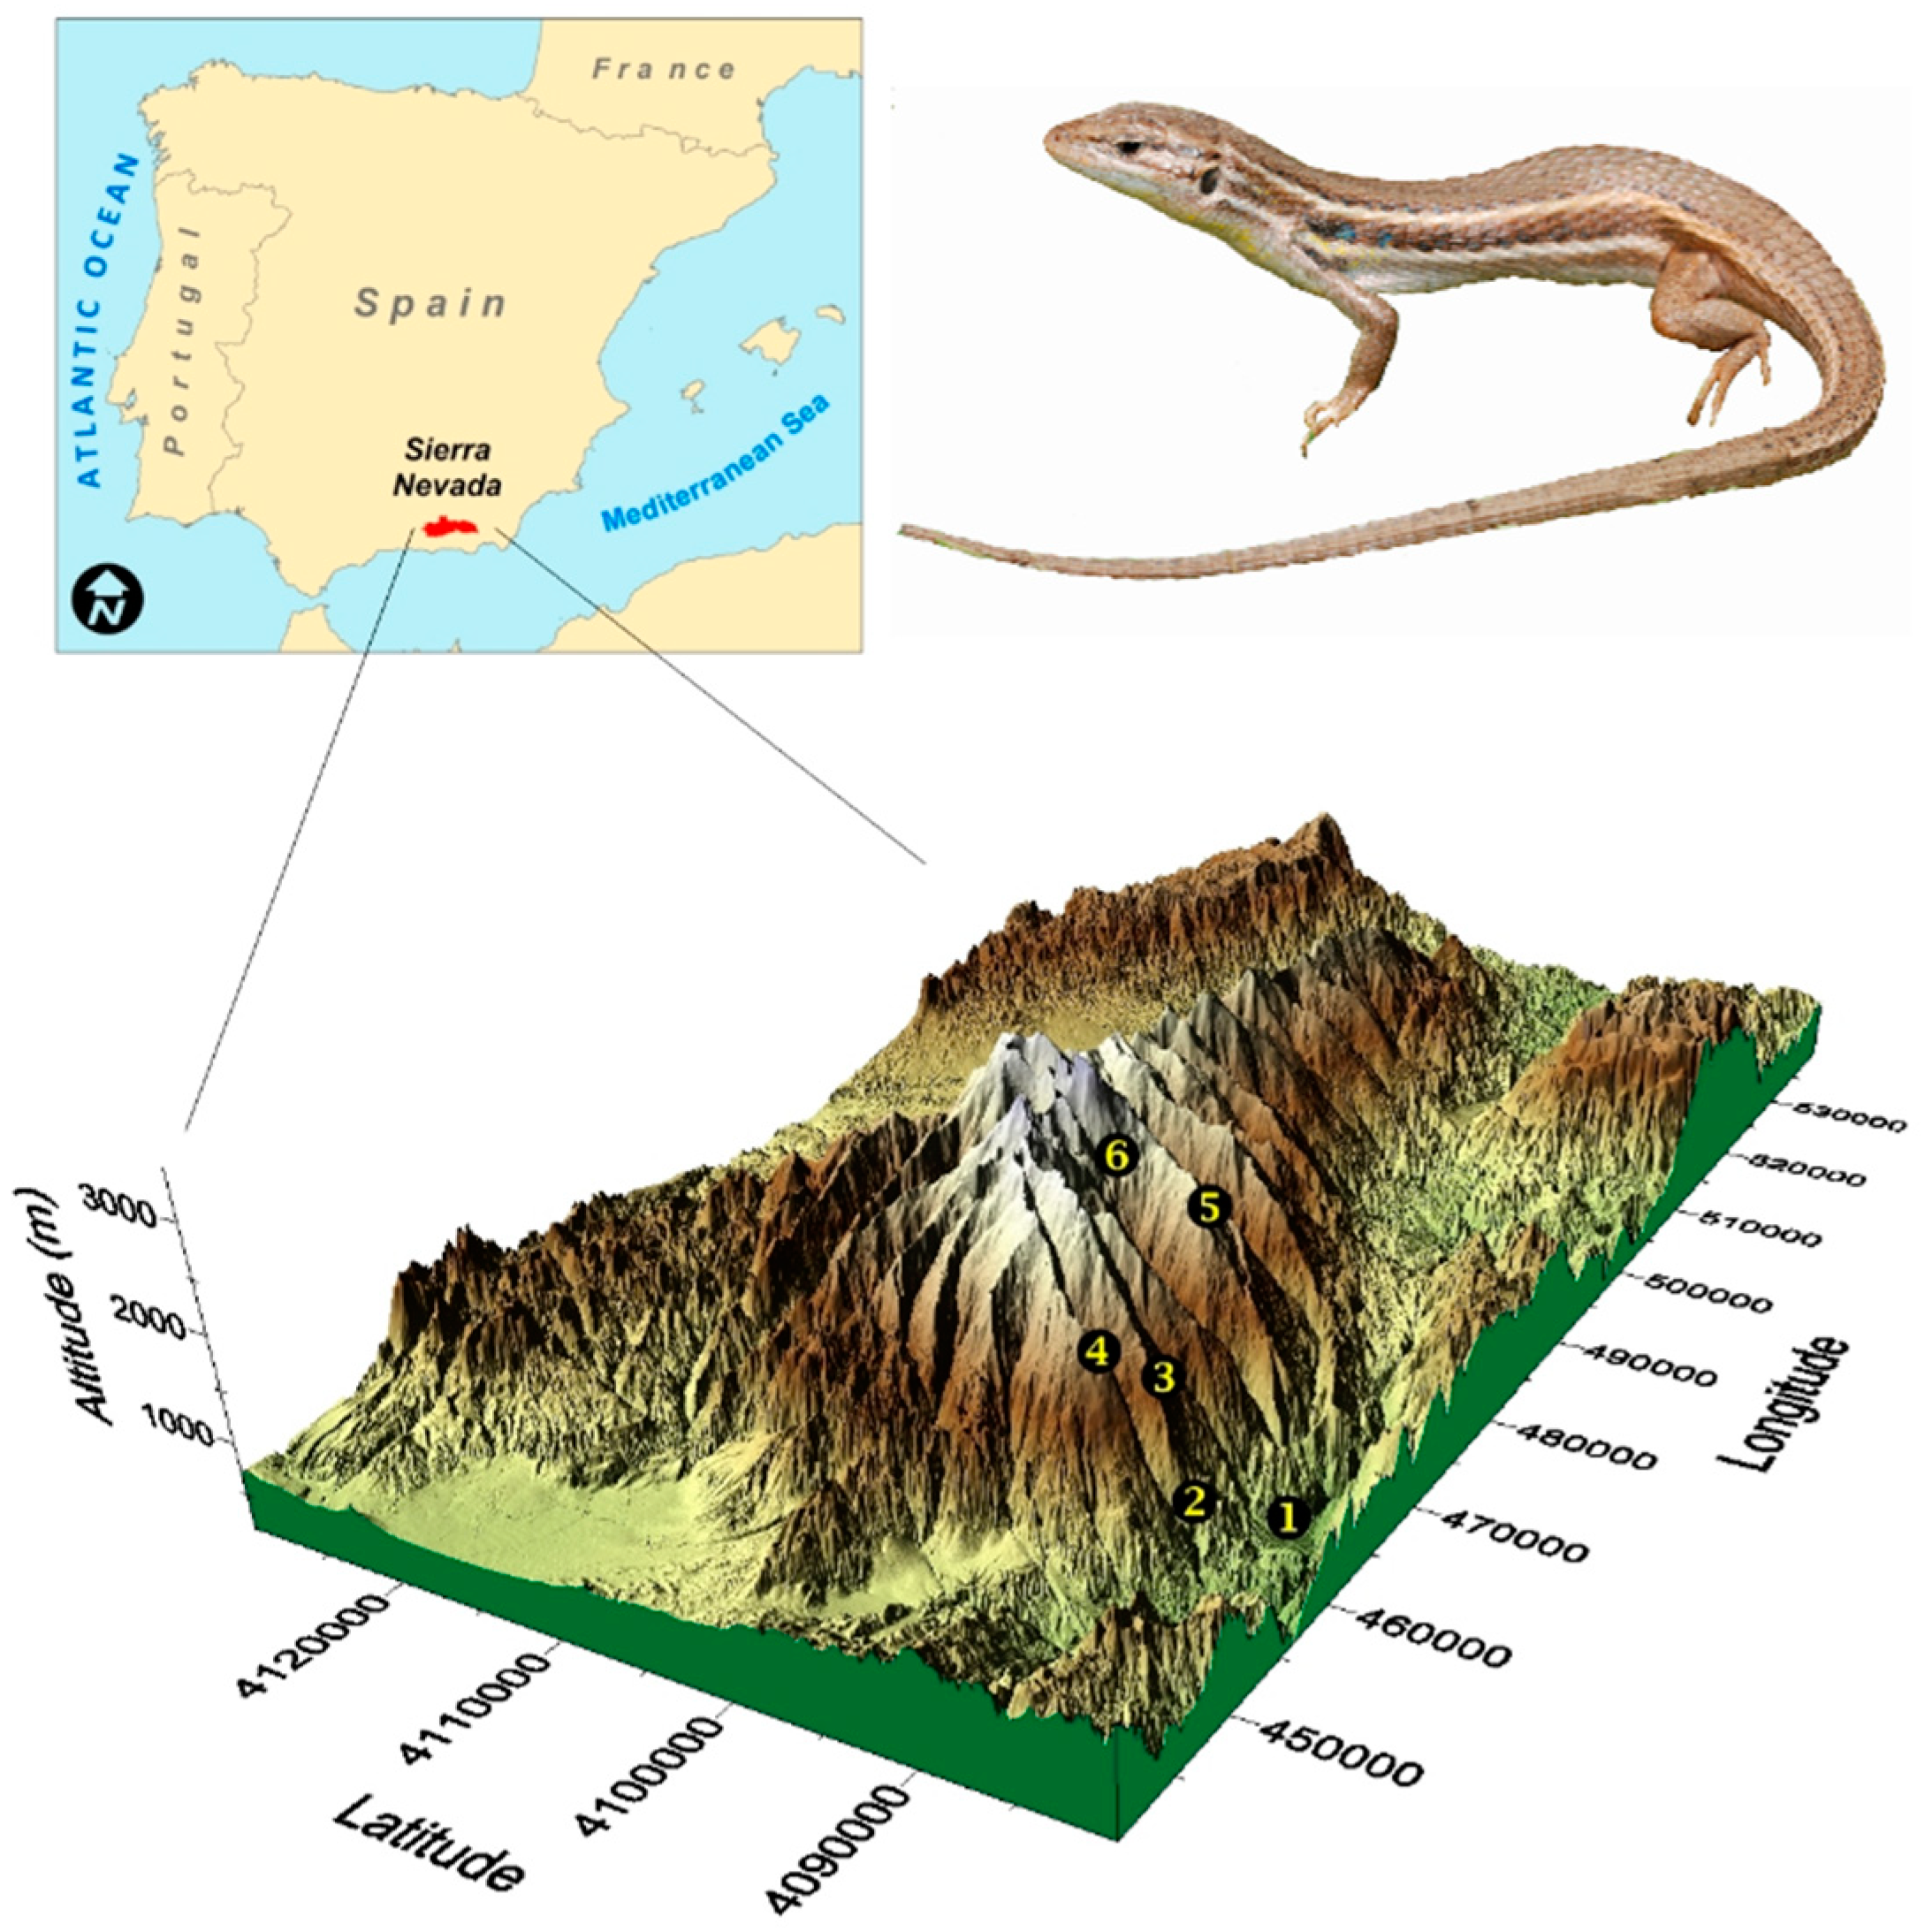
2.1. Study Species

Psammodromus algirus is a common medium-size (53–95 mm of length from the snout to the vent, SVL) lacertid occupying shrubby Mediterranean habitats [47]. Its distribution extends from south-eastern France to Morocco, including most of the Iberian Peninsula, along with a wide elevational range (0–2800 m above sea level, m asl; [46]). This lizard is an opportunistic active forager of arthropods [48]. Its body temperature depends on the environmental temperature and solar radiation, frequently using heliothermy (basking) for warming [49]. Consequently, P. algirus is usually exposed to predators while foraging and basking, particularly during the breeding season, when guarding a territory, searching for mates or oviposition sites [50].
The main predators of P. algirus are snakes, mammals, and birds [46]. Snakes and mammals are mainly odour-guided predators, although vision and, mainly in the case of mammals, hearing, also contribute to prey-predator encounters. Meanwhile, birds spot lizards mainly by visual detection from above, and so are supposed to be the primary selective agents for visual crypsis. During our study in Sierra Nevada, we detected several diurnal bird species described as predators of adult P. algirus: Short-toed eagle (Circaetus gallicus), common kestrel (Falco tinnuculus), and southern shrike (Lanius meridionalis) [46,51], as well as woodchat shrike (L. senator), and several corvids (family Corvidae), which potentially might prey on the lizard.
Psammodromus algirus displays a number of antipredator strategies. When predation risk is high, it reduces activity, moves more slowly, and increases vigilance time [52,53,54]. When basking, this lizard stays at ground level near shrubs used as shelters [55]. If a predator is detected while basking or foraging, it remains immobile and, once the predator is close, flees to a nearby shelter [56,57]. These antipredator behaviours are compatible with crypsis. Indeed, dorsal colouration in this lizard goes from pale to dark brown, sometimes with a variable number of dorsal and lateral stripes that intervene in disruptive crypsis in open habitats [58]. In our study area, all lizards were striped along the elevational gradient (unpublished data; also see [58]).

2.2. Study Area

The study area was located in Sierra Nevada (SE Spain, 2°56′1″2–3°38′02″2 W and 36°56′10″0–37°12′58″9 N). Six sampling plots were established along the elevational gradient, separated by approximately 500 m of elevation: 300, 700, 1200, 1700, 2200, and 2500 m asl (Figure 1). Sampling was always conducted within the typical habitat of P. algirus: Areas with abundant herbs and shrubs ranging from 40 to 100 cm high and relatively high vegetation cover [47]. Care was taken in selecting locations with similar habitat structure, despite the obvious variation in plant communities along the elevational gradient [59].

2.3. Sampling

A total of 403 adult lizards were captured from 2011 to 2013 (samples sizes in Appendix A). Sampling was concentrated from March to August (both included), the activity period of P. algirus in the study area [59]. Individuals were captured by hand, put in cotton bags, and transported to the laboratory, where they were immediately processed. Adults were recognised according to a minimum SVL (measured with a ruler) for each sex and elevation. Minimum adult SVL at each elevation corresponded to that of the smallest male with an orange commissure (an indicator of sexual maturity; [60]), or that of the smallest gravid female, depending on sex (Appendix B). Lizards were released at the capture site after processing, without having been injured.

2.4. Colour Measurement

The dorsal colour of lizards was measured with a spectrophotometer (Minolta CM-2600d). Measurements were consistently taken from the centre of the dorsum, that is, just in a dorsal point equally distant from the insertion of the hindlimbs and the forelimbs, always avoiding the yellowish and dark stripes. Once placed over the lizard skin, the spectrophotometer shoots three beams of light through an opening, 3 mm in diameter and registers the reflected light for each beam. Then, it automatically processes the three measurements and returns the average value of each colour component (L*a*b*). White and dark standards were calibrated before each measurement.
The L*a*b* colour space of the Commission Internationale d’Éclairage (CIE) objectively describes all visible colours for most diurnal terrestrial vertebrates [61]. L*a*b* colour space is three-dimensional, and each colour is defined by three chromatic variables or coordinates: L*, a*, and b*. Lightness is the percentage of light reflected by a surface. It is represented by coordinate L* and it goes from black (L* = 0, no light reflectance) to white (L* = 100, total light reflectance). Coordinates a* and b* are obtained from the proportion of reflected light in each of four equal divisions of the visible spectrum (from 400 to 675 nm). These divisions correspond to the short (blue; −b), medium-short (green; −a), medium-long (yellow; +b), and long (red; +a) wave lengths of the visible spectrum (Appendix C). The proportion of light reflected by each division is determined and then translated into a position in the green-red coordinate (a*) and the blue-yellow coordinate (b*) [62].
Two other chromatic variables were calculated from L*a*b* data. First, chroma (or saturation), which is the proportion of reflected light in a specific range of the spectrum in relation to the total of reflected light from the whole spectrum. Calculated as C* = [(a*)2 + (b*)2] 1/2, it can be represented, in the three-dimensional spherical colour space, as the distance from the centre of the spherical colour space to its surface. Second, hue, which is the technical term for colour in the vernacular sense (wavelength of peak reflectance). It is computed as H* = arctan(b*, a*) and can be represented in the spherical three-dimensional colour space as the angle in the equatorial plane of the sphere: 0° for red, 90° for yellow, 180° for green, and 270° for blue. Herein, we used the L*C*H* rather than the L*a*b* colour space, as it offers the advantage of expressing pure colour in a single value (H*), allowing a more intuitive and comprehensive interpretation [10].
To measure the colour of lizards’ environment, during 2013, we took 136 photos of spots where natural behaviour of lizards had been observed (basking or travelling) between 10 and 16 h (local time) during the peak of activity season (May, June and July), throughout the six locations (24 photos per elevation, except at 700 m, where only 16 photos were available). Photos (at maximal resolution, 10 megapixels, in raw files) were taken with a Canon 1000D digital-reflex camera with an 18–55 mm lens, and a fixed focal length of 24 mm. Shutter-aperture was also fixed at F22 to ensure that the image was focused within a wide range of depths, providing a clear image despite the irregularities of the environment. A tripod was used to ensure that the photographs were consistently taken perpendicular to the captured surface and at a constant distance of 60 cm. The camera’s white balance was calibrated by photographing a white standard surface (X-Rite ColorChecker Passport Photo) at the sampling site prior to each sampling session. Additionally, given that photos were taken with natural lighting conditions, a standard colour chart (X-Rite ColorChecker Passport Photo) was placed on the ground so that it would appear in each photo, allowing subsequent standardisation of all colour measurements [63]. Given that photos were orthogonal to the spot where basking lizards were found, we considered them to be representative of the background where aerial predators usually spot lizards.
Four different categories of background environmental elements (on which lizards may potentially be spotted) were established and sampled independently: Bare soil, rock, fresh grass, and dry grass. Regarding plants, we only considered herbaceous species on which the lizards may crawl (i.e., shrubs were not considered). In each photo, the colour of each category was measured when present. Not all categories were present in all the photographs, and for this reason, sample sizes differed among environmental elements in the analyses. Additionally, we estimated the relative use the lizard made of each background environmental element at each location. For this purpose, we noted the dominant environmental element in each photo taken, and calculated the proportion of photos in which each background environmental element was dominant, in every location along the elevational gradient.
Adobe Photoshop CS5 software was used to process photographs. First, the white balance of each picture was standardised. This was done by sampling the grey scale of the colour chart present in each photo using the white balance calibration tool (curve layer). Then, the colour of each element of the environment present in each picture was measured. Colour was measured by using the eyedropper point sample tool and by calculating the mean of 20 randomly established points. The 20-measurement threshold was established because we detected no significant variation in the mean value of the measured element when a higher number of points were sampled. The point was set to 5×5 pixels, consequently, each of the 20 measurements corresponded to the mean colour of 25 pixels. The eyedropper point tool was set to measure the colour in the L*a*b* CIE colour space so data were directly comparable to lizard-colour measurements.
Finally, the degree of crypsis was estimated as the difference between lizards’ dorsal colour and the background colour of each element of the environment. Colour difference was calculated as ΔE* = (ΔL*2 + Δa*2 + Δb*2)1/2 [10], where ΔL*, Δa*, and Δb* correspond to the difference between each lizard’s dorsal colour and the mean value for the background colour of each element of the environment at the elevation where the lizard was captured. The smaller the difference in colour (ΔE*), the higher the degree of crypsis. This method is the best option to estimate the degree of crypsis when accurate information on the visual system of predators is not available [10]. Given that lizard dorsum and environmental background colourations were measured with different techniques, we tested for the measurements to be comparable. For this, we measured eight colour patches in the colour chart, both with the colourimeter and with Adobe Photoshop CS5 in the photographs. The measurements were correlated well: Lightness, r = 0.954; a*, r = 0.985; b*, r = 0.946 (in all cases, p < 0.001), strongly suggesting that the methods are comparable.
It should be noted that the degree of crypsis is affected by the visual system of the predator [10,32,64]. In our study, however, the use of visual models was precluded, given that the visual predators of this lizard constitute a diverse set of species whose relative importance along the elevation gradient is unknown. Different predators may diverge not only in abundance and impact on lizards, but also in its perceptual physiology, thereby, predicting their impact on the evolution of prey crypsis is not straightforward [65]. Our estimation of colour omits UV reflectance, but we assumed its effect to be negligible, because the UV reflectance of bare soil, rocks, and plants is usually very low [66,67] and the dorsum of this lizard species presents low reflectance in the UV spectrum (Appendix C). Moreover, colouration measured by human-based techniques, although not optimal, provides results similar to those based on avian visual models [68], and human vision reliably mirrors detection by visual predators [69]. In fact, even models based on avian vision (estimated as a function of cones distribution) may give biased visual models, as they do not consider vision physiology and neurobiology [64].

2.5. Statistical Analyses

We checked whether the bare soil was the most frequently used substrate by the lizard, by comparing its frequency with that of the second most used at each elevation with the Fisher exact test. We used linear models (LM) in order to test the effect of elevation (six sampling points) and the month (May, June or July) when photos were taken on the colour of the four background elements of the environment (bare soil, rocks, fresh grass, and dry grass) on which lizards may be found. Each chromatic component of the colour (L*C*H*) was included in the models as a dependent variable.
Also, LMs were run to examine the effects of elevation, month (six months, from March to August included), year (2011, 2012, and 2013), and sex on lizards’ dorsal colour, including the three chromatic components (L*C*H*) of lizards’ dorsum as dependent variables. We also examined the relationships between the colour of lizards’ dorsum and the colour of the background elements. Due to a low rate of success in capturing lizards after being spotted, we were not able to compile paired data of each lizard colour and the environmental elements surrounding it. Thus, we calculated the mean of each variable (lizards’ dorsal surface and chromatic components of the background elements) for each elevation, and examined the relationship between them along the elevational gradient by means of Spearman’s correlations considering location (n = 6) as the statistical unit.
We tested for the effect of elevation on crypsis (colour difference for each background environmental element) with LMs, with colour difference as a dependent variable and elevation as a factor. We also included year, month, and sex as factors in order to control for possible effects of the date of measurement, as well as sexual dimorphism over the degree of crypsis.
All parametric analyses were checked for dependence, normality, and residual homogeneity [70]. The correction of Bonferroni was applied when multiple tests were performed. Analyses were performed using R version 3.2.2 [71].

3. Results

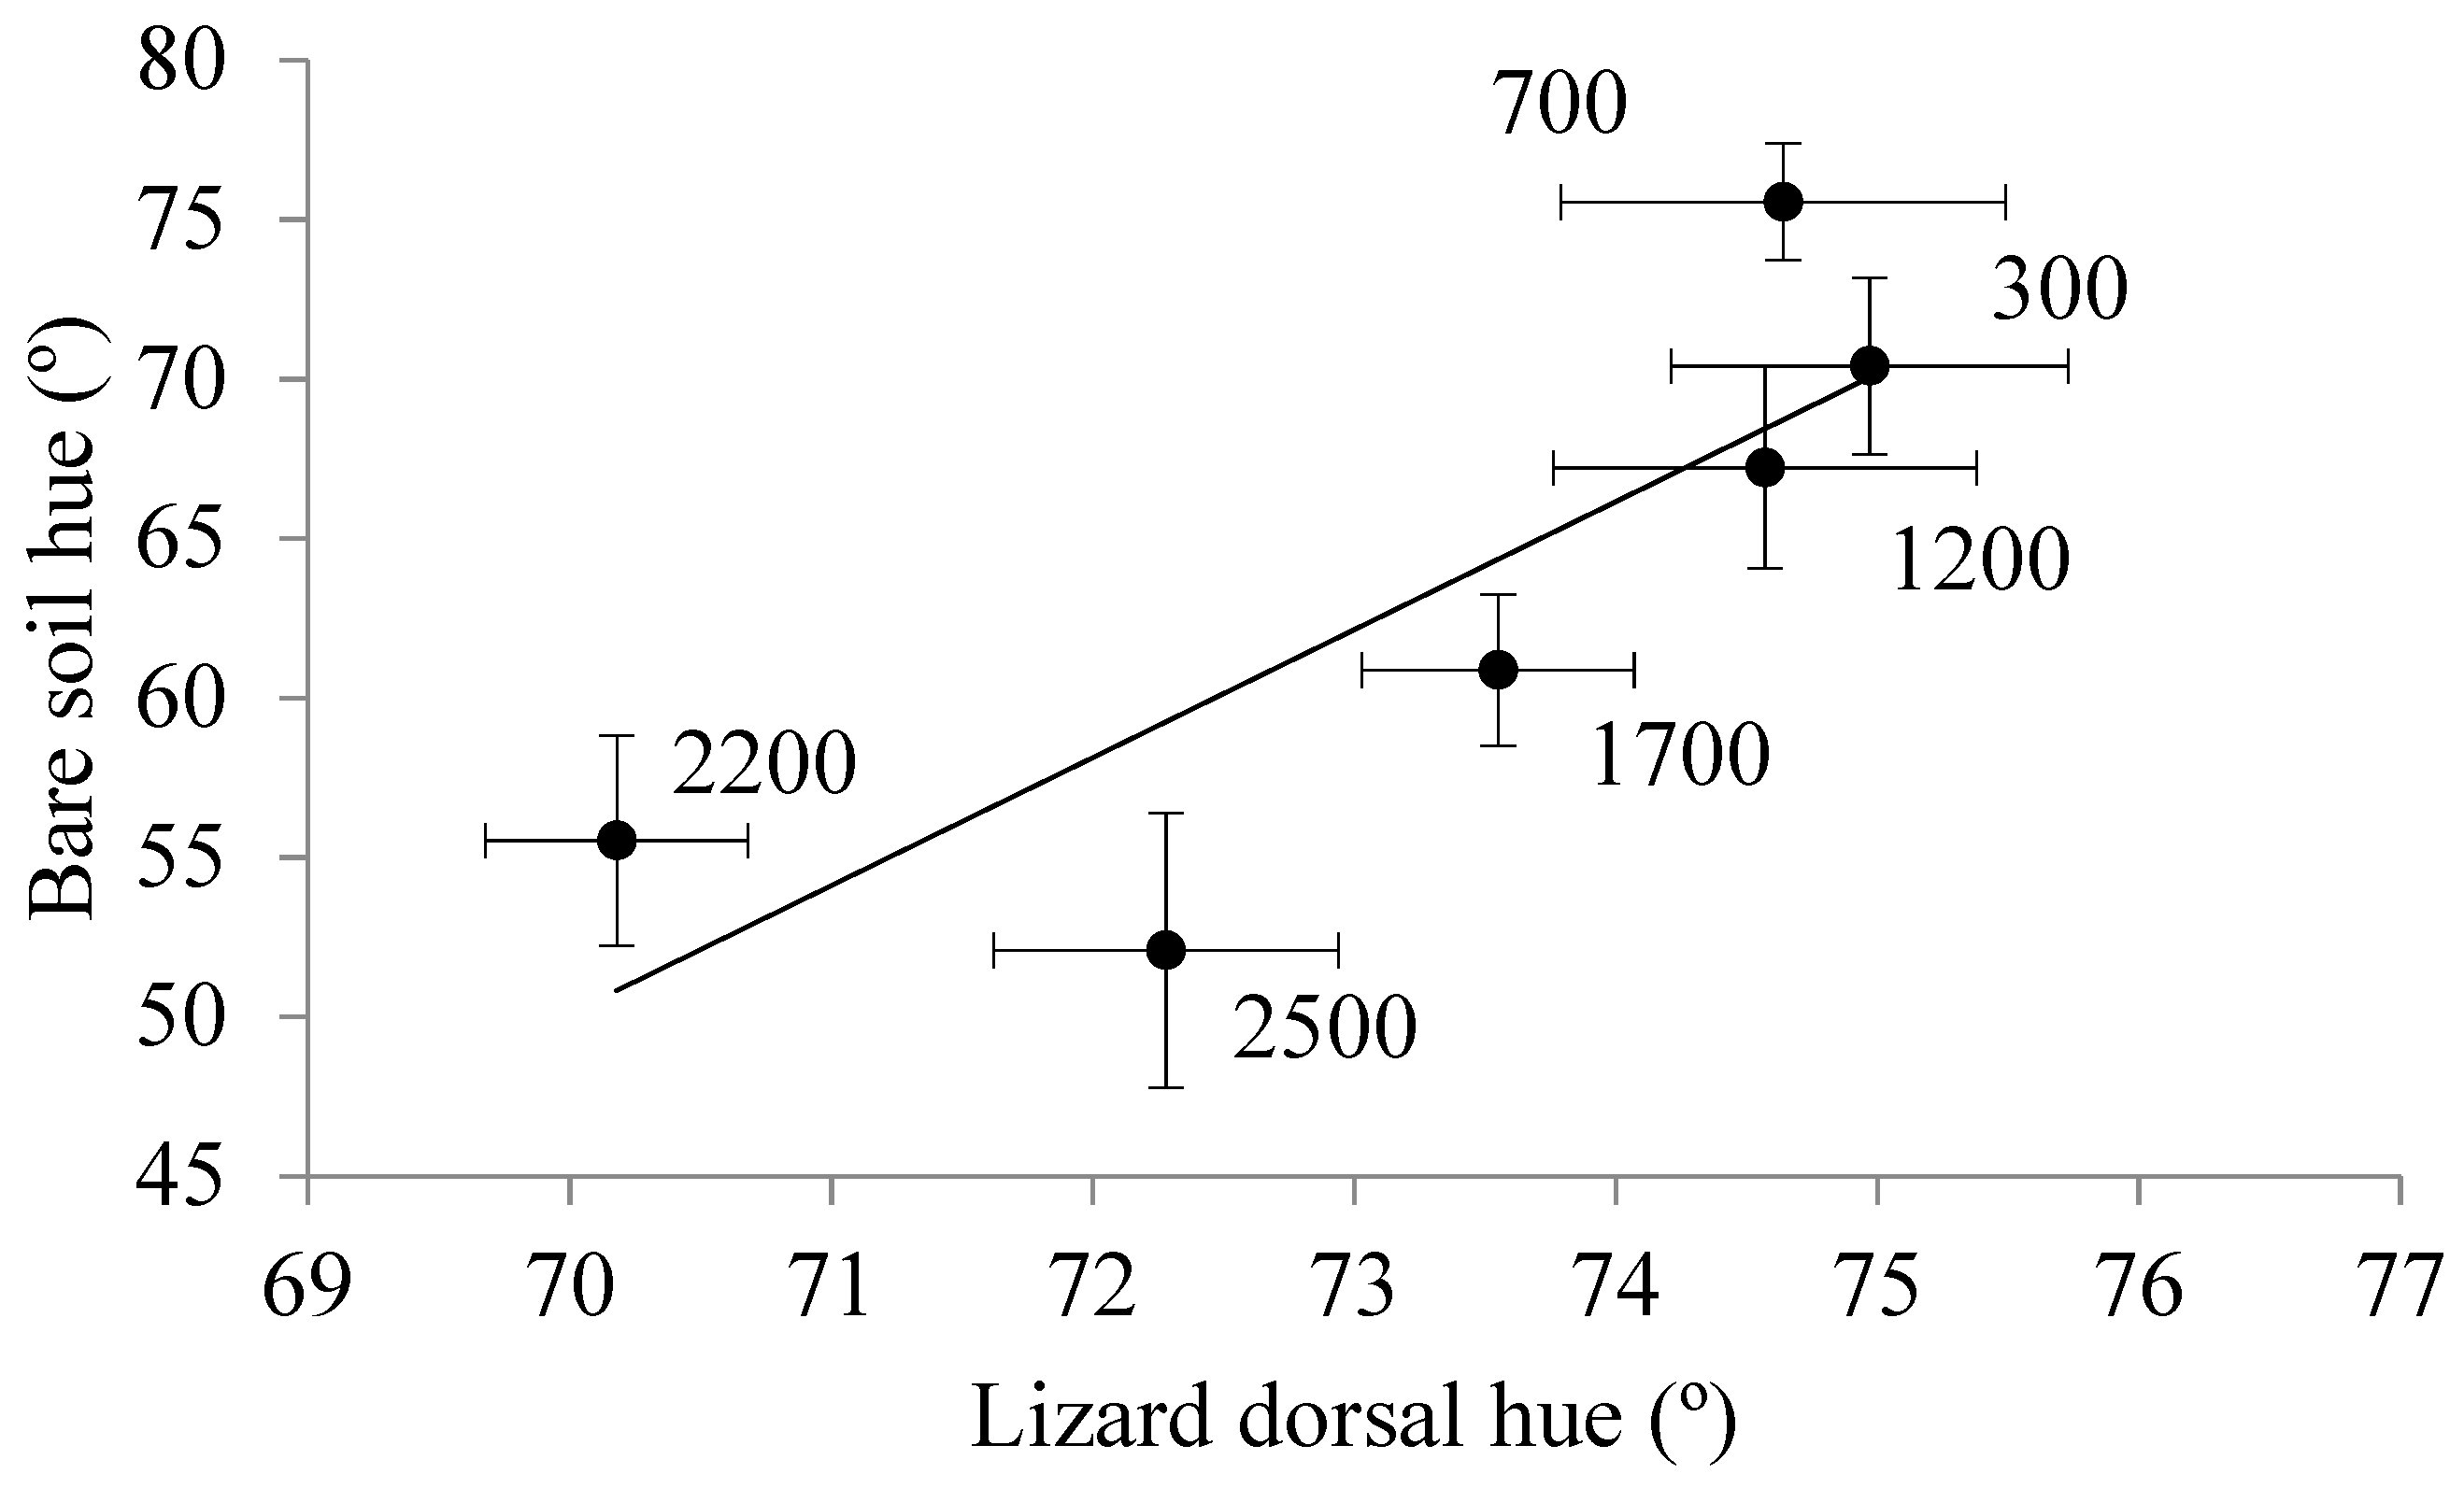
3.1. Elevational Variation of the Environmental Background Colour

According to the photos, the bare soil was the dominant environmental element chosen by lizards at all elevations (Figure 2). Overall, at each location, bare soil was significantly more frequent than the second most frequent element (rock or fresh grass, depending on the sampling point; Fisher exact test, always p < 0.05), except at 300 m, where there was no statistical difference between bare soil and rock (p = 0.42). Therefore, in most cases, lizards were found on a background of bare soil. The three chromatic components (L*C*H*) of bare soil significantly varied with elevation (Table 1). In general, the bare soil was darker, less yellow and redder, and more saturated as elevation increased (Figure 3). The colour of the remaining elements of the background environment did not display any clear trend along the elevational gradient (Table 1).

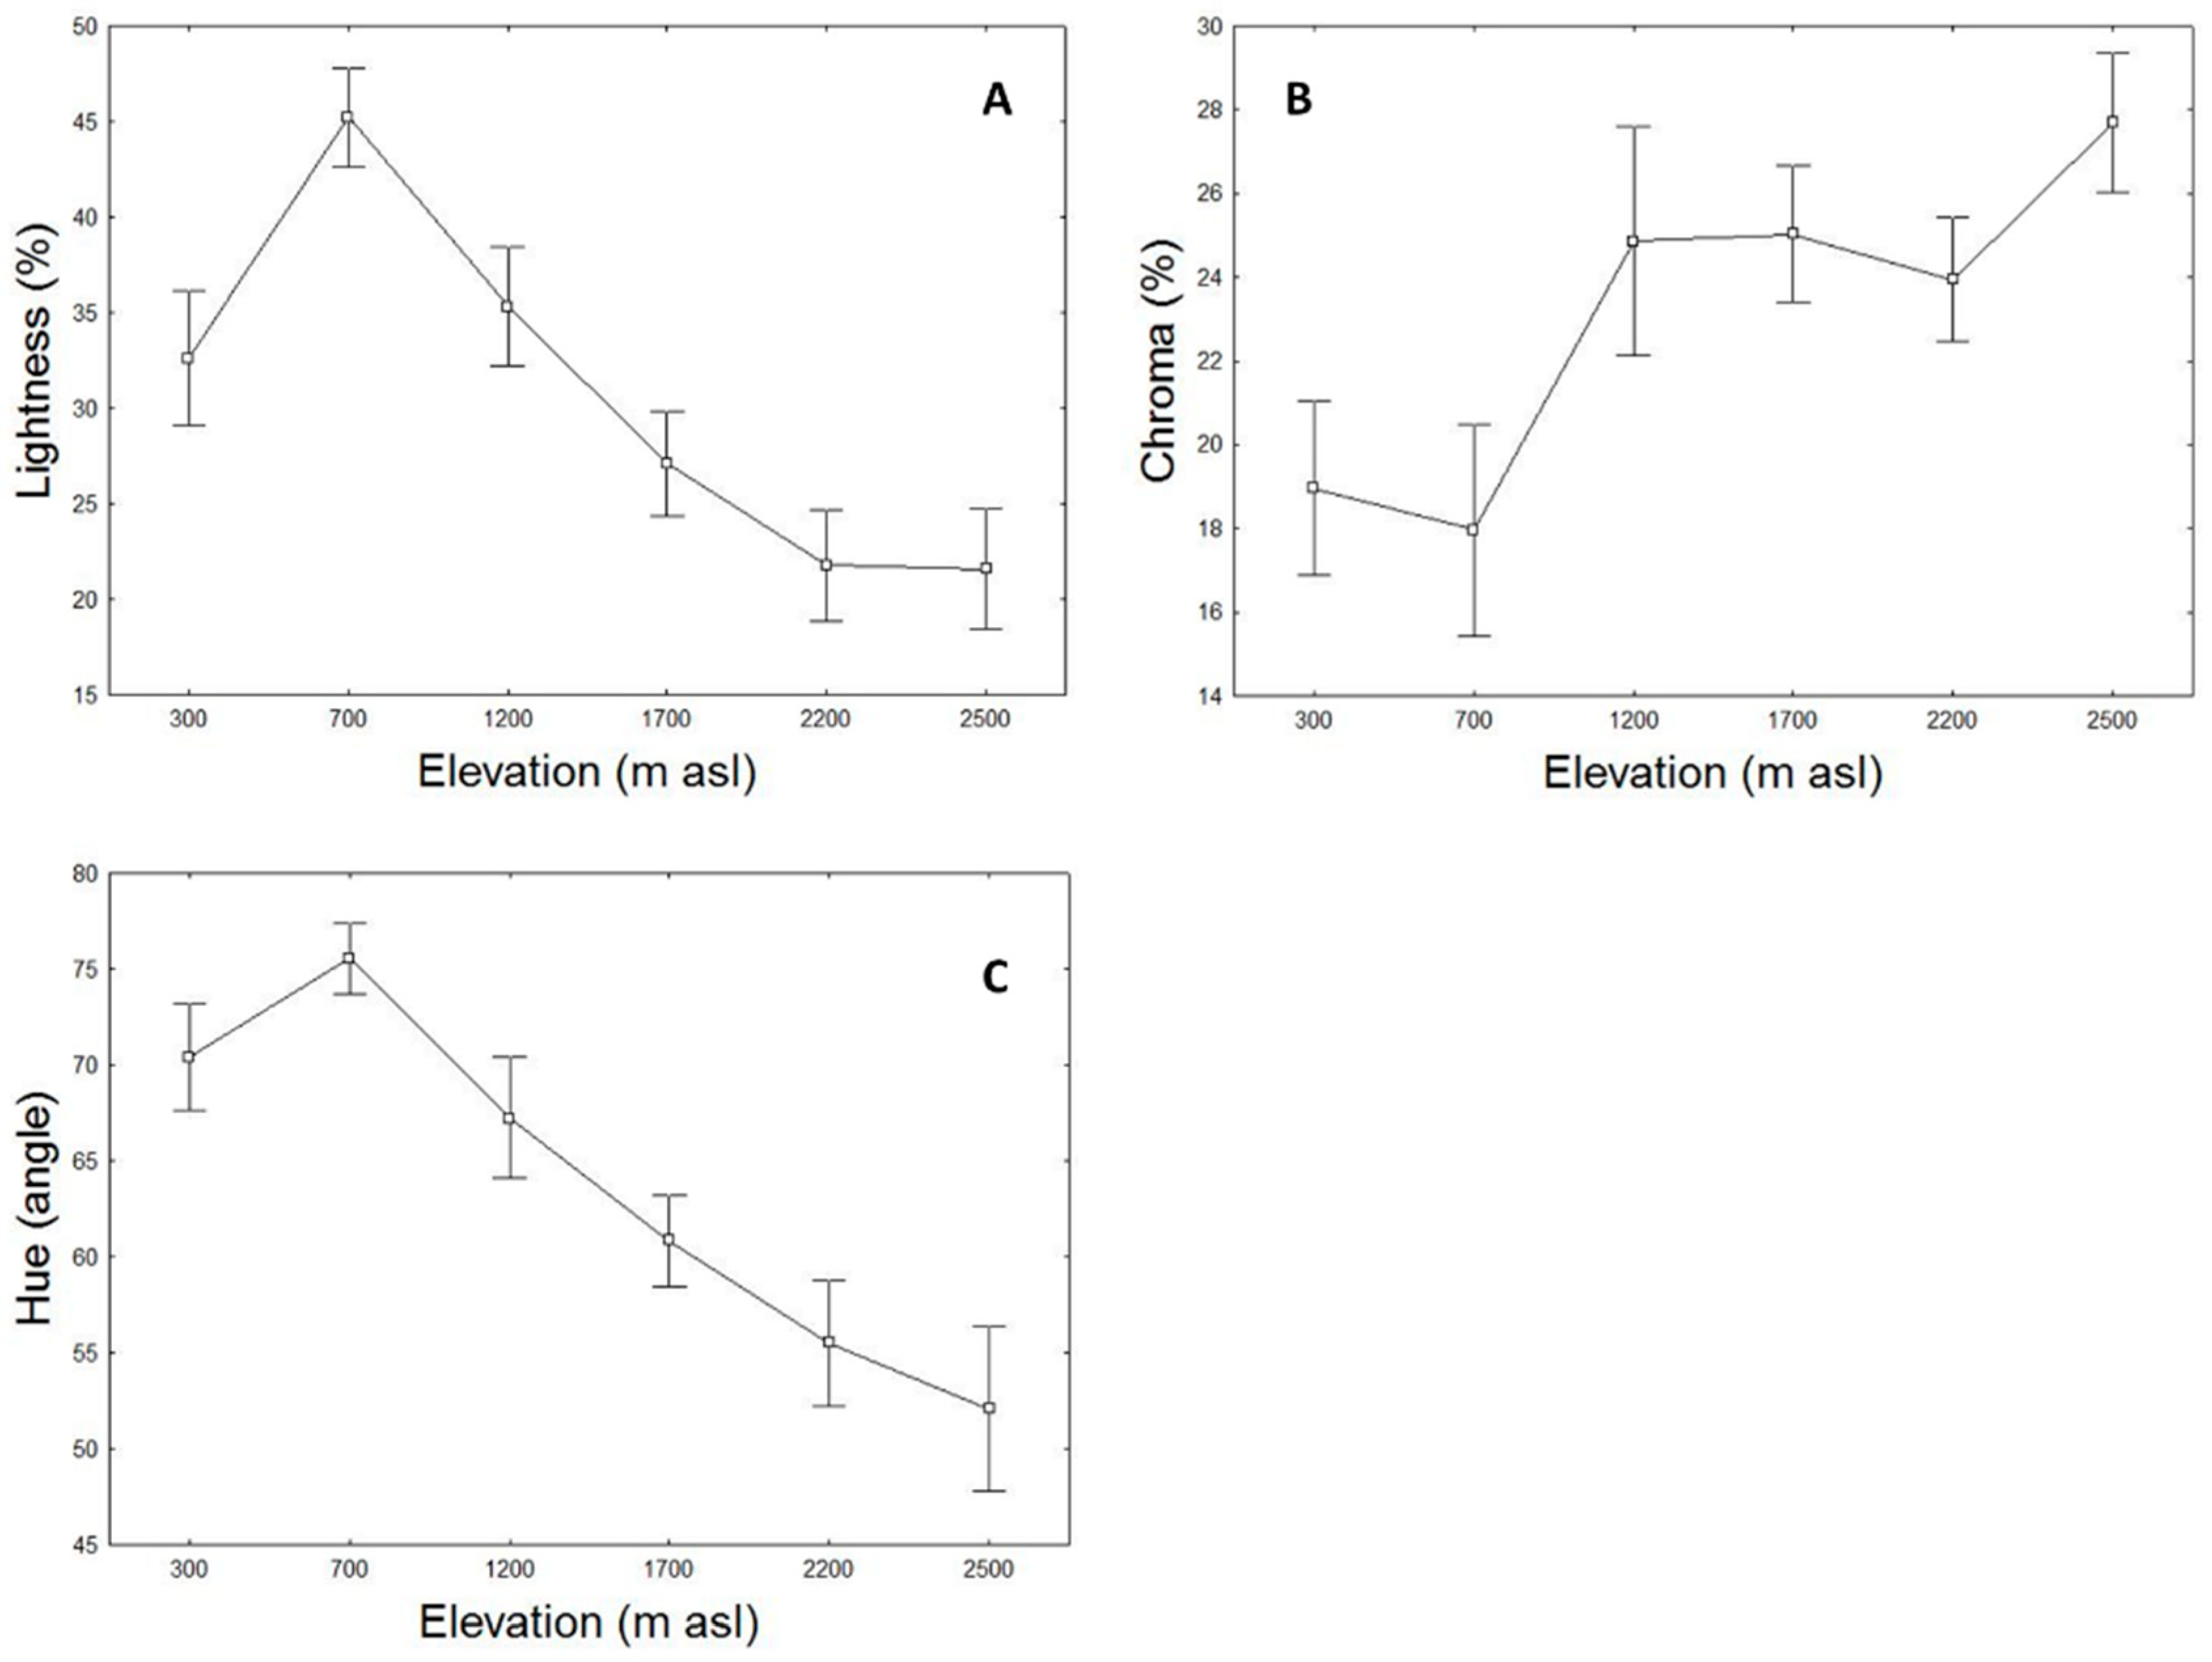
3.2. Elevational Variation of Lizard Dorsal Colour

Lizards’ dorsal colour changed significantly along the elevational gradient (Table 2). In general, the dorsum of lizards became darker, less saturated, and less yellow at the highest elevations (see Figure 2 in [45]). Post hoc analyses revealed that the elevational colour difference occurred between lizards from elevations over 2000 m asl (from sampling points at 2200 and 2500 m) and those from lower elevations (Appendix D). Regarding the relationship between the dorsal colour of the lizards and colour of the background environment, we only found a significant correlation between the average hue of lizard dorsum and the hue of bare soil (Table 3; Figure 4).

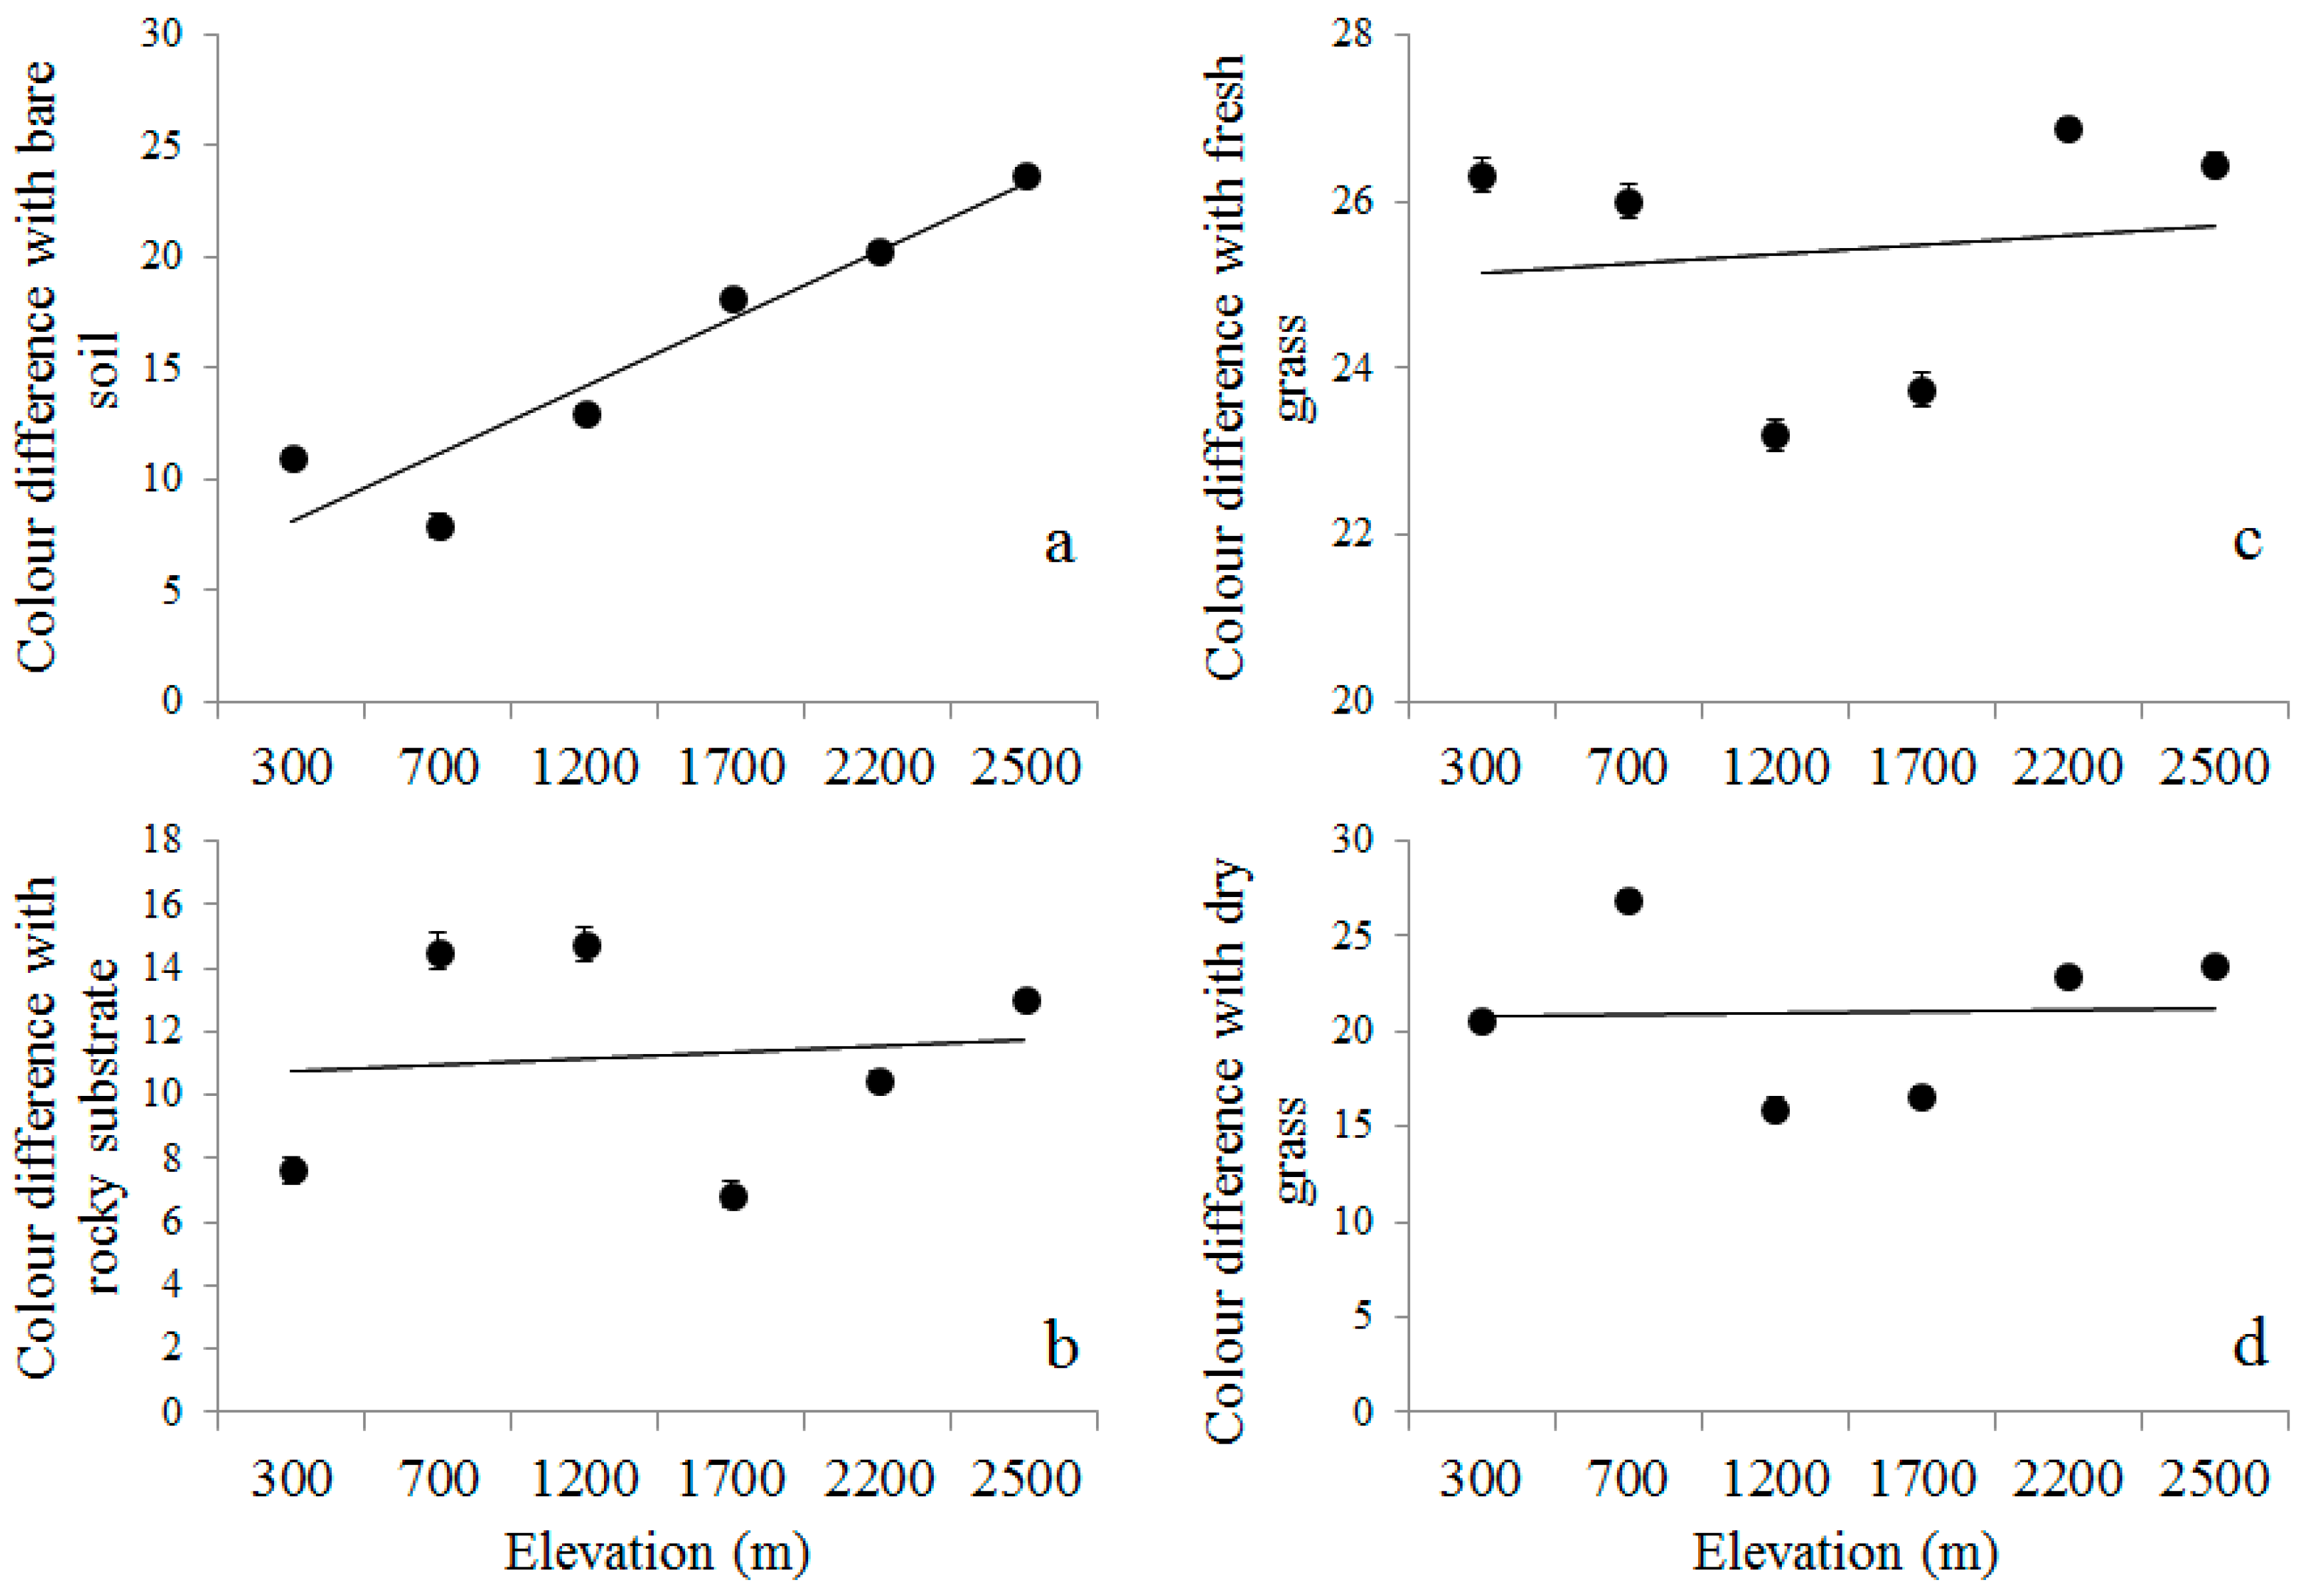
3.3. Elevational Variation in the Degree of Crypsis

The difference between dorsal and background colour was minimal for the rocky substrate, followed by the difference with bare soil (see Figure 5). Crypsis on each element of the background (bare soil, rock, fresh grass, and dry grass), that is, the difference between lizard dorsal colour and each one of the four elements, significantly varied with elevation (Table 4). Nevertheless, only the colour difference between dorsum and bare soil showed a clear trend along the gradient, the degree of crypsis with bare soil being higher (lower colour difference) in lowland lizards, and decreasing gradually with elevation (rs = 0.94, p = 0.005; Figure 5a; for the remaining elements of the background environment, always p > 0.3). In general, differences in crypsis with bare soil were patent between each pair of elevations (post hoc analyses in Appendix E).

4. Discussion

In this study, we tested three predictions relative to the evolution of crypsis in the lizard P. algirus along an elevational gradient: (1) Dorsal colour will be more similar to bare soil colour (the substrate where the lizard is more frequently found) than to rock substrate or grass colour; (2) dorsal colour will covary with bare soil colour along the elevational gradient; and (3) the accuracy of crypsis should decrease with elevation. Our findings supported predictions 2 and 3, but gave only partial support to prediction 1.
Our findings show that P. algirus lizards are found more often on bare soil backgrounds than on rocks or in fresh or dry grass. Therefore, the degree of crypsis was predicted to be maximal for bare soil in comparison to the other background elements (rock, fresh, and dry grass). Nonetheless, this prediction was not completely supported, since the maximal crypsis was on rocky backgrounds in four of the six locations, followed by bare soil, on which crypsis was maximal in 700 and 1200 m asl (see Figure 4a,b). Thus, our findings indicate that the dorsal colour of P. algirus was similar to rocks and bare soil. The likeness to bare soil was expected, but the similarity to rocks was not. A tentative explanation is that, considering that rocky surfaces present certain advantages as basking sites [72], this lizard could use rocks to heat rapidly when their body temperature is especially low (e.g., early in the morning; [73,74]). Moreover, this lizard presents reduced escape capacity at low body temperatures [75], which increases predation risk. Hence, if this explanation is correct, lizards could be at higher risk of predation when basking on rocks during the early morning, which might explain why in some localities lizards present a greater degree of crypsis with rocks, despite spending more time on bare soil.
When potential prey move on different backgrounds, the evolution of crypsis may follow different ways [76,77,78,79]. Prey may acquire a compromise crypsis, being imperfectly cryptic on several backgrounds at the same time, especially if backgrounds are similar. On the other hand, under certain circumstances, prey may be cryptic only on a determined background, for example, the most frequent in the environment [18], or where they are more exposed to predators [2]. Thereby, prey may show generalist or specialist crypsis, respectively. Our findings suggest that P. algirus lizards show a generalist crypsis, intermediate for two different backgrounds: Rocks, where they are at higher risk, and bare soil, where they are more frequently exposed.
Bare soil colouration varied with elevation along the six locations and the dorsal hue of lizards was correlated with that of bare soil throughout the elevational gradient. This finding suggests that geographic variation in P. algirus dorsal colour, along the elevational gradient in the Sierra Nevada, may be a consequence of local adaptation mediated by predation. Local adaptation, however, may be hindered by a number of factors [80]. Consequently, we also hypothesised that a conflict with selection for crypsis would appear given that the selective pressures favouring darker dorsum—for protection against UV radiation and/or increased thermal efficiency [45]—strengthen with elevation. Our results for bare soil are also consistent with this hypothesis, as the degree of crypsis on bare soil decreased with elevation (which did not occur for other background elements). Therefore, local adaptation for crypsis in this system seems hindered at higher elevations by the increasing importance of other environmental variables that select for a darker dorsum in lizards.
The decreased crypsis with elevation, nonetheless, might also be caused by a reduced predation pressure with elevation. We have no detailed data in our study system to asseverate that predation pressure declines with elevation, but several studies report reduced predation pressure with altitude [38] (for lizards see [81]).
In conclusion, our findings suggest elevational variation in P. algirus dorsal colour, which matches with a gradient of bare soil background colour (the substrate over which this lizard is usually found). Thus, we suggest that predation pressure has selected for crypsis in this lizard, causing geographical variation in dorsal colour as a consequence of variation in the colour of the bare soil. Moreover, the degree of crypsis decreased with elevation, probably as a consequence of contrasting selective pressures (thermoregulation, UV protection) on lizard colouration or a decrease in predation pressure. Overall, these findings suggest the existence of local adaptation in the degree of crypsis along the elevational gradient.

Author Contributions

Conceptualization, G.M.-R.; methodology, G.M.-R., L.G.G.-G. and S.R.; resources: G.M.-R.; investigation: L.G.G.-G., S.R., F.J.Z.-C. and E.M.; data curation: L.G.G.-G.; formal analysis, G.M.-R. and L.G.G.-G.; writing, original draft, G.M.-R. and L.G.G.-G.; writing, additional inputs, S.R., F.J.Z.-C. and E.M.; supervision, G.M.-R.; project administration, G.M.-R.; funding acquisition, G.M.-R.

Funding

This study has been economically supported by the Ministerio de Ciencia e Innovación (project CGL2009-13185). FJZC and SR were supported by two pre-doctoral grants from the Ministerio de Ciencia e Innovación (FPU program).

Acknowledgments

We thank the personnel from the Espacio Natural de Sierra Nevada for their constant support. Comments by José Javier Cuervo helped to design the study. David Nesbitt improved the English. Comments by three anonymous referees improved the manuscript.

Conflicts of Interest

The authors declare no conflict of interest.

Ethics Statement

The research was conducted in accordance with both Junta de Andalucía and National Park of Sierra Nevada research permits (references GMN/GyB/JMIF and ENSN/JSG/JEGT/MCF) issued to the authors.

Appendix A

Table A1. Sample size of lizards used in the study, broken down by elevation (rows), month (columns) and sex (females/males).
ElevationMarchAprilMayJuneJulyAugustTotal
3001/24/69/810/2010/12-34/48
700-1/06/712/1110/51/030/23
1200-0/29/412/86/40/127/19
17000/10/113/1711/74/63/431/36
2200-0/110/816/1411/82/339/34
2500--6/1318/1911/11-35/43
Total1/35/1053/5779/7952/466/8196/203

Appendix B

Table A2. Classification of age categories by elevation. We followed an objective criterion to consider adult age categories based on two maturity traits. Adult males show an orange commissure, so we considered the snout-vent-length (SVL) of the smallest male with this trait as the bottom limit between sub-adult and adult. In the case of females, gravidity is a clear sign of maturity, so we considered the SVL of the smallest gravid female as the limit between sub-adult and adult. In addition, because mature body size varies along elevation, we applied these criteria separately at each locality sampled. This table shows the SVL (in mm) chosen to discern adult individuals for each sex and elevation (in m asl).
ElevationSVL MalesSVL Females
3005553
7005554
12005556
17005559
22006265
25006367

Appendix C

Figure A1. Spectrum of reflectance from 300 to 700 nm wavelength of the lizard Psammodromus algirus in the Sierra Nevada (Spain). Reflectance was measured from the skin in the middle of the back (in blue), the yellow dorsolateral line (in red), and in the pileus (in green). Reflectance spectrum was measured with an Ocean Optics spectrophotometer in 12 adult male lizards captured along the elevational gradient in July of 2013. Data was compiled by Rodrigo Megía-Palma. In abscises, an example of the reflectance spectrum and each of the four segments in which it is divided in the Commission Internationale d’Éclairage (CIE) Lab colour space (+a*, −a*, +b*, −b*).
Diversity 11 00236 g0a1

Appendix D

Table A3. Post-hoc analyses: Pairwise differences (in absolute values) between elevations for the chromatic values of the dorsum of the lizard Psammodromus algirus for each elevation: Lightness (L*, above the diagonal), chroma (C*, below the diagonal), and hue angle (part inferior of the Table). * p ≤ 0.05, ** p < 0.01, *** p < 0.001. p-value was adjusted for multiple comparisons with unequal N HSD (Honestly Significant Difference) post hoc test. In bold, significant differences.
L*3007001200170022002500
C*
300 0.251.910.621.93 ***1.53 ***
7000.70 0.591.290.16 *0.24
12000.060.63 0.991.56 ***1.16 *
17000.830.130.77 0.88 ***0.49 **
22002.73 ***2.04 ***2.67 ***1.90 *** 1.17
25002.85 ***2.16 ***2.79 ***2.02 ***0.12
Hue Angle
300 0.330.401.424.79 ***2.69
700 0.071.094.46 **2.36
1200 1.024.38 *2.28
1700 3.36 *1.26
2200 2.10

Appendix E

Table A4. Post-hoc analyses showing pairwise differences between the values of each colour difference variable (degree of crypsis; difference between the colour of lizards’ dorsum and the colour of the elements of the background) for each elevation (300, 700, 1200, 1700, 2200 and 2500 m asl). * p ≤ 0.05, ** p < 0.01.
Bare Soil3007001200170022002500
Rock
300 0.012.77 *8.86 **10.54 **13.36 **
7008.01 2.78 *8.87 **10.55 **13.36 **
12005.86 **2.15 6.09 **7.77 **10.58 **
17001.9910.00 **7.85 ** 1.684.49 **
22002.025.99 **3.84 **4.01 ** 2.81 **
25005.24 **8.770.627.23 **3.22 **
Fresh Grass3007001200170022002500
Dry grass
300 0.033.15 **2.85 **0.610.55
7007.51 ** 3.18 **2.89 **0.580.52
12005.47 **12.99 ** 0.293.75 **3.70 **
17004.75 **12.27 **0.72 3.46 **3.41 **
22001.695.83 **7.16 **6.44 ** 0.05
25003.58 **3.93 **9.06 **8.34 **1.89

References

  1. Hill, J.E.; DeVault, T.L.; Belant, J.L.; Algar, A. Cause-specific mortality of the world’s terrestrial vertebrates. Glob. Ecol. Biogeogr. 2019, 28, 680–689. [Google Scholar] [CrossRef] [Green Version]
  2. Ruxton, G.D.; Allen, W.L.; Sherratt, T.N.; Speed, M.P. Avoiding Attack: The Evolutionary Ecology of Crypsis, Aposematism, and Mimicry; Oxford University Press: Oxford, UK, 2004. [Google Scholar]
  3. Caro, T. Antipredator Defenses in Birds and Mammals; Chicago University Press: Chicago, IL, USA, 2005. [Google Scholar]
  4. Stevens, M.; Merilaita, S. (Eds.) Animal Camouflage: Mechanisms and Function; Cambridge University Press: Cambridge, UK, 2011; ISBN 0521152577. [Google Scholar]
  5. Cooper, W.E.J.; Blumstein, D.T. (Eds.) Escaping from Predators: An Integrative View of Escape Decisions; Cambridge University Press: Cambridge, UK, 2015. [Google Scholar]
  6. Merilaita, S.; Stevens, M. Crypsis through Background Matching. In Animal Camouflage: Mechanisms and Function; Stevens, M., Merilaita, S., Eds.; Cambridge University Press: Cambridge, UK, 2011; pp. 17–33. [Google Scholar]
  7. Cuthill, I.C. Camouflage. J. Zool. 2019, 308, 75–92. [Google Scholar] [CrossRef] [Green Version]
  8. Stevens, M.; Merilaita, S. Animal camouflage: Current issues and new perspectives. Phil. Trans. R. Soc. B 2009, 364, 423–427. [Google Scholar] [CrossRef] [PubMed] [Green Version]
  9. Merilaita, S.; Scott-Samuel, N.E.; Cuthill, I.C. How camouflage works. Phil. Trans. R. Soc. B 2017, 372. [Google Scholar] [CrossRef] [PubMed] [Green Version]
  10. Endler, J.A. On the measurement and classification of colour in studies of animal colour patterns. Biol. J. Linn. Soc. 1990, 41, 315–352. [Google Scholar] [CrossRef]
  11. Kaufman, D.W. Adaptive coloration in Peromyscus polionotus: Experimental selection by owls. J. Mammal. 1974, 55, 271–283. [Google Scholar] [CrossRef]
  12. Cooper, J.M.; Allen, J.A. Selection by wild birds on artificial dimorphic prey on varied backgrounds. Biol. J. Linn. Soc. 1994, 51, 433–446. [Google Scholar] [CrossRef]
  13. Bond, A.B.; Kamil, A.C. Visual predators select for crypticity and polymorphism in virtual prey. Nature 2002, 415, 609–613. [Google Scholar] [CrossRef] [Green Version]
  14. Stuart-Fox, D.M.; Moussalli, A.; Marshall, N.J.; Owens, I.P.F. Conspicuous males suffer higher predation risk: Visual modelling and experimental evidence from lizards. Anim. Behav. 2003, 66, 541–550. [Google Scholar] [CrossRef]
  15. Cuthill, I.C.; Stevens, M.; Sheppard, J.; Maddocks, T.; Párraga, C.A.; Troscianko, T.S. Disruptive coloration and background pattern matching. Nature 2005, 434, 72–74. [Google Scholar] [CrossRef]
  16. Dimitrova, M.; Merilaita, S. Hide and seek: Properties of prey and background patterns affect prey detection by blue tits. Behav. Ecol. 2014, 25, 402–408. [Google Scholar] [CrossRef] [Green Version]
  17. Merilaita, S.; Dimitrova, M. Accuracy of background matching and prey detection: Predation by blue tits indicates intense selection for highly matching prey colour pattern. Funct. Ecol. 2014, 28, 1208–1215. [Google Scholar] [CrossRef] [Green Version]
  18. Michalis, C.; Scott-Samuel, N.E.; Gibson, D.P.; Cuthill, I.C. Optimal background matching camouflage. Proc. R. Soc. B 2017, 284, 20170709. [Google Scholar] [CrossRef] [PubMed]
  19. Walton, O.C.; Stevens, M. Avian vision models and field experiments determine the survival value of peppered moth camouflage. Commun. Biol. 2018, 1, 118. [Google Scholar] [CrossRef]
  20. Slagsvold, T.; Dale, S.; Kruszewicz, A. Predation favours cryptic coloration in breeding male pied flycatchers. Anim. Behav. 1995, 50, 1109–1121. [Google Scholar] [CrossRef]
  21. Cook, L.M.; Grant, B.S.; Saccheri, I.J.; Mallet, J. Selective bird predation on the peppered moth: The last experiment of Michael Majerus. Biol. Lett. 2012, 8, 609–612. [Google Scholar] [CrossRef]
  22. Troscianko, J.; Wilson-Aggarwal, J.; Stevens, M.; Spottiswoode, C.N. Camouflage predicts survival in ground-nesting birds. Sci. Rep. 2016, 6, 19966. [Google Scholar] [CrossRef] [Green Version]
  23. Norris, K.S.; Lowe, C.H. An analysis of background color-matching in amphibians and reptiles. Ecology 1964, 45, 565–580. [Google Scholar] [CrossRef]
  24. Harris, A.C.; Weatherall, I.L. Geographic variation for colour in the sandburrowing beetle Chaerodes trachyscelides White (Coleoptera: Tenebrionidae) on New Zealand beaches analysed using CIELAB L values. Biol. J. Linn. Soc. 1991, 44, 93–104. [Google Scholar] [CrossRef]
  25. Stuart-Fox, D.; Moussalli, A.; Johnston, G.R.; Owens, I.P.F. Evolution of color variation in dragon lizards: Quantitative tests of the role of crypsis and local adaptation. Evolution 2004, 58, 1549–1559. [Google Scholar] [CrossRef]
  26. Hoekstra, H.E.; Krenz, J.G.; Nachman, M.W. Local adaptation in the rock pocket mouse (Chaetodipus intermedius): Natural selection and phylogenetic history of populations. Heredity 2005, 94, 217–228. [Google Scholar] [CrossRef] [PubMed] [Green Version]
  27. Rosenblum, E.B. Convergent evolution and divergent selection: Lizards at the White Sands ecotone. Am. Nat. 2006, 167, 1–15. [Google Scholar] [CrossRef] [PubMed]
  28. Marshall, K.L.A.; Philpot, K.E.; Damas-Moreira, I.; Stevens, M. Intraspecific colour variation among lizards in distinct island environments enhances local camouflage. PLoS ONE 2015, 10, e0135241. [Google Scholar] [CrossRef] [PubMed] [Green Version]
  29. Cadena, V.; Smith, K.R.; Endler, J.A.; Stuart-Fox, D. Geographic divergence and colour change in response to visual backgrounds and illumination intensity in bearded dragons. J. Exp. Biol. 2017, 220, 1048–1055. [Google Scholar] [CrossRef] [PubMed] [Green Version]
  30. O’Hanlon, A.; Feeney, K.; Dockery, P.; Gormally, M.J. Quantifying phenotype-environment matching in the protected Kerry spotted slug (Mollusca: Gastropoda) using digital photography: Exposure to UV radiation determines cryptic colour morphs. Front. Zool. 2017, 14, 319. [Google Scholar] [CrossRef] [PubMed] [Green Version]
  31. Tong, H.; Li, J.; Wo, Y.; Shao, G.; Zhao, W.; Aguilar-Gómez, D.; Jin, Y. Effects of substrate color on intraspecific body color variation in the toad-headed lizard, Phrynocephalus versicolor. Ecol. Evol. 2019, 9, 10253–10262. [Google Scholar] [CrossRef] [PubMed] [Green Version]
  32. Endler, J.A. A predator’s view of animal color patterns. Evol. Biol. 1978, 11, 319–364. [Google Scholar]
  33. Nachman, M.W.; Hoekstra, H.E.; D’Agostino, S.L. The genetic basis of adaptive melanism in pocket mice. Proc. Natl. Acad. Sci. USA 2003, 100, 5268–5273. [Google Scholar] [CrossRef] [Green Version]
  34. Laurent, S.; Pfeifer, S.P.; Settles, M.L.; Hunter, S.S.; Hardwick, K.M.; Ormond, L.; Sousa, V.C.; Jensen, J.D.; Rosenblum, E.B. The population genomics of rapid adaptation: Disentangling signatures of selection and demography in white sands lizards. Mol. Ecol. 2016, 25, 306–323. [Google Scholar] [CrossRef]
  35. Körner, C. The use of “altitude” in ecological research. Trends Ecol. Evol. 2007, 22, 569–574. [Google Scholar] [CrossRef]
  36. Keller, I.; Alexander, J.M.; Holderegger, R.; Edwards, P.J. Widespread phenotypic and genetic divergence along altitudinal gradients in animals. J. Evol. Biol. 2013, 26, 2527–2543. [Google Scholar] [CrossRef] [PubMed]
  37. Endler, J.A. Natural selection on colour patterns in Poecilia reticulata. Evolution 1980, 34, 76–91. [Google Scholar] [CrossRef] [PubMed]
  38. Camacho, L.; Avilés, L. Decreasing predator density and activity explain declining predation of insect prey along elevational gradients. Am. Nat. 2019, 194, 334–343. [Google Scholar] [CrossRef] [PubMed]
  39. Cloudsley-Thompson, J.L. Multiple factors in the evolution of animal colouration. Naturwissenschaften 1999, 86, 123–132. [Google Scholar] [CrossRef] [PubMed]
  40. Clusella-Trullas, S.; van Wyk, J.H.; Spotila, J.R. Thermal melanism in ectotherms. J. Thermal. Biol. 2007, 32, 235–245. [Google Scholar] [CrossRef]
  41. Ulbing, C.K.S.; Muuse, J.M.; Miner, B.E. Melanism protects alpine zooplankton from DNA damage caused by ultraviolet radiation. Proc. R. Soc. B 2019, 286, 20192075. [Google Scholar] [CrossRef]
  42. Marshall, K.L.A.; Stevens, M. Wall lizards display conspicuous signals to conspecifics and reduce detection by avian predators. Behav. Ecol. 2014, 25, 1325–1337. [Google Scholar] [CrossRef] [Green Version]
  43. Huey, R.B.; Slatkin, M. Cost and benefits of lizard thermoregulation. Q. Rev. Biol. 1976, 51, 363–384. [Google Scholar] [CrossRef]
  44. Orton, R.W.; McBrayer, L.D. Resolving tradeoffs among crypsis, escape behavior, and microhabitat use in sexually dichromatic species. Oecologia 2019, 189, 91–104. [Google Scholar] [CrossRef]
  45. Reguera, S.; Zamora-Camacho, F.J.; Moreno-Rueda, G. The lizard Psammodromus algirus (Squamata: Lacertidae) is darker at high altitudes. Biol. J. Linn. Soc. 2014, 112, 132–141. [Google Scholar] [CrossRef] [Green Version]
  46. Salvador, A. Lagartija Colilarga—Psammodromus Algirus (Linnaeus, 1758). In Enciclopedia Virtual de los Vertebrados Españoles; Salvador, A., Marco, A., Eds.; Museo Nacional de Ciencias Naturales: Madrid, Spain, 2015. [Google Scholar]
  47. Díaz, J.A.; Carrascal, L.M. Regional distribution of a Mediterranean lizard: Influence of habitat cues and prey abundance. J. Biogeogr. 1991, 18, 291–297. [Google Scholar] [CrossRef] [Green Version]
  48. Moreno-Rueda, G.; Melero, E.; Reguera, S.; Zamora-Camacho, F.J.; Álvarez-Benito, I. Prey availability, prey selection, and trophic niche width in the lizard Psammodromus algirus along an elevational gradient. Curr. Zool. 2018, 64, 603–613. [Google Scholar] [CrossRef] [PubMed]
  49. Zamora-Camacho, F.J.; Reguera, S.; Moreno-Rueda, G. Thermoregulation in the lizard Psammodromus algirus along a 2200-m elevational gradient in Sierra Nevada (Spain). Int. J. Biometeorol. 2016, 60, 687–697. [Google Scholar] [CrossRef] [PubMed]
  50. Díaz, J.A. Breeding coloration, mating opportunities, activity, and survival in the lacertid lizard Psammodromus algirus. Can. J. Zool. 1993, 71, 1104–1110. [Google Scholar] [CrossRef]
  51. Martín, J.; López, P. Amphibians and reptiles as prey of birds in Southwestern Europe. Herpetol. Inf. Serv. 1990, 82, 1–43. [Google Scholar]
  52. Martín, J.; Avery, R.A. Effects of tail loss on the movement patterns of the lizard, Psammodromus algirus. Funct. Ecol. 1998, 12, 794–802. [Google Scholar] [CrossRef] [Green Version]
  53. Pérez-Tris, J.; Díaz, J.A.; Tellería, J.L. Loss of body mass under predation risk: Cost of antipredatory behaviour or adaptive fit-for-escape? Anim. Behav. 2004, 67, 511–521. [Google Scholar] [CrossRef]
  54. López, P.; Martín, J. Effects of microhabitat-dependent predation risk on vigilance during intermittent locomotion in Psammodromus algirus lizards. Ethology 2013, 119, 316–324. [Google Scholar] [CrossRef]
  55. Díaz, J.A. Choice of compass directions around shrub patches by the heliothermic lizard Psammodromus algirus. Herpetologica 1992, 48, 293–300. [Google Scholar]
  56. Martín, J.; López, P. Influence of habitat structure on the escape tactics of the lizard Psammodromus algirus. Can. J. Zool. 1995, 73, 129–132. [Google Scholar] [CrossRef]
  57. Martín, J.; López, P. Fleeing to unsafe refuges: Effects of conspicuousness and refuge safety on the escape decisions of the lizard Psammodromus Algirus. Can. J. Zool. 2000, 78, 265–270. [Google Scholar] [CrossRef] [Green Version]
  58. Díaz, J.A.; Verdú-Ricoy, J.; Iraeta, P.; Llanos-Garrido, A.; Pérez-Rodríguez, A.; Salvador, A. There is more to the picture than meets the eye: Adaptation for crypsis blurs phylogeographical structure in a lizard. J. Biogeogr. 2017, 44, 397–408. [Google Scholar] [CrossRef] [Green Version]
  59. Zamora-Camacho, F.J.; Reguera, S.; Moreno-Rueda, G.; Pleguezuelos, J.M. Patterns of seasonal activity in a Mediterranean lizard along a 2200m altitudinal gradient. J. Thermal. Biol. 2013, 38, 64–69. [Google Scholar] [CrossRef]
  60. Carretero, M.A. Sources of colour pattern variation in Mediterranean Psammodromus algirus. Neth. J. Zool. 2002, 52, 43–60. [Google Scholar] [CrossRef] [Green Version]
  61. Montgomerie, R. Analazing Colors. In Bird Coloration. Vol. I: Mechanisms and Measurements; Hill, G.E., McGraw, K.J., Eds.; Harvard University Press: Cambridge, UK, 2006; pp. 90–147. [Google Scholar]
  62. Kemp, D.J.; Herberstein, M.E.; Fleishman, L.J.; Endler, J.A.; Bennett, A.T.D.; Dyer, A.G.; Hart, N.S.; Marshall, J.; Whiting, M.J. An integrative framework for the appraisal of coloration in nature. Am. Nat. 2015, 185, 705–724. [Google Scholar] [CrossRef] [Green Version]
  63. Stevens, M.; Párraga, C.A.; Cuthill, I.C.; Partridge, J.C.; Troscianko, T.S. Using digital photography to study animal coloration. Biol. J. Linn. Soc. 2007, 90, 211–237. [Google Scholar] [CrossRef] [Green Version]
  64. Cuthill, I.C.; Allen, W.L.; Arbuckle, K.; Caspers, B.; Chaplin, G.; Hauber, M.E.; Hill, G.E.; Jablonski, N.G.; Jiggins, C.D.; Kelber, A.; et al. The biology of color. Science 2017, 357. [Google Scholar] [CrossRef] [Green Version]
  65. Endler, J.A. Frequency-dependent predation, crypsis and aposematic coloration. Phil. Trans. R. Soc. B 1988, 319, 505–523. [Google Scholar] [CrossRef]
  66. Coulson, K.L.; Reynolds, D.W. The spectral reflectance of natural surfaces. J. Appl. Meteorol. 1971, 10, 1285–1295. [Google Scholar] [CrossRef] [Green Version]
  67. Eck, T.F.; Bhartia, P.K.; Hwang, P.H.; Stowe, L.L. Reflectivity of Earth’s surface and clouds in ultraviolet from satellite observations. J. Geophys. Res. Atmos. 1987, 92, 4287–4296. [Google Scholar] [CrossRef]
  68. Bergeron, Z.T.; Fuller, R.C. Using human vision to detect variation in avian coloration: How bad is it? Am. Nat. 2018, 191, 269–276. [Google Scholar] [CrossRef] [PubMed] [Green Version]
  69. Karpestam, E.; Merilaita, S.; Forsman, A. Detection experiments with humans implicate visual predation as a driver of colour polymorphism dynamics in pygmy grasshoppers. BMC Ecol. 2013, 13, 17. [Google Scholar] [CrossRef] [PubMed] [Green Version]
  70. Quinn, G.P.; Keough, M.J. Experimental Design and Data Analysis for Biologists; Cambridge University Press: Cambridge, UK, 2002. [Google Scholar]
  71. R Development Core Team. R: A Language and Environment for Statistical Computing; R Foundation for Statistical Computing: Vienna, Austria, 2015. [Google Scholar]
  72. Belliure, J.; Carrascal, L.M. Influence of heat transmission mode on heating rates and on the selection of patches for heating in a Mediterranean lizard. Physiol. Biochem. Zool. 2002, 75, 369–376. [Google Scholar] [CrossRef] [PubMed]
  73. Díaz, J.A. Temporal patterns of basking behaviour in a Mediterranean lacertid lizard. Behaviour 1991, 118, 1–14. [Google Scholar] [CrossRef]
  74. Díaz, J.A.; Cabezas-Díaz, S. Seasonal variation in the contribution of different behavioural mechanisms to lizard thermoregulation. Funct. Ecol. 2004, 18, 867–875. [Google Scholar] [CrossRef]
  75. Zamora-Camacho, F.J.; Rubiño-Hispán, M.V.; Reguera, S.; Moreno-Rueda, G. Thermal dependence of sprint performance in the lizard Psammodromus algirus along a 2200-meter elevational gradient: Cold-habitat lizards do not perform better at low temperatures. J. Thermal. Biol. 2015, 52, 90–96. [Google Scholar] [CrossRef] [PubMed]
  76. Merilaita, S.; Tuomi, J.; Jormalainen, V. Optimization of cryptic coloration in heterogeneous habitats. Biol. J. Linn. Soc. 1999, 67, 151–161. [Google Scholar] [CrossRef]
  77. Houston, A.I.; Stevens, M.; Cuthill, I.C. Animal camouflage: Compromise or specialize in a 2 patch-type environment? Behav. Ecol. 2007, 18, 769–775. [Google Scholar] [CrossRef] [Green Version]
  78. Nilsson, J.; Ripa, J. The origin of polymorphic crypsis in a heterogeneous environment. Evolution 2010, 64, 1386–1394. [Google Scholar] [CrossRef]
  79. Hughes, A.; Liggins, E.; Stevens, M. Imperfect camouflage: How to hide in a variable world? Proc. R. Soc. B 2019, 286, 20190646. [Google Scholar] [CrossRef] [Green Version]
  80. Kawecki, T.J.; Ebert, D. Conceptual issues in local adaptation. Ecol. Lett. 2004, 7, 1225–1241. [Google Scholar] [CrossRef] [Green Version]
  81. Fox, S.F.; Perea-Fox, S.; Castro Franco, R. Development of the tail autotomy adaptation in lizards under disparate levels of predation at high and low elevations in Mexico. Southwest. Nat. 1994, 39, 311–322. [Google Scholar]
Figure 1. The three-dimensional map displays a representation of Sierra Nevada Mountains, as well as the location of the six sampling plots in this study, located at 300 (1), 700 (2), 1200 (3), 1700 (4), 2200 (5), and 2500 (6) m above sea level. The map on the top left corner shows the position of Sierra Nevada Mountains in the Iberian Peninsula (SE Spain). In the top right corner, a P. algirus lizard is shown.
Diversity 11 00236 g001
Figure 2. The proportion of different environmental elements studied in the photos of sites where lizards were detected for each location along the elevational gradient and all the locations together.
Diversity 11 00236 g002
Figure 3. Means and standard error bars of lightness (a), chroma (b), and hue (c) of bare soil colour along the elevational gradient. Lightness ranges from black (value = 0) to white (value = 100); chroma stands for the colour saturation in percentage; and hue represents the colour in strict sense.
Diversity 11 00236 g003
Figure 4. Correlation between lizard dorsal hue and bare soil hue along the elevational gradient. Mean values and standard error bars for each location (300, 1200, 1700, 2200, and 2500 m asl) are shown for both variables of each correlation (lizards’ dorsal hue: Horizontal whiskers; bare soil hue: Vertical whiskers).
Diversity 11 00236 g004
Figure 5. Means and standard error bars of the difference between the colour of lizards’ dorsum and the colour of the different elements of the environment (ΔE; bare soil (a); rocky substrate (b); fresh grass (c); dry grass (d)), along the elevational gradient. The lower the difference the higher the degree of crypsis.
Diversity 11 00236 g005
Table 1. Results for linear models in which the chromatic components (lightness, chroma, and hue) of the elements of the background (bare soil, rocks, fresh grass, and dry grass) were included as dependent variables, and elevation (six levels corresponding to the six locations along elevation) and month (May, June, and July) as predictive factors. F-values, p-values (between brackets) and degrees of freedom are indicated for each variable. Significant effects after correcting by Bonferroni are in bold.
Predictorsd.f. Lightness
F-Value
(p-Value)
Chroma
F-Value
(p-Value)
Hue
F-Value
(p-Value)
Bare soil
Elevation 5, 888.10 (<0.001)3.01 (0.015)6.82 (<0.001)
Month2, 881.76 (0.18)1.74 (0.18)0.57 (0.57)
Rock
Elevation5, 481.88 (0.11)1.53 (0.20)0.33 (0.89)
Month 2, 480.73 (0.49)1.27 (0.29)0.13 (0.88)
Fresh grass
Elevation 5, 871.26 (0.29)0.68 (0.64)2.46 (0.039)
Month2, 871.20 (0.31)2.68 (0.07)5.54 (0.004)
Dry grass
Elevation 5, 1041.01 (0.41)0.82 (0.54)0.99 (0.42)
Month2, 1040.50 (0.61)3.42 (0.036)0.87 (0.42)
Table 2. Results for linear models in which the chromatic components (lightness, chroma, and hue) of the lizard’s dorsum were included as dependent variables, and elevation, sex, year, and month were included as categorical predictors. F-values, p-values (between brackets) and degrees of freedom are indicated for each variable. Significant effects after correcting by Bonferroni are in bold.
Predictorsd.f.Lightness
F-Value (p-Value)
Chroma
F-Value (p-Value)
Hue
F-Value (p-Value)
Elevation5, 38911.36 (<0.001)18.89 (<0.001)4.90 (<0.001)
Month5, 3892.83 (0.016)4.76 (<0.001)1.43 (0.21)
Year2, 3891.42 (0.24)2.87 (0.06)19.21 (<0.001)
Sex1, 3891.60 (0.21)6.88 (0.009)3.08 (0.08)
Table 3. Coefficients for Spearman correlations (and p-values between brackets) between the chromatic components (lightness, chroma, and hue) of lizards’ dorsal colouration, and colouration of the elements of the background environment (bare soil, rocks, fresh grass, and dry grass). The locations along the elevational gradient (300, 700, 1200, 1700, 2200, and 2500 m asl) were taken as statistical units. That is, correlations were run with the mean values of lightness, chroma, and hue for colouration of both, lizards’ dorsum and the elements of the background at each locality.
BackgroundLizard Dorsum
LightnessChromaHue Angle
Bare soil0.71 (0.11)−0.37 (0.47)0.94 (0.0048)
Rock0.71 (0.11)−0.26 (0.62)−0.17 (0.87)
Fresh grass−0.60 (0.21)−0.77 (0.07)0.77 (0.07)
Dry grass0.26 (0.62)−0.03 (0.96)0.43 (0.40)
Table 4. Results for linear models in which the colour difference between lizards’ dorsal colour and the colour of different elements of the background environment (bare soil, rock, fresh grass, and dry grass) were included as dependent variables, and elevation, month, year, and sex as predictive factors. F-values, p-values (between brackets) and degrees of freedom are indicated for each variable. Significant effects after correcting by Bonferroni are in bold.
Predictorsd.f.Colour Difference with Bare Soil
F-Value (p-Value)
Colour Difference with Rock
F-Value (p-Value)
Colour Difference with Fresh Grass
F-Value (p-Value)
Colour Difference with Dry Grass
F-value (p-value)
Elevation(5, 389)272.13 (<0.001)71.36 (<0.001)32.11 (<0.001)78.78 (<0.001)
Month(5, 389)1.12 (0.35)4.13 (0.001)1.18 (0.32)4.54 (0.0005)
Year(2, 389)2.63 (0.07)4.04 (0.018)1.13 (0.32)2.70 (0.07)
Sex(1, 389)0.29 (0.59)0.18 (0.67)4.05 (0.04)0.11 (0.74)

