Article

Tree Diversity Reduces Fungal Endophyte Richness and Diversity in a Large-Scale Temperate Forest Experiment

1
Department of Biology, New Mexico Highlands University, 1005 Diamond St., Las Vegas, NM 87701, USA
2
Smithsonian Environmental Research Center, 647 Contees Wharf Rd., Edgewater, MD 21037, USA
3
Botany Department, University of Wyoming, 1000 E. University Ave., Laramie, WY 82071, USA
4
Department of Entomology, University of Maryland, College Park, MD 20742, USA
*
Author to whom correspondence should be addressed.
Diversity 2019, 11(12), 234; https://doi.org/10.3390/d11120234
Submission received: 7 October 2019 / Revised: 14 November 2019 / Accepted: 2 December 2019 / Published: 6 December 2019
(This article belongs to the Special Issue Symbioses and the Biodiversity-Ecosystem Function Relationship)

Abstract

:
Although decades of research have typically demonstrated a positive correlation between biodiversity of primary producers and associated trophic levels, the ecological drivers of this association are poorly understood. Recent evidence suggests that the plant microbiome, or the fungi and bacteria found on and inside plant hosts, may be cryptic yet important drivers of important processes, including primary production and trophic interactions. Here, using high-throughput sequencing, we characterized foliar fungal community diversity, composition, and function from 15 broadleaved tree species (N = 545) in a recently established, large-scale temperate tree diversity experiment using over 17,000 seedlings. Specifically, we tested whether increases in tree richness and phylogenetic diversity would increase fungal endophyte diversity (the “Diversity Begets Diversity” hypothesis), as well as alter community composition (the “Tree Diversity–Endophyte Community” hypothesis) and function (the “Tree Diversity–Endophyte Function” hypothesis) at different spatial scales. We demonstrated that increasing tree richness and phylogenetic diversity decreased fungal species and functional guild richness and diversity, including pathogens, saprotrophs, and parasites, within the first three years of a forest diversity experiment. These patterns were consistent at the neighborhood and tree plot scale. Our results suggest that fungal endophytes, unlike other trophic levels (e.g., herbivores as well as epiphytic bacteria), respond negatively to increasing plant diversity.

Graphical Abstract

1. Introduction

Rapid environmental and anthropogenic changes are altering patterns of biodiversity worldwide, degrading ecosystem productivity, function, and services [1,2]. Increased temperatures and human activities over the last century have reduced forest habitats by 50%, which has subsequently diminished plant and animal diversity [3,4,5,6]. Declining biodiversity will likely have important implications for human wellbeing, as decades of research in land and seascapes have demonstrated a positive relationship between biodiversity and critical ecosystem services (e.g., increasing plant productivity, supporting diverse faunal communities, regulating nutrient cycles, and buffering ecosystems against climate change; reviewed by [7,8]).
Despite the primarily positive correlation between biodiversity and ecosystem function (BEF; [7,9,10]), the ecological drivers of this association are poorly understood. Recent evidence suggests that the plant microbiome, or the fungi and bacteria found on and inside plant hosts in both above- and below-ground tissues, may be cryptic yet important drivers of higher-level patterns (e.g., plant productivity, insect communities and damage; pathogen damage; [11,12,13,14,15,16]). For one thing, plant-associated microbes are incredibly abundant and diverse. For example, leaves can host up to 1000,000 microbes/cm2, and microbes can colonize leaves at rates of up to 30,000 propagules per day [17,18,19]. Endophytes, or the microbes that live inside plant tissues, colonize all of the world’s plant species and mediate multiple tree performance metrics – which, in turn, may have implications for BEF [12,13,16,20,21]. For example, Griffin et al. [12,13] demonstrated that applying antibiotics to sapling foliage in situ either decreased or increased seedling growth of multiple tree species by up to 49%. The presence of foliar fungal endophytes, in particular, can reduce plant pathogen damage by up to 80% [22,23]. Thus, the relationship between plant biodiversity and ecosystem function may be driven to some degree by foliar microbes.
Although bacteria and fungi may drive plant performance and regulate the composition of higher trophic levels and their impacts on plant performance, the potential for plant diversity to mediate endophyte diversity has remained largely unexplored. It is possible that plant communities may shape the composition or function of plant microbiomes, which may in turn alter ecosystem functioning such as primary productivity. For example, in a recent tree diversity experiment, Laforest-Lapointe et al. [15] demonstrated that among 19 native species in Canada, tree diversity increased leaf bacterial diversity, which in turn directly increased tree productivity. Moreover, leaf bacterial diversity alone accounted for 12% of the observed variation in tree productivity [15]. Whether similar relationships occur among fungal endophytes, as well as the likely function of particular (bacterial and fungal) community members, was not measured. If, as for foliar bacteria, plant diversity structures fungal endophyte diversity and/or function, then fungal endophytes may be an additional dimension of biodiversity, shaping ecosystem processes.
Currently, the relative contributions of different factors in structuring foliar endophyte communities are poorly understood. On the one hand, taxonomic units such as plant host identity may structure endophyte communities, as it does for many similarly host-dependent relationships. For example, plant identity accounts for as much as 50% of the variation of epiphytic (leaf surface) bacteria [24,25,26], and 69–76% of caterpillars and herbivorous insects associate with only a single host family [27,28]. Further, plant richness, whether at larger (e.g., plot) or smaller (e.g., individual neighbors) scales, may be as important as—if not more important than—host identity in structuring endophytic microbiomes (e.g., [29,30]). The effects of plant richness on fungal endophytes may differ at different spatial scales (e.g., plot vs. neighbor) because endophytes are horizontally transmitted from the environment and may experience dispersal limitation at short distances (e.g., [31,32]; reviewed by [11,33]). In addition to plant host richness, the degree of plant phylogenetic diversity may be an important driver of endophyte communities and function (sensu [34]). For example, Gilbert and Webb [35] demonstrated that foliar fungal pathogens are more likely to infect closely versus distantly related species. If the same is true for many fungal endophyte species associations, it is possible that plant neighborhood phylogenetic diversity, in addition to plant host identity and diversity, may be critical determinants of microbiomes.
Here, we use high-throughput sequencing to determine the degree to which tree richness impacts foliar fungal communities using 545 focal trees in a recently established large-scale tree diversity experiment in Maryland, USA (totaling 17,850 trees). We test the effects of tree richness at plot (35 × 35 m) and neighborhood (six neighbor) scales as well as the phylogenetic diversity of neighboring trees, on fungal richness, diversity, and community structure. Specifically, we focus on tree communities early in the establishment phase, because saplings are particularly vulnerable to pathogens or conversely require microbial mutualists to protect them from pathogens or other enemies [20,33]. In addition, we use the FunGuild database [36] to test whether members of fungal endophyte communities function as mutualists, pathogens, or saprobes. We test the following non-mutually exclusive hypotheses:
The “Diversity Begets Diversity” Hypothesis (H1): Increasing tree richness (plot and neighborhood level) and phylogenetic diversity (plot and neighborhood level) will cause an increase in tree host foliar fungal endophyte diversity and richness. The “Tree Diversity–Endophyte Community” Hypothesis (H2): Tree species richness (plot and neighborhood level) and phylogenetic diversity (plot and neighborhood level) will explain more variation in endophyte community composition than host identity alone. The “Tree Diversity–Endophyte Function” Hypothesis (H3): Increases in tree richness (plot level) will cause an increase in fungal functional guild richness and diversity.

2. Materials and Methods
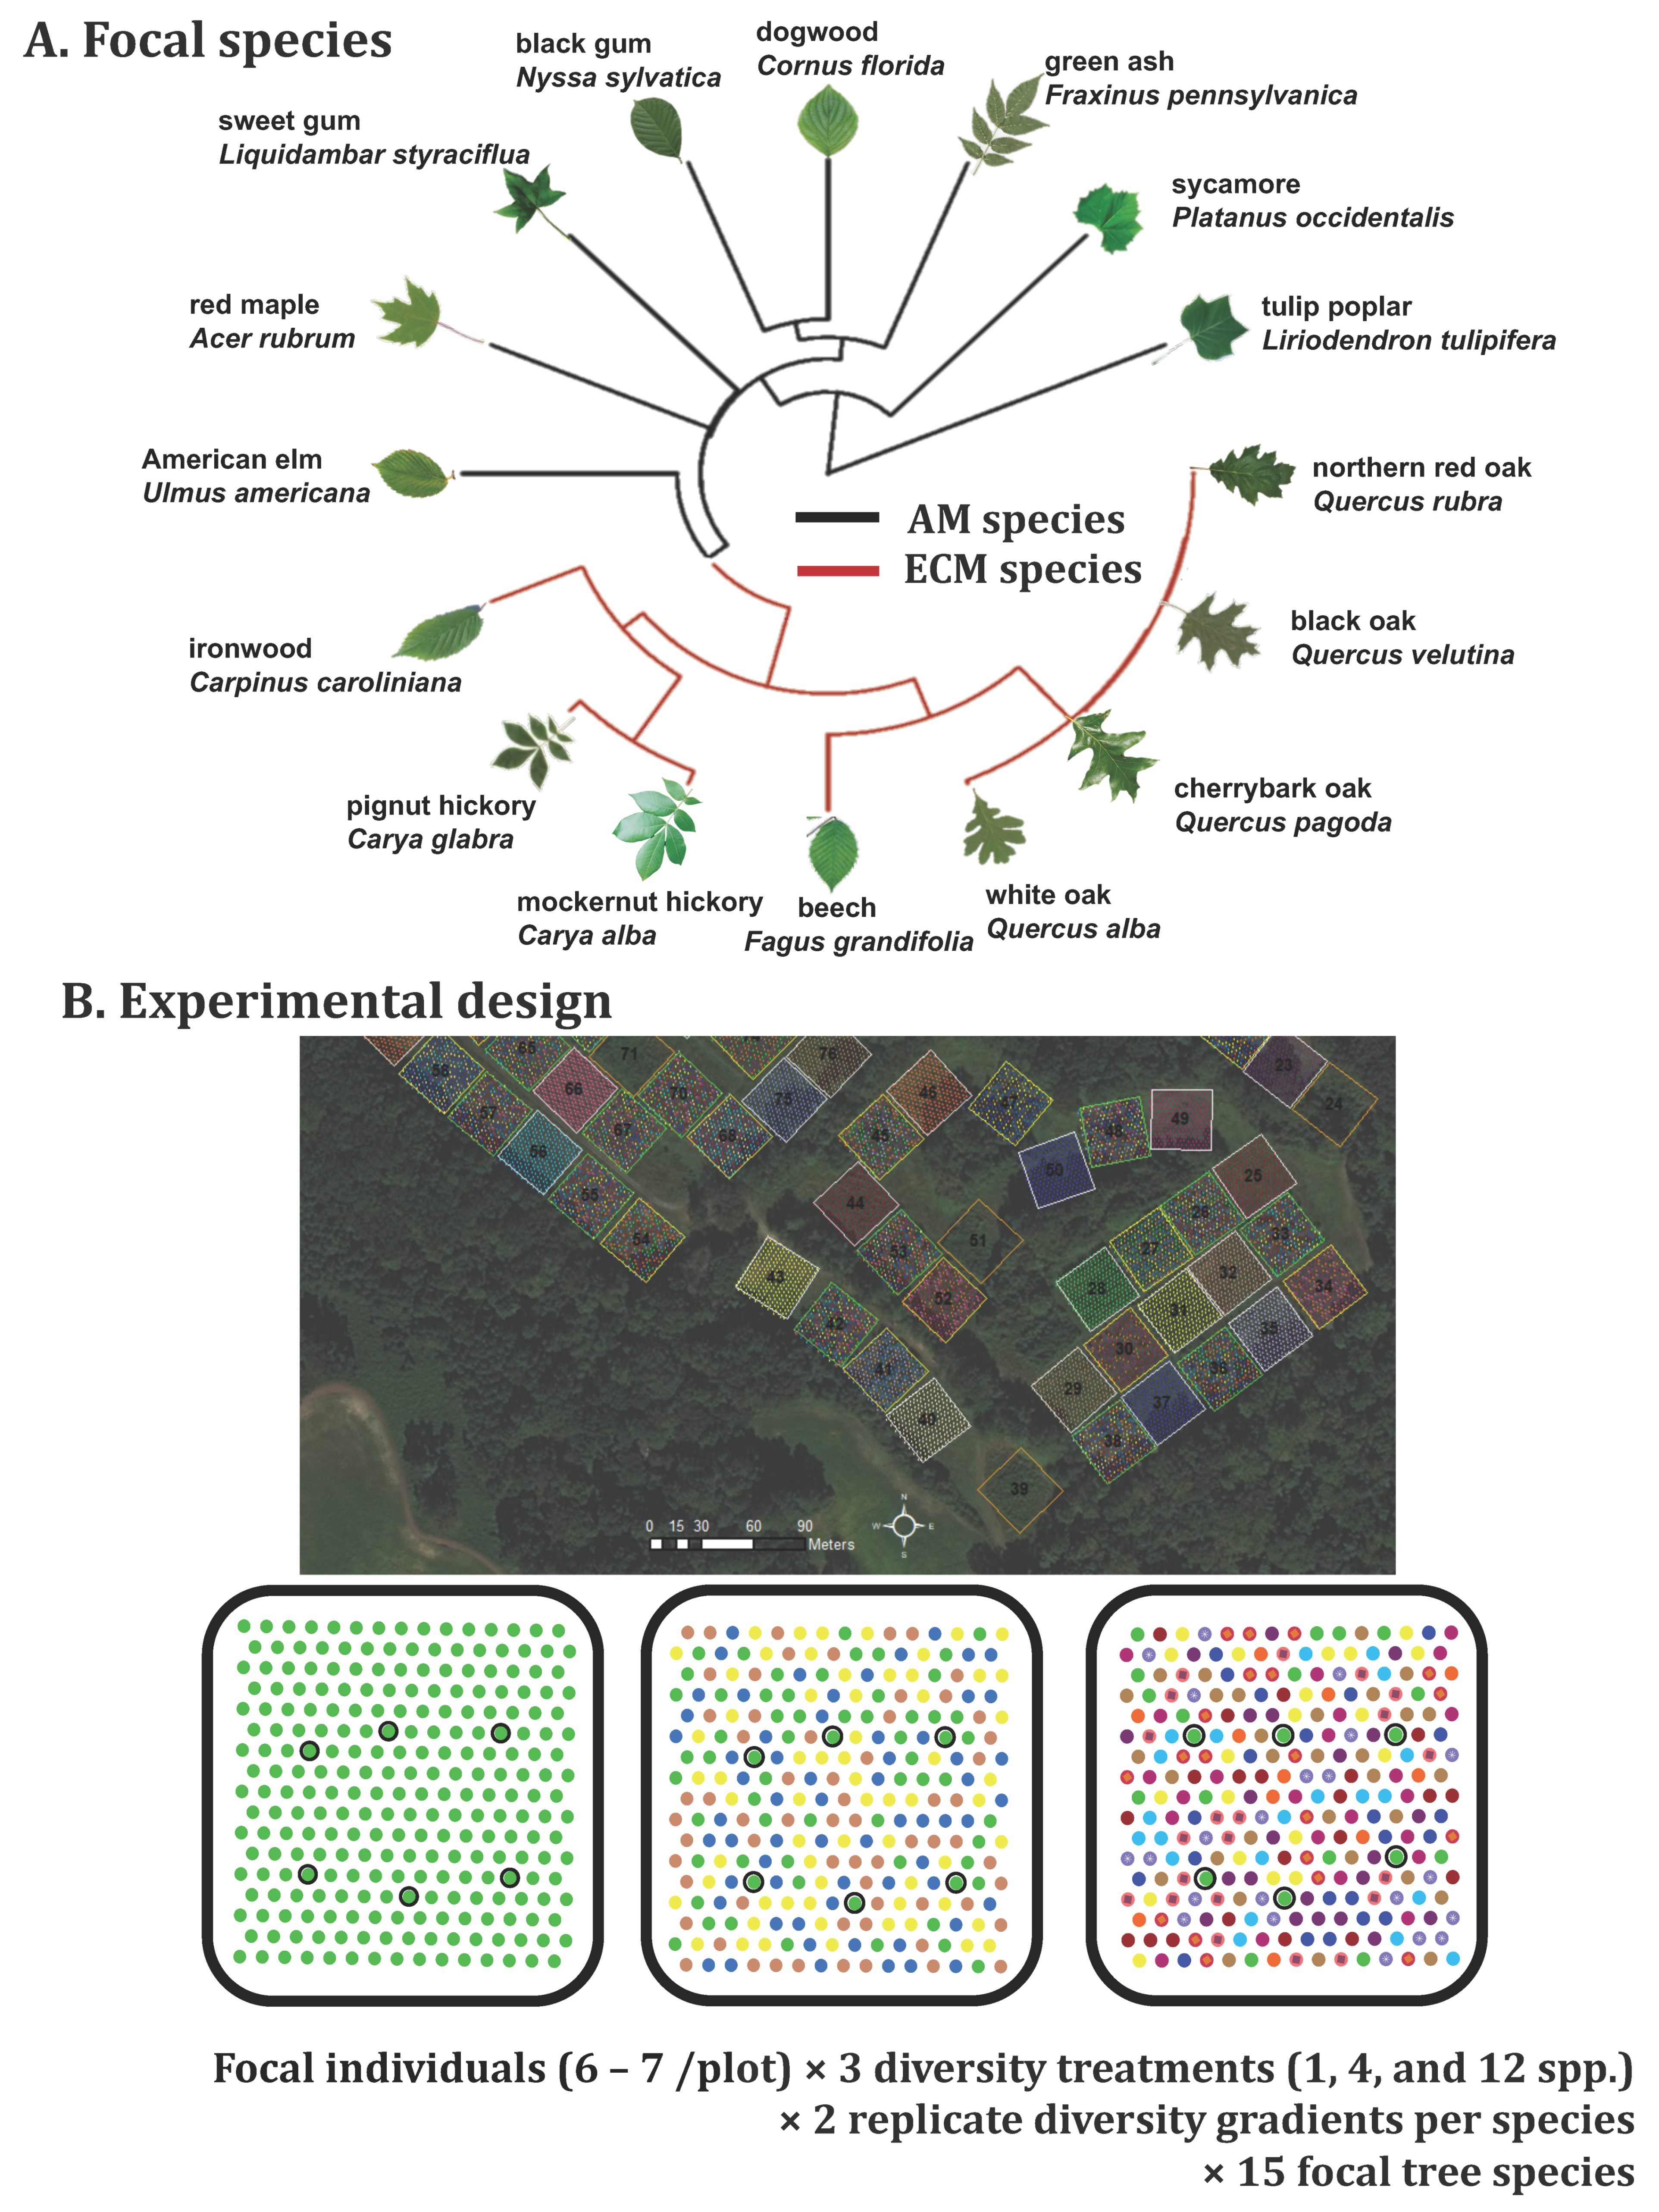
2.1. Site Details

We conducted this study at the BiodiversiTREE experiment in Edgewater, MD, USA (38°52′ N, 76°33′ W, Figure 1). The BiodiversiTREE experiment began in 2013 on 13 ha of abandoned maize cropland as a part of the TreeDivNet network, which spans 26 tree diversity experiments and over 1.1 million trees globally [37,38]. The annual mean temperature at the site is 13.2 °C, and the average annual precipitation is 1068 mm. In the spring of 2013, we planted 17,850 one-year-old seedlings from 16 of the most locally abundant tree species in 35 × 35 m experimental plots (N = 70), with 255 equally spaced trees per plot (see Figure 1 for species list and layout). We selected 16 out of the 20 tree species with the highest basal area in Maryland forests [39,40]; G. Parker, unpublished data). Moreover, data from the surrounding CTFS-ForestGEO plots at the site demonstrate that our species were reflective of the surrounding forest matrix [39]. Eight of these tree species associate with arbuscular mycorrhizal fungi (henceforth AM species, Figure 1), and eight species associate with ectomycorrhizal fungi (henceforth ECM species, Figure 1). While some Quercus spp. can concurrently associate with both ectomycorrhizal (ECM) and arbuscular mycorrhizal (AM) fungi, the function of AM is thought to be insignificant for these hosts (e.g., [41,42]). McCormick characterized AM and ECM communities from the same focal species at the BiodiversiTREE site (McCormick, et al., unpublished data); thus, we can confirm that the trees have already established these mycorrhizal communities.
We obtained seedlings as bare-root whips (mean height of 38 cm) from a commercial nursery and planted them directly into the existing soil without fertilizer or mycorrhizal augmentation. Overall, the entire experimental array has relatively minor slope gradients (mean 4.8° ± 1.93°, full range = 0.03° to 13.25°) and consistent land-use history (continuously planted with corn Zea mays L. for > 35 year), thus providing relatively homogenous environmental conditions across the site.

2.2. Experimental Design

The BiodiversiTREE experiment employs a classic BEF manipulation, whereby we planted tree species into either monoculture plots (N = 2 plots per species), four-species plots (N = 19), or 12-species plots (N = 19). Each monoculture plot received 255 individuals per species; each four-species plot received ~63 individuals per species; the 12-species polycultures received ~21 individuals per species. We generated mixed-species assemblages randomly, but ensured that each species occurred with equivalent frequencies across the entire experiment. We randomly assigned the spatial location of each individual tree in every plot by planting them in an equidistant hexagonal grid with 2.4 m between trees (Figure 1). We distributed diversity treatments randomly across six fields (which were included in all analyses as random effects), with each plot separated by 3–5 m.

2.3. Neighborhood and Plot Phylogenetic Diversity

We calculated phylogenetic diversity of individual tree neighborhoods using the Picante package in R [43], as the standardized effect size of Faith’s Phylogenetic Diversity [44,45]. We defined each neighborhood as the six neighbors surrounding each focal tree (see Figure 1), thus indicating the overall relatedness of the neighborhood assemblage (39). We also repeated the analysis of tree phylogenetic diversity at the plot level. We determined the phylogeny of the tree species in the BiodiversiTREE experiment (Smithsonian Environmental Research Center, Edgewater, MD, USA) by pruning the “zanne2014” angiosperm megatree [46] with Phylocom v. 4.2 [47].

2.4. Sampling Design

We used a targeted focal tree species design using 545 individuals from 15 tree species (we excluded Carya glabra due to sequencing constraints) to partition the effects of tree richness relative to species-specific differences, while controlling for variation in other factors (e.g., distance to nearby forests/fields and within-plot spatial arrangement; Figure 1b). For each species, we paired monoculture plots with a four- and 12-species plot containing the same species, with the distance to the field/forest edges matched accordingly. Six or in some cases seven individuals from each species were sampled within each of the three plots in the same within-plot spatial arrangement (Figure 1b), ensuring that only the tree neighborhood richness differed across the 1–4–12 species gradient. We repeated this structure for all tree species (N = 15 tree species × 2 plot replicates × 3 planting diversities × 6–7 trees per plot), totaling 545 focal trees sampled (Figure 1b). Tree height was measured in 2016 to include in models as a covariate, as plant height is known to be an important factor influencing endophyte communities (e.g., [48]). To account for spatial autocorrelation in analyses, we calculated Moran’s eigenvector maps (MEMs; [49]) using the adespatial R package v. 0.3–7 [50]. MEMs were calculated by extracting eigenvectors from a spatial matrix that maximizes Moran’s I, an index of spatial autocorrelation structures within data. We incorporated the MEMs associated with variation in response variables into linear models as appropriate.

2.5. Sampling Protocol

For each sapling, we took 1.27-cm2 leaf punches from three randomly selected leaves in July 2016, pooled them in a sterile microcentrifuge tube, and returned them to the lab. We immediately sterilized leaf surfaces by using sequential immersion in 95% ethanol (10 s), 10% chlorine bleach (0.525% NaOCl; 2 min), and 70% ethanol (2 min; [12,14]; adapted from [51]). We confirmed surface sterilization by aseptically rolling the leaf surfaces across a standard growth medium (2% MEA) and incubating for seven days [12,13,22,52,53,54]. We then flash-froze the leaf samples with liquid nitrogen, pulverized them with sterile pestles, and stored the remains in DNase-free microcentrifuge tubes. We extracted DNA using a Powersoil DNA Isolation kit (formerly Mo Bio Laboratories, now owned by QIAGEN, Carlsbad, CA, USA), and stored the product in 10:1 Tris/EDTA buffer at −20 °C before library preparation.

2.6. DNA Sequencing and Data Processing

We prepared amplicon libraries by amplifying the fungal ITS2 region, using the ITS86 and ITS4R universal primer pair [55,56]. We used gel electrophoresis to determine no amplification in PCR negative controls and extraction reagent (we also sequenced negative controls). The sequencing facility at the Dalhousie University Integrated Microbiome Resource (IMR) sequenced samples on the Illumina MiSeq platform (2 × 250 bp). Unprocessed sequence data are hosted by the University of Wyoming at https://doi.org/10.15786/za14-6p32.Scripts and processed data are available at: https://bitbucket.org/harrisonjg/griffin_biodiversitree/src/master/.
We processed sequences using USEARCH v 10.0240_i86linux32 [57]. We merged paired-end reads (minimum overlap was 10 bp) and removed primer binding regions from the ends of the merged read. We discarded reads with more than a single expected error [58]. We defined exact sequence variants (ESVs) using the UNOISE3 algorithm [59]. ESVs offer many advantages over the traditional 97% similarity threshold used to assign OTUs, including improved resolution, having a precise biological interpretation (a genotype to a locus), and facilitating information sharing among studies (see [60] for further details). We discarded ESVs that were shorter than 64 bp long, matched PhiX, or that had low complexity. We used the Warcup v. 2 [61] and UNITE v. 7.2 [62] training databases to assign taxonomic hypotheses to ESVs using the SINTAX algorithm [63], and furthermore removed host ESVs from consideration. We sequenced negative controls to identify possible contaminants, and we omitted ESVs if > 1% of their total read count was in a negative control. We rarified data to 15,000 reads per sample using the vegan R package [64].

2.7. Testing the “Diversity Begets Diversity” Hypothesis (H1) and the “Tree Diversity-Endophyte Community” Hypothesis (H2)

To estimate the effects of tree species richness on fungal richness and diversity (H1), we used linear mixed effects models with a random intercept for each unique combination of plot replicate and host taxon. We used plot richness, tree height, mycorrhizal association (ECM or AM), and the top three Moran’s eigenvector maps (MEMs) as covariates within models. Overall, the model was as follows:
Response = plot richness + host tree height + MEM1 + MEM2 + MEM3 + mycorrhizal type + (1|rep:host_taxon).
The reference condition for plot richness was the monoculture treatment. In addition, we calculated linear models to estimate the effects of plot richness on the response variable for each focal tree host, using the same covariates as for the mixed effects models. We did this to extract host species specific effects for plotting purposes. We repeated all models (including those below) with and without outliers; in all cases, results were qualitatively similar to those presented here.
To test for the effects of tree richness and host species on fungal community composition (H2), we conducted permutational multivariate analysis of variance (PERMANOVA) to test whether fungal community composition (Bray‒Curtis dissimilarity) differed with tree richness and species. Specifically, PERMANOVA tests whether the centroids of groups of data are different in multivariate space [65]. Because PERMANOVA tests are sensitive to differences in dispersion about the centroid among sampling groups, we consequently tested for homogeneity of variance among groups using the betaDISPER function in the vegan R package [64]. When testing for the effects of tree richness, we accounted for tree species and plot replicate using the “strata” option in vegan. Conversely, when testing for the effects of tree species identity, we accounted for variation due to tree richness and plot replicate. We generated ordinations of fungal community composition using principle coordinate analysis in vegan.
For all models, we used the exponential of Shannon‒Wiener diversity (1D) to represent diversity as diversity equivalents [66,67]. We used Benjamini‒Hochberg false discovery rate (FDR) p-value corrections to account for multiple comparisons using the multicom R package [68]. We visually assessed residuals from models to ensure minimal departures from normality. When we used Simpson’s effective species number (2D) as the response variable, the model residuals departed from normality; however, linear mixed effects models, because they are extensions of linear models, are quite robust to such violations [69].
We computed separate models for each focal tree that tested the effects of tree neighborhood richness and phylogenetic diversity of six surrounding neighbors on fungal richness and diversity (H1), as well as community composition (H2). Lastly, we computed separate models at the plot level to determine the effects of plot-level tree phylogenetic diversity on fungal richness and diversity.

2.8. Testing the “Tree Diversity-Endophyte Function” Hypothesis (H3)

To determine whether tree richness had differential impacts on certain guilds of fungal endophytes (H3), we assigned exact sequence variants (ESVs) to functional groups using the FunGuild database, which assigns a functional hypothesis to an ESV based on published ecological information of the individual taxon (e.g., [36,70]). We ran similar models as described above for H1 and H2, using fungal guild richness and diversity as the response variables.

3. Results

We generated 30,656,584 sequences; 20,735,591 passed quality filtering, which we clustered into 3862 ESVs. The most abundant fungal phyla in order were Ascomycota (82.2%) and Basidiomycota (17.3%), followed by Chytridiomycota (<1%) and Zygomycota (<1%). Seventeen of the 20 most represented ESVs were in Ascomycota, while the remaining three were in Basidiomycota. The most abundant classes among all samples included Dothideomycetes (44.9%), Sordariomycetes (16.2%), Leotimycetes (11.0%), Agaricomycetes (4.6%), and Tremellomycetes (2.2%), all of which are in Ascomycota except Tremellomycetes (Basidiomycota).
For all fungal species accumulation curves, many samples appear to be somewhat close to approaching an asymptote, suggesting that our sequencing depth is relatively close to encompassing a large extent of endophyte ESV richness in communities among diversity treatments (Figure S1). Few samples, however, were fully asymptotic, which is typical of sequence-dependent characterizations of microbial communities (e.g., [71,72,73,74]).

3.1. The “Diversity Begets Diversity” Hypothesis (H1): Increases in Plot Richness as Well as Neighborhood Richness and Phylogenetic Diversity Decreased Fungal Richness and Diversity

3.1.1. Fungal Richness

Overall, fungal richness decreased as plot richness increased (Table 1, Figure 2, p < 0.01). Specifically, fungal richness decreased by 5% from one-species to four-species plots, and by 10% from one-species plots to 12-species plots.

3.1.2. Shannon’s Fungal Diversity

Shannon’s diversity equivalents decreased as plot richness increased (Table 1, Figure 2, p < 0.01). Specifically, Shannon’s diversity decreased by 6% from one-species plots to four-species plots, and by 8% from one-species plots to 12-species plots.

3.1.3. Simpson’s Fungal Effective Species Number

Conversely, from one- to four-species plots, fungal Simpson’s effective species number increased by 4%; however, from one- to 12-species plots, Simpson’s effective species number did not change (Table 1, Figure 2, 1–4 sp.: p < 0.05; 1–12 sp.: p > 0.10).
In our models, we found that endophyte richness and diversity were higher in ECM-associated tree species compared to AM-associated species (Table 1, Figure S2, p < 0.05). On average, ECM tree species hosted almost 30 more ESVs compared to AM species, and Shannon’s diversity equivalents were on average 55% higher for ECM species compared to AM trees (Table 1, Figure S2).

3.1.4. Tree Neighborhood Richness and Neighborhood and Plot Phylogenetic Diversity

Overall, fungal richness and Shannon’s diversity decreased as tree neighborhood phylogenetic diversity of six neighboring trees increased (Table 2, richness: p < 0.01, diversity: p < 0.01; Figure S3). Similarly, fungal richness and Shannon’s diversity decreased as tree richness of six neighboring trees increased (Table S1; richness: p < 0.01, diversity: p < 0.01). Moreover, fungal richness (but not Shannon’s diversity) decreased as plot phylogenetic diversity increased (Table 2, richness: p < 0.05; Figure S4).

3.2. The “Tree Diversity–Endophyte Community” Hypothesis (H2): Host Tree Identity and Diversity Explained Little Variation in Fungal Community Structure

PERMANOVA models demonstrated that endophyte community composition did not vary significantly among tree species, but did explain ~9% of the overall variation in endophyte communities (Figure S5). By comparison, plot richness was a significant predictor of variation in community composition, but explained little variation overall (<1%) (Figure S5, p = 0.04). In addition, changes in tree neighborhood and plot phylogenetic diversity only accounted for <1% of variation in fungal endophyte community composition, as determined through redundancy analysis.

3.3. The “Tree Diversity‒Endophyte Function” Hypothesis (H3): Increases in Plot Richness Decreased Fungal Guild Richness and Diversity

We identified 42% (1,179) of our ESVs as saprotrophs, 40% (1123) as pathogens, 18% (505) as symbionts, 7% (197) as parasites, and 6% (168) as lichens. We classified 555 ESVs—20% of all ESVs—into more than one guild (note: this is why the percentages do not add up to 100%; see supplementary spreadsheet “Griffin et al. FunGuild results”). The confidence rank assigned to functional guild placements of 2003 ESVs (71%) was “probable,” 493 ESVs were “possible,” and 310 were “highly probable” (see supplementary spreadsheet “Griffin et al. FunGuild results”). The guilds of 1056 ESVs (27.3%) were unidentifiable.
Overall, increases in tree richness decreased ESV richness within all guilds as well as guild diversity for three guilds. Specifically, ESV richness within all guilds (not including unidentified ESVs) decreased by 8–11% from one- to 12-species plots (Table 3, Figure 3). Moreover, overall guild diversity decreased by 5% from one- to 12-species plots (t = −2.16, p < 0.05). Pathogen, saprotroph, and parasite diversity decreased by 5–6% from one- to 12-species plots (Table 4, Figure S6; pathogens: p < 0.05; saprotrophs and parasites: p < 0.01).

4. Discussion

Counter to our hypotheses, we found strong evidence that increasing tree richness and phylogenetic diversity decreased fungal species and functional guild richness and diversity within the first three years of a tree diversity experiment (H1, H2, and H3). These findings differ from studies demonstrating that increases in plant diversity typically increase the diversity of associated trophic levels, including foliar bacterial communities [8,15]. Not only did we expect a positive relationship between tree richness and fungal richness and diversity, we expected that changes in tree neighborhood richness and phylogenetic diversity would strongly structure endophyte community composition (H2); however, this did not occur. In addition, increasing tree richness caused a decrease in guild richness for all five functional guilds and a decrease in diversity for three guilds (the “Tree Diversity–Endophyte Function” hypothesis), suggesting that endophytes may mediate the relationship between tree richness and metrics of ecosystem function (i.e., richness and diversity of pathogens, parasites, and saprotrophs). Overall, our results are somewhat surprising, particularly given that many empirical studies in plant communities fail to detect the effects of plant diversity on ecosystem services in early stages after establishment (e.g., [75,76,77], reviewed by [78]). We discuss our results in detail below.

4.1. Counter to Traditional BEF Theory, Tree Richness and Phylogenetic Diversity Decreased Endophyte Diversity

We expected that increases in tree richness would cause an increase in fungal endophyte diversity, but we in fact found the opposite pattern. Indeed, numerous studies have demonstrated that increases in plant richness increase the diversity of other trophic levels, including herbivores and epiphytic bacteria [15,79,80,81,82]. These patterns are thought to be driven by host specialization, whereby increases in plant richness attract more diverse associate communities (e.g., the “Resource Specialization Hypothesis”; [83,84]). Endophytes, however, especially for smaller seedlings and saplings, may have stronger dispersal limitation compared to plant-associated microbes on larger adult hosts [48,85,86]). For example, Seabloom, et al. (2019; [48]) demonstrated that increases in grassland biomass among four sites in North America consistently decreased fungal endophyte diversity. They suggested that increases in plant biomass led to higher dispersal rates of competitively dominant fungi, thus decreasing overall fungal diversity. Similarly, increases in tree richness in our experiment may have decreased fungal diversity by increasing the dispersal potential of competitive generalist fungi.
Alternatively, increases in tree richness may result in fewer encounters with suitable hosts for specialist fungi. This idea is consistent with island biogeography theory, whereby more diverse stands represent archipelagos of smaller islands of suitable hosts for specialist endophytes (sensu [87]). In fact, many studies have demonstrated that pathogenic fungi are less likely to disperse to distant neighbors, particularly in less dense stands (e.g., [88,89,90,91]). In our experiment, monoculture plots contained 255 conspecific trees, whereas 12-species plots only had 21 conspecific trees. Therefore, in monoculture plots, the distance between suitable islands (i.e., among tree hosts) is lower compared to in 12-species plots. For this reason, increases in tree richness may have resulted in less rich and less diverse endophyte communities.
Conversely, fungal endophytes may not be specialized enough for their richness and diversity to increase as tree richness increases. The “Resource Specialization Hypothesis” is predicated on the assumption that faunal communities exhibit a high degree of host specificity (sensu [83]). However, studies have consistently demonstrated that increases in tree richness cause increases in herbivore and bacterial epiphytic communities [15,79], which are typically highly specialized on plant hosts (e.g., [25,26,92,93,94]). Specifically, over 90% of herbivores exhibit some degree of host preference [84,93,94]), and host identity explains as much as half of bacterial and fungal epiphytic community composition [24,25,26]. Comparatively, our findings, taken with other studies of fungal and bacterial endophytes, demonstrate that host species accounts for as little as 5–9% of the variation of endophyte community composition [14,95,96,97]. If endophytes were more specialized, monoculture plots would be filled with dominant specialists, as predicted by our dispersal argument. This would lead to an increase in endophyte diversity with tree diversity because tree hosts would primarily host more evenly distributed generalist endophyte taxa.
It is possible that the effects of plant diversity on fungal communities may be caused by indirect trophic cascades rather than dispersal limitations of specialists. For instance, tree diversity may structure below-ground microbiomes or induce changes to leaf chemistry, which can mediate endophyte communities. For example, it has been well documented that soil microbes can trigger systemic chemical responses in plants that increase above-ground growth and host resistance to insects and other enemies ([98,99,100]; reviewed by [101,102]). In one study, Badri et al. [98] demonstrated that soil microbial communities collected from 11 different sites globally and inoculated into Arabidopsis thaliana roots differentially regulated leaf chemistry (metabolomic) profiles and insect feeding behavior. Specifically, soil microbiome inoculations altered the production of phenolics and sugars, which are important drivers of foliar microbial communities (e.g., [103,104,105,106]). Thus, variations in soil microbial diversity may affect leaf tissue quality (e.g., phenolic content, biomass accumulation, defensive metabolites; [107,108]), which may then directly regulate leaf microbiomes. Ultimately, we suggest that future studies should consider both below-ground and above-ground processes, as well as the leaf metabolome, to fully understand the community-level effects of plant diversity.
We were surprised that the effects of tree richness caused differences in Shannon’s diversity equivalents and Simpson’s effective species number. Overall, Shannon’s equally emphasizes the richness and evenness components of diversity, while Simpson’s emphasizes the evenness component, which causes Shannon’s to put more weight on rare species and Simpson’s to emphasize dominant species [66,67,109,110]. Thus, our results suggest that the most abundant fungal taxa are not responding to neighborhood diversity as much as the rarer fungal taxa. Indeed, the top 20 most abundant ESVs in our study remained relatively constant despite changes in tree richness, while all other ESVs (not top 20) decreased by 3–6% on average as tree richness increased. This suggests that differences in tree communities disproportionately impact rare common species, which suggests that a “core microbiome” may exist among coexisting tree species, independent of tree neighborhoods.
Because plant phylogeny was confounded with the mycorrhizal association (AM vs. ECM) covariate in our analyses, mycorrhizal association in addition to plant taxonomy may be important in structuring above-ground endophyte communities. Indeed, we found that endophyte richness and diversity were higher in ECM-associated tree species compared to AM-associated species (Figure S2). Specifically, the type of mycorrhizal association (e.g., ectomycorrhizal versus arbuscular) may directly or indirectly influence foliar fungal endophytes, particularly by differentially influencing nitrogen and phosphorus cycling ([111,112]; reviewed by [113]). As foliar nitrogen and phosphorus concentrations structure microbial communities (e.g., [25,114]), it is possible that host mycorrhizal association type (i.e., ECM vs. AM) may be more important in shaping leaf microbiomes than either host taxonomy or diversity (at plot or neighborhood scales). Therefore, future studies are needed to explicitly test whether mycorrhizal association, rather than host phylogeny, is important in structuring foliar endophytes.
We recognize that the surrounding forest matrix may be a source of fungal inoculum, though we do not believe that there is a disproportionate number of AM vs. ECM mycorrhizal propagules coming from the forest surrounding the site. Indeed, fungal endophytes are largely horizontally transmitted from the surrounding environment [11,16,20] and may even be dispersed via leaf litter [23,115]. Extensive surveying in the surrounding forest (a CTFS-ForestGEO plot is located within three miles of the site; [116,117]) has shown that local forests are comprised of tulip poplar (Liriodendron tulipifera; AM species) in the overstory, as well as several oaks (Quercus spp.; ECM), beech (Fagus grandifolia; ECM) and hickories (Carya spp.; ECM). Red maple (Acer rubrum; AM) and blackgum (Nyssa sylvatica; AM) make up mid-canopies [117]. Thus, because there is a mix of both AM- and ECM-associated trees in the surrounding forest, we are confident that there is no bias in potential AM or ECM propagules from surrounding areas reflected in our results.

4.2. Host Tree Richness Mediated the Function of Fungal Endophytes

In addition to fungal richness and diversity, we also found that increases in tree richness decreased fungal functional guild diversity. Specifically, the richness of every functional guild decreased with increasing tree richness, and the diversity of pathogens and saprotrophs decreased with increasing tree richness. We acknowledge that FunGuild results are tentative, particularly given that the database is biased towards soil fungi and pathogens and the impacts of particular fungal taxa may differ among different plants hosts and environmental conditions [36]. Additionally, such classifications may be biased towards pathogens because of a disproportionately high interest in pathogens. Therefore, it is possible that even a larger proportion of foliar endophytes function as saprotrophs than we report here. Overall, however, our results are consistent among all of the metrics tested and the message is clear: increases in tree richness and phylogenetic diversity decrease species and functional richness and diversity of fungal endophytes. We identified almost half (~40%) of the ESVs as putative pathogens. Latz et al. [118] found that greater plant richness indirectly decreased the incidence of soil pathogens through changes in soil bacteria that were antagonistic to pathogens. Thus, it is possible that tree communities cultivate or recruit beneficial bacterial communities to competitively exclude fungal endophytes or produce antimicrobial compounds to ward off fungi (reviewed by [20,33]).

5. Conclusions

Here, we highlight the importance of plant diversity and its interaction with the plant microbiome and ultimately explore how these interactions may impact plant performance early in forest stand development. Numerous studies have demonstrated that the tree microbiome among forest seedlings establishes early and has significant impacts on plant hosts, potentially determining relative competitive abilities and ultimately shaping plant phenotype and community interactions (e.g., [12,13,14,22,23]). We expand upon these findings to demonstrate that tree community diversity (species and phylogenetic) is critical in driving endophyte community and functional diversity. Specifically, we found that tree neighborhood richness and phylogenetic diversity regulated fungal endophyte assemblages within the first three years of establishment. Future studies should test whether the magnitude of the effects of plant diversity strengthens over time, a trend that is common among plant diversity experiments [76,119,120].

Supplementary Materials

The following are available online at https://www.mdpi.com/1424-2818/11/12/234/s1, Table S1: Effects of tree richness of six neighboring trees and covariates on fungal endophyte diversity and richness; Table S2: The effects of tree (plot) richness on fungal endophyte richness among 15 tree species (N = 545 focal trees); Table S3: The effects of tree taxonomic (plot) richness on fungal endophyte Shannon’s diversity equivalents among 15 tree species (N = 545 focal trees); Table S4: The effects of tree taxonomic (plot) richness on fungal endophyte Simpson’s effective species number among 15 tree species (N = 545 focal trees); Figure S1: Rarefaction curves for A. all samples, B. 1 sp., C. 4 spp., and D. 12 spp. plot samples compiled together among all host species; Figure S2: The effects of mycorrhizal association (AM vs. ECM) on A. fungal endophyte richness (0D), B. Shannon’s diversity equivalents (1D), and C. Simpson’s effective species number (2D) among 15 focal tree species (N = 545 focal trees); Figure S3: Partial regression plots from a mixed effects model examining the effects of tree neighborhood phylogenetic diversity on fungal endophyte A. richness and B. Shannon’s diversity equivalents; Figure S4: Partial regression plots from a mixed effects model examining the effects of plot-level tree phylogenetic diversity on fungal endophyte A. richness and B. Shannon’s diversity equivalents; Figure S5: The effects of A. tree richness and B. 15 focal tree species on fungal endophyte community composition (N = 545 focal trees); Figure S6: The effects of tree richness on fungal ESV diversity (Shannon’s diversity equivalents) of the most common functional guilds among 15 focal tree species (N = 545 focal trees). Griffin, et al. FunGuild results. Spreadsheet detailing the functionality of ESVs in study.

Author Contributions

Conceptualization, E.A.G., J.D.P., K.T.B., and M.K.M.; Methodology, E.A.G., J.D.P., J.G.H., K.T.B., and M.K.M.; Software, J.G.H.; Validation, J.G.H.; Formal Analysis, E.A.G. and J.G.H.; Investigation, E.A.G., J.D.P., and M.K.M.; Resources, E.A.G., J.D.P., J.G.H., M.K.M.; Data Curation, J.G.H.; Writing—Original Draft Preparation, E.A.G.; Writing—Review & Editing, E.A.G., J.D.P., J.G.H., K.T.B. and M.K.M.; Visualization, J.G.H.; Supervision, J.D.P. and M.K.M.; Project Administration, J.D.P.; Funding Acquisition, E.A.G., J.D.P., J.G.H., and K.T.B.

Funding

This research was funded by the Smithsonian Environmental Research Center: Postdoc Research Fellowship (E.A.G.); Smithsonian Institution: Secretary’s Distinguished Research Fellowship (E.A.G.); Maryland Native Plant Society: Research Grant (E.A.G.); National Science Foundation EPSCoR grant: 1655726 (J.G.H.); Washington Biologists Field Club: Research Award (E.A.G.); Smithsonian Institution: Grand Challenges Grant (J.D.P.); Smithson Fellowship Program: Sandra Day O’Conner Fellowship (K.T.B.); National Science Foundation: REU – 1156799, 1659668 (J.D.P.).

Acknowledgments

We are grateful to Kim Komatsu, Ben Taylor, and the four anonymous reviewers for thoughtful comments. We thank Jamie Pullen in particular, as well as Monica Knaack and Tatiana Eaves, for help in the field and with figures, as well as Dalhousie University Integrated Microbiome Resource Center and Katrina Lohan for help with sequencing and data processing. We acknowledge financial support from a Smithsonian Environmental Research Center Postdoc Fellowship (E.A.G.), a Smithsonian Secretary’s Distinguished Research Fellowship (E.A.G.), two Maryland Native Plant Society Grants (E.A.G.), a National Science Foundation EPSCoR grant (DBO-1655726; J.G.H.), a Washington Biologists Field Club Grant (E.A.G.), a generous donation from John and Anne Ryan, Smithsonian Institution Grand Challenges (J.D.P.), a Justice Sandra Day O’Connor Fellowship through the James Smithson Fellowship Program (K.T.B.), and an NSF REU (DBI-1156799, DBI-1659668).

Conflicts of Interest

The authors declare no conflicts of interest.

References

  1. Ellis, E.C. Anthropogenic transformation of the terrestrial biosphere. Philos. Trans. R. Soc. A 2011, 369, 1010–1035. [Google Scholar] [CrossRef] [PubMed]
  2. Estes, J.A.; Terborgh, J.; Brashares, J.S.; Power, M.E.; Berger, J.; Bond, W.J.; Carpenter, S.R.; Essington, T.E.; Holt, R.D.; Jackson, J.B.; et al. Trophic downgrading of planet Earth. Science 2011, 333, 301–306. [Google Scholar] [CrossRef] [PubMed] [Green Version]
  3. Achard, F.; Eva, H.D.; Stibig, H.J.; Mayaux, P.; Gallego, J.; Richards, T.; Malingreau, J.P. Determination of deforestation rates of the world’s humid tropical forests. Science 2002, 297, 999–1002. [Google Scholar] [CrossRef] [PubMed] [Green Version]
  4. Wright, S.J. Tropical forests in a changing environment. Trends Ecol. Evol. 2005, 20, 553–560. [Google Scholar] [CrossRef] [PubMed]
  5. Gerstner, K.; Dormann, C.F.; Stein, A.; Manceur, A.M.; Seppelt, R. Effects of land use on plant diversity—A global meta-analysis. J. Appl. Ecol. 2014, 51, 1690–1700. [Google Scholar] [CrossRef]
  6. Decaens, T.; Martins, M.B.; Feijoo, A.; Oszwald, J.; Doledec, S.; Mathieu, J.; Arnaud de Sarte, X.; Bonilla, D.; Brown, G.G.; Cuellar Criollo, Y.A.; et al. Biodiversity loss along a gradient of deforestation in Amazonian agricultural landscapes. Conserv. Biol. 2018, 32, 1380–1391. [Google Scholar] [CrossRef] [PubMed] [Green Version]
  7. Tilman, D.; Isbell, F.; Cowles, J.M. Biodiversity and ecosystem functioning. Annu. Rev. Ecol. Evol. Syst. 2014, 45, 471–493. [Google Scholar] [CrossRef]
  8. Mori, A.S.; Lertzman, K.P.; Gustafsson, L. Biodiversity and ecosystem services in forest ecosystems: A research agenda for applied forest research. J. Appl. Ecol. 2017, 54, 12–27. [Google Scholar] [CrossRef]
  9. Cardinale, B.J.; Matulich, K.L.; Hooper, D.U.; Byrnes, J.E.; Duffy, E.; Gamfeldt, L.; Balvanera, P.; O’Connor, M.I.; Gonzalez, A. The functional role of producer diversity in ecosystems. Am. J. Bot. 2011, 98, 572–592. [Google Scholar] [CrossRef] [Green Version]
  10. Hooper, D.U.; Chapin, F.S.; Ewel, J.J.; Hector, A.; Inchausti, P.; Lavorel, S.; Lawton, J.H.; Lodge, D.M.; Loreau, M.; Naeem, S.; et al. Effects of biodiversity on ecosystem functioning: A consensus of current knowledge. Ecol. Monogr. 2005, 75, 3–35. [Google Scholar] [CrossRef]
  11. Rodriguez, R.J.; White, J.F.; Arnold, A.E.; Redman, R.S. Fungal endophytes: Diversity and functional roles. New Phytol. 2009, 182, 314–330. [Google Scholar] [CrossRef] [PubMed]
  12. Griffin, E.A.; Traw, M.B.; Morin, P.J.; Pruitt, J.N.; Wright, S.J.; Carson, W.P. Soil fertility mediates sapling responses to foliar bacteria in a tropical forest: Experimental evidence and ecological implications. Ecology 2016, 97, 2998–3008. [Google Scholar] [CrossRef] [PubMed]
  13. Griffin, E.A.; Wright, S.J.; Morin, P.J.; Carson, W.P. Pervasive interactions between foliar microbes and soil nutrients mediate leaf production and herbivore damage in a tropical forest. New Phytol. 2017, 216, 99–112. [Google Scholar] [CrossRef] [PubMed] [Green Version]
  14. Griffin, E.A.; Harrison, J.G.; Kembel, S.W.; Carrell, A.A.; Wright, S.J.; Carson, W.P. Plant host identity and soil macronutrients explain little variation in sapling endophyte community composition: Is disturbance an alternative explanation? J. Ecol. 2019, 107, 1876–1889. [Google Scholar] [CrossRef]
  15. Laforest-Lapointe, I.; Paquette, A.; Messier, C.; Kembel, S.W. Leaf bacterial diversity mediates plant diversity and ecosystem function relationships. Nature 2017, 546, 145–147. [Google Scholar] [CrossRef]
  16. Hardoim, P.R.; van Overbeek, L.S.; Berg, G.; Pirtilla, A.M.; Compant, S.; Campisano, A.; Doring, M.; Sessitsch, A. The hidden world within plants: Ecological and evolutionary considerations for defining functioning of microbial endophytes. Microbiol. Mol. Biol. Rev. 2015, 79, 293–320. [Google Scholar] [CrossRef] [Green Version]
  17. Arnold, A.E.; Herre, A.H. Canopy cover and leaf age affect colonization by tropical fungal endophytes: Ecological pattern and process in Theobroma cacao (Malvaceae). Mycologia 2003, 95, 388–398. [Google Scholar] [CrossRef]
  18. Lindow, S.E.; Brandl, M.T. Microbiology of the phyllosphere. Appl. Environ. Microbiol. 2003, 69, 1875–1883. [Google Scholar] [CrossRef] [Green Version]
  19. Gilbert, G.S.; Reynolds, D.R. Nocturnal fungi: Airborne spores in the canopy and understory of a tropical rain forest. Biotropica 2005, 37, 462–464. [Google Scholar] [CrossRef]
  20. Griffin, E.A.; Carson, W.P. Tropical tree endophytes: Cryptic drivers of forest diversity, species composition, and ecosystem function. In Endophytes of Forest Trees: Biology and Applications, 2nd ed.; Pirttila, A.M., Frank, A.C., Eds.; Springer: Dordrecht, The Netherlands, 2018; pp. 63–103. [Google Scholar]
  21. Christian, N.; Herre, E.A.; Clay, K. Foliar endophytic fungi alter patterns of nitrogen uptake and distribution in Theobroma cacao. New Phytol. 2019, 222, 1573–1583. [Google Scholar] [CrossRef]
  22. Arnold, A.E.; Mejia, L.C.; Kyllo, D.; Rojas, E.I.; Maynard, Z.; Robbins, N.; Herre, E.A. Fungal endophytes limit pathogen damage in a tropical tree. Proc. Natl. Acad. Sci. USA 2003, 100, 15649–15654. [Google Scholar] [CrossRef] [Green Version]
  23. Christian, N.; Herre, E.A.; Mejia, L.C.; Clay, K. Exposure to the leaf litter microbiome of healthy adults protects seedlings from pathogen damage. Proc. Natl. Acad. Sci. USA 2017, 284, 20170641. [Google Scholar] [CrossRef] [PubMed]
  24. Redford, A.J.; Bowers, R.M.; Knight, R.; Linhart, Y.; Fierer, N. The ecology of the phyllosphere: Geographic and phylogenetic variability in the distribution of bacteria on tree leaves. Environ. Microbiol. 2010, 12, 2885–2893. [Google Scholar] [CrossRef] [PubMed] [Green Version]
  25. Kembel, S.W.; O’Connor, T.K.; Arnold, H.K.; Hubbell, S.P.; Wright, S.J.; Green, J.L. Relationships between phyllosphere bacterial communities and plant functional traits in a neotropical forest. Proc. Natl. Acad. Sci. USA 2014, 111, 13715–13720. [Google Scholar] [CrossRef] [PubMed] [Green Version]
  26. Laforest-Lapointe, I.; Messier, C.; Kembel, S.W. Temperate tree phyllosphere bacterial community composition. Microbiome 2016, 4, 27. [Google Scholar] [CrossRef] [Green Version]
  27. Dyer, L.A.; Singer, M.S.; Lill, J.T.; Stireman, J.O.; Gentry, G.L.; Marquis, R.J.; Ricklefs, R.E.; Greeney, H.F.; Wagner, D.L.; Morais, H.C.; et al. Host specificity of Lepidoptera in tropical and temperate forests. Nature 2007, 448, 696–699. [Google Scholar] [CrossRef]
  28. Forister, M.L.; Novotny, V.; Panorska, A.K.; Baje, L.; Basset, Y.; Butterill, P.T.; Cizek, L.; Coley, P.D.; Dem, F.; Diniz, I.R.; et al. The global distribution of diet breadth in insect herbivores. Proc. Natl. Acad. Sci. USA 2015, 112, 442–447. [Google Scholar] [CrossRef] [Green Version]
  29. Hausmann, N.T.; Hawkes, C.V. Plant neighborhood control of arbuscular mycorrhizal community composition. New Phytol. 2009, 183, 1188–1200. [Google Scholar] [CrossRef]
  30. Liu, Y.; Shi, G.; Mao, L.; Cheng, G.; Jiang, S.; Ma, X.; An, L.; Du, G.; Collins Johnson, N.; Feng, H. Direct and indirect influences of 8 yr of nitrogen and phosphorus fertilization on Glomeromycota in an alpine meadow ecosystem. New Phytol. 2012, 194, 523–535. [Google Scholar] [CrossRef]
  31. Peay, K.G.; Bidartondo, M.I.; Arnold, E.A. Not every fungus is everywhere: Scaling to the biogeography of fungal-plant interactions across roots, shoots, and ecosystems. New Phytol. 2010, 185, 878–882. [Google Scholar] [CrossRef]
  32. Adams, R.I.; Miletto, M.; Taylor, J.W.; Bruns, T.D. Dispersal in microbes: Fungi in indoor air are dominated by outdoor air and show dispersal limitation at short distances. ISME J. 2013, 7, 1262–1273. [Google Scholar] [CrossRef] [PubMed] [Green Version]
  33. Griffin, E.A.; Carson, W.P. The ecology and natural history of foliar bacteria with a focus on tropical forests and agroecosystems. Bot. Rev. 2015, 81, 105–149. [Google Scholar] [CrossRef]
  34. Srivastava, D.S.; Cadotte, M.W.; MacDonald, A.A.M.; Marushia, R.G.; Mirotchnick, N. Phylogenetic diversity and the functioning of ecosystems. Ecol. Lett. 2012, 15, 637–648. [Google Scholar] [CrossRef] [PubMed]
  35. Gilbert, G.S.; Webb, C.O. Phylogenetic signal in plant pathogen-host range. Proc. Natl. Acad. Sci. USA 2007, 104, 4979–4983. [Google Scholar] [CrossRef] [PubMed] [Green Version]
  36. Nguyen, N.H.; Song, Z.; Bates, S.T.; Branco, S.; Tedersoo, L.; Menke, J.; Schilling, J.S.; Kennedy, P.G. FUNGuild: An open annotation tool for parsing fungal community datasets by ecological guild. Fungal Ecol. 2016, 20, 241–248. [Google Scholar] [CrossRef]
  37. Grossman, J.J.; Vanhellemont, M.; Barsoum, N.; Bauhus, J.; Bruelheide, H.; Castagneyrol, B.; Cavender-Bares, J.; Eisenhauer, N.; Ferlian, O.; Gravel, D.; et al. Synthesis and future research directions linking tree diversity to growth, survival, and damage in a global network of tree diversity experiments. Environ. Exp. Bot. 2018, 152, 68–89. [Google Scholar] [CrossRef]
  38. Paquette, A.; Hector, A.; Castagneyrol, B.; Vanhellemont, M.; Koricheva, J.; Scherer-Lorenzen, M.; Verheyen, K. A million and more trees for science. Nat. Ecol. Evol. 2018, 2, 763–766. [Google Scholar] [CrossRef]
  39. Erikson, D.L.; Jones, F.A.; Swenson, N.G.; Pei, N.; Bourg, N.A.; Chen, W.; Davies, S.J.; Ge, X.J.; Hao, Z.; Howe, R.W.; et al. Comparative evolutionary diversity and phylogenetic structure across multiple forest dynamics plots: A meta-phylogeny approach. Front. Genet. 2014, 5, 358. [Google Scholar] [CrossRef] [Green Version]
  40. Devaney, J.L.; Pullen, J.; Cook-Patton, S.C.; Burghardt, K.T.; Parker, J.D. Tree diversity exacerbates deer damage but facilitates establishment of late successional species in a forest experiment. Ecology. in review.
  41. Dickie, I.A.; Koide, R.T.; Fayish, A.C. Vesicular-arbuscular mycorrhizal infection of Quercus rubra seedlings. New Phytol. 2001, 151, 257–264. [Google Scholar] [CrossRef]
  42. Dickie, I.A.; Koide, R.T.; Steiner, K.C. Influences of established trees on mycorrhizas, nutrition, and growth of Quercus rubra seedlings. Ecol. Monog. 2002, 72, 505–521. [Google Scholar] [CrossRef]
  43. Kembel, S.W.; Cowan, P.D.; Helmus, M.R.; Cornwell, W.K.; Morlon, H.; Ackerly, D.D.; Blomberg, S.P.; Webb, C.O. Picante: R tools for integrating phylogenies and ecology. Bioinformatics 2010, 26, 1463–1464. [Google Scholar] [CrossRef] [PubMed] [Green Version]
  44. Faith, P.D. Conservation evaluation and phylogenetic diversity. Biol. Conserv. 1992, 61, 1–10. [Google Scholar] [CrossRef]
  45. Swenson, N.G. Functional and Phylogenetic Ecology in R; Springer: New York, NY, USA, 2014. [Google Scholar]
  46. Zanne, A.E.; Tank, D.C.; Cornwell, W.K.; Eastman, J.M.; Smith, S.A.; FitzJohn, R.G.; McGlinn, D.J.; O’Meara, B.C.; Moles, A.T.; Reich, P.B.; et al. Three keys to the radiation of angiosperms into freezing environments. Nature 2014, 506, 89–92. [Google Scholar] [CrossRef] [PubMed]
  47. Webb, C.O.; Ackerly, D.D.; Kembel, S.W. Phylocom: Software for the analysis of phylogenetic community structure and trait evolution. Bioinformatics 2008, 24, 2098–2100. [Google Scholar] [CrossRef] [PubMed] [Green Version]
  48. Seabloom, E.W.; Condon, B.; Kinkel, L.; Komatsu, K.J.; Lumibao, C.Y.; May, G.; McCulley, R.L.; Borer, E.T. Effects of nutrient supply, herbivory, and host community on fungal endophyte diversity. Ecology 2019, 100, e02758. [Google Scholar] [CrossRef] [PubMed]
  49. Borcard, D.; Legendre, P. All-scale spatial analysis of ecological data by means of principal coordinates of neighbour matrices. Ecol. Model. 2002, 153, 51–68. [Google Scholar] [CrossRef]
  50. Adespatial: Multivariate Multiscale Spatial Analysis. Available online: https://rdrr.io/cran/adespatial (accessed on 4 June 2019).
  51. Arnold, A.E.; Lutzoni, F. Diversity and host range of foliar fungal endophytes: Are tropical leaves biodiversity hotspots? Ecology 2007, 88, 541–549. [Google Scholar] [CrossRef]
  52. Kaewkla, O.; Franco, C.M. Rational approaches to improving the isolation of endophytic actinobacteria from Australian native trees. Microb. Ecol. 2013, 65, 384–393. [Google Scholar] [CrossRef]
  53. Shaffer, J.P.; Sarmiento, C.; Zalamea, P.C.; Gallery, R.E.; Davis, A.S.; Baltrus, D.A.; Arnold, A.E. Diversity, specificity, and phylogenetic relationships of endohyphal bacteria in fungi that inhabit tropical seeds and leaves. Front. Ecol Evol. 2016, 4, 116. [Google Scholar] [CrossRef] [Green Version]
  54. Shaffer, J.P.; U’Ren, J.M.; Gallery, R.E.; Baltrus, D.A.; Arnold, A.E. An endohyphal bacterium (Chitinophaga, Bacteriodetes) alters carbon source use by Fusarium keratoplasticum (F. solanum species complex, Nectriaceae). Front. Microbiol. 2017, 8, 350. [Google Scholar] [CrossRef] [PubMed] [Green Version]
  55. Vancov, T.; Keen, B. Amplification of soil fungal community DNA using the ITS86F and ITS4 primers. FEMS Microbiol. Ecol. 2009, 296, 91–96. [Google Scholar] [CrossRef] [PubMed] [Green Version]
  56. De Beeck, M.O.; Lievens, B.; Busschaert, P.; Declerck, S.; Vangronsveld, J.; Colpaert, J.V. Comparison and validation of some ITS primer pairs useful for fungal metabarcoding studies. PLoS ONE 2014, 9, e97629. [Google Scholar] [CrossRef] [PubMed] [Green Version]
  57. Edgar, R.C. Search and clustering orders of magnitude faster than BLAST. Bioinformatics 2010, 26, 2460–2461. [Google Scholar] [CrossRef] [PubMed] [Green Version]
  58. Edgar, R.C.; Flyvbjerg, H. Error filtering, pair assembly, and error correction for next-generation sequencing reads. Bioinformatics 2015, 31, 3476–3482. [Google Scholar] [CrossRef] [PubMed] [Green Version]
  59. Edgar, R.C. UNOISE2: Improved error-correction for Illumina 16S and ITS amplicon sequencing. BioRxiv 2016, 081257. [Google Scholar]
  60. Callahan, B.J.; McMurdie, P.J.; Holmes, S.P. Exact sequence variants should replace operational taxonomic units in marker-gene data analysis. ISME J. 2017, 11, 2639–2643. [Google Scholar] [CrossRef] [Green Version]
  61. Deshpande, V.; Wang, Q.; Greenfield, P.; Charleston, M.; Porras-Alfaro, A.; Kuske, C.R.; Cole, J.R.; Midgley, D.J.; Tran-Dinh, N. Fungal identification using a Bayesian classifier and the Warcup training set of internal transcribed spacer sequences. Mycologia 2016, 108, 1–5. [Google Scholar] [CrossRef]
  62. Abarenkov, K.; Henrik Nilsson, R.; Larsson, K.H.; Alexander, I.J.; Eberhardt, U.; Erland, S.; Høiland, K.; Kjøller, R.; Larsson, E.; Pennanen, T.; et al. The UNITE database for molecular identification of fungi–recent updates and future perspectives. New Phytol. 2010, 186, 281–285. [Google Scholar] [CrossRef]
  63. Edgar, R.C. SUNTAX: A simple non-Bayesian taxonomy classifier for 16S and ITS sequenced. BioRxiv 2016, 074161. [Google Scholar]
  64. Oksanen, J.; Blanchet, F.G.; Kindt, R.; Legendre, P.; Minchin, P.R.; O’Hara, R.B.; Simpson, G.L.; Solymos, P.; Stevens, M.H.; Wagner, H. Package ‘vegan’. Community Ecol. Package 2013, 10, 631–637. [Google Scholar]
  65. Anderson, M.J. A new method for non-parametric multivariate analysis of variance. Aust. Ecol. 2001, 26, 32–46. [Google Scholar]
  66. Jost, L. Entropy and diversity. Oikos 2006, 113, 363–375. [Google Scholar] [CrossRef]
  67. Jost, L. Partitioning diversity and independent alpha and beta diversity components. Ecology 2007, 88, 2427–2439. [Google Scholar] [CrossRef] [PubMed] [Green Version]
  68. Hothorn, T.; Bretz, F.; Westfall, P. Simultaneous inference in general parametric models. Biom. J. 2008, 50, 346–363. [Google Scholar] [CrossRef] [PubMed] [Green Version]
  69. Jacqmin-Gadda, H.; Sibilot, S.; Proust, C.; Molina, J.M.; Thiebeaut, R. Robustness of the linear mixed model to misspecified error distribution. Comput. Stat. Data Anal. 2007, 51, 5142–5154. [Google Scholar] [CrossRef] [Green Version]
  70. Tedersoo, L.; Smith, M.E. Lineages of ectomycorrhizal fungi revisited: Foraging strategies and novel lineages revealed by sequences from belowground. Fungal Biol. Rev. 2013, 27, 83–99. [Google Scholar] [CrossRef] [Green Version]
  71. Carrell, A.A.; Frank, A.C. Pinus flexilis and Picea engelmannii share a simple and consistent needle endophyte microbiota with a potential role in nitrogen fixation. Front. Microbiol. 2014, 5, 333. [Google Scholar] [CrossRef] [Green Version]
  72. De Meyer, S.E.; De Beuf, K.; Vekeman, B.; Willems, A. A large diversity of non-rhizobial endophytes found in legume root nodules in Flanders (Belgium). Soil Biol. Biochem. 2015, 83, 1–11. [Google Scholar] [CrossRef] [Green Version]
  73. Agler, M.T.; Ruhe, J.; Kroll, S.; Morhenn, C.; Kim, S.-T.; Weigel, D.; Kemen, E.M. Microbial hub taxa link host and abiotic factors to plant microbiome variation. PLoS Biol. 2016, 14, e1002352. [Google Scholar] [CrossRef] [Green Version]
  74. Unterseher, M.; Siddique, A.B.; Brachmann, A.; Persoh, D. Diversity and composition of the leaf mycobiome of beech (Fagus sylvatica) are affected by local habitat conditios and leaf biochemistry. PLoS ONE 2016, 11, e0152878. [Google Scholar] [CrossRef] [PubMed]
  75. Allan, E.; Weisser, W.W.; Weigelt, A.; Roscher, C.; Fisher, M.; Hillebrand, H. More diverse plant communities have higher functioning over time due to turnover in complementary dominant species. Proc. Natl. Acad. Sci. USA 2011, 108, 17034–17039. [Google Scholar] [CrossRef] [PubMed] [Green Version]
  76. Reich, P.B.; Tilman, D.; Isbell, F.; Mueller, K.; Hobbie, S.E.; Flynn, D.F.B.; Eisenhauer, N. Impacts of biodiversity loss escalate through time as redundancy fades. Science 2012, 336, 589–592. [Google Scholar] [CrossRef] [PubMed] [Green Version]
  77. Ravenek, J.M.; Bessler, H.; Engels, C.; Scherer-Lorenzen, M.; Gessler, A.; Gockele, A.; De Luca, E.; Temperton, V.M.; Ebeling, A.; Roscher, C.; et al. Long-term study of root biomass in a biodiversity experiment reveals shifts in diversity effects over time. Oikos 2014, 12, 1528–1536. [Google Scholar] [CrossRef]
  78. Weisser, W.W.; Roscher, S.T.; Meyer, S.T.; Ebeling, A.; Luo, G.; Allan, E.; Bebler, H.; Barnard, R.L.; Buchmann, N.; Buscot, F.; et al. Biodiversity effects on ecosystem functioning in a 15-year grassland experiment: Patterns, mechanisms, and open questions. Basic Appl. Ecol. 2017, 23, 1–73. [Google Scholar] [CrossRef]
  79. Siemann, E.; Tilman, D.; Haarstad, J.; Ritchie, M. Experimental tests of the dependence of arthropod diversity on plant diversity. Am. Nat. 1998, 152, 738–750. [Google Scholar] [CrossRef]
  80. Parker, J.D.; Duffy, J.E.; Orth, R.J. Plant species diversity and composition: Experimental effects on marine epifaunal assemblages. Mar. Ecol. Prog. Ser. 2001, 224, 55–67. [Google Scholar] [CrossRef]
  81. Reusch, T.B.; Ehlers, A.; Hämmerli, A.; Worm, B. Ecosystem recovery after climatic extremes enhanced by genotypic diversity. Proc. Natl. Acad. Sci. USA 2005, 102, 2826–2831. [Google Scholar] [CrossRef] [Green Version]
  82. Scherber, C.; Eisenhauer, N.; Weisser, W.W.; Schmid, B.; Voigt, W.; Fischer, M.; Schulze, E.D.; Roscher, C.; Weigelt, A.; Allan, E.; et al. Bottom-up effects of plant diversity on multitrophic interactions in a biodiversity experiment. Nature 2010, 468, 553–556. [Google Scholar] [CrossRef]
  83. Hutchinson, G.E. Homage to Santa Rosalia or why are there so many kinds of animals? Am. Nat. 1959, 93, 145–159. [Google Scholar] [CrossRef] [Green Version]
  84. Strong, D.R.; Lawton, J.H.; Southwood, S.R. Insects on Plants. Community Patterns and Mechanisms; Blackwell Scientific Publications: Hoboken, NJ, USA, 1984. [Google Scholar]
  85. Higgins, K.L.; Arnold, A.E.; Coley, P.D.; Kursar, T.A. Communities of fungal endophytes in tropical forest grasses: Highly diverse host-and habitat generalists characterized by strong spatial structure. Fungal Ecol. 2014, 8, 1–11. [Google Scholar] [CrossRef]
  86. Seabloom, E.W.; Borer, E.T.; Gross, K.; Kendig, A.E.; Lacroix, C.; Mitchell, C.E.; Mordecai, E.A.; Power, A.G. The community ecology of pathogens: Coinfection, coexistence, and community composition. Ecol. Lett. 2015, 18, 401–415. [Google Scholar] [CrossRef] [PubMed]
  87. MacArthur, R.H.; Wilson, E.O. The Theory of Island Biogeography; Princeton University Press: Princeton, NJ, USA, 1967. [Google Scholar]
  88. Augspurger, C.K. Seedling survival of tropical tree species: Interactions of dispersal distance, light-gaps, and pathogens. Ecology 1984, 65, 1705–1712. [Google Scholar] [CrossRef]
  89. Augspurger, C.K.; Kelly, C.K. Pathogen mortality of tropical tree seedlings: Experimental studies of the effects of dispersal distance, seedling density, and light conditions. Oecologia 1984, 61, 211–217. [Google Scholar] [CrossRef] [PubMed]
  90. Packer, A.; Clay, K. Soil pathogens and spatial patterns of seedling mortality in a temperate tree. Nature 2000, 404, 278–281. [Google Scholar] [CrossRef] [PubMed]
  91. Johnson, D.J.; Beaulieu, W.T.; Bever, J.D.; Clay, K. Conspecific negative density dependence and forest diversity. Science 2012, 336, 904–907. [Google Scholar] [CrossRef] [Green Version]
  92. Bernays, E.A. Evolution of feeding behavior in insect herbivores. Bioscience 1998, 48, 35–44. [Google Scholar] [CrossRef]
  93. Bernays, E.; Graham, M. On the evolution of host specificity in phytophagous arthropods. Ecology 1988, 69, 886–892. [Google Scholar] [CrossRef]
  94. Schoonhoven, L.M.; Van Loon, B.; van Loon, J.J.; Dicke, M. Insect-Plant Biology; Oxford University Press: Oxford, UK, 2005. [Google Scholar]
  95. Suryanarayanan, T.S.; Venkatesan, G.; Murali, T.S. Endophytic fungal communities in leaves of tropical forest trees: Diversity and distribution patterns. Curr. Sci. 2003, 85, 489–493. [Google Scholar]
  96. Suryanarayanan, T.S.; Murali, T.S.; Thirunavukkarasu, N.; Rajulu, M.G.; Venkatesan, G.; Sukumar, R. Endophytic fungal communities in woody perennials of three tropical forest types of the Western Ghats, southern India. Biodivers. Conserv. 2011, 20, 913–928. [Google Scholar] [CrossRef]
  97. Vincent, J.B.; Weiblen, G.D.; May, G. Host associations and beta diversity of fungal endophyte communities in New Guinea rainforest trees. Mol. Ecol. 2016, 25, 825–841. [Google Scholar] [CrossRef] [PubMed]
  98. Badri, D.V.; Zolla, G.; Bakker, M.G.; Manter, D.K.; Vivanco, J.M. Potential impact of soil microbiomes on the leaf metabolome and on herbivore feeding behavior. New Phytol. 2013, 198, 264–273. [Google Scholar] [CrossRef] [PubMed]
  99. Hubbard, C.J.; Li, B.; McMinn, R.; Brock, M.T.; Maignien, L.; Ewers, B.E.; Kliebenstein, D.; Weinig, C. The effect of rhizosphere microbes outweighs host plant genetics in reducing insect herbivory. Mol. Ecol. 2019, 7, 1801–1811. [Google Scholar] [CrossRef] [PubMed]
  100. Schoenherr, A.P.; Rizzo, E.; Jackson, N.; Manosalva, P.; Gomez, S.K. Mycorrhiza-induced resistance in potato involves priming of defense responses against cabbage looper (Noctuidae: Lepidoptera). Environ. Entomol. 2019, 48, 370–381. [Google Scholar] [CrossRef]
  101. Bakker, P.A.; Berendsen, R.L.; Doornbos, R.F.; Wintermans, P.C.; Pieterse, C.M. The rhizosphere revisited: Root microbiomics. Front. Plant Sci. 2013, 4, 165. [Google Scholar] [CrossRef] [Green Version]
  102. Pieterse, C.M.; Zamioudis, C.; Berendsen, R.L.; Weller, D.M.; Van Wees, S.C.; Bakker, P.A. Induced systemic resistance by beneficial microbes. Annu. Rev. Phytopathol. 2014, 52, 347–375. [Google Scholar] [CrossRef] [Green Version]
  103. Pereira, A.; Ferreira, I.; Marcelino, F.; Valentão, P.; Andrade, P.; Seabra, R.; Estevinho, L.; Bento, A.; Pereira, J. Phenolic compounds and antimicrobial activity of olive (Olea europaea L. Cv. Cobrançosa) leaves. Molecules 2007, 12, 1153–1162. [Google Scholar] [CrossRef]
  104. Meier, C.L.; Bowman, W.D. Phenolic-rich leaf carbon fractions differentially influence microbial respiration and plant growth. Oecologia 2008, 158, 95–107. [Google Scholar] [CrossRef]
  105. Mercier, J.; Lindow, S.E. Role of leaf surface sugars in colonization of plants by bacterial epiphytes. Appl. Environ. Microbiol. 2000, 66, 369–374. [Google Scholar] [CrossRef] [Green Version]
  106. Leveau, J.H.; Lindow, S.E. Appetite of an epiphyte: Quantitative monitoring of bacterial sugar consumption in the phyllosphere. Proc. Natl. Acad. Sci. USA 2001, 98, 3446–3453. [Google Scholar] [CrossRef] [Green Version]
  107. Broz, A.K.; Broeckling, C.D.; De-la-Peña, C.; Lewis, M.R.; Greene, E.; Callaway, R.M.; Sumner, L.W.; Vivanco, J.M. Plant neighbor identity influences plant biochemistry and physiology related to defense. BMC Plant Biol. 2010, 10, 115. [Google Scholar] [CrossRef] [PubMed] [Green Version]
  108. Mraja, A.; Unsicker, S.B.; Reichelt, M.; Gershenzon, J.; Roscher, C. Plant community diversity influences allocation to direct chemical defence in Plantago lanceolata. PLoS ONE 2011, 6, e28055. [Google Scholar] [CrossRef] [PubMed]
  109. McGarigal, K.; Marks, B.J. Fragstats: Spatial Pattern Analysis Program for Quantifying Landscape Structure; US Department of Agriculture Reference Manual; Forest Science Department, Oregon State University: Corvallis, OR, USA, 1994. [Google Scholar]
  110. Nagendra, H. Opposite trends in response for the Shannon and Simpson indices of landscape diversity. Appl. Geogr. 2002, 22, 175–186. [Google Scholar] [CrossRef]
  111. Hodge, A.; Campbell, C.D.; Fitter, A.H. An arbuscular mycorrhizal fungus accelerates decomposition and acquires nitrogen directly from organic material. Nature 2001, 413, 297–299. [Google Scholar] [CrossRef] [PubMed] [Green Version]
  112. Craine, J.M.; Elmore, A.J.; Aidar, M.P.; Bustamante, M.; Dawson, T.E.; Hobbie, E.A.; Kahmen, A.; Mack, M.C.; McLauchlan, K.K.; Michelsen, A.; et al. Global patterns of foliar nitrogen isotopes and their relationships with climate, mycorrhizal fungi, foliar nutrient concentrations, and nitrogen availability. New Phytol. 2009, 183, 980–992. [Google Scholar] [CrossRef] [PubMed]
  113. Read, D.J.; Perez-Moreno, J. Mycorrhizas and nutrient cycling in ecosystems—A journey towards relevance? New Phytol. 2003, 157, 475–492. [Google Scholar] [CrossRef]
  114. Kembel, S.W.; Mueller, R.C. Plant traits and taxonomy drive host associations in tropical phyllosphere fungal communities. Botany 2014, 92, 303–311. [Google Scholar] [CrossRef] [Green Version]
  115. Wolfe, E.R.; Younginger, B.S.; LeRoy, C.J. Fungal endophyte-infected leaf litter alters in-stream microbial communities and negatively influences aquatic fungal sporulation. Oikos 2019, 128, 405–415. [Google Scholar] [CrossRef]
  116. Anderson-Teixeira, K.J.; Davies, S.J.; Bennett, A.C.; Gonzalez-Akre, E.B.; Muller-Landau, H.C.; Wright, S.J.; Abu Salim, K.; Almeyda Zambrano, A.M.; Alonso, A.; Baltzer, J.L.; et al. CTFS-Forest GEO: A worldwide network monitoring forests in an era of global change. Glob. Chang. Biol. 2015, 21, 528–549. [Google Scholar] [CrossRef] [Green Version]
  117. Kral, K.; Shue, J.; Vrska, T.; Gonzalez-Akre, E.B.; Parker, G.G.; McShea, W.J.; McMahon, S.M. Fine-scale patch mosaic of developmental stages in Northeast American secondary temperate forests: The European perspective. Europ. J. For. Res. 2016, 135, 981–996. [Google Scholar] [CrossRef]
  118. Latz, E.; Eisenhauer, N.; Rall, B.C.; Allan, E.; Roscher, C.; Scheu, S.; Jousset, A. Plant diversity improves protection against soil-borne pathogens by fostering antagonistic bacterial communities. J. Ecol. 2012, 100, 597–604. [Google Scholar] [CrossRef]
  119. Cardinale, B.J.; Wright, J.P.; Cadotte, M.W.; Carroll, I.T.; Hector, A.; Srivastava, D.S.; Loreau, M.; Weis, J.J. Impacts of plant diversity on biomass production increase through time because of species complementarity. Proc. Natl. Acad. Sci. USA 2007, 104, 18123–18128. [Google Scholar] [CrossRef] [PubMed] [Green Version]
  120. Mueller, K.E.; Tilman, D.; Fornara, D.; Hobbie, S.E. Root depth distribution and the diversity-productivity relationship in a long-term grassland experiment. Ecology 2013, 94, 787–793. [Google Scholar] [CrossRef] [Green Version]
Figure 1. Tree cladogram of focal tree species and map of the BiodiversiTREE site in Edgewater, MD, USA. (A) Cladogram and type of mycorrhizal association (AM = arbuscular mycorrhizal-associated species, ECM = ectomycorrhizal-associated species) for the 16 focal tree species at the site. We used all species but Carya glabra for this experiment. (B) Experimental layout of plots at the site and focal tree sampling. Each plot contains 255 equally spaced trees per plot, which we planted in either monoculture (1 sp.), 4-spp. or 12-spp. plots, totaling 70 plots. We used a well-replicated design across the 15 tree species at the site, totaling 545 trees.
Diversity 11 00234 g001
Figure 2. The effects of tree diversity on fungal endophyte richness (0D), Shannon diversity equivalents (eH) (= 1D), and Simpson’s effective species number (2D) among 15 focal tree species (N = 545 focal trees). We used linear mixed effects models with a random intercept for each unique combination of plot replicate and host taxon. The reference condition for plot richness was the monoculture treatment. In addition, we calculated linear models to estimate the effects of plot richness on the response variable for each focal tree host, using the same covariates as for the mixed effects models. Beta coefficients from these linear models are plotted here (some species are very close to zero because there was little change in Simpson’s among tree richness treatments). The dotted line is the average effect of diversity treatment across hosts. Overall, fungal richness and diversity equivalents decreased as tree richness increased (richness: p < 0.01; Shannon’s: p < 0.01). Conversely, increases in one- to four-species plots increased fungal Simpson’s effective species number; however, increases in one- to 12-species plots had no effect on Simpson’s (1–4 sp.: p < 0.05; 1–12 sp.: p > 0.10). After correcting for multiple tests with false discovery rates (FDR) values, the effects of tree richness on fungal richness, Shannon’s diversity equivalents, and Simpson’s effective species number did not differ among tree species (Tables S2–S4; p > 0.05).
Diversity 11 00234 g002
Figure 3. The effects of tree richness on fungal ESV richness of the most common functional guilds among 15 focal tree species (N = 545 focal trees). We used linear mixed effects models with a random intercept for each unique combination of plot replicate and host taxon. The reference condition for plot richness was the monoculture treatment. Increases in tree richness decreased ESV richness within all guilds as well as guild diversity. *** p < 0.001, ** p < 0.01, * p < 0.05.
Diversity 11 00234 g003
Table 1. Effects of tree richness and covariates on fungal endophyte diversity and richness.
ResponseInterceptDiversity = 4Diversity = 12ECMHeightMEM 1MEM 2MEM 3
Richness119.2 ***
(107.1, 131.4)
−6.
9(1.5, −15.3)
−15.8 ***
(−7.6, −24.0)
28.5 **
(8.3, 48.7)
−4.8
(−11.6, 2.0)
3.2
(−3.6, 10.0)
2.6
(−2.0, 7.1)
−5.1 **
(−10.2, 0.0)
Shannon’s equivalent14.4 ***
(12.1, 16.8)
−1.9 **
(−3.8, 0.0)
−2.9 ***
(−4.8, −1.0)
4.8 **
(0.7, 8.8)
−0.3
(−1.7, 1.2)
0.4
(−1.0, 1.9)
0.8
(−0.2, 1.8)
−1.8 ***
(−3.0, −0.7)
Simpson’s sp. number1.8 ***
(0.9, 2.9)
1.2 **
(0.0, 2.5)
−0.1
(−1.3, 1.1)
−0.
9(−2.4, 0.6)
−0.0
(−0.7, 0.6)
−0.4
(−1.1, 0.3)
0.0
(−0.5, 0.6)
0.3
(−0.3, 0.9)
Results shown are from a linear mixed effects model with random effects of plot replicate by host species combinations. Values in cells are beta coefficient estimates, with 95% confidence intervals in parentheses and p values denoted by asterisks. All coefficients for the effects of richness treatments are relative to monoculture plots. All coefficients for the effects of ectomycorrhizal (ECM) association are relative to those for arbuscular mycorrhizal (AM) association. Height is the height of the tallest stem of the host tree. The effect of spatial autocorrelation was accounted for using Moran’s eigenvector mapping (MEM), calculated by extracting eigenvectors from a spatial matrix that maximizes Moran’s I, an index of spatial autocorrelation structures within data. We converted all covariates to z scores prior to analysis. *** p < 0.01, ** p < 0.05.
Table 2. Effects of neighborhood and plot tree phylogenetic diversity and covariates on fungal endophyte diversity and richness.
ResponseInterceptSES_PDHeightMEM 1MEM 2MEM 3
Neighborhood
Richness110.8 ***
(99.9, 121.6)
−5.8 ***
(−9.4, −2.2)
−5.6
(−9.4, −2.2)
2.2
(−4.4, 8.8)
1.9
(−2.6, 6.5)
−4.9 *
(−10.0, 0.2)
Shannon’s equivalent.12.8 ***
(10.7, 14.9)
−1 ***
(−1.8, −0.2)
−0.5
(−2.0, 1.0)
0.2
(−1.2, 1.7)
0.7
(−0.3, 1.7)
−1.7 ***
(−2.8, −0.6)
Simpson’s sp. number.2.3 ***
(1.6, 3.0)
0
(−0.6, 0.5)
0
(−0.7, 0.7)
−0.3
(−0.9, 0.4)
−0.1
(−0.6, 0.5)
0.2
(−0.4, 0.8)
Plot
Richness114.8 ***
(95.7, 133.9)
−7.7 **
(−14.8, −0.5)
−7 *
(−14.1, 0.2)
0.1
(−7.5, 7.7)
4.1
(−2.9, 11)
−5.2
(−13.8, 3.5)
Shannon’s equivalent11 ***
(7.2, 14.8)
−1
(−2.4, 0.4)
−0.5
(−1.0, 09)
−0.2
(−1.7, 1.3)
0.4
(−0.9, 1.7)
−1
(−2.7, 0.7)
Simpson’s sp. number.1.3 ***
(1.2, 1.4)
0
(0, 0.1)
0
(0, 0.1)
0
(−0.1, 0.1)
0
(−0.1, 0)
0
(0, 0.1)
Results shown are from a linear mixed effects model with random effects of plot replicate by host species combinations. Values in cells are beta coefficient estimates, with 95% confidence intervals in parentheses and p values denoted by asterisks. All coefficients for the effects of richness treatments are relative to monoculture plots. Height is the total height of the host tree. SES_PD stands for the standardized effect size of Faith’s Phylogenetic Diversity. The effect of spatial autocorrelation was accounted for using Moran’s eigenvector mapping (MEM), which were calculated by extracting eigenvectors from a spatial matrix that maximizes Moran’s I, an index of spatial autocorrelation structures within data. We converted all covariates to z scores prior to analysis. *** p < 0.01, ** p < 0.05, * p < 0.1.
Table 3. Effects of tree richness and covariates on guild richness.
ResponseInterceptDiversity = 4Diversity = 12HeightMEM 1MEM 2MEM 3
Pathogens60.6 ***
(54.8, 66.4)
−3.0
(−7.4, 1.5)
−6.6 ***
(−11.0, −2.2)
−2.7
(−6.2, 0.7)
1.6
(−1.7, 4.9)
0.6
(−1.8, 3.0)
−3.2 **
(−5.8, −0.6)
Saprotrophs55.3 ***
(50.7, 59.9)
−2.7
(−6.8, 1.5)
−5.6 ***
(−9.7, −1.5)
−2.3
(−5.3, 0.7)
0.5
(−2.4, 3.4)
1.1
(−1.1, 3.2)
−2.4 **
(−4.8, −0.1)
Parasites12.3 ***
(10.7, 13.9)
−0.2
(−1.7, 1.3)
−1.4 *
(−2.9, 0.1)
−0.4
(−1.4, 0.7)
−0.6
(−1.6, 0.5)
0.4
(−0.4, 1.1)
−0.9 **
(−1.8, −0.1)
Lichens12.2 ***
(10.6, 13.9)
−0.4
(−1.9, 1.1)
−1.5 **
(−3.0, −0.01)
−0.5
(−1.5, 0.6)
−0.5
(−1.5, 0.6)
0.3
(−0.5, 1.1)
−1.2 ***
(−2.0, −0.3)
Symbionts28.7 ***
(25.2, 32.2)
−1.3
(−3.8, 1.2)
−2.893 **
(−5.36, −0.426)
−1.9 *
(−3.9, 0.1)
−0.04
(−2.0, 1.9)
0.3
(−1.1, 1.6)
−1.7 **
(−3.2, −0.2)
Results shown are from linear mixed effects models with random effects of plot replicate by host species combinations. Values in cells are beta coefficient estimates, with 95% confidence intervals in parentheses and p values denoted by asterisks. All coefficients for the effects of richness treatments are relative to monoculture plots. Height is the total height of the host tree. The effect of spatial autocorrelation was accounted for using Moran’s eigenvector mapping (MEM; see main text). We converted all covariates to z scores prior to analysis. *** p < 0.01, ** p < 0.05, * p < 0.1.
Table 4. Effects of tree richness and covariates on guild diversity.
ResponseInterceptDiversity = 4Diversity = 12HeightMEM 1MEM 2MEM 3
Guild Diversity
(Shannon’s)
3.57 ***−0.19 *−0.24 **0.0−0.070.08−0.02
Pathogens7.4 ***
(6.4, 8.3)
−0.6
(−1.5, 0.4)
−1.0 **
(−1.9, −0.1)
−0.2
(−0.9, 0.4)
0.2
(−0.4, 0.9)
−1.2 ***
(−1.7, −0.7)
−0.6 **
(−1.1, −0.1)
Saprotrophs7.7 ***
(6.8, 8.5)
−0.5
(−1.4, 0.5)
−1.5 ***
(−2.4, −0.5)
−0.1
(−0.7, 0.5)
−0.1
(−0.6, 0.5)
−1.2 ***
(−1.7, −0.7)
−0.8 ***
(−1.3, −0.4)
Parasites7.7 ***
(6.8, 8.5)
−0.5
(−1.4, 0.5)
−1.5 ***
(−2.4, −0.5)
−0.1
(−0.7, 0.5)
−0.1
(−0.6, 0.5)
−1.2 ***
(−1.7, −0.7)
−0.8 ***
(−1.3, −0.4)
Lichens2.7 ***
(2.4, 2.9)
−0.1
(−0.4, 0.1)
−0.1
(−0.4, 0.1)
−0.01
(−0.1, 0.1)
0.1
(−0.03, 0.2)
−0.1
(−0.2, 0.1)
−0.1
(−0.2, 0.1)
Symbionts4.7 ***
(4.2, 5.1)
−0.1
(−0.7, 0.5)
−0.3
(−0.9, 0.3)
−0.1
(−0.5, 0.2)
−0.3 *
(−0.6, 0.03)
−0.4 ***
(−0.7, −0.1)
−0.3 **
(−0.6, −0.1)
Results shown are from linear mixed effects models with random effects of plot replicate by host species combinations. Values in cells are beta coefficient estimates, with 95% confidence intervals in parentheses and p values denoted by asterisks. All coefficients for the effects of richness treatments are relative to monoculture plots. Height is the total height of the host tree. The effect of spatial autocorrelation was accounted for using Moran’s eigenvector mapping (MEM; see main text). We converted all covariates to z scores prior to analysis. We calculated the Shannon’s diversity equivalents (1D) of all guilds using the relative abundances of the five guilds considered. *** p < 0.01, ** p < 0.05, * p < 0.1.

