Article

Adaptations by Zostera marina Dominated Seagrass Meadows in Response to Water Quality and Climate Forcing

Virginia Institute of Marine Science, College of William and Mary, Gloucester Point, VA 23062, USA
*
Author to whom correspondence should be addressed.
Diversity 2018, 10(4), 125; https://doi.org/10.3390/d10040125
Submission received: 27 September 2018 / Revised: 16 November 2018 / Accepted: 21 November 2018 / Published: 27 November 2018

Abstract

:
Global assessments of seagrass declines have documented accelerating rates of loss due to anthropogenic sediment and nutrient loadings, resulting in poor water quality. More recently, global temperature increases have emerged as additional major stressors. Seagrass changes in the Chesapeake Bay, USA provide important examples of not only the effects of human disturbance and climate forcing on seagrass loss, but also meadow recovery and resiliency. In the York River sub-tributary of the Chesapeake Bay, the meadows have been monitored intensively using annual aerial imagery, monthly transect surveys, and continuous water quality measurements. Here, Zostera marina has been demonstrating a shift in its historical growth patterns, with its biomass peaking earlier in the growing season and summer declines beginning earlier. We found an increasing trend in the length of the most stressful high temperature summer period, increasing by 22 days since 1950. Over the past 20 years, Z. marina’s abundance has exhibited periods of decline followed by recovery, with recovery years associated with greater spring water clarity and less time spent at water temperatures > 28 °C. Although human disturbance and climatic factors have been altering these seagrass meadows, resilience has been evident by an increase in reproductive output and regrowth from Z. marina seedlings following declines, as well as expansions of Ruppia maritima into areas previously dominated by Z. marina.

1. Introduction

Recent global climate changes have affected a wide variety of plant communities with diverse geographical distributions. Climate effects on land-based communities have been well studied as to their changing phenologies, ranges, species distributions, and community interactions [1,2,3,4], as well as the additional effects of episodic disturbance factors [5]. Marine seagrass communities have, however, received much less attention until more recently.
Seagrass meadows have been identified as being among the most threatened ecosystems across the globe, as they have been experiencing not only declines in areal extent, but also accelerated rates of decline [6,7]. Both direct and indirect stressors have been implicated in these losses, including increased anthropogenic sediment and nutrient loadings resulting in poor water quality conditions [6,8,9]. Most recently, there has been an increased focus on the effects of current and future climate change factors on seagrass productivity and distribution [10,11,12].
In the Chesapeake Bay, USA, large-scale seagrass declines, first documented in the 1960s and continuing into the 1970s, were related to excessive nutrient and sediment loadings into the Bay, augmented by a devastating tropical storm in 1972 [13]. These declines generated great interest in restoring these critical habitats, and specific targets for water quality and water clarity improvements were put in place to promote seagrass recovery [14,15,16]. The seagrass Zostera marina (eelgrass) has been the dominant species in the polyhaline regions of the Bay, and in the years subsequent to 1972, it disappeared from over 50% of its former Bay-wide distribution [12,13]. In the decades since the 1970s there was some initial recovery [17], however over the past 20 years meadow distribution and abundance have generally been declining, characterized by periods of sharp declines followed by periods of some recovery [16]. Since Z. marina meadows in the Chesapeake Bay are growing near their southern limits of distribution along the eastern coast of North America [18], declines and recoveries in this region can serve as a future model for other areas throughout the northern hemisphere where the interactions of climate and anthropogenic factors, although also very significant, may be less extreme [19,20].
Mean summer water temperatures have been increasing in the Chesapeake Bay, along with greater frequencies of extreme temperature events exceeding 28 °C [12], which has been identified as a critical threshold for Z. marina [21,22]. In 2005 and 2010, extreme heat events triggered large-scale Z. marina die-offs throughout the Bay [20,23]. Z. marina can also be affected by the interactions of temperature and light, with more light required at warmer temperatures to maintain a positive carbon balance [24,25]. Additionally, high temperatures and increased turbidity can reduce oxygen production in the plant, resulting in anoxic conditions which can lead to sulfide toxicity [26,27]. Therefore, the combined effects of climate-related temperature increases and decreased water clarity associated with coastal development will be critical factors in the persistence of this species, not only in the Chesapeake Bay, but throughout its global distribution.
One seagrass-dominated region of the Chesapeake Bay, the York River, has been extensively studied for both water quality conditions and seagrass growth and abundance changes over the past 30+ years, allowing us to combine long term water quality measurements with current (2004–2017) and historical (1980s and 1990s) seagrass abundance surveys to assess Z. marina adaptation to changing conditions. In this study, we used both monthly seagrass transect surveys and annual aerial mapping surveys, combined with both continuous and bimonthly water quality measurements in the York River, Chesapeake Bay to address the following questions: (1) In the face of a changing climate, has there been a shift in the temporal and spatial growth patterns of Z. marina? (2) Can we identify critical climate and water quality conditions associated with periods of Z. marina meadow decline compared with periods of recovery? (3) Although periodic die-off events have been occurring, are these meadows exhibiting signs of or mechanisms for resiliency?

2. Materials and Methods

2.1. Seagrass Transect Surveys

Seagrass transect surveys were conducted at Goodwin Islands (37°13′1″ N, 76°23′19″ W) in the polyhaline portion of the York River Estuary, a tributary of the Chesapeake Bay (Figure 1). The Goodwin Islands are a 315 ha archipelago of salt-marsh islands that experience semi-diurnal tides with an average range of 0.7 m. The subtidal flats surrounding the islands have supported seagrass beds for at least the last 80 years [13,17,28]. Three permanent transects (GI-1, GI-2, GI-3) were established within this reserve area of the Chesapeake Bay National Estuarine Research Reserve in Virginia (CBNERR) in 2004 as part of their System-Wide Monitoring Program (SWMP). Over this period, divers obtained vegetative cover estimates, maximum shoot lengths, and vegetative and reproductive shoot density counts at monthly intervals along the transects from April–October. The longest transect (GI-3, 700 m) was sampled every 20 m, and the other transects (GI-1, 130 m; GI-2, 300 m) every 10 m. The depth along the transects ranges from 0 to −120 cm below mean lower low water (MLLW). Methods for this survey have been previously published [20]. Biomass was calculated based on shoot length to shoot weight relationships previously developed for this area [29] (shoot weight = shoot length × 0.0018), and then scaled to meter squared estimates based on field density measurements (biomass g DW m−2 = shoot weight × density m−2). Z. marina biomass estimates are reported for the entire time period, while percent cover estimates comparing Z. marina and Ruppia maritima (widgeongrass) are reported beginning in 2010, since this is the year that consistent R. maritima data collection began. Similar data from the same location were obtained from historical surveys from the 1980s and 1990s for comparisons [17,29].

2.2. Aerial Surveys

Aerial imagery obtained through the Virginia Institute of Marine Science (VIMS) Submersed Aquatic Vegetation Monitoring Program [30] was utilized to quantify seagrass bed area for the Mobjack Bay segment, which includes the Goodwin Islands (Figure 1). Seagrass bed mapping has been conducted through this program since 1984, using panchromatic photography at a scale of 1:24,000 acquired with a standard mapping camera until 2014. Since 2014, a digital mapping camera with a ground sample distance of 24 cm has been used. The imagery is obtained at peak growing season, typically in June for the polyhaline segments. Guidelines for its acquisition include factors related to tidal stage, plant growth, sun angle, atmospheric transparency, water turbidity, and wind. Complete details of the survey can be found on the website [30].
For the water quality analyses, we limited the seagrass coverage data to 1998–2017, because these are the years water quality data were available. Two distinct periods of decline and two distinct periods of increase were determined from this aerial coverage data. Periods where seagrass was declining included the years 2001–2006 and 2009–2012, while periods of increase included the years 2006–2009 and 2012–2015. These data represent beds during peak Z. marina biomass since they are flown in June, and not peak R. maritima biomass, which is typically low in June and at a maximum in August [17,20].

2.3. Water Quality

A long-term temperature record was assembled using samples collected from the Virginia Institute of Marine Science Pier located at 37.2468, −76.5000 (1950–2003) and Yorktown USCG Training Center located at 37.2267, −76.4783 (2004–2017). Sample frequency at the two stations ranged from 2 samples a day to one sample every 6 minutes. The summer growing season for Z. marina was defined based on work conducted in the York River using in situ growth experiments that related net plant growth to water temperature [14] (pp. 95–96). In that study, periods of high growth of Z. marina were observed during the spring and fall, and the low growth summer season was triggered when water temperatures reached 23 °C and ended when temperatures dropped back down to 25 °C. Using this information, for our study we defined the beginning of the summer stressful season as being triggered by three consecutive days with mean water temperatures above 23 °C, and the end of the season being triggered by three consecutive days with mean water temperatures below 25 °C.
Temperature and salinity measurements were taken from a CBNERR continuous water quality station established in 1998 at the Goodwin Islands reserve site. This station houses a YSI (Xylem Analytics) multi-parameter sonde that is fixed to a piling 0.5 m above the bottom that samples every 15-minutes. Data are available through the Virginia Estuarine and Coastal Observing System (VECOS) website [31]. Triplicate water samples were also taken twice a month at this same location as part of a long-term, shallow water monitoring project. Samples were filtered the same day upon return to the laboratory, and then analyzed for chlorophyll [32] and total suspended solids (TSS). Downwelling light attenuation coefficients (Kd) were measured by diffuse downwelling attenuation of photosynthetically available radiation (PAR) determined using triplicate water column measurements of downwelling photosynthetic photon flux density measured with a LI-COR underwater quantum sensor (190SA, LI-Cor, Inc., Lincoln, NE, USA) taken 10 cm below the surface and just above the bottom. Mean monthly water level data were obtained from the U.S. NOAA, National Ocean Survey tide gauge at the Yorktown USCG Training Center.

2.4. Data Analyses

All data were analyzed and figures were produced using RStudio v 3.5.0 [33]. To better understand the trend in the long-term record of summer season lengths, a linear model was fit to summer season length as a function of year. To analyze the relationship between seagrass coverage and water temperature, a linear model was fit to seagrass coverage as a function of the length of the summer season. Because seagrass imagery is obtained in June, at the beginning of the summer season, the previous year’s length of season was used in the regression.
Water quality parameters were separated into declining and increasing seagrass periods to match the annual seagrass coverage data. Since seagrass imagery is typically obtained in June, we set the cut-off for the periods to start on June 1st and end on May 31st just before the start of the imagery for the next period. For example, for the declining years of 2001–2006, water quality data were used from 01-06-2001 to 31-05-2006. We were interested in differences between the two periods across different months. ANOVA assumptions were not met for equal variances, so Kruskal-Wallis tests were conducted for each month, using the seagrass period (decline or increase) as the factor for salinity, TSS, chlorophyll, Kd, surface PAR, and tidal height. A frequency curve for summer (June–August) water temperature was used to compare the two periods, binning the data into the percent time spent at each temperature bin.

3. Results

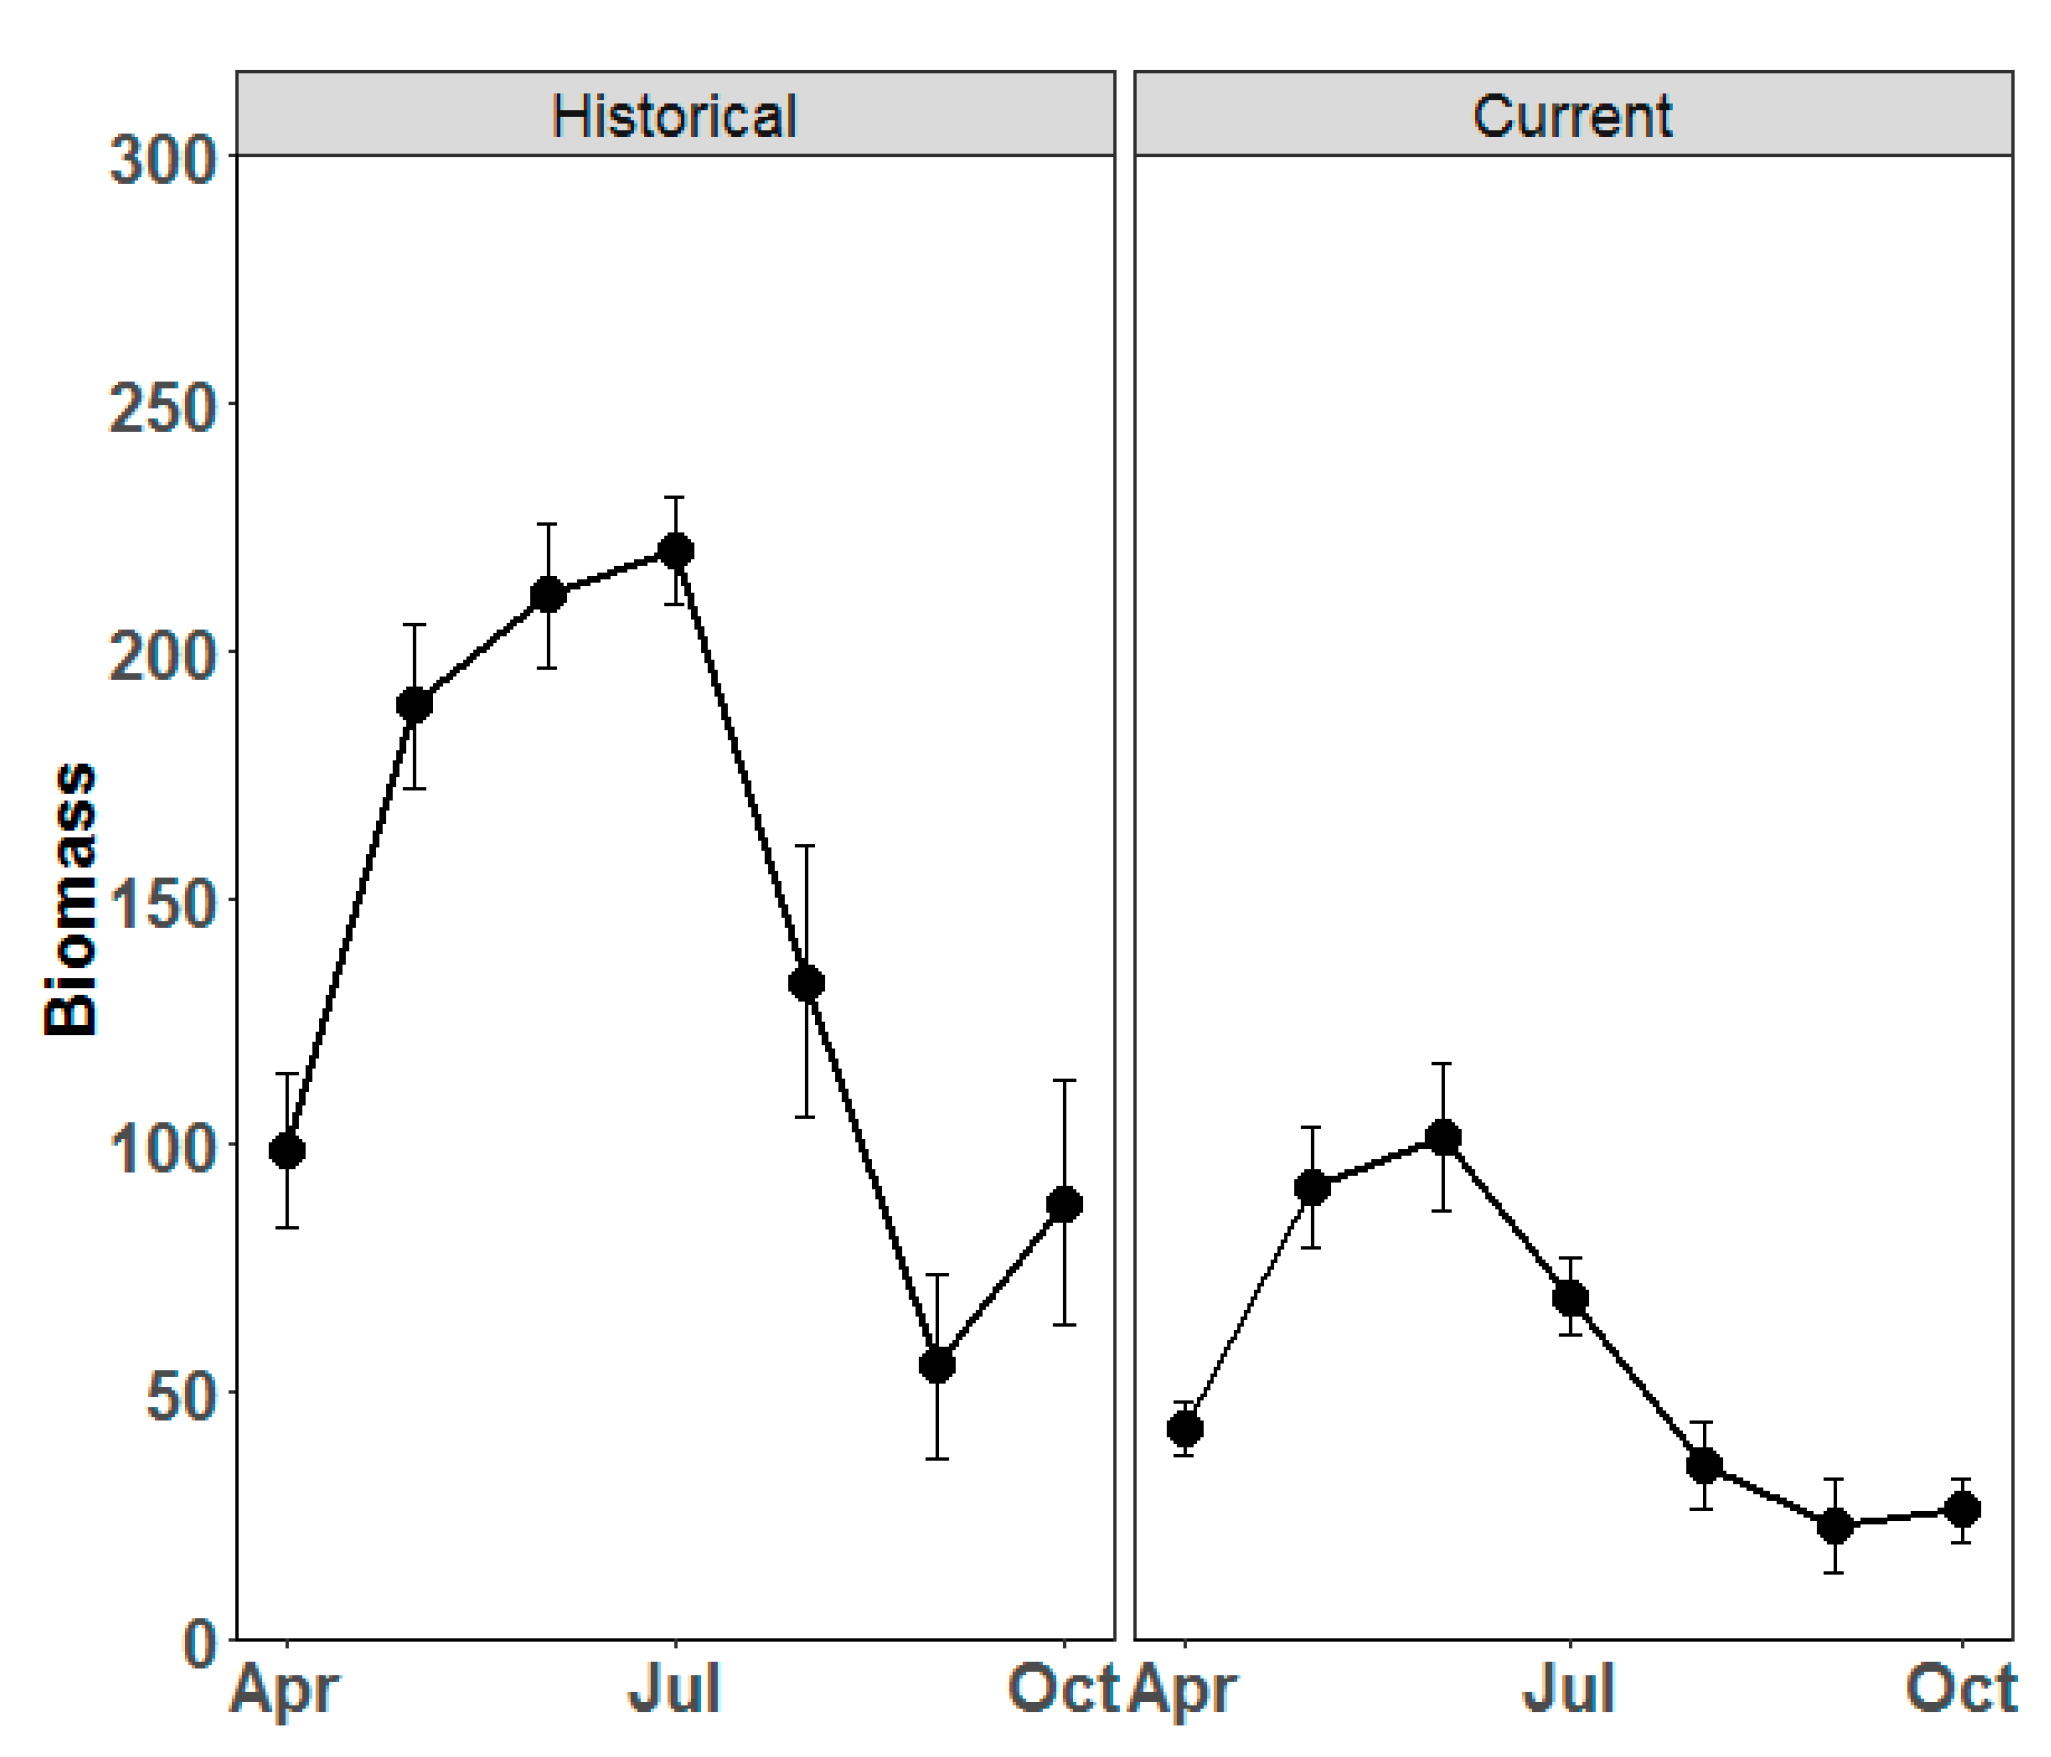
Averaged across all years (2004–2017), the maximum biomass of Z. marina follows a unimodal pattern, peaking in May and June and declining by July, with little to no recovery in the fall (Figure 2). Historical data from this same region from the 1980s and 1990s show Z. marina biomass peaking in July, with declines beginning in August, and some recovery in October. (Figure 2) [17]. Z. marina’s historical biomass is more than double that of the more recent surveys, with maximum values of 220 g DW m−2 from surveys conducted in the 1980s and 1990s, compared with a maximum of 102 g DW m−2 from 2004–2017.
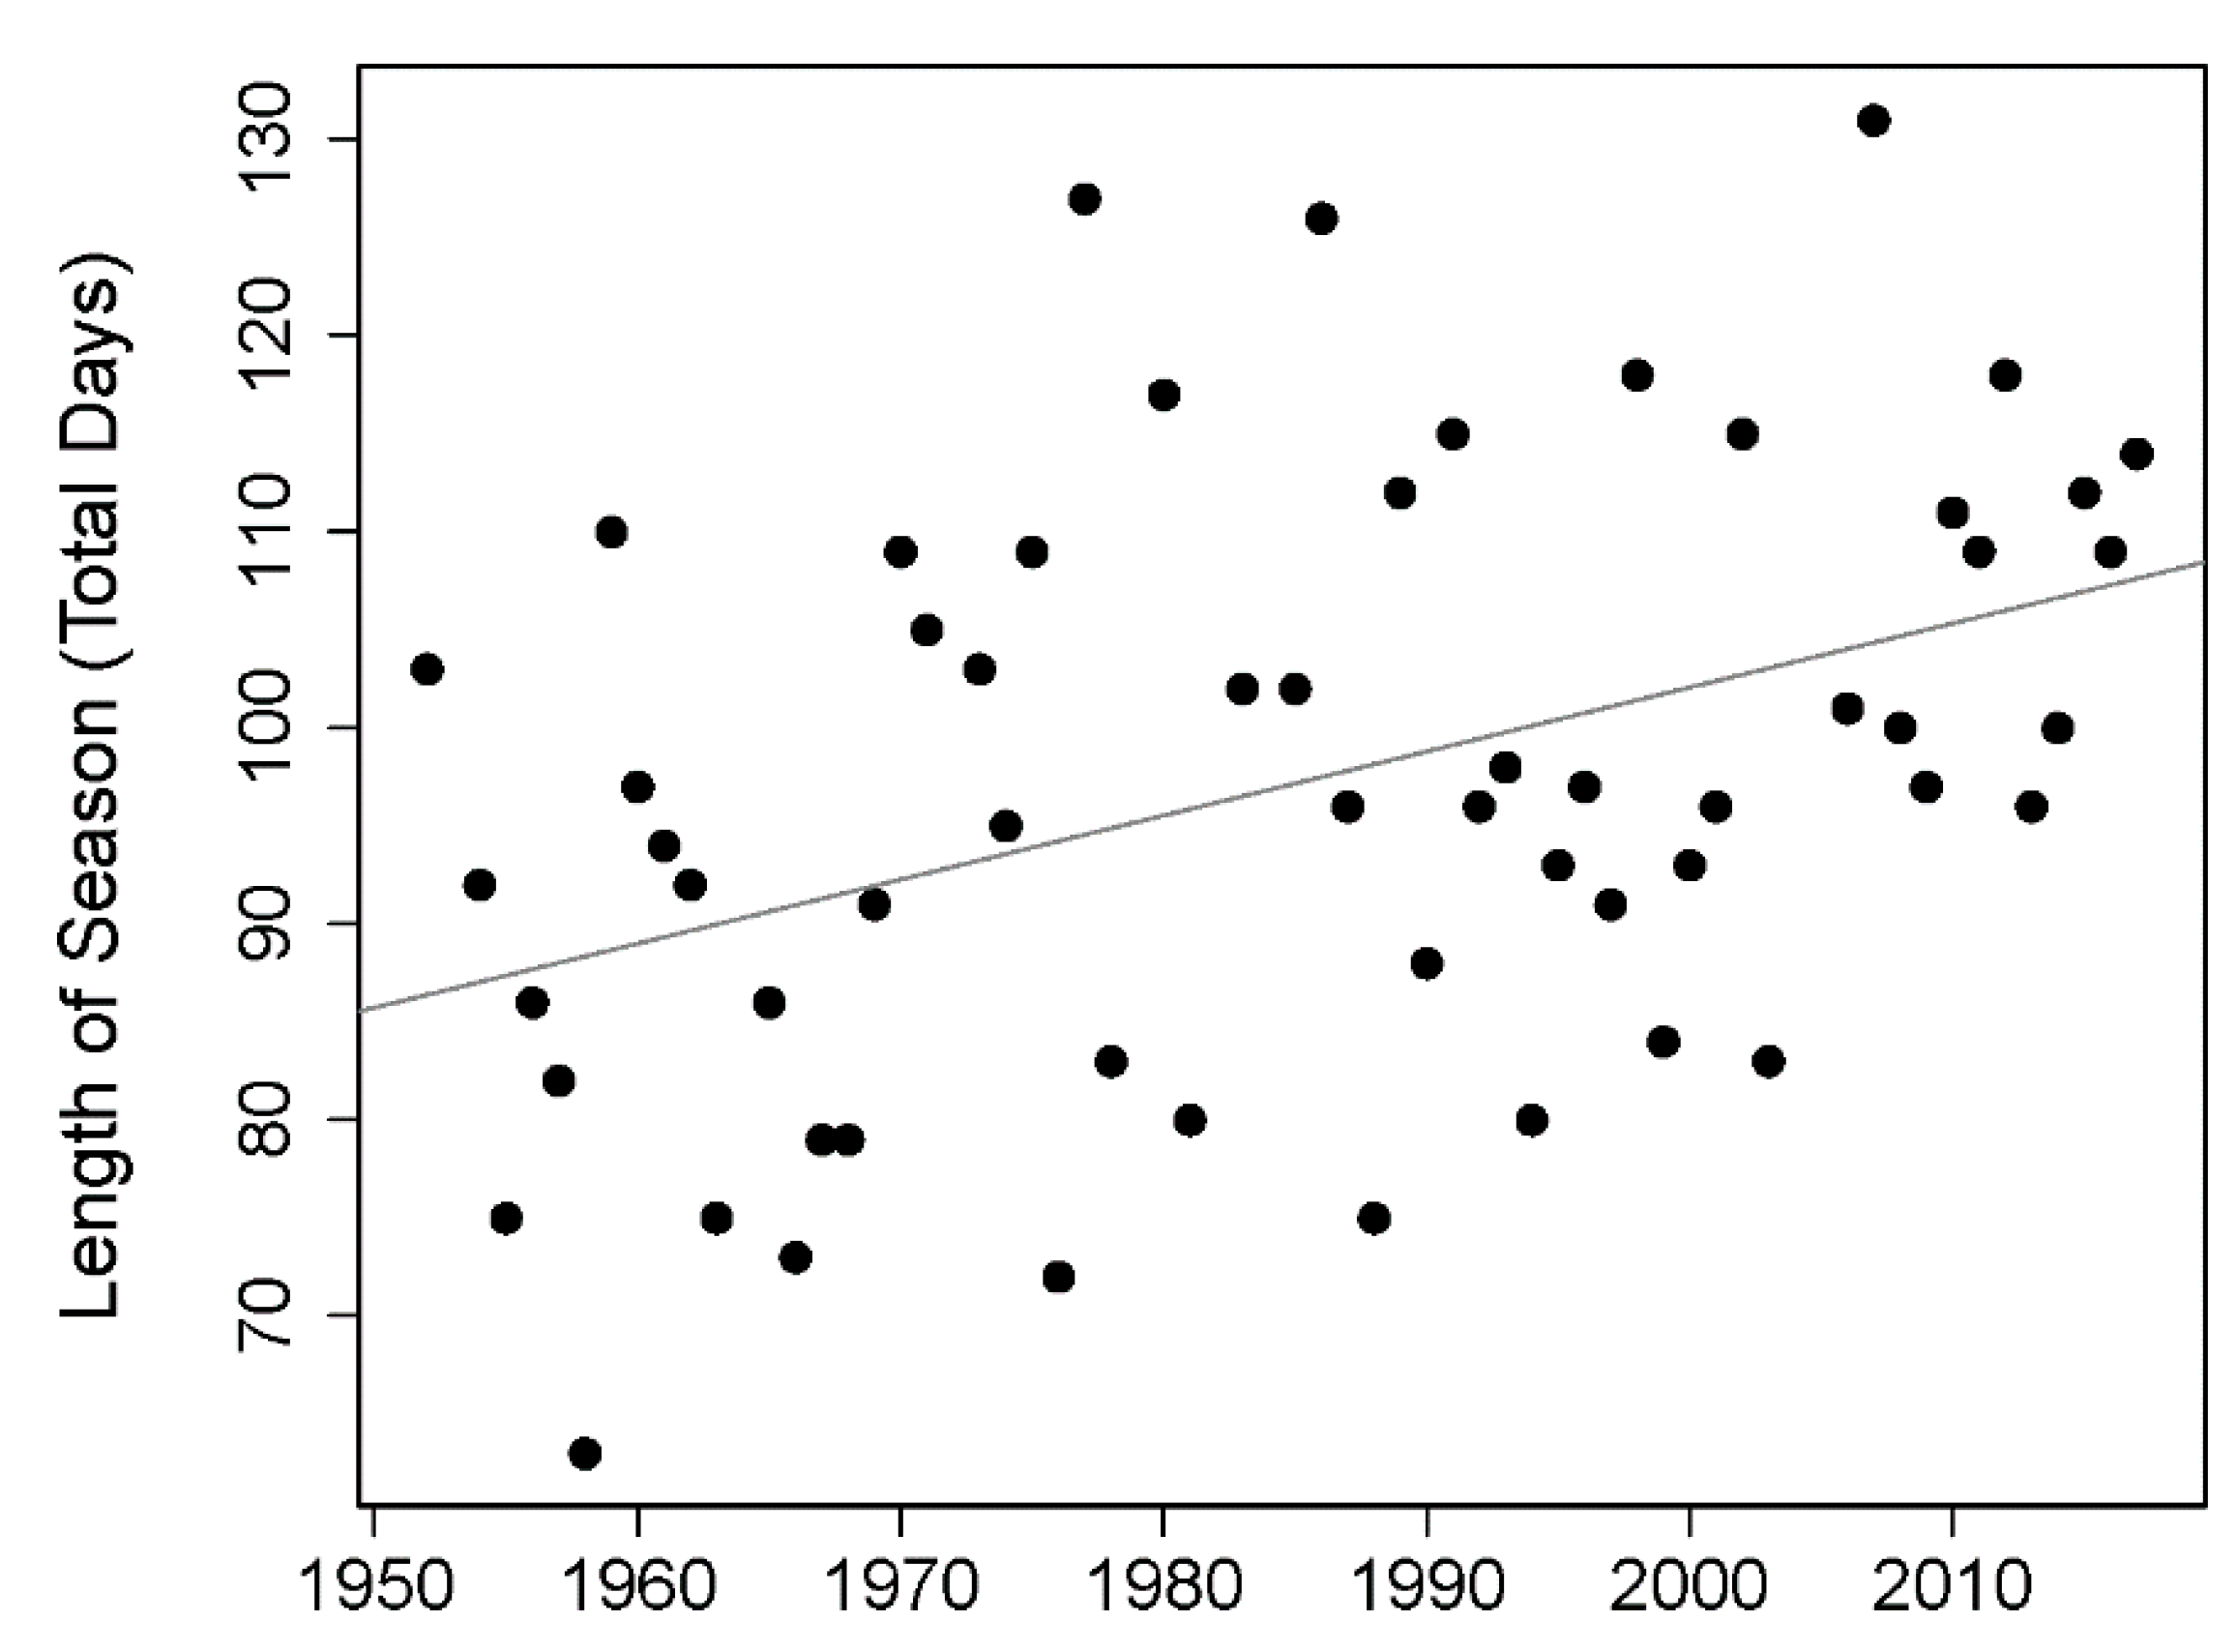
Investigations of temperature patterns that may be driving these changes revealed a significant increase in the length of the stressful summer season (Figure 3). Since 1950, the length of this season has been extended by approximately 22 days. This is driven by both an earlier start to the season as well as a later end to the season (data not shown).
Comparisons of Z. marina and R. maritima abundance across the GI-3 transect between 1994–1995 and 2010–2017 reveal differences in both spatial and temporal distributions (Figure 4) [29]. A depth gradient exists at this transect, ranging from −20 cm below MLLW at the beginning of the transect to −60 cm below MLLW 500 m out from shore. During 1994–1995, Z. marina grew fairly uniformly across the entire depth distribution, whereas from 2010–2017 it had very low coverage beyond 400 m. During 1994–1995, Z. marina was always dominant beyond 100 m from shore, while R. maritima only grew in the first 100 m and was absent from the rest of the bed. Overall from 2010–2017, Z. marina was the dominant species during April and June, but R. maritima became dominant in August and October, growing 400 m out from shore.
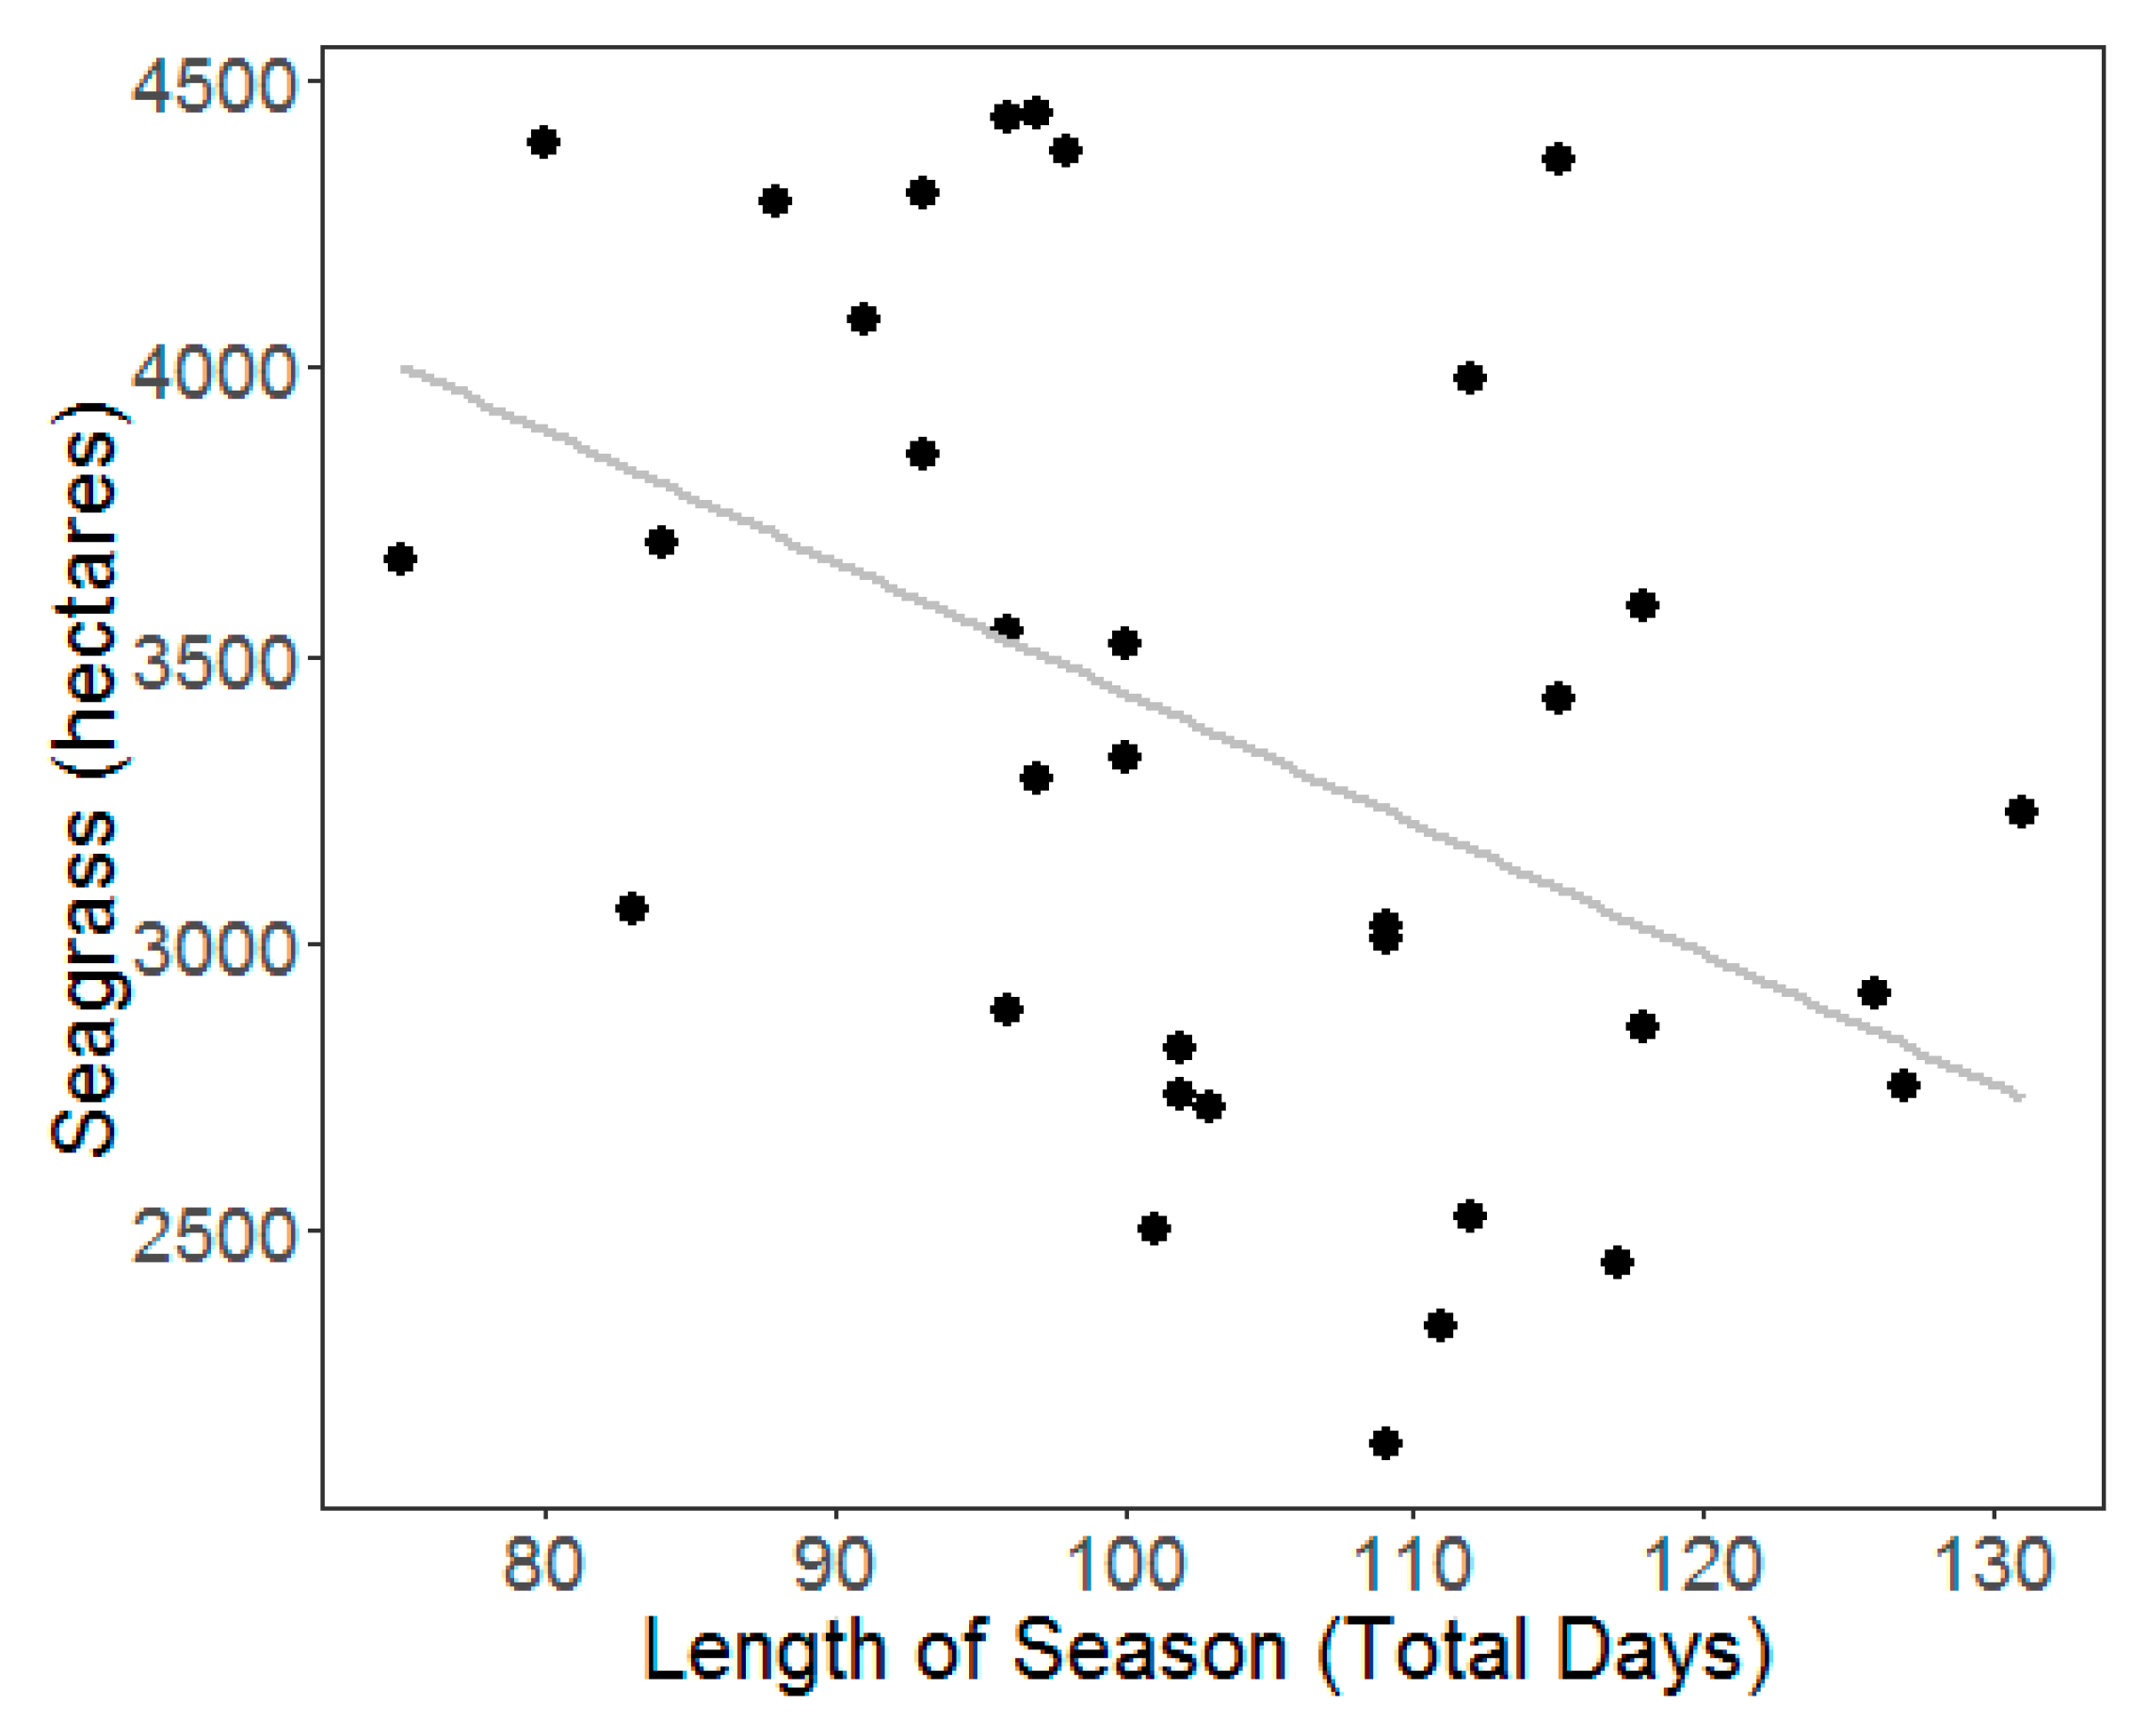
Aerial photography from the Mobjack Bay segment, which includes Goodwin Islands, revealed a significant negative relationship between seagrass coverage and the length of the stressful summer season (Figure 5). From 1998–2017, there were two distinct periods of time where seagrass hectares (ha) were declining, followed by periods of recovery (Figure 6). During the first period of decline, seagrasses declined from 3850 ha in 2001 to 2183 ha by 2006, a 43% loss. Recovery occurred, peaking in 2009 at 3521 ha, followed by another decline, reaching a low of 2133 ha in 2012, a loss of 39%. The beds were once again able to recover, peaking in 2015 at 3319 ha.
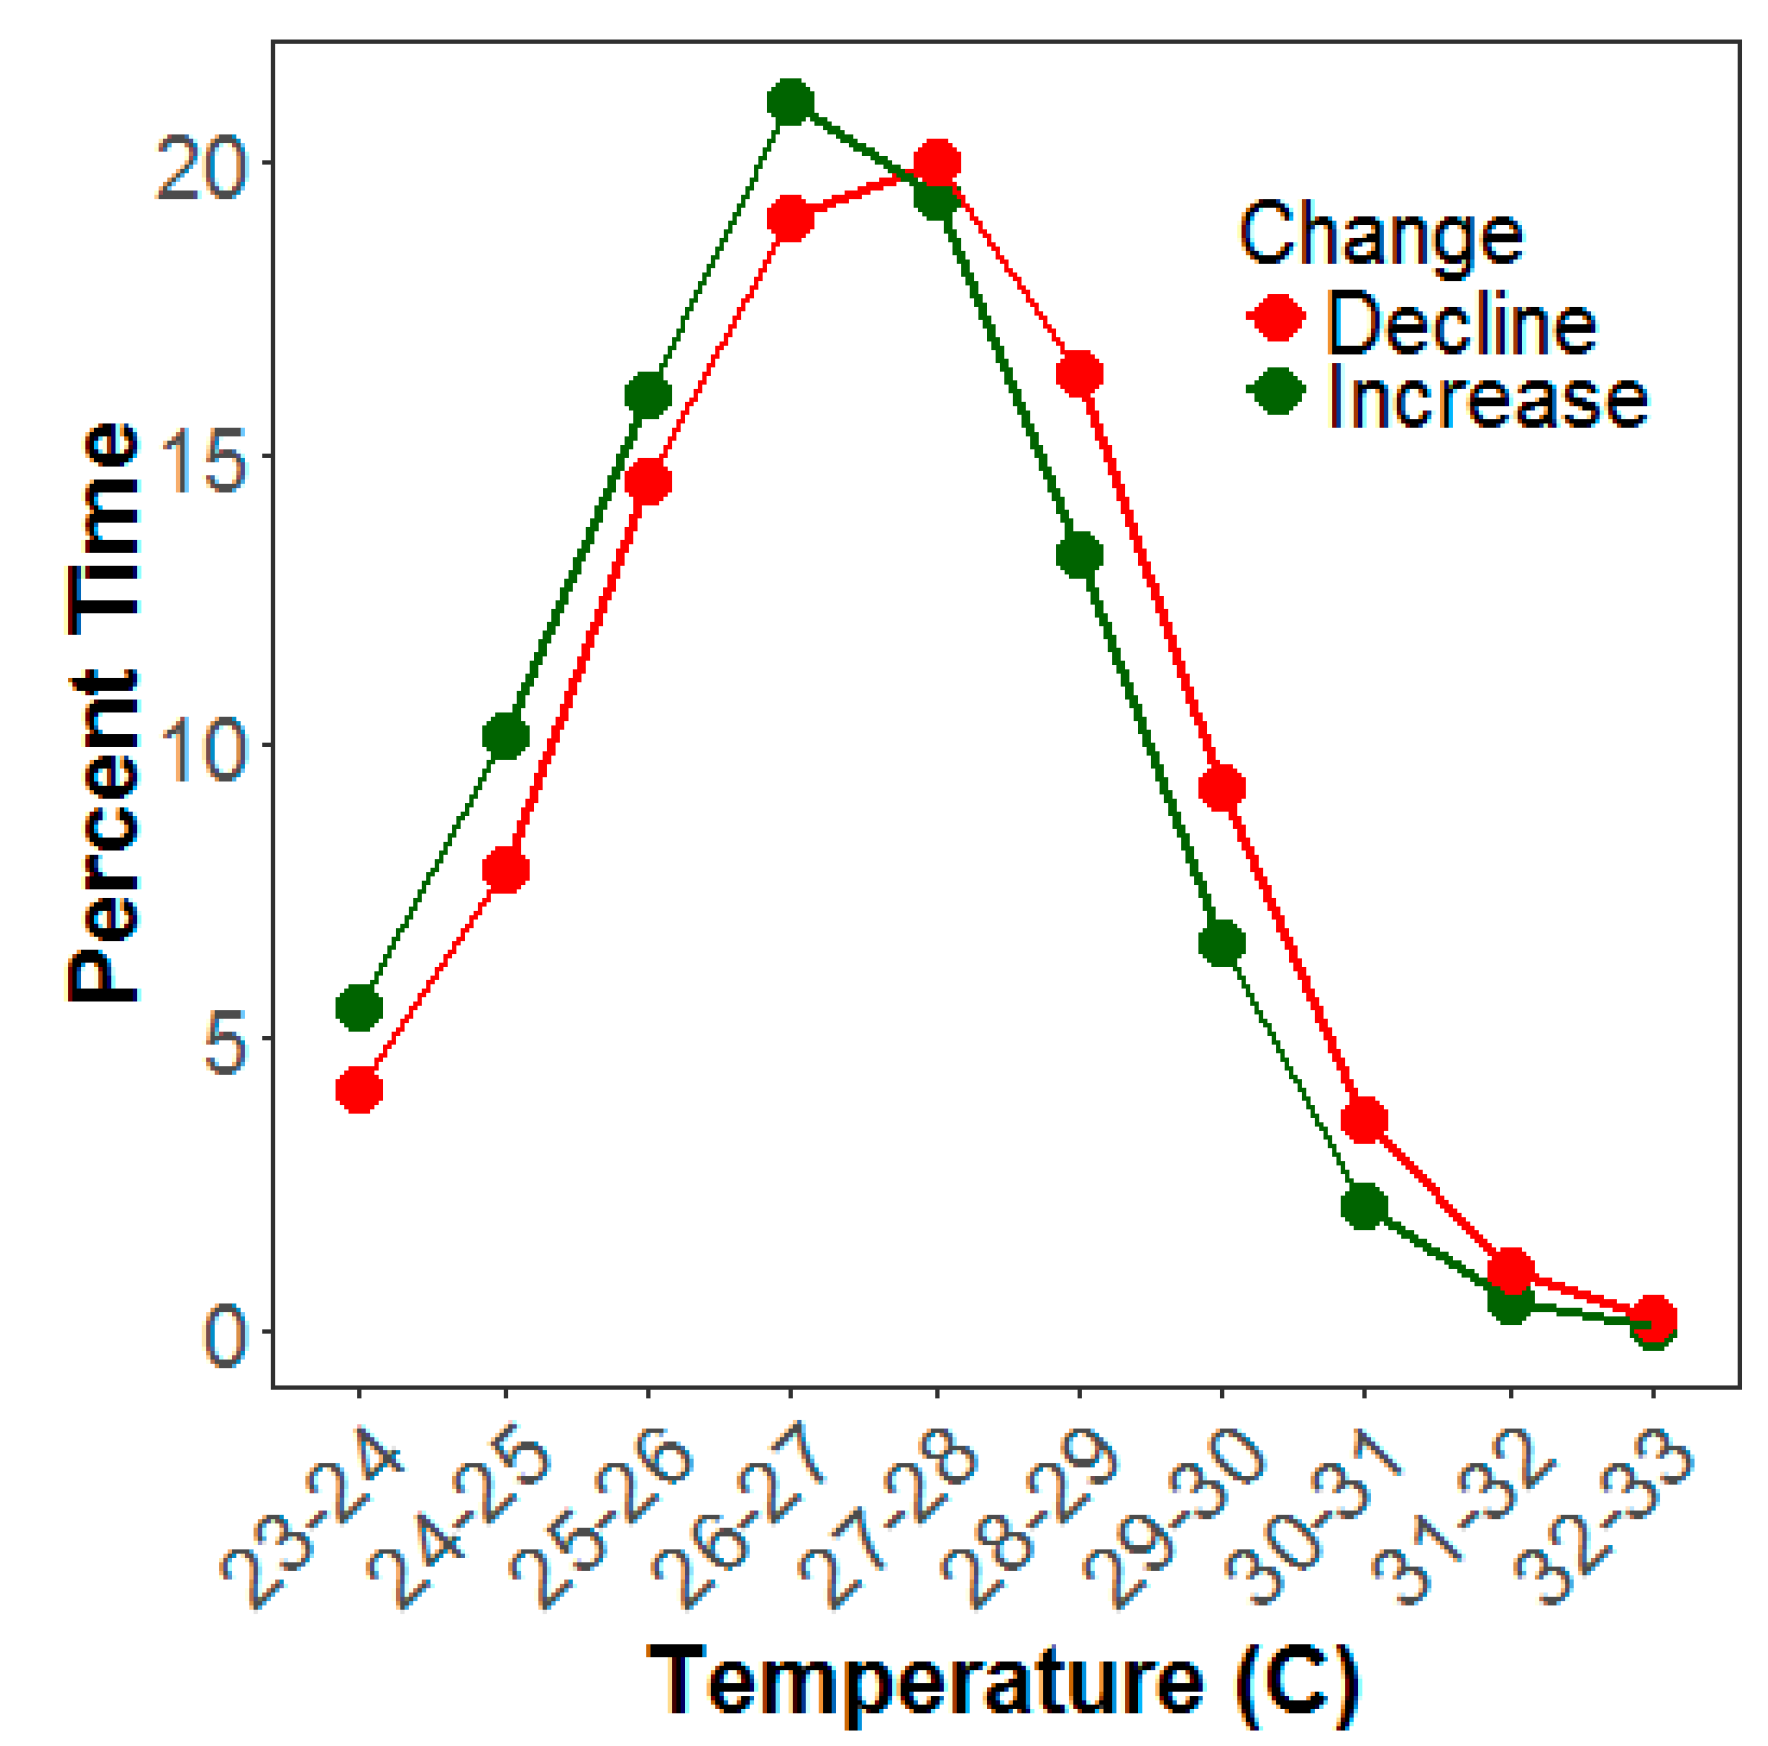
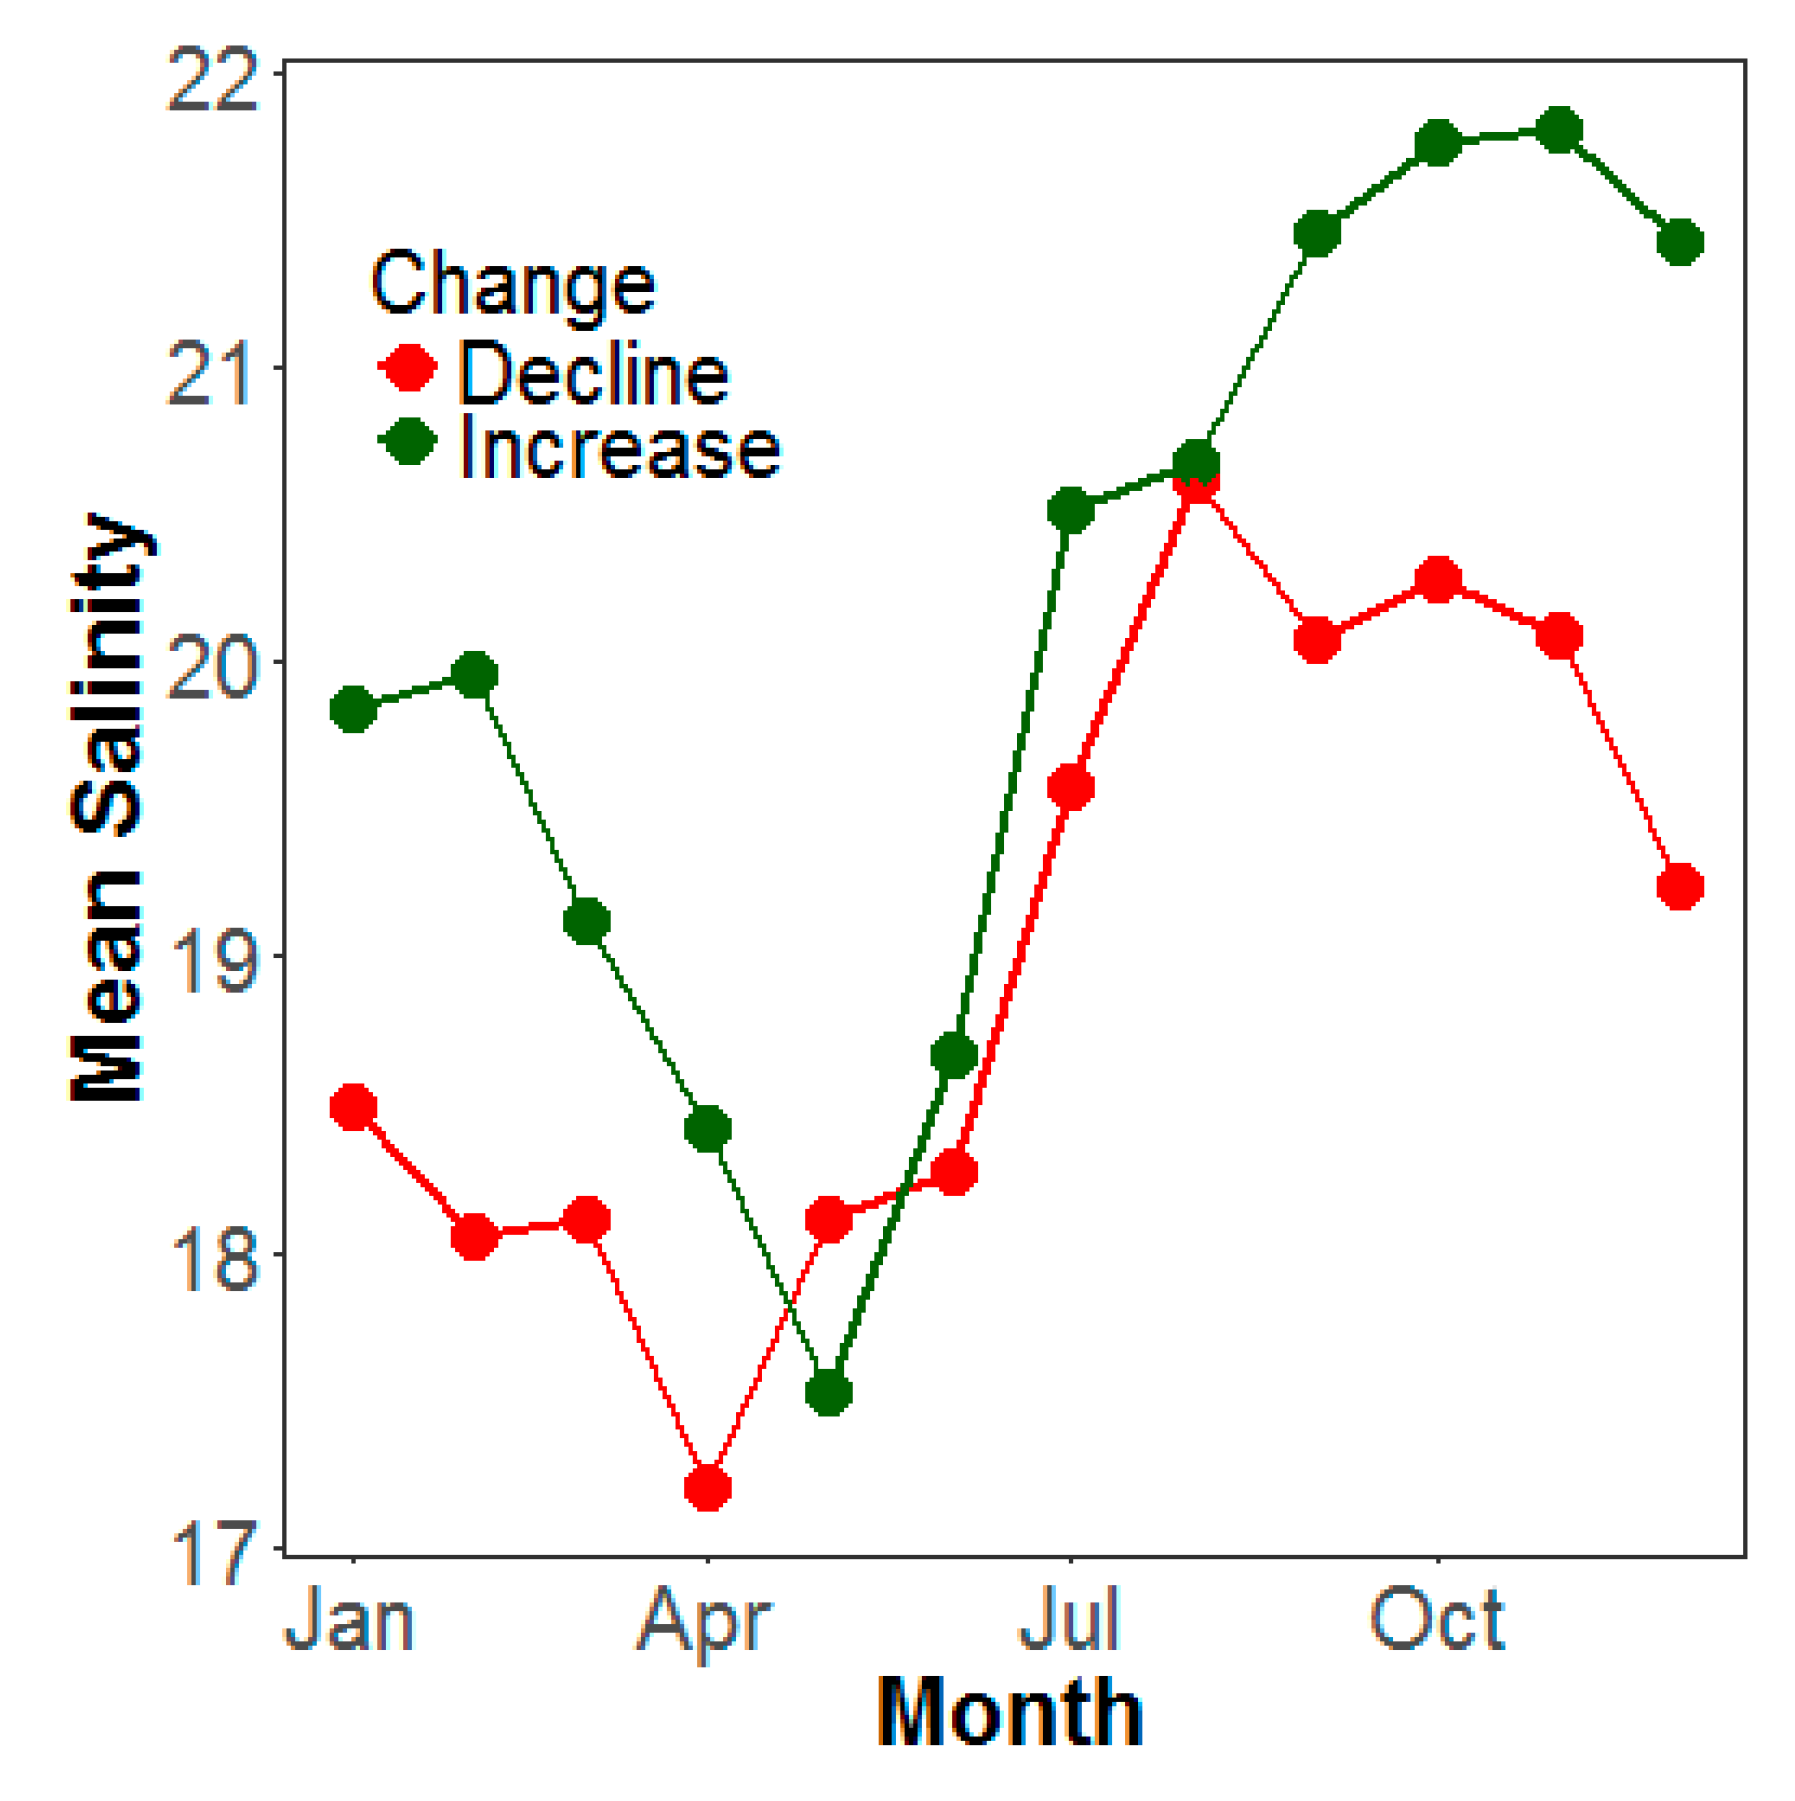
During multi-year periods of seagrass decline, a greater portion of the time was spent at water temperatures above 28 °C compared with periods of increase (Figure 7). During the declining periods, the seagrass spent 31% of the time above this threshold, while periods of seagrass increases spent 23% of the time above 28 °C. Mean salinity was typically lower during declining years, ranging between a minimum of 17.2 in April to a maximum of 20.6 in August, while increasing years ranged between a minimum of 17.5 in May to a maximum of 21.8 in November (Figure 8).
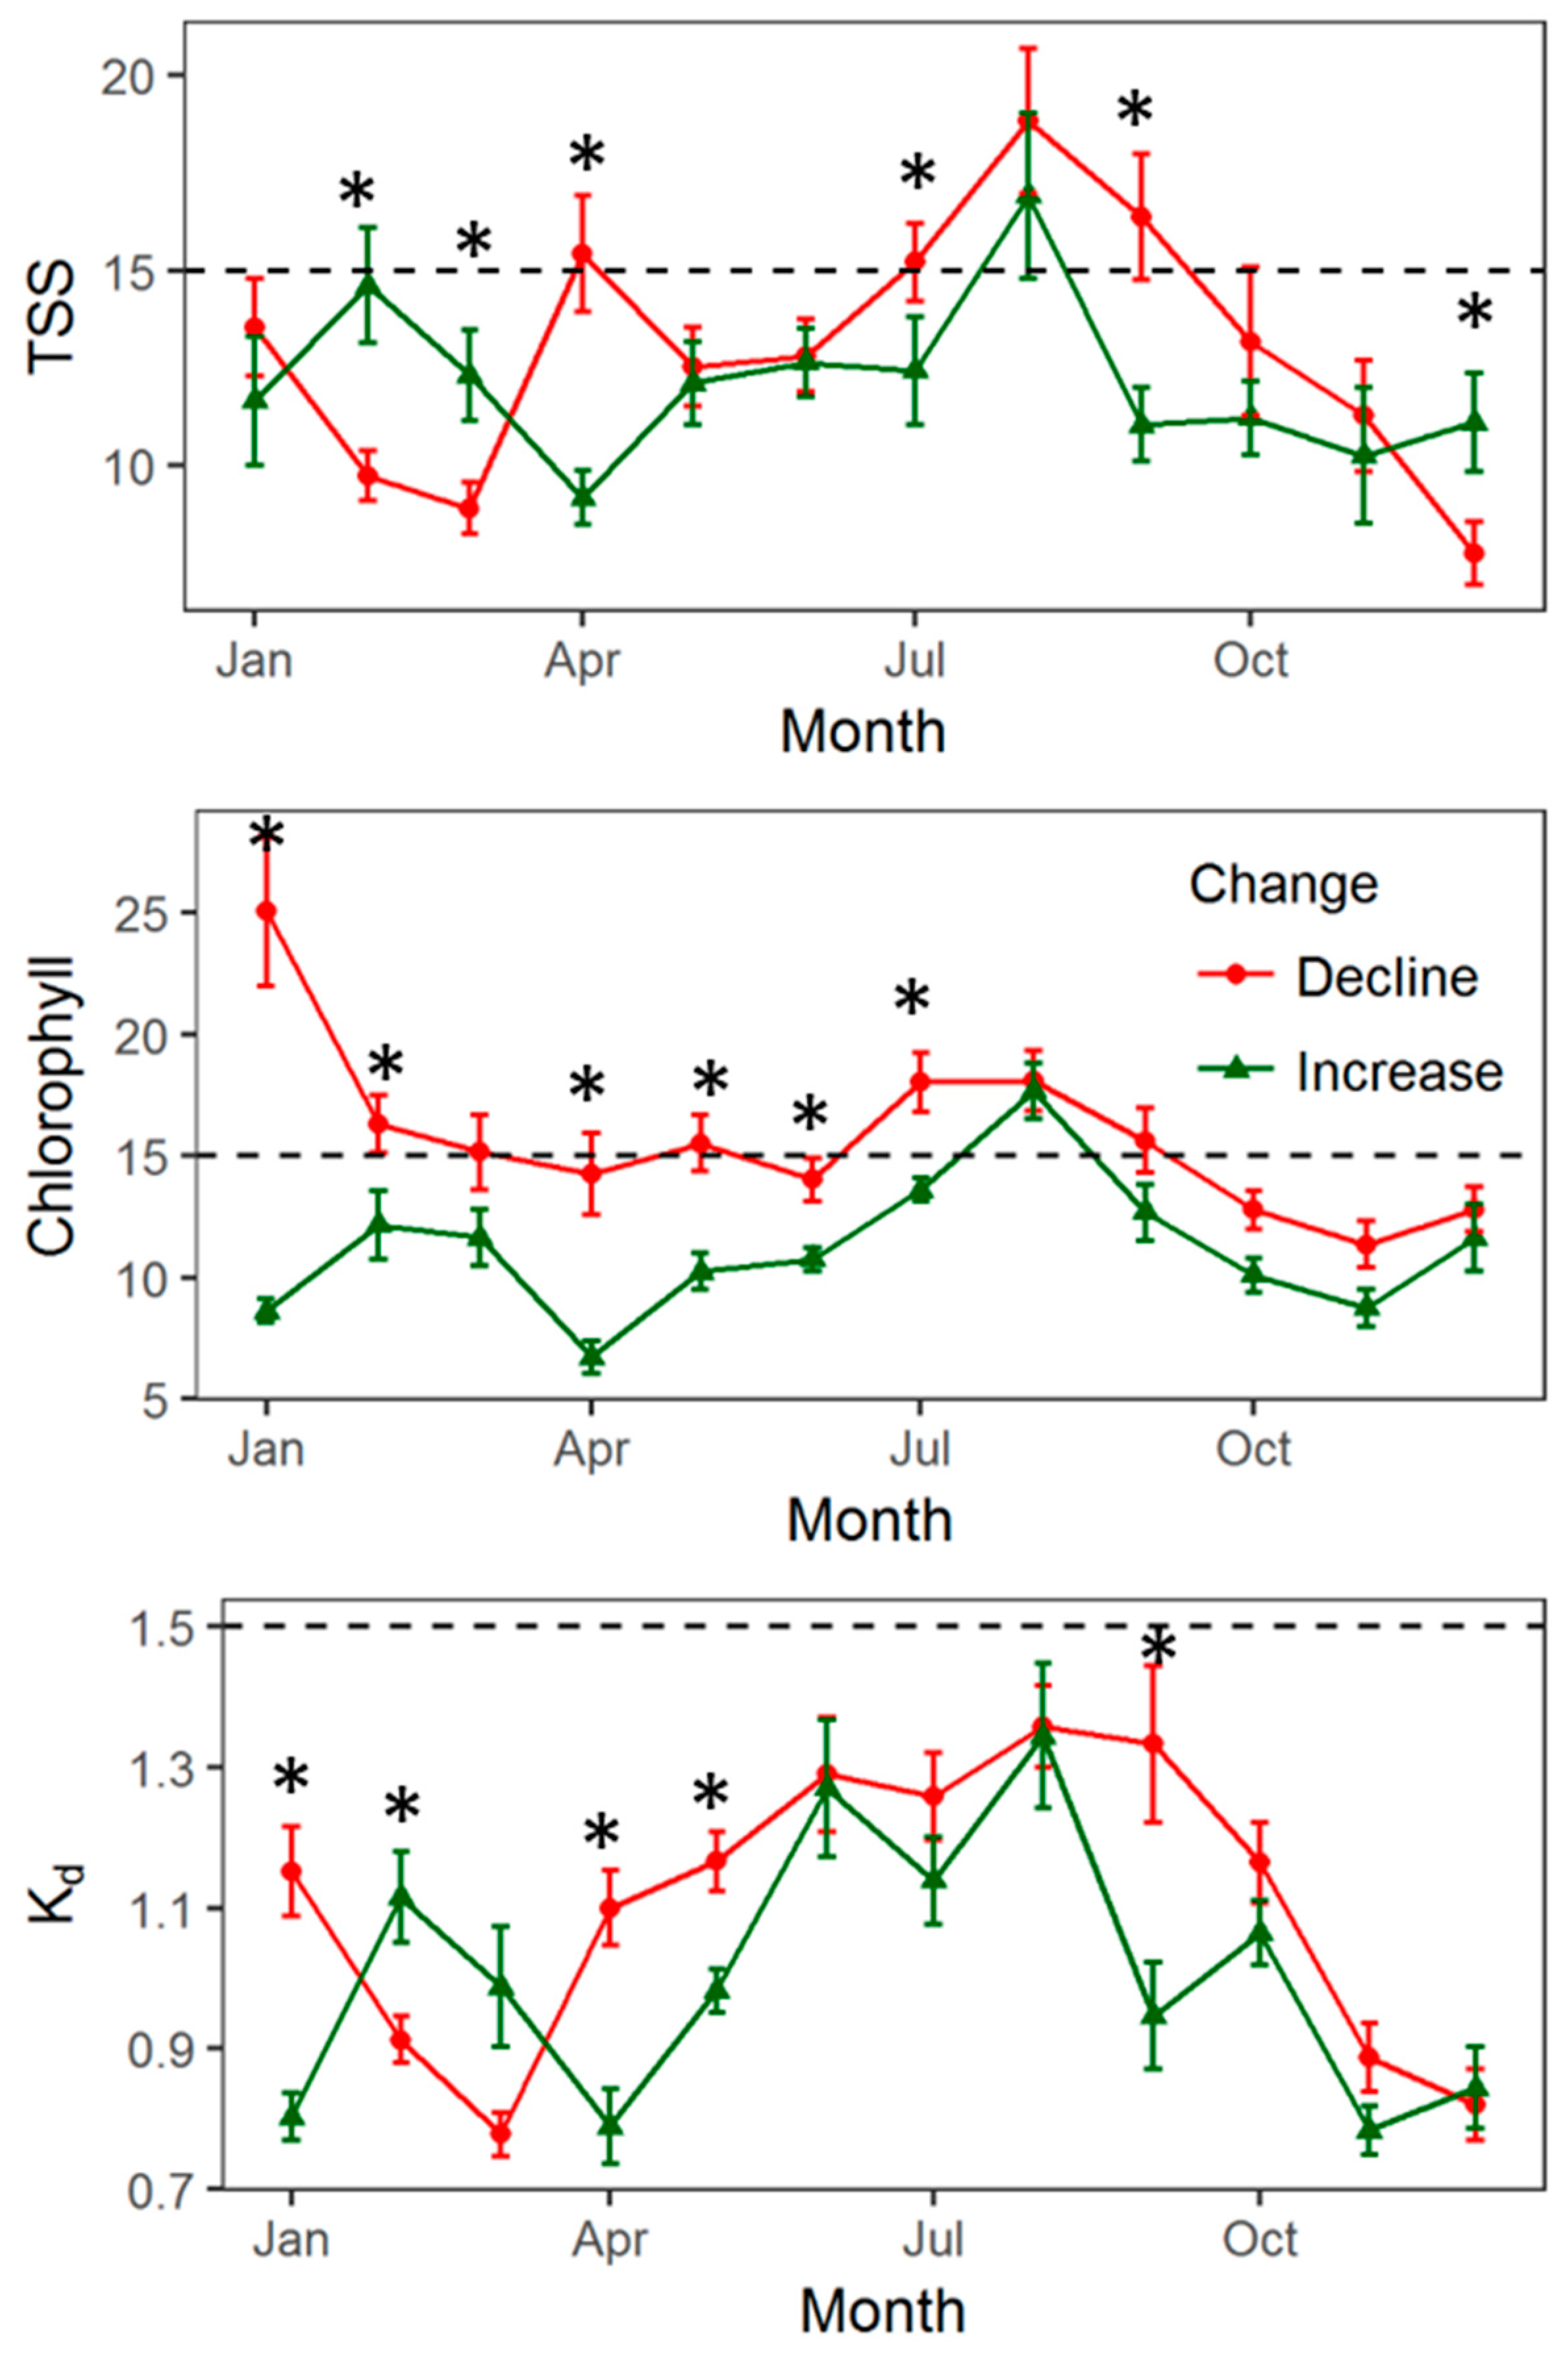
Water quality comparisons during these time periods revealed overall higher TSS, chlorophyll, and Kd during the declining years compared with the recovery years, though this varied some depending on the month of the year (Figure 9). For the water clarity metrics, differences were greatest in April, where declining years had a mean TSS of 15.4 mg L−1 compared with 9.2 for increasing years, a mean chlorophyll of 14.3 µg−1 compared with 6.7, and a mean Kd of 1.1 m−1 compared with 0.80. Although Kd was greater in April during declining years, the absolute light available did not differ, as mean surface PAR readings were not significantly different. Monthly mean tidal height showed no significant trends, and did not differ among declining vs. increasing seagrass years.
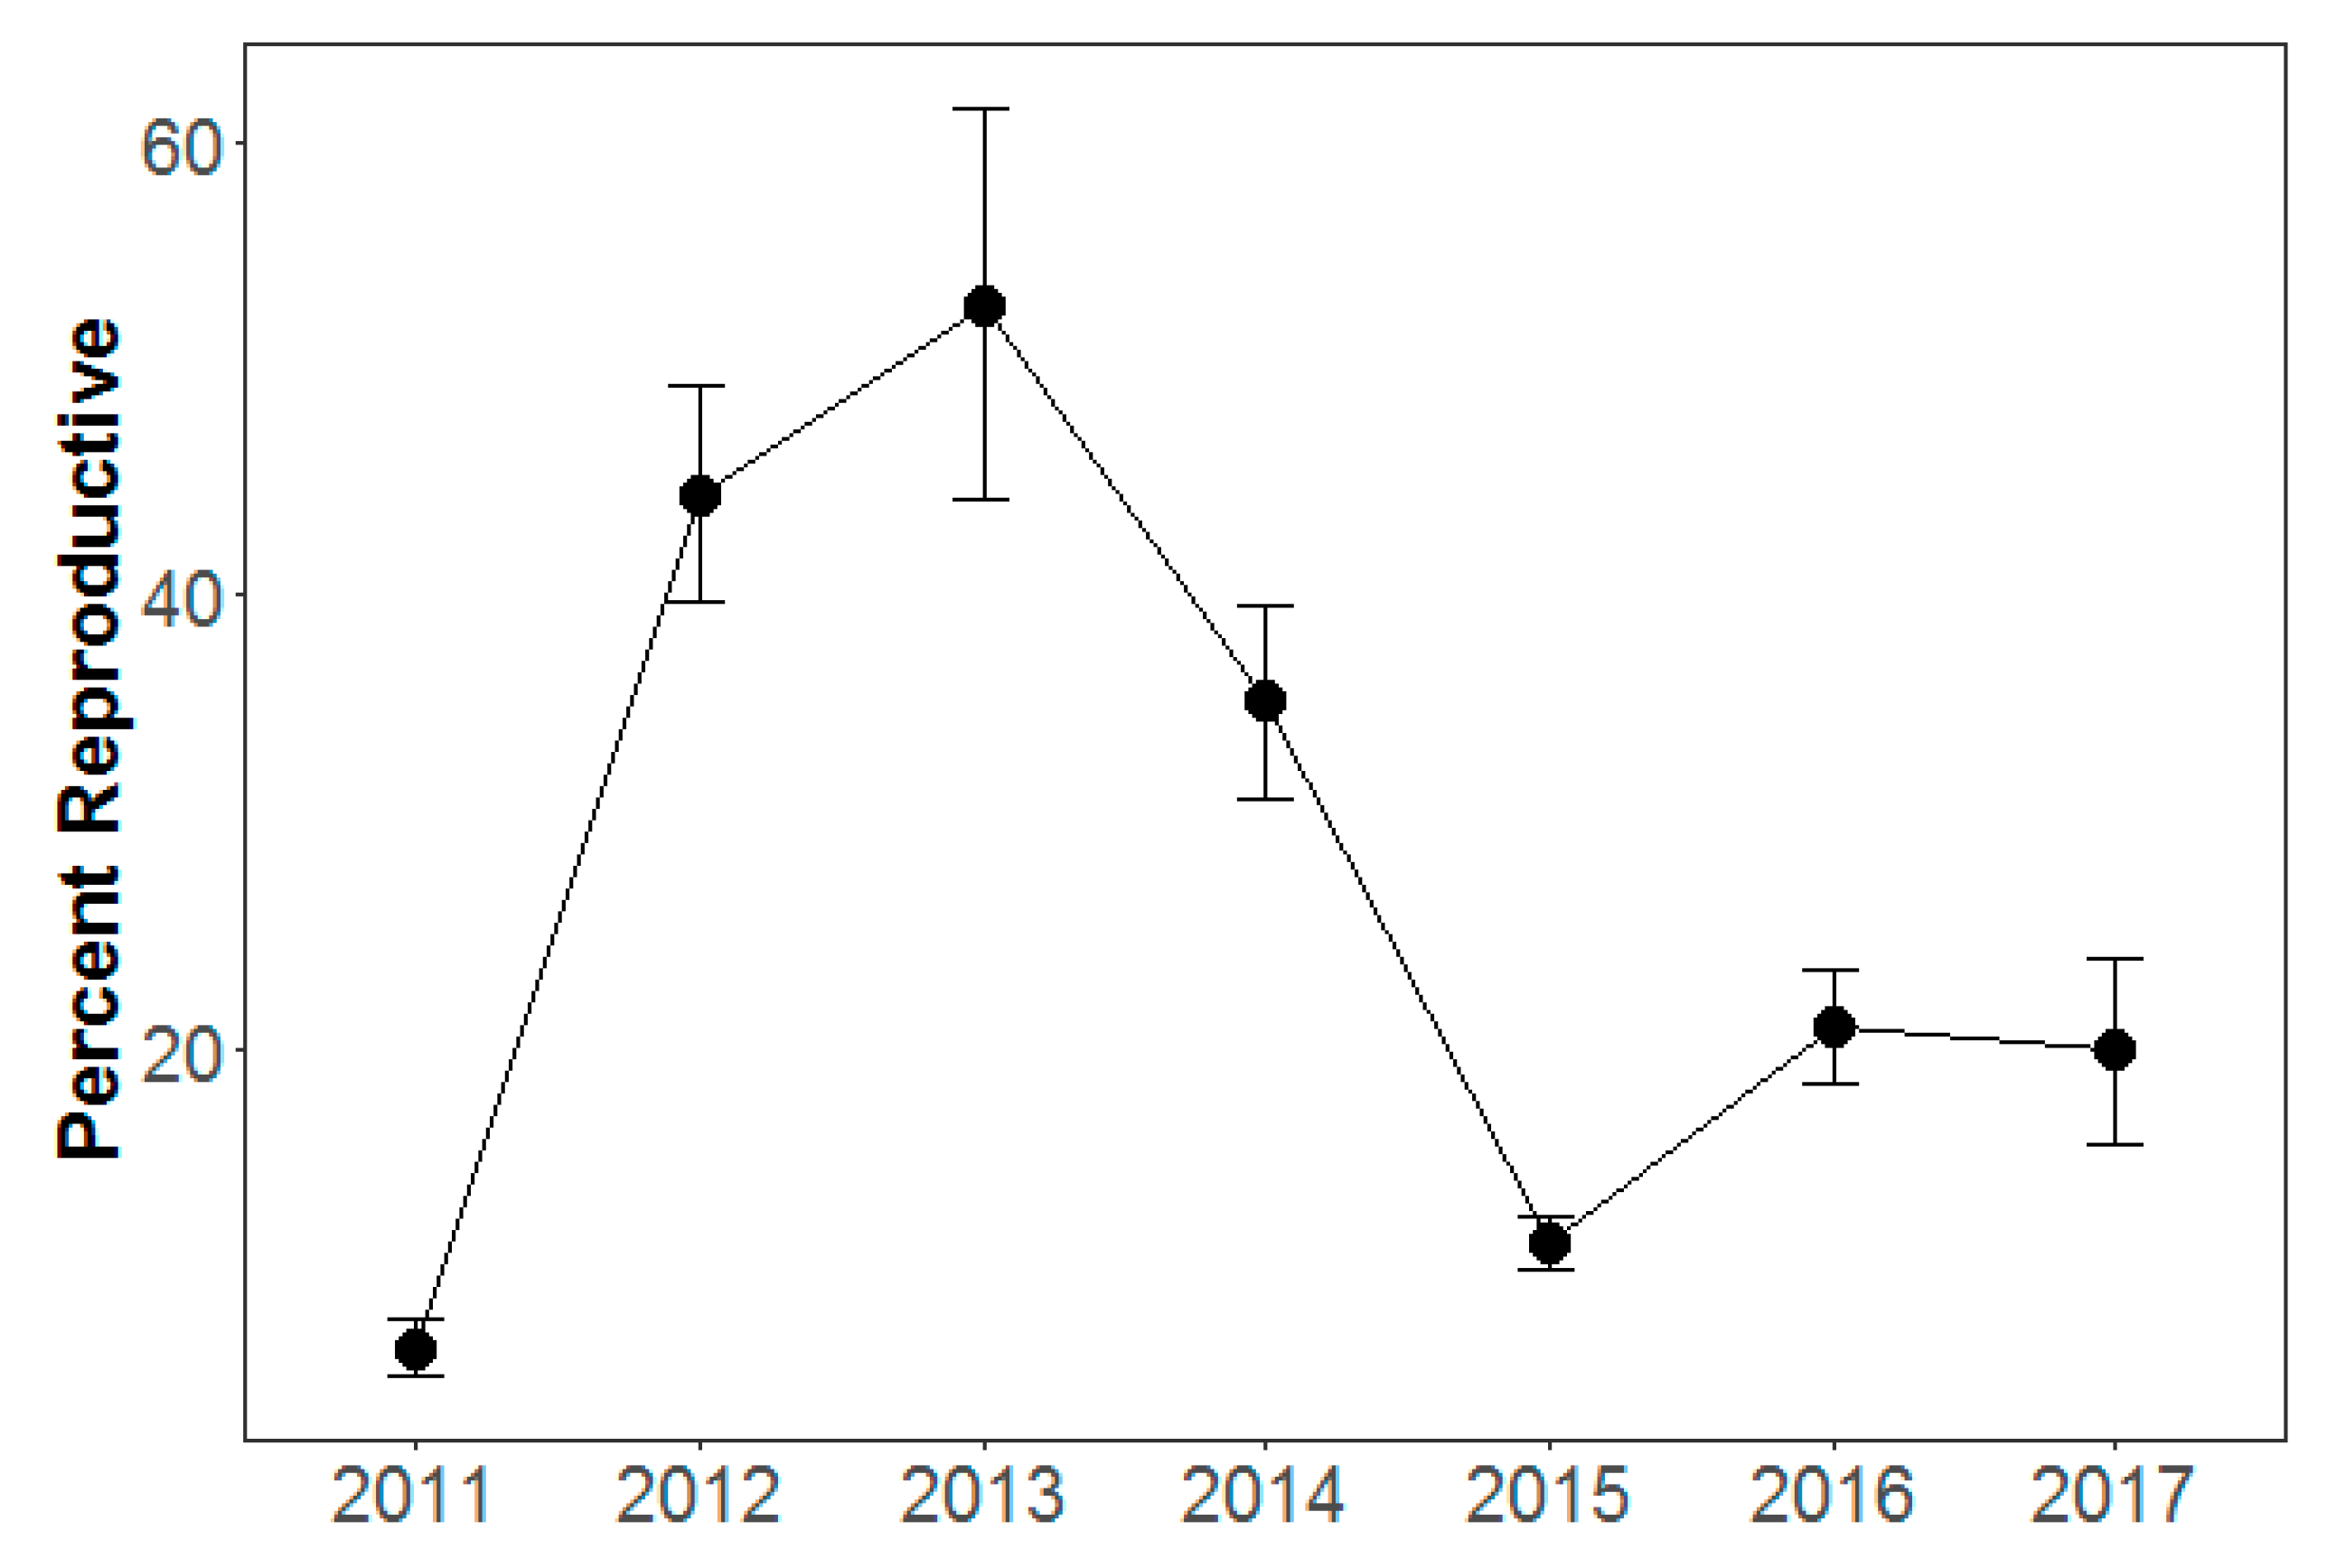
After the 2010 die-off events, there were very few reproductive shoots present in the spring of 2011 (Figure 10). During the bed’s recovery, there was a sharp increase, so that by spring of 2013, a mean of 53% of the shoots were reproductive. This began to decline through 2015, before increasing again after the 2015 die-off event, leveling out at 20% in the spring of 2017.

4. Discussion

This study provided evidence for a climate-induced shift in the seasonal growing pattern of a marine foundational species, Z. marina. We related this shift to an increase in the length of the stressful summer season, impacting the timing of Z. marina’s growth and decline periods. Over the past 20 years, seagrass growing in the York River and Mobjack Bay areas of the Chesapeake Bay have exhibited distinct periods of decline, characterized by higher water temperatures and lower water clarity compared with the periods of seagrass increase and recovery. Signs of seagrass bed resiliency include an increase in Z. marina reproductive effort following declines, as well as an expansion of a second species, R. maritima, into areas previously dominated by Z. marina.

4.1. Growth Pattern

A recent analysis conducted by the University of Maryland’s Horn Point Environmental Laboratory found that spring is starting earlier and fall is starting later in the Chesapeake Bay, with the agricultural growing season having increased by more than 30 days over the last century [34]. When we analyzed the York River temperature data, focusing on a specific definition of the stressful summer season for Z. marina, we found similar results, with the stressful season increasing by 22 days since 1950. These long-term temperature changes are occurring relatively rapidly, and Z. marina has responded by shifting its growth to peak earlier, a phenomenon documented globally in terrestrial plants [35,36,37]. While a longer growing season may benefit many species through enhanced vegetative growth [38,39], species such as Z. marina that are sensitive to elevated temperatures, particularly when growing near their distributional limits, will be impacted negatively. Z. marina total non-structural carbohydrate reserves peak during the spring and early summer in this region, and the plants can survive the stressful summer by relying on these stored reserves [40]. With a longer stressful season and the plants peaking earlier, they are having to rely on these stored reserves for longer periods of time. Historically, Z. marina in this region exhibited a bimodal growth pattern, with a second peak in the fall. Earlier depletions of these carbon reserves combined with the stressful growing season extending later may be why we more recently see little to no fall regrowth once temperatures cool down [20,41].
Along with temporal shifts, spatial shifts in Z. marina growth patterns have been documented as well. With elevated temperatures increasing light requirements, their mean depth has been declining, and the beds have been moving closer to shore [12,42]. Under a combination of anthropogenic stressors and a changing climate, Z. marina is experiencing habitat squeeze both temporally and spatially, with a shorter period of growth when temperatures are tolerable, and a shrinking depth zone where it is able to get enough light.

4.2. Climate and Water Quality Conditions

Water temperatures during declining seagrass years were above 28 °C for a greater portion of the time compared with increasing seagrass years. Seagrass in this area are stressed, with growth rates declining throughout the summer, even at temperatures below this, however this appears to be a critical threshold between plants simply being stressed, and meadows experiencing widespread mortality [21,41].
Clear differences emerged in water clarity metrics when comparing periods of seagrass decline and periods of increase, with the spring and fall periods particularly standing out. April stood out as a month with some of the largest differences among TSS, chlorophyll, and Kd. These water clarity metrics appear to dominate, regardless of absolute light availability or tidal height, which did not differ. The cooler water temperatures compared with the summer, and more available light during the longer days compared with the winter, makes this spring period a critical time for Z. marina to accumulate carbon reserves to survive the stressful summer period when respiration exceeds photosynthesis [40].
Interestingly, all light metrics during this critical spring period met or exceeded the Chesapeake Bay habitat requirements [14,15], even for the periods where seagrass was declining. Kd values were well within the suitable habitat range across all months, even though seagrass was declining during those periods. These habitat requirements were put in place before climate change and elevated water temperatures were viewed as critical components to Z. marina’s growth. This study provides evidence that at least in some instances, these specific water clarity metrics may no longer be applicable in today’s climate. With warmer temperatures, Z. marina requires more light to maintain a positive carbon balance [20,24], so with water temperatures continuing to increase, and the length of the stressful summer season increasing, Z. marina will require more light, especially during the critical spring season, to persist. Additionally, following warming events in which significant seagrass habitat is lost, the bed loses its ability to trap sediment, causing greater resuspension and reduced water clarity, creating a negative feedback loop [21].
Salinity was typically lower during declining seagrass years, with the lowest being in April. This corresponds with the relatively lower water clarity also measured during the spring period, indicating seagrass declines are also associated with higher levels of precipitation. Precipitation is projected to increase in the winter and spring for this area, along with streamflow [43]. With water clarity being particularly important during the spring period, this will likely continue to be a major issue for Z. marina.

4.3. Resiliency

Seagrasses can exhibit resiliency through four dominant biological features, including genetic diversity, species diversity, continuous habitat, and species biological traits [44]. One of the species biological traits for Z. marina that has played a critical role in its recovery is the reliance on sexual reproduction [19,45,46], existing in an annual form in highly stressful environments [47]. In our study area, Z. marina was able to recover from a heat-induced die-off event in 2005 by a large seed germination event, in which the majority of regrowth the following spring occurred via seedlings rather than clonal growth [19]. Our reproductive shoot data provide evidence for the same strategy following the 2010 die-off event, in which a very small percentage of the shoots in the spring of 2011 were reproductive, presumably due to the fact that the majority of the regrowth was from seedlings that do not produce reproductive shoots in their first year of growth [48,49]. Over the next few years, as the bed was in recovery, the reproductive output was increasing, with reproductive shoot densities reaching 53% of total shoot densities three years after the die-off event. This is higher than reported values for this species in the Chesapeake Bay [48,50] and North Carolina [51]. This increase in reproductive output during the first few years following a stressful event may be an adaptive strategy for this species, spending more resources on seed bank development to ensure survival. Four years into the bed’s recovery, reproductive output began to decline to levels more typically seen in this area (11%).
The seagrass beds studied here also exhibited another mechanism for resiliency through species diversity. The interaction between the two species in our system, R. maritima and Z. marina, can be seen as an example of “response diversity”, defined as the “diversity of responses to environmental change among species that contribute to the same ecosystem function” [52]. R. maritima’s ability to rapidly expand and temporarily inhabit areas where Z. marina has declined appears to be critical for the recovery and continuing functionality of these seagrass meadows. A similar example was documented in San Diego, California following an El Niño event, in which R. maritima temporarily replaced Z. marina after it declined due to elevated temperatures [53]. This temporary replacement may enhance the resiliency of these meadows through positive feedback related to sediment trapping and improvements in water clarity, though the extent to which R. maritima can fill this role is not fully understood. Climate change is likely to continue to favor R. maritima expansion, possibly to the detriment of Z. marina [54]. How these two species interact, and what their interaction means in terms of seagrass bed productivity, will continue to be an important area of research.

Author Contributions

Conceptualization, E.C.S., K.A.M., D.B.P.; Data curation, E.C.S., K.A.M., D.B.P.; Formal analysis, E.C.S., D.B.P.; Funding acquisition, K.A.M.; Investigation, E.C.S., K.A.M.; Methodology, E.C.S., K.A.M., D.B.P.; Project administration, E.C.S., K.A.M.; Resources, E.C.S., K.A.M., D.B.P.; Software, E.C.S., D.B.P.; Supervision, E.C.S., K.A.M.; Validation, E.C.S., K.A.M., D.B.P.; Writing—original draft, E.C.S., K.A.M., D.B.P.; Writing—review and editing, E.C.S., K.A.M., D.B.P.

Funding

This research was funded over multiple years, in part, through grants from the National Oceanic and Atmospheric Administration, U.S. Department of Commerce, to the Chesapeake Bay National Estuarine Research Reserve in Virginia, with additional internal support provided by the Virginia Institute of Marine Science, School of Marine Science, College of William and Mary.

Acknowledgments

We would like to thank the staff at CBNERR for all of the field and lab support, without which none of this would be possible. This paper is Contribution No. 3792 of the Virginia Institute of Marine Science, College of William and Mary.

Conflicts of Interest

The authors declare no conflict of interest.

References

  1. Walther, G.R.; Post, E.; Convey, P.; Menzel, A.; Parmesan, C.; Beebee, T.J.C.; Fromentin, J.M.; Hoegh-Guldberg, O.; Bairlein, F. Ecological responses to recent climate change. Nature 2002, 416, 389–395. [Google Scholar] [CrossRef] [PubMed]
  2. Gottfried, M.; Pauli, H.; Futschik, A.; Akhalkatsi, M.; Barančok, P.; Benito Alonso, J.L.; Coldea, G.; Dick, J.; Erschbamer, B.; Fernández Calzado, M.R.; et al. Continent-wide response of mountain vegetation to climate change. Nat. Clim. Chang. 2012, 2, 111–115. [Google Scholar] [CrossRef]
  3. Menzel, A.; Estrella, N.; Fabian, P. Spatial and temporal variability of the phenological seasons in Germany from 1951 to 1996. Glob. Chang. Biol. 2001, 7, 657–666. [Google Scholar] [CrossRef]
  4. Bradley, N.L.; Leopold, A.C.; Ross, J.; Huffaker, W. Phenological changes reflect climate change in Wisconsin. Proc. Natl. Acad. Sci. USA 1999, 96, 9701–9704. [Google Scholar] [CrossRef] [PubMed] [Green Version]
  5. Overpeck, J.T.; Rind, D.; Goldberg, R. Climate-induced changes in forest disturbance and vegetation. Nature 1990, 343, 51–53. [Google Scholar] [CrossRef]
  6. Orth, R.J.; Carruthers, T.J.B.; Dennison, W.C.; Duarte, C.M.; Fourqurean, J.W.; Heck, K.L.; Hughes, A.R.; Kendrick, G.A.; Kenworthy, W.J.; Olyarnik, S.; et al. A Global Crisis for Seagrass Ecosystems. BioScience 2006, 56, 987–996. [Google Scholar] [CrossRef] [Green Version]
  7. Waycott, M.; Duarte, C.M.; Carruthers, T.J.B.; Orth, R.J.; Dennison, W.C.; Olyarnik, S.; Calladine, A.; Fourqurean, J.W.; Heck, K.L.; Hughes, A.R.; et al. Accelerating loss of seagrasses across the globe threatens coastal ecosystems. Proc. Natl. Acad. Sci. USA 2009, 106, 12377. [Google Scholar] [CrossRef] [PubMed] [Green Version]
  8. Vaudrey, J.M.P.; Kremer, J.N.; Branco, B.F.; Short, F.T. Eelgrass recovery after nutrient enrichment reversal. Aquat. Bot. 2010, 93, 237–243. [Google Scholar] [CrossRef]
  9. Short, F.T.; Coles, R.; Fortes, M.D.; Victor, S.; Salik, M.; Isnain, I.; Andrew, J.; Seno, A. Monitoring in the Western Pacific region shows evidence of seagrass decline in line with global trends. Mar. Pollut. Bull. 2014, 83, 408–416. [Google Scholar] [CrossRef] [PubMed]
  10. Short, F.T.; Neckles, H.A. The effects of global climate change on seagrasses. Aquat. Bot. 1999, 63, 169–196. [Google Scholar] [CrossRef]
  11. Jordà, G.; Marbà, N.; Duarte, C.M. Mediterranean seagrass vulnerable to regional climate warming. Nat. Clim. Chang. 2012, 2, 821–824. [Google Scholar] [CrossRef] [Green Version]
  12. Lefcheck, J.S.; Wilcox, D.J.; Murphy, R.R.; Marion, S.R.; Orth, R.J. Multiple stressors threaten the imperiled coastal foundation species eelgrass (Zostera marina) in Chesapeake Bay, USA. Glob. Chang. Biol. 2017, 23, 3474–3483. [Google Scholar] [CrossRef] [PubMed]
  13. Orth, R.J.; Moore, K.A. Chesapeake Bay: An Unprecedented Decline in Submerged Aquatic Vegetation. Science 1983, 222, 51–53. [Google Scholar] [CrossRef] [PubMed]
  14. Batiuk, R.A.; Orth, R.J.; Moore, K.A.; Dennison, W.C.; Stevenson, J.C.; Staver, L.W.; Carter, V.; Rybicki, N.B.; Hickman, R.E.; Kollar, S.; et al. Chesapeake Bay Submerged Aquatic Vegetation Habitat Requirements and Restoration Targets: A Technical Synthesis; Chesapeake Bay Program; EPA: Annapolis, MD, USA, 1992; 170p. [Google Scholar]
  15. Batiuk, R.; Bergstrom, P.; Kemp, M.; Koch, E.; Murray, L.; Stevenson, C.; Bartleson, R.; Carter, V.; Rybicki, N.; Landwehr, J.; et al. Chesapeake Bay Submerged Aquatic Vegetation Water Quality and Habitat-Based Requirements and Restoration Targets: A Second Technical Synthesis; Chesapeake Bay Program; EPA: Annapolis, MD, USA, 2000; 220p. [Google Scholar]
  16. Orth, R.J.; Dennison, W.C.; Lefcheck, J.S.; Gurbisz, C.; Hannam, M.; Keisman, J.; Landry, J.B.; Moore, K.A.; Murphy, R.R.; Patrick, C.J.; et al. Submersed Aquatic Vegetation in Chesapeake Bay: Sentinel Species in a Changing World. BioScience 2017, 67, 698–712. [Google Scholar] [CrossRef]
  17. Moore, K.A.; Wilcox, D.J.; Orth, R.J. Analysis of the Abundance of Submersed Aquatic Vegetation Communities in the Chesapeake Bay. Estuaries 2000, 23, 115. [Google Scholar] [CrossRef]
  18. Koch, E.W.; Orth, R.J. Seagrasses of the Mid-Atlantic Coast of the United States. In World Atlas of Seagrasses; Green, E.P., Short, F.T., Eds.; University of California Press: Berkeley, CA, USA, 2003; pp. 216–223. ISBN 0520240472. [Google Scholar]
  19. Jarvis, J.C.; Moore, K.A. The role of seedlings and seed bank viability in the recovery of Chesapeake Bay, USA, Zostera marina populations following a large-scale decline. Hydrobiologia 2010, 649, 55–68. [Google Scholar] [CrossRef]
  20. Moore, K.A.; Shields, E.C.; Parrish, D.B. Impacts of Varying Estuarine Temperature and Light Conditions on Zostera marina (Eelgrass) and its Interactions with Ruppia maritima (Widgeongrass). Estuar. Coasts 2014, 37, 20–30. [Google Scholar] [CrossRef]
  21. Carr, J.A.; D’Odorico, P.; McGlathery, K.J.; Wiberg, P.L. Modeling the effects of climate change on eelgrass stability and resilience: Future scenarios and leading indicators of collapse. Mar. Ecol. Prog. Ser. 2012, 448, 289–301. [Google Scholar] [CrossRef]
  22. Abe, M.; Kurashima, A.; Maegawa, M. Temperature requirements for seed germination and seedling growth of Zostera marina from central Japan. Fish. Sci. 2008, 74, 589–593. [Google Scholar] [CrossRef]
  23. Moore, K.A.; Jarvis, J.C. Environmental Factors Affecting Recent Summertime Eelgrass Diebacks in the Lower Chesapeake Bay: Implications for Long-term Persistence. J. Coast. Res. 2008, 135–147. [Google Scholar] [CrossRef]
  24. Marsh, J.A.; Dennison, W.C.; Alberte, R.S. Effects of temperature on photosynthesis and respiration in eelgrass (Zostera marina L.). J. Exp. Mar. Biol. Ecol. 1986, 101, 257–267. [Google Scholar] [CrossRef]
  25. Moore, K.A.; Wetzel, R.L.; Orth, R.J. Seasonal pulses of turbidity and their relations to eelgrass (Zostera marina L.) survival in an estuary. J. Exp. Mar. Biol. Ecol. 1997, 215, 115–134. [Google Scholar] [CrossRef]
  26. Holmer, M.; Bondgaard, E.J. Photosynthetic and growth response of eelgrass to low oxygen and high sulfide concentrations during hypoxic events. Aquat. Bot. 2001, 70, 29–38. [Google Scholar] [CrossRef]
  27. Holmer, M.; Hasler-Sheetal, H. Sulfide intrusion in seagrasses assessed by stable sulfur isotopes—A synthesis of current results. Front. Mar. Sci. 2014, 1, 64. [Google Scholar] [CrossRef]
  28. Orth, R.J.; Marion, S.R.; Moore, K.A.; Wilcox, D.J. Eelgrass (Zostera marina L.) in the Chesapeake Bay Region of Mid-Atlantic Coast of the USA: Challenges in Conservation and Restoration. Estuar. Coasts 2010, 33, 139–150. [Google Scholar] [CrossRef]
  29. Moore, K.A. Influence of seagrasses on water quality in shallow regions of the lower Chesapeake Bay. J. Coast. Res. 2004, 45, 162–178. [Google Scholar] [CrossRef]
  30. SAV in Chesapeake Bay and Coastal Bays. Available online: http://web.vims.edu/bio/sav/index.html (accessed on 16 August 2018).
  31. Virginia Estuarine and Coastal Observing System (VECOS). Available online: http://web2.vims.edu/vecos/ (accessed on 16 August 2018).
  32. Shoaf, W.T.; Lium, B.W. Improved extraction of chlorophyll a and b from algae using dimethyl sulfoxide. Limnol. Oceanogr. 1976, 21, 926–928. [Google Scholar] [CrossRef]
  33. RStudio Team. Integrated Development for RStudio; RStudio Inc.: Boston, MA, USA, 2016; Available online: http://www.rstudio.com/ (accessed on 6 January 2018).
  34. Changing Chesapeake. Available online: http://www.chesapeakedata.com/changingchesapeake/ (accessed on 16 August 2018).
  35. Menzel, A. Trends in phenological phases in Europe between 1951 and 1996. Int. J. Biometeorol. 2000, 44, 76–81. [Google Scholar] [CrossRef] [PubMed]
  36. Abu-Asab, M.S.; Peterson, P.M.; Shetler, S.G.; Orli, S.S. Earlier plant flowering in spring as a response to global warming in the Washington, DC, area. Biodivers. Conserv. 2001, 10, 597–612. [Google Scholar] [CrossRef] [Green Version]
  37. Ho, C.-H.; Lee, E.-J.; Lee, I.; Jeong, S.-J. Earlier spring in Seoul, Korea. Int. J. Climatol. 2006, 26, 2117–2127. [Google Scholar] [CrossRef] [Green Version]
  38. Linderholm, H.W. Growing season changes in the last century. Agric. For. Meteorol. 2006, 137, 1–14. [Google Scholar] [CrossRef]
  39. Piao, S.; Friedlingstein, P.; Ciais, P.; Viovy, N.; Demarty, J. Growing season extension and its impact on terrestrial carbon cycle in the Northern Hemisphere over the past 2 decades. Glob. Biogeochem. Cycles 2007, 21. [Google Scholar] [CrossRef] [Green Version]
  40. Burke, M.K.; Dennison, W.C.; Moore, K.A. Non-structural carbohydrate reserves of eelgrass Zostera marina. Mar. Ecol. Prog. Ser. 1996, 137, 195–201. [Google Scholar] [CrossRef]
  41. Shields, E.C.; Moore, K.A.; Parrish, D.B. Short-term temperature stress results in seagrass community shift in a temperate estuary. Estuar. Coasts 2018. under review. [Google Scholar]
  42. Boström, C.; Baden, S.; Bockelmann, A.-C.; Dromph, K.; Fredriksen, S.; Gustafsson, C.; Krause-Jensen, D.; Möller, T.; Nielsen, S.L.; Olesen, B.; et al. Distribution, structure and function of Nordic eelgrass (Zostera marina) ecosystems: Implications for coastal management and conservation. Aquat. Conserv. Mar. Freshw. Ecosyst. 2014, 24, 410–434. [Google Scholar] [CrossRef] [PubMed] [Green Version]
  43. Najjar, R.G.; Pyke, C.R.; Adams, M.B.; Breitburg, D.; Hershner, C.; Kemp, M.; Howarth, R.; Mulholland, M.R.; Paolisso, M.; Secor, D.; et al. Potential climate-change impacts on the Chesapeake Bay. Estuar. Coast. Shelf Sci. 2010, 86, 1–20. [Google Scholar] [CrossRef]
  44. Unsworth, R.K.F.; Collier, C.J.; Waycott, M.; Mckenzie, L.J.; Cullen-Unsworth, L.C. A framework for the resilience of seagrass ecosystems. Mar. Pollut. Bull. 2015, 100, 34–46. [Google Scholar] [CrossRef] [PubMed]
  45. Plus, M.; Deslous-Paoli, J.-M.; Dagault, F. Seagrass (Zostera marina L.) bed recolonisation after anoxia-induced full mortality. Aquat. Bot. 2003, 77, 121–134. [Google Scholar] [CrossRef]
  46. Greve, T.M.; Krause-Jensen, D.; Rasmussen, M.B.; Christensen, P.B. Means of rapid eelgrass (Zostera marina L.) recolonisation in former dieback areas. Aquat. Bot. 2005, 82, 143–156. [Google Scholar] [CrossRef]
  47. Jarvis, J.C.; Moore, K.A.; Kenworthy, W.J. Characterization and ecological implication of eelgrass life history strategies near the species’ southern limit in the western North Atlantic. Mar. Ecol. Prog. Ser. 2012, 444, 43–56. [Google Scholar] [CrossRef] [Green Version]
  48. Silberhorn, G.M.; Orth, R.J.; Moore, K.A. Anthesis and seed production in Zostera marina L. (eelgrass) from the Chesapeake Bay. Aquat. Bot. 1983, 15, 133–144. [Google Scholar] [CrossRef]
  49. Orth, R.J.; Moore, K.A. Seasonal and year-to-year variations in the growth of Zostera marina L. (eelgrass) in the lower Chesapeake Bay. Aquat. Bot. 1986, 24, 335–341. [Google Scholar] [CrossRef]
  50. Johnson, A.J.; Moore, K.A.; Orth, R.J. The influence of resource availability on flowering intensity in Zostera marina (L.). J. Exp. Mar. Biol. Ecol. 2017, 490, 13–22. [Google Scholar] [CrossRef]
  51. Jarvis, J.C.; Moore, K.A.; Kenworthy, W.J. Persistence of Zostera marina L. (eelgrass) seeds in the sediment seed bank. J. Exp. Mar. Biol. Ecol. 2014, 459, 126–136. [Google Scholar] [CrossRef]
  52. Elmqvist, T.; Folke, C.; Nyström, M.; Peterson, G.; Bengtsson, J.; Walker, B.; Norberg, J. Response diversity, ecosystem change, and resilience. Front. Ecol. Environ. 2003, 1, 488–494. [Google Scholar] [CrossRef] [Green Version]
  53. Johnson, M.R.; Williams, S.L.; Lieberman, C.H.; Solbak, A. Changes in the abundance of the seagrasses Zostera marina L. (eelgrass) and Ruppia maritima L. (widgeongrass) in San Diego, California, following and El Niño Event. Estuaries 2003, 26, 106. [Google Scholar] [CrossRef]
  54. Richardson, J.P.; Lefcheck, J.S.; Orth, R.J. Warming temperatures alter the relative abundance and distribution of two co-occurring foundational seagrasses in Chesapeake Bay, USA. Mar. Ecol. Prog. Ser. 2018, 599, 65–74. [Google Scholar] [CrossRef]
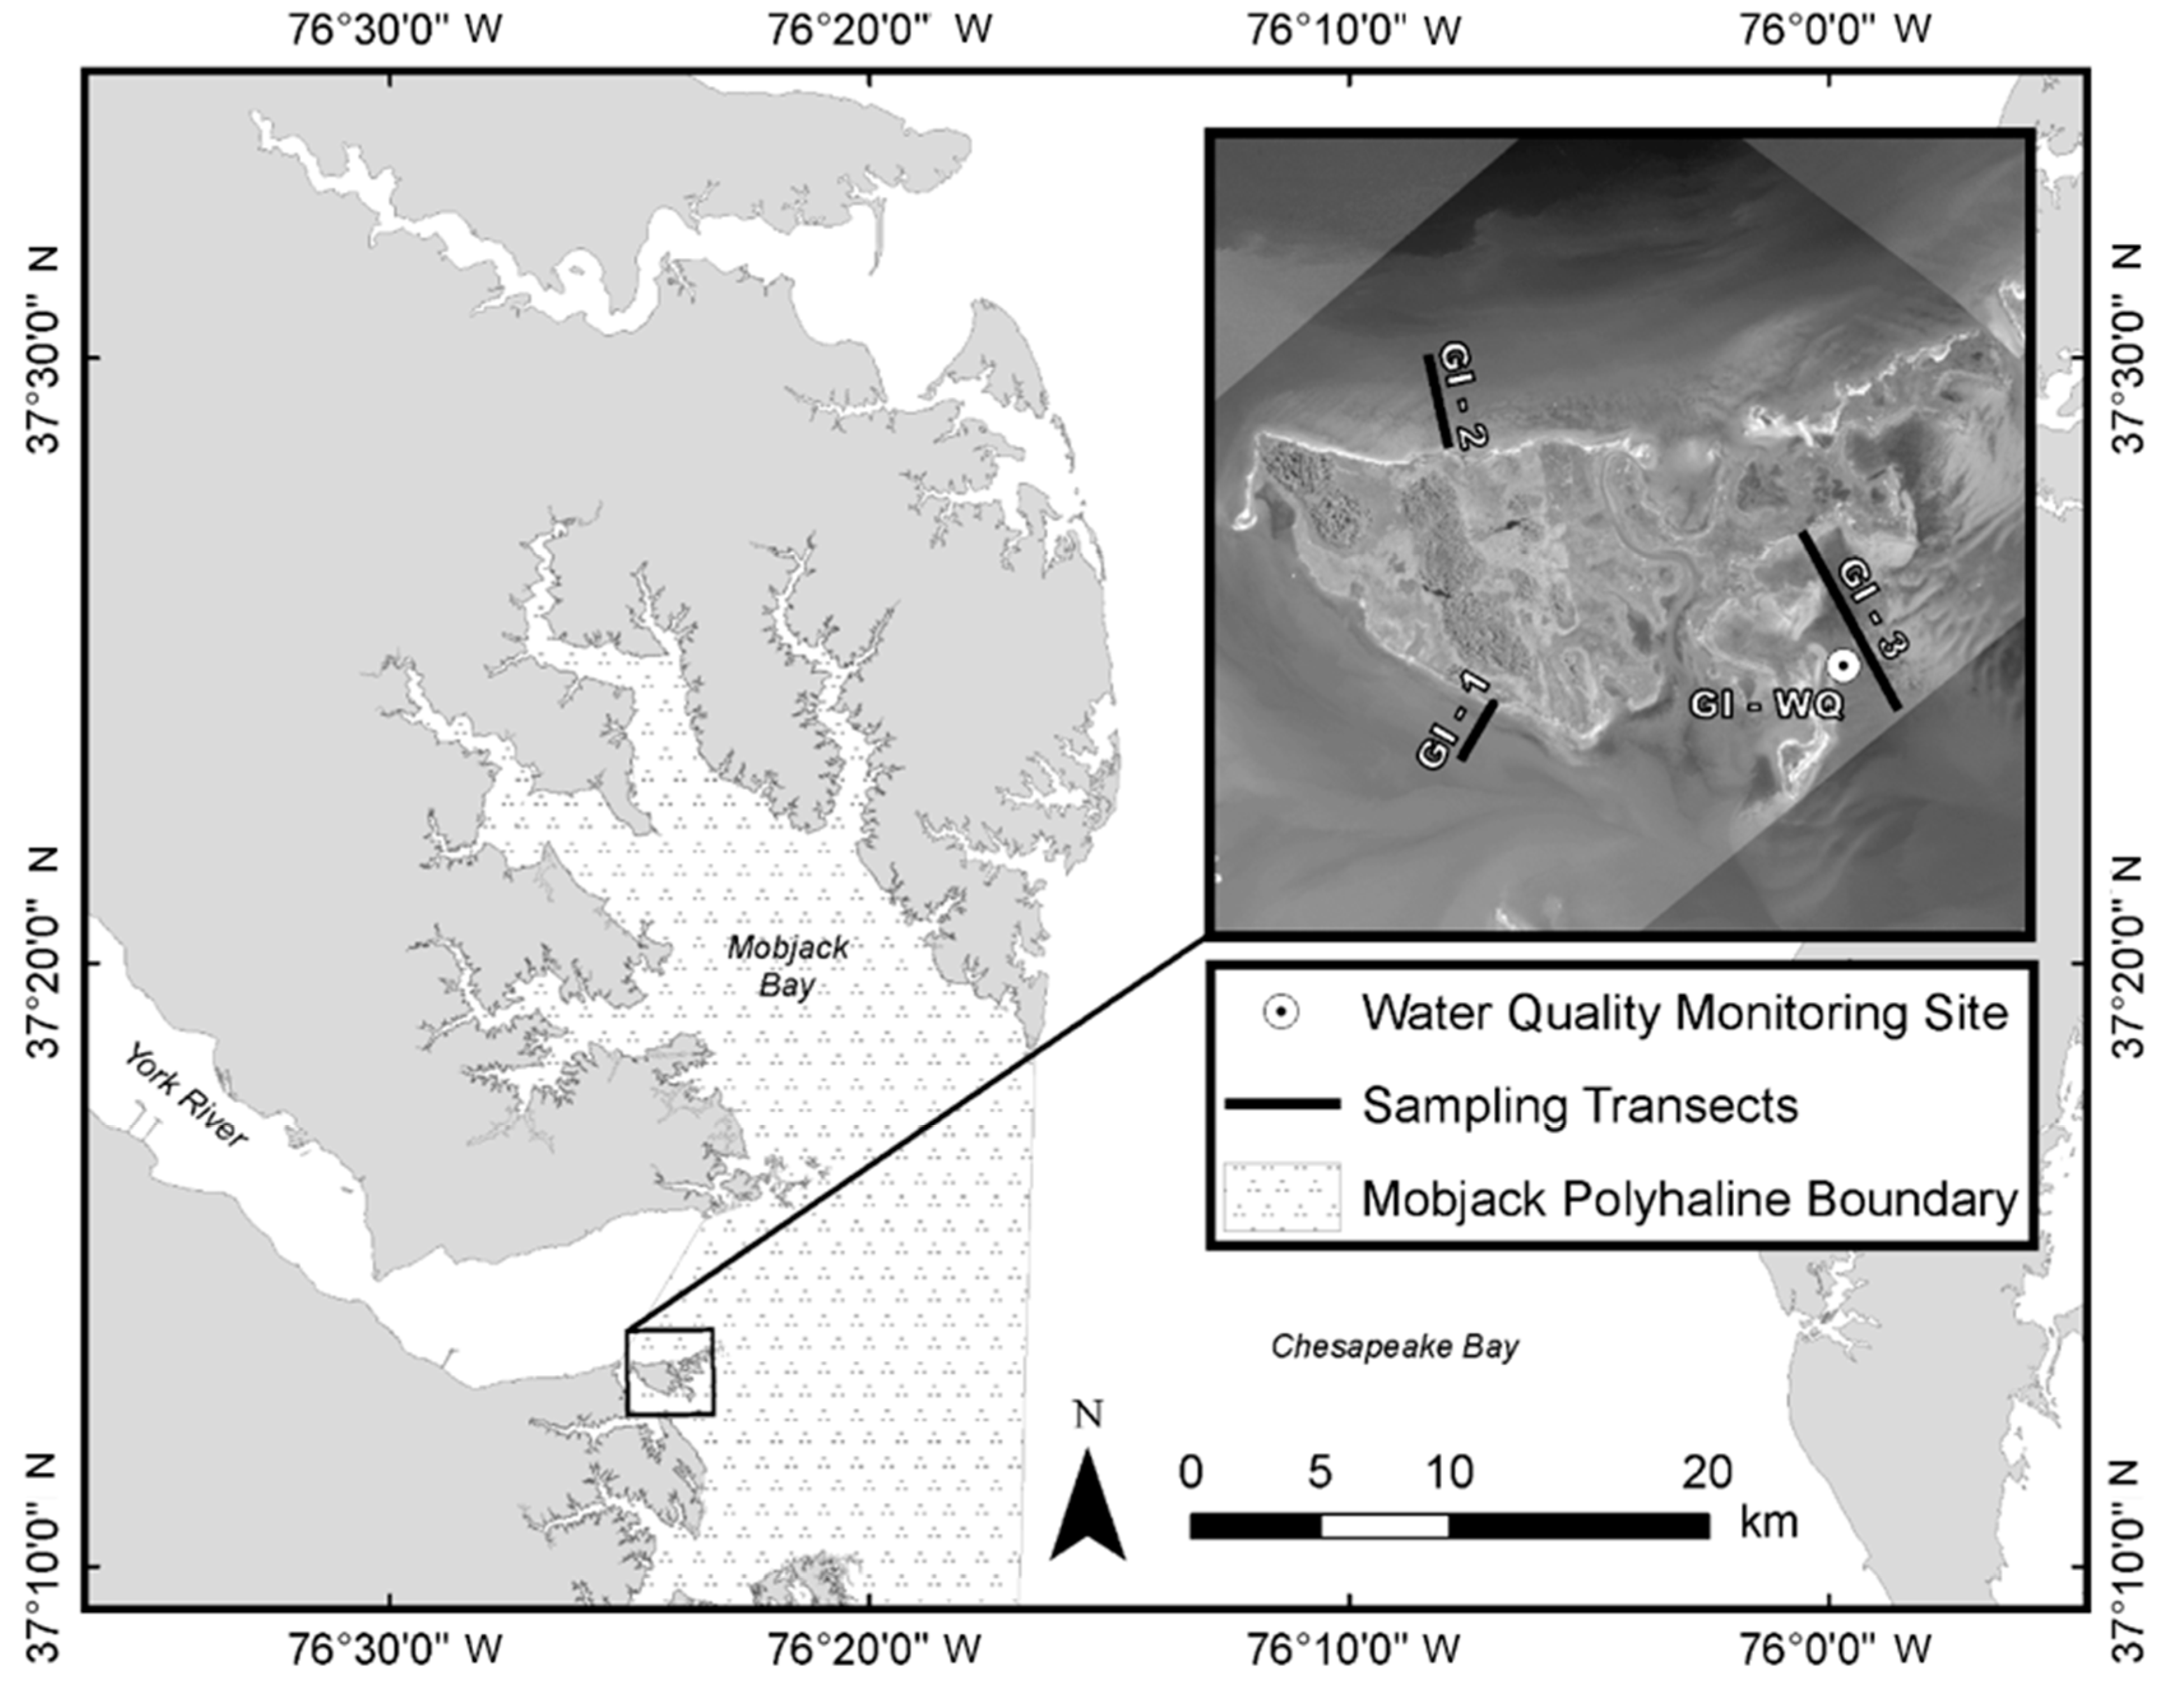
Figure 1. Site map including Goodwin Islands sampling transects (GI-1, GI-2, GI-3), water quality monitoring location (GI-WQ), and Mobjack Bay polyhaline segment boundary.
Diversity 10 00125 g001
Figure 2. Z. marina mean (±SE) monthly aboveground biomass (g DW m−2) comparisons between historic (left; 1980s–1990s) and current field surveys (right; 2004–2017). Historical data are adapted from Moore et al. 2000 [17].
Diversity 10 00125 g002
Figure 3. Length of the summer stressful season for Z. marina over time. y = 0.33x − 551; p < 0.01; r2 = 0.16.
Diversity 10 00125 g003
Figure 4. Mean percent cover for Z. marina (black) and R. maritima (white) along the GI-3 transect. Historical data on the left are adapted from those of a previous publication in Journal of Coastal Research [29], sampled from 1994–1995 at the same transect. The right plot is mean percent cover from 2010–2017. Each row is a different month (April, June, August, October).
Diversity 10 00125 g004
Figure 5. Linear relationship between the length of the previous summer stressful season and seagrass coverage (hectares). Seagrass hectares were calculated from the VIMS annual aerial mapping survey. Only years where data for both seagrass coverage and the length of the season were available are included. y = −22x + 5706; p < 0.01; r2 = 0.17.
Diversity 10 00125 g005
Figure 6. Seagrass hectares from 1998–2017 from the Mobjack Bay segment compiled from the VIMS annual aerial mapping survey.
Diversity 10 00125 g006
Figure 7. Percent time spent at each temperature bin for the summer period (June-August) comparing declining (red; 2001–2005 and 2009–2011), and increasing (green; 2006–2008 and 2012–2014) seagrass periods. Data are from the NERRS System-Wide Monitoring Program (SWMP) continuous monitoring station at Goodwin Island within the Mobjack Bay segment.
Diversity 10 00125 g007
Figure 8. Mean salinity for every month comparing declining (red; 2001–2005 and 2009–2011), and increasing (green; 2006–2008 and 2012–2014) seagrass periods. Significant differences were found for every month (p < 0.05). Data are from the NERRS SWMP continuous monitoring station at Goodwin Island, which records every 15-min, so sample sizes are very large, and significant differences appear even with small differences in means. Standard error bars are too small to appear on the plot.
Diversity 10 00125 g008
Figure 9. Mean (±SE) total suspended solids (TSS mg L−1), chlorophyll (µg L−1), and light attenuation (Kd m−1) from the Goodwin Island shoal survey station comparing the period of times where seagrass was declining (red; 2001–2005 and 2009–2011), and increasing (green; 2006–2008 and 2012–2014). Stars indicate significant differences (p < 0.05). Dashed lines indicate the Chesapeake Bay seasonal median habitat requirements for persistent growth to 1m depths.
Diversity 10 00125 g009
Figure 10. Mean (±SE) percent of shoots that were reproductive integrated across the entire transect lengths for every year after the 2010 die-off event.
Diversity 10 00125 g010