Article

Changes in Species Composition of Birds and Declining Number of Breeding Territories over 40 Years in a Nature Conservation Area in Southwest Germany

by
Fabian Etienne Schrauth
and
Michael Wink
*
Institute of Pharmacy and Molecular Biotechnology, Heidelberg University, INF 364, D-69120 Heidelberg, Germany
*
Author to whom correspondence should be addressed.
Diversity 2018, 10(3), 97; https://doi.org/10.3390/d10030097
Submission received: 6 June 2018 / Revised: 27 August 2018 / Accepted: 28 August 2018 / Published: 30 August 2018

Abstract

:
Global loss of biodiversity is occurring at an alarming rate and is a major issue in current times. Long-term studies offer the possibility to analyse changes in biodiversity and allow assessments of anthropogenic interventions in ecosystems. At present, various studies in most countries show partially strong declines of insect populations. Due to their role as a food source for many organisms it is assumed that declines of insect abundance might have effects on higher trophic levels like insectivorous birds. For reliable statements on relationships between food availability and population trends, systematic and extensive records of breeding birds are necessary. In this study, we analysed the changes in the range of species, biodiversity, and abundance of a breeding bird community over 43 years in a large nature conservation area in southwest Germany (“Lampertheimer Altrhein” near Mannheim). Since 1974, considerable changes in the spectrum of breeding birds have been found, but the overall biodiversity index did not change. Furthermore, 70% of the investigated species showed decreasing numbers of breeding bird territories, and the overall number of territories across species declined by more than 65%. A classification based on the main diet during the breeding period and habitat use revealed strong declines for insectivorous birds in the study area, especially in wetland and open cultivated landscapes.

1. Introduction

A global loss of biodiversity is currently occurring at an alarming rate, and trends suggest that increasing anthropogenic impacts could even exacerbate the situation in the future [1]. However, the conservation of biodiversity is important for maintaining ecological processes and has a great impact on the human future [2].
Despite efforts in politics and nature conservation, the loss of biodiversity has not so far been significantly slowed [1]. Current studies show, for example, that mainly specific target species benefit from large conservation programmes within the European Union, such as agri-environmental schemes (AES). Conversely, the findings suggest that to date no fundamental trend reversal for decreasing populations of endangered farmland species could be achieved [3,4].
In Europe, invertebrate populations are associated with strong declines [5], especially concerning the insects [6,7]. Hallmann et al. [7] found declines of more than 75% of the flying insect biomass in protected areas in western Germany between 1989 and 2016. Insects, however, provide a broad range of ecosystem services and play an important role as a food source for higher trophic levels, such as birds. In fact, about 80% of the breeding birds in Germany are carnivorous during the breeding period, including a large proportion of insectivores [8].
In view of their species diversity and their wide distribution, birds are suitable bioindicators to document and monitor changes of environmental conditions such as food availability. Against this background, it is particularly useful to investigate the development of bird communities in protected areas to assess possible effects of decreases in insect biomass on higher trophic levels. Therefore, solid long-term data based on systematic and extensive recordings of breeding birds are of great importance for reliable analyses [9]. In Germany, regional and national monitoring programmes for rare and common breeding birds have existed for some decades [10]. They are based on voluntary work (citizen science) and are coordinated by the “Dachverband Deutscher Avifaunisten e.V.” (DDA) but mainly cover nonprotected areas. In nature conservation areas (Fauna-Flora-Habitat (FFH) areas and EU Natura 2000 bird reserves), only populations of selected species are regularly investigated and reliable long-term trends of the complete range of breeding birds are quite rare.
The study site “Lampertheimer Altrhein” offers the possibility to investigate the changes of the complete breeding bird community over 43 years based on standardised investigations in the 1970s and in 2017. The study area is located in southwest Germany in the Upper Rhine Valley north of Mannheim and has an appropriate size and structure. It has been protected as a nature conservation area since 1937, and the diversity of habitats offers the opportunity to analyse populations of a wide range of bird species.
In this study, we aim to investigate the changes in species composition, abundance, and diversity of a breeding bird community in a nature conservation area in southwest Germany (“Lampertheimer Altrhein”) over the last four decades. Based on a long-term dataset, we analyse the development of bird populations in relation to their dietary demands. In this context, we discuss the relationships between changes in bird abundance and habitat utilisations with a focus on insectivorous species.

2. Materials and Methods
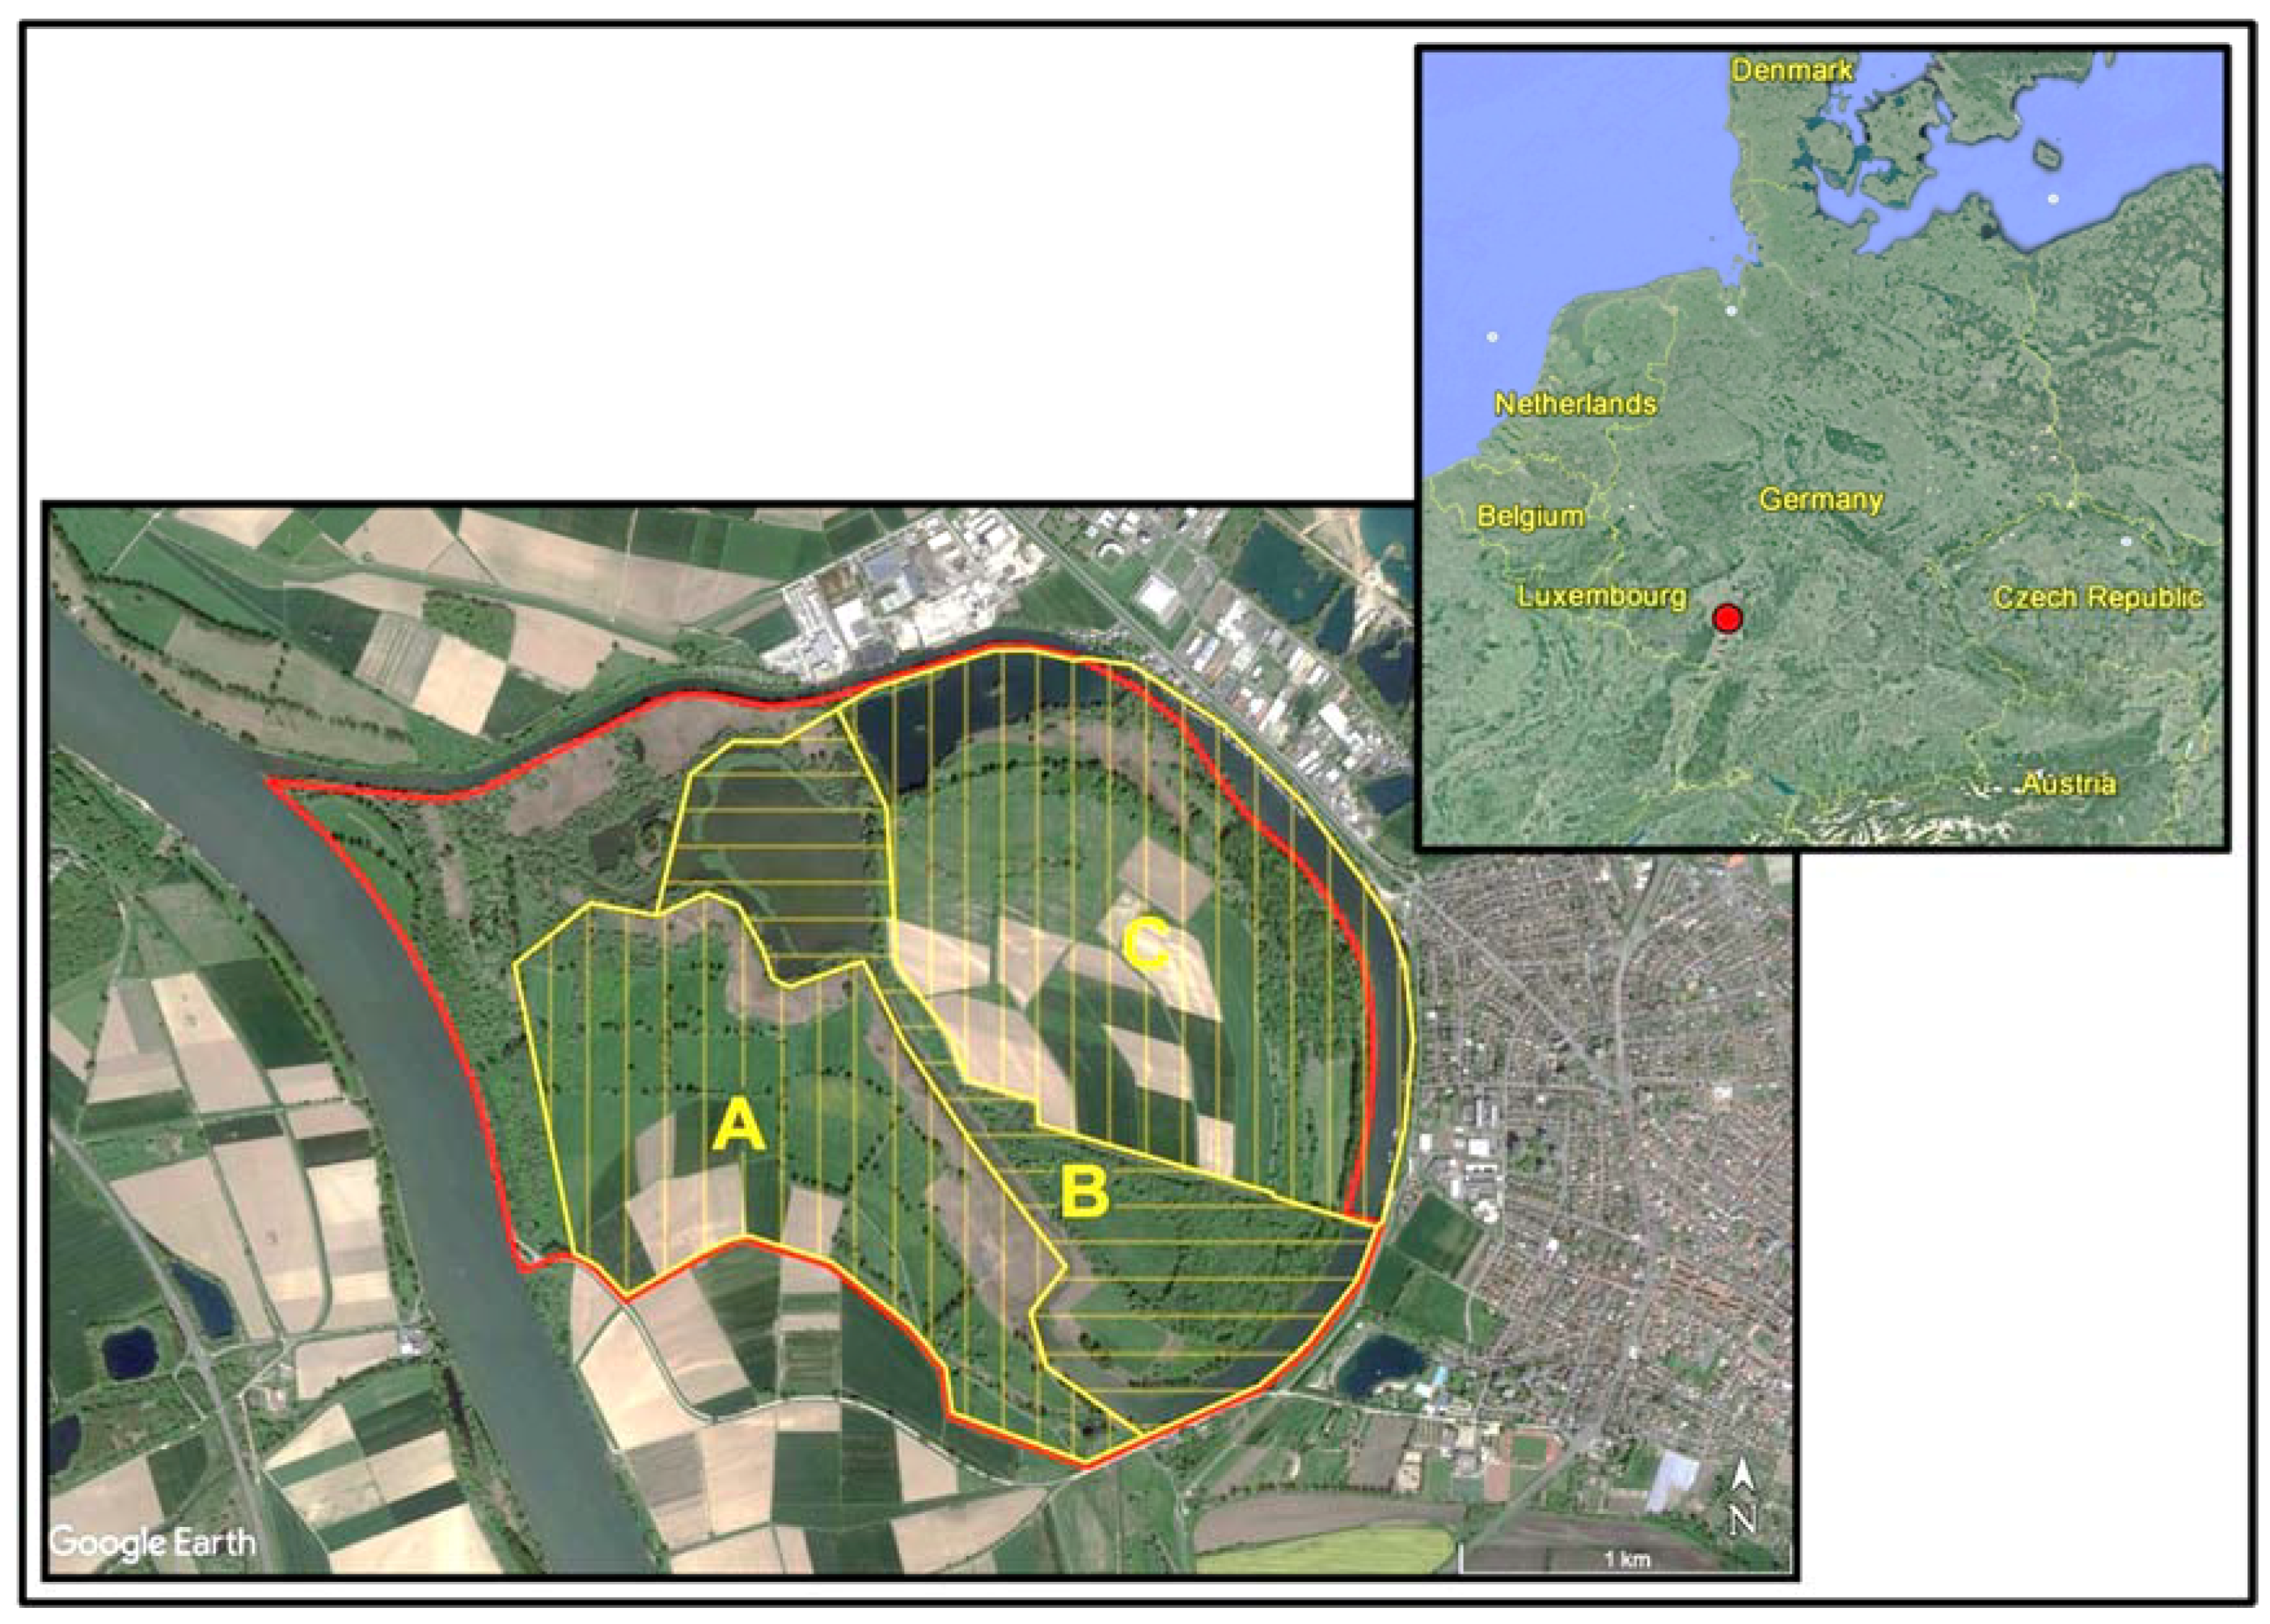
2.1. Study Area

The nature conservation area “Lampertheimer Altrhein” is located in the southwest of Germany (Figure 1) in the district Bergstraße, comprising about 530 ha. It is an original flow loop of the river Rhine, which was formed by severe floods more than 200 years ago [11]. The area is characterised by habitat diversity [11] consisting of floodplain forest (ca. 92.1 ha), richly structured (ca. 87.4 ha) and poorly structured open landscapes (ca. 145.9 ha), running waters and still waters (ca. 65.4 ha), as well as wetland areas including reed beds (ca. 55.6 ha). “Lampertheimer Altrhein” is an EU bird reserve and FFH area, and it has been part of the European “Natura 2000” network since 2001 [12].
The study area (Figure 1) of about 450 ha allowed us to document the abundance and distribution of all breeding birds as completely as possible. Except for a small nature reserve which could not be entered, all parts of the nature conservation area “Lampertheimer Altrhein” were investigated. Waterbirds were recorded on all water bodies that are part of the nature conservation area and at parts of the bordering “Altrhein” loop.

2.2. Recording Breeding Birds

For a precise documentation of the seasonal breeding populations, we chose a territory mapping method according to Südbeck et al. [9]. Due to the structure of the study area, it was separated into three subareas, which could each be monitored within one day. The monitoring period took place between mid-February and the end of July to cover the breeding seasons of all species in the study area. For optimal documentation of each breeding bird species, we referred to species-specific recording periods defined by Südbeck et al. [9].
In each subarea, nine day and four night visits were conducted at regular intervals (usually two to three weeks between the day visits). Moreover, there were four additional visits for recording individual bird species. During the bird monitoring, we chose the same route in each subarea for all visits. Diurnal species were recorded in the early morning after sunrise and nocturnal birds were recorded in the early night hours. During the on-site visits, the weather conditions were ensured to be as favourable as possible (low wind, dry, good sight).
For the mapping of territories, which was based on good ornithological knowledge (songs, sightings), territorial behaviour was documented according to the European Ornithological Atlas Committee (EOAC) standards [13]. Besides optical tools like binoculars and a spotting scope, a tape recorder (to stimulate territorial vocalisations of silent species) was also used in line with Südbeck et al. [9] for species that were difficult to detect visually. Locations of birds showing territorial behaviour were recorded via GPS using the app “NaturaList” found at the website (www.ornitho.de) for smartphones.

2.3. Data Analysis

The GPS-based territory data were exported from the website www.ornitho.de and visualised in “Google Earth Pro”. A territory map was created for each species with colour-differentiated results of the various on-site visits. Spatially grouped detections were interpreted as a territory if there was a clear spatial distance to other detections of the same species. For distinguishing closely adjacent territories, at least one observation of two simultaneously singing birds in both locations was necessary. A breeding territory was usually defined based on three or four but at least two single detections of a singing or courting bird during the specific registration period [9]. At least one detection within the recommended time range and further detections within the extended time range were necessary. For species with short registration periods, few temporal deviations were tolerated. Once nesting of a bird was confirmed, no further detections were needed for the definition of a territory.
The populations of birds breeding in colonies, such as Great Cormorants (Phalacrocorax carbo) and Common Starlings (Sturnus vulgaris), were calculated by counting the utilised nests. Waterbird territories were investigated by registering stationary pairs with courtship behaviour or breeding success. Due to the lower number of night visits, territories of nocturnal birds like Tawny Owls (Strix aluco) were defined by at least two detections of a calling male or a single detection of a calling pair. In general, territories at the border of the site were counted as a full territory if they were mainly located within the study area.
We calculated the abundance in the total study area for all breeding birds and for most species also in their suitable habitat. The classification in different types of habitats was based on habitat mapping by Eppler and Petermann [11]. The utilisation of “Bürger GIS” as a geographic information system for the district Bergstraße made it possible to calculate the sizes of the total study area and subareas.

2.4. Analysis of Changes in the Breeding Bird Community

In order to research the development of abundance and distribution of breeding birds at “Lampertheimer Altrhein”, we compared the current number of territories with the results of earlier investigations of bird populations between 1974 and 1979 [14] and in 2003 [15]. These comparative sources were the basis for long-term and short-term trends. For the long-term trend, average values of the number of territories between 1974 and 1979 were used.
For an assessment of changes in bird diversity within the reference period between the 1970s and 2017, the Shannon index was calculated using the following equation:
H S = i = 1 s p i ln ( p i )
where H is the diversity of breeding birds, s is the number of species, and pi is the relative abundance of a species.
We analysed the development of breeding bird populations in relation to their dietary requirements. The categorisation into four groups (herbivores, insectivores, vertebrate consumers, omnivores) was based on the main diet of adults and nestlings during the breeding period [8,16]. The group of insectivores comprises species solely feeding on insects as well as invertebrate consumers for which insects provide an important food source during the breeding season. Species with a broad food spectrum could be assigned to two categories and were thus considered for the evaluation of both groups. Furthermore, all investigated species were classified according to their main habitat uses (wetland, open cultivated landscapes, woodland, or other habitats).
For the analyses in relation to food availability and habitat utilisations, each species was classified into a category of population development corresponding to the population trends in the study area. We defined the four categories “strong decline” (>75% within the reference period), “moderate decline” (25–75% within the reference period), “stable” (≤25% increase or decline within the reference period), and “increase” (>25% within the reference period).
We also compared changes in the number of breeding territories across species for the different categories based on diet and habitat utilisations using the average number of territories for the time period 1974–1979. The values for 2017 were extrapolated to the size of the study area in 1974–1979.

3. Results

3.1. Abundance and Distribution of Breeding Birds

Overall, 66 breeding bird species were recorded in the study area in 2017 (Table 1). The most frequent species were Great Cormorant (Phalacrocorax carbo, 71 breeding pairs), Great Tit (Parus major, 61 territories), and Eurasian Blackcap (Sylvia atricapilla, 61 territories). Among the other breeding birds, eleven species had only one territory in the study area. Across all species, 794 territories were recorded with a total abundance of about 17.6 territories/10 ha. The European Reed Warbler (Acrocephalus scirpaceus) reached the highest abundance in the suitable habitat (5.94 territories/10 ha).
Further possible breeding bird species were Swan Goose (Anser cygnoides, a neozoic species), Eurasian Sparrowhawk (Accipiter nisus), Eurasian Wryneck (Jynx torquilla), Common Redstart (Phoenicurus phoenicurus), Common Grasshopper Warbler (Locustella naevia), Marsh Warbler (Acrocephalus palustris), Wood Warbler (Phylloscopus sibilatrix), Willow Warbler (Phylloscopus trochilus), Common Firecrest (Regulus ignicapilla), and Eurasian Magpie (Pica pica). For these species, individuals with territorial behaviour were documented only once within the registration period without confirmation of a local territory. Representative examples for the maps of territories showing temporally differentiated detections and the defined territories are documented as supplemental data (see Supplementary Materials, Figures S1–S4).

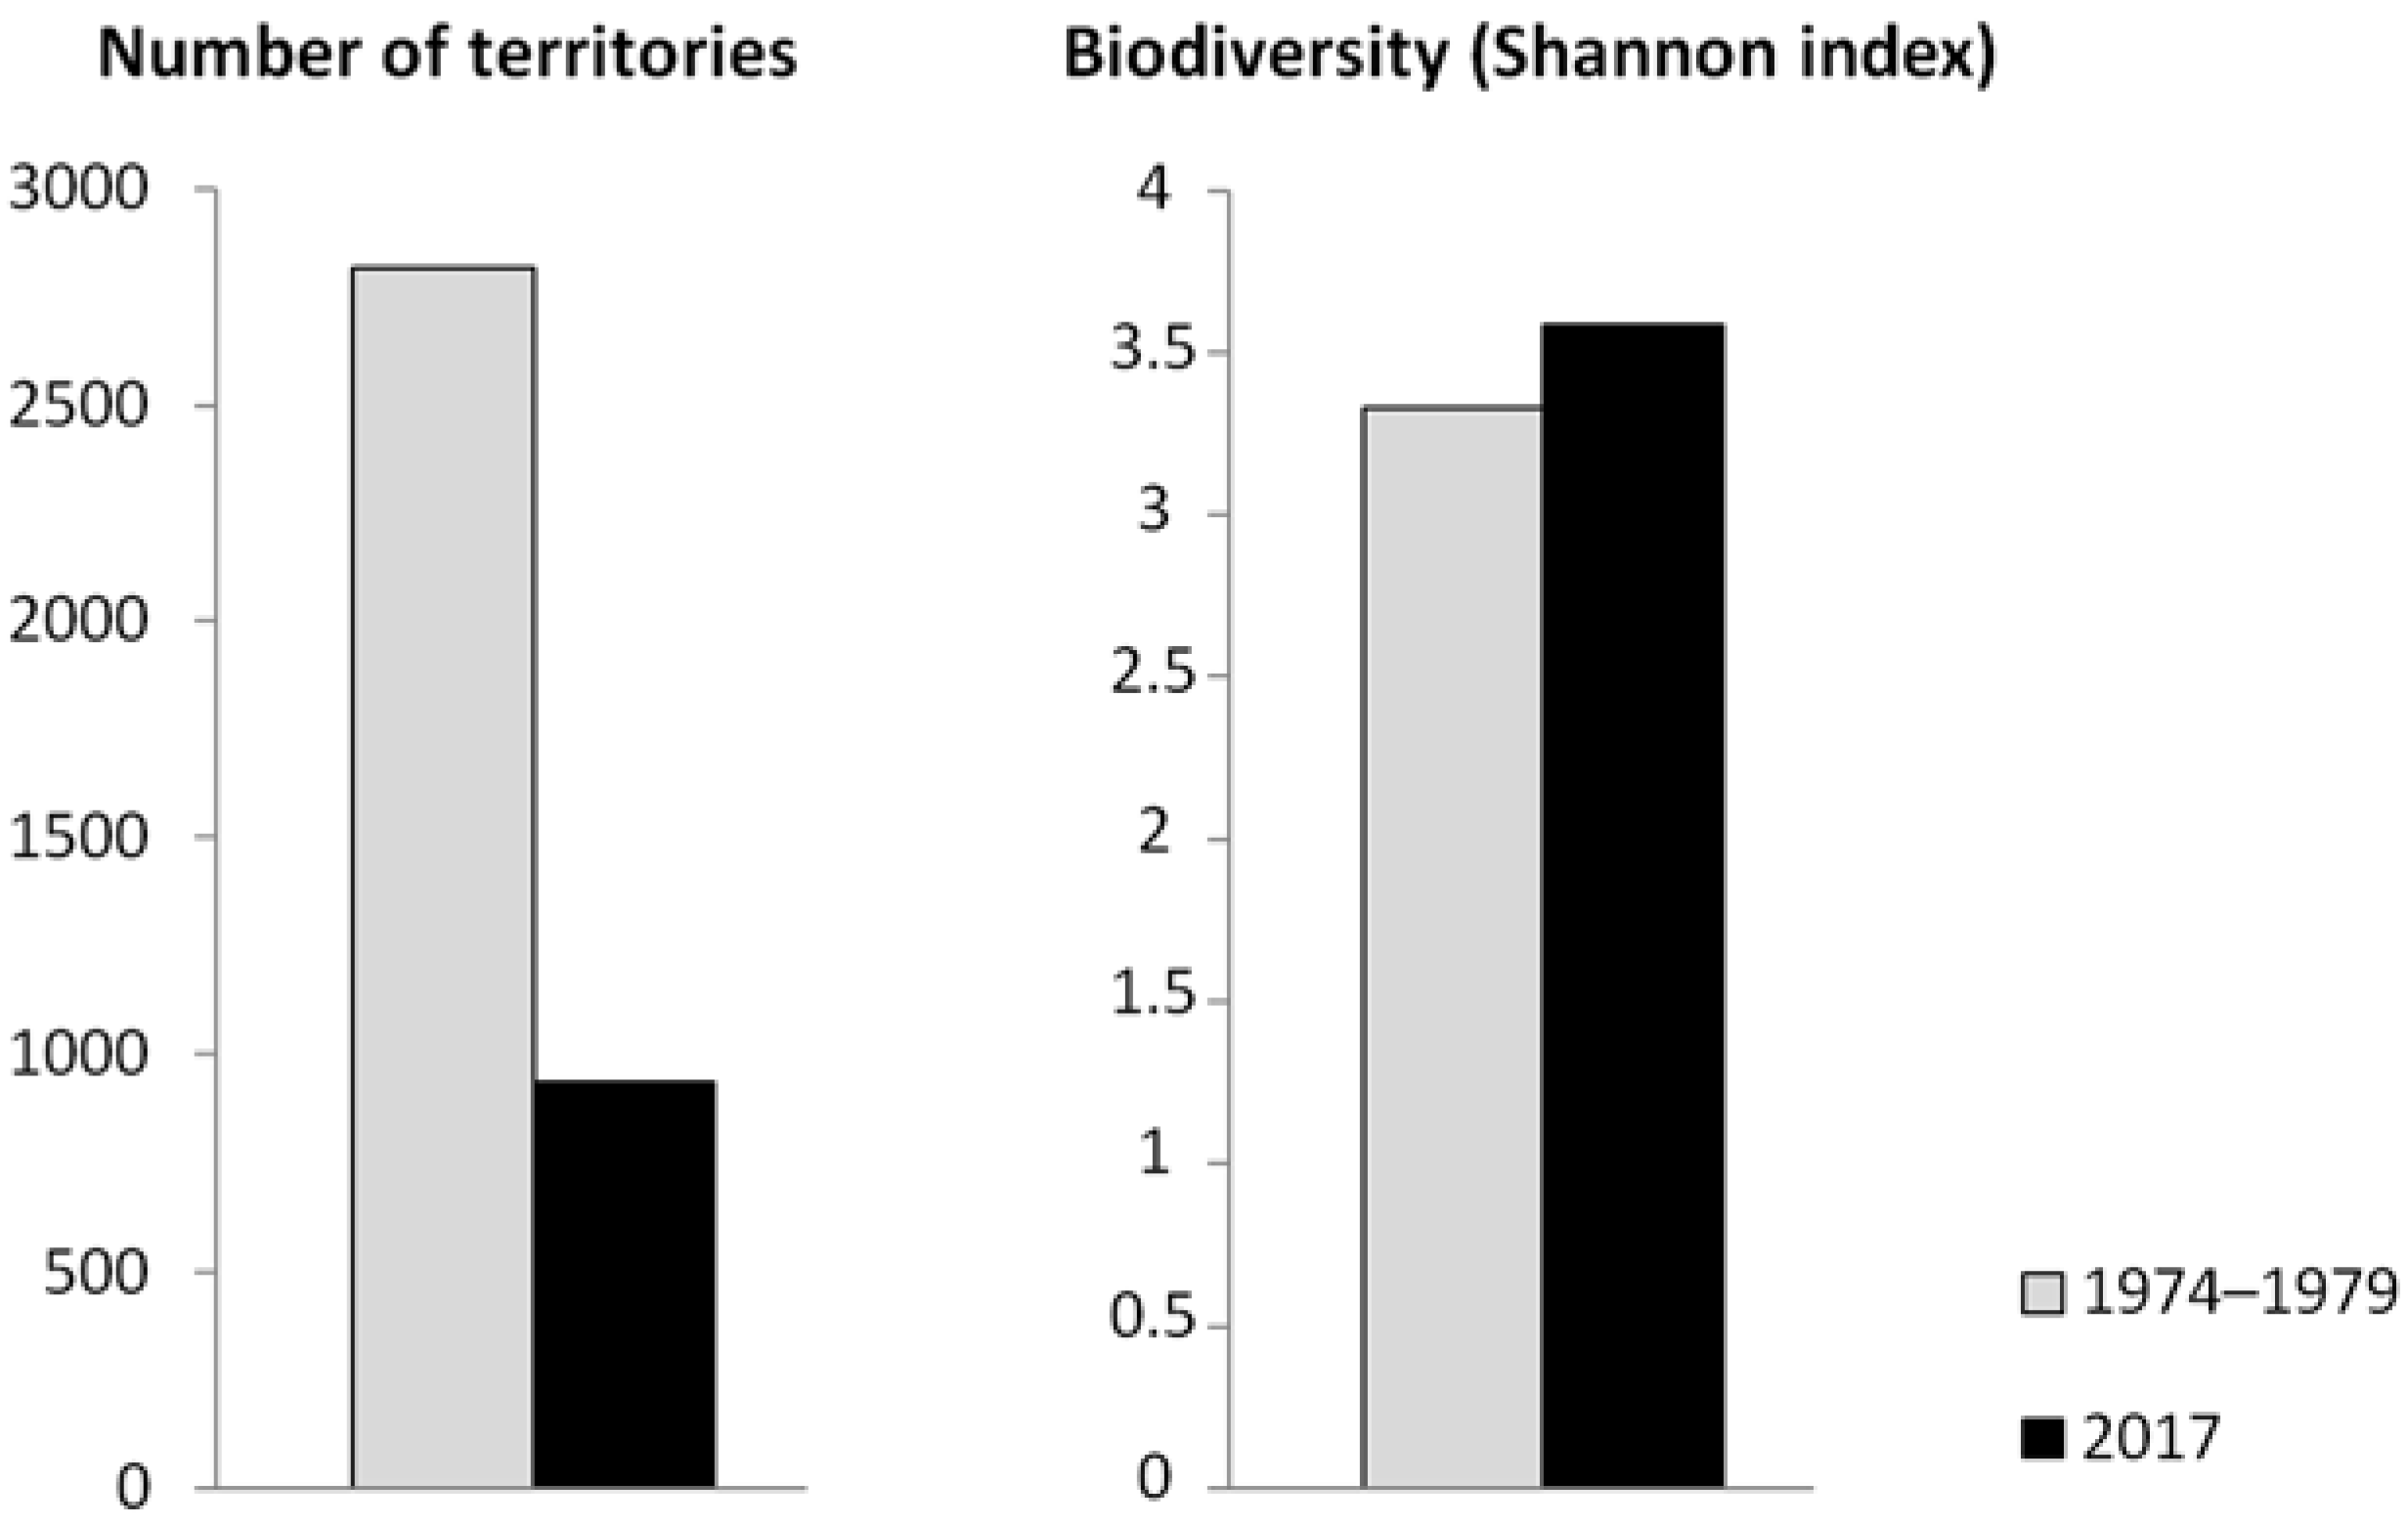
3.2. Development of the Breeding Bird Community

We compared the current results of 2017 at “Lampertheimer Altrhein” with earlier investigations of the same area of breeding birds for 101 species (Table 2).
For the long-term trend, the developments of 99 species between the time period 1974–1979 and 2017 were analysed. For 29 species, an increasing number of territories was found including 11 new breeding bird species. In contrast, 69 species showed declining populations: 34 of them were breeding in 1974–1979 but were no longer breeding in the area in 2017. The population size of one species remained constant. The number of recorded breeding bird species varied between 69 and 79 within the time period 1974–1979, while the number of species in 2017 was slightly smaller, at 66. The short-term trend for 33 selected species between 2003 and 2017 revealed 13 species with rising numbers of territories, whereas 18 species showed decreasing populations and 2 remained constant (Table 2).
Between 1974 and 1979, the annual breeding population across species was estimated at 2700 to 3000 territories for the whole nature conservation area, with a total abundance of 50.9–56.6 territories/10 ha [14]. The current investigation revealed 794 territories across species for the study site. Extrapolating the number of territories for 2017 to the size of the study area in 1974–1979 revealed about 935 territories in 2017. This indicates a decline of more than 65% of the total bird community at “Lampertheimer Altrhein” since the 1970s.
For an analysis of changes in bird diversity, we calculated the Shannon index. Based on the average values of all breeding bird species between 1974 and 1979, an index of 3.33 was determined. In 2017, the investigation on breeding birds revealed a Shannon index of 3.59.

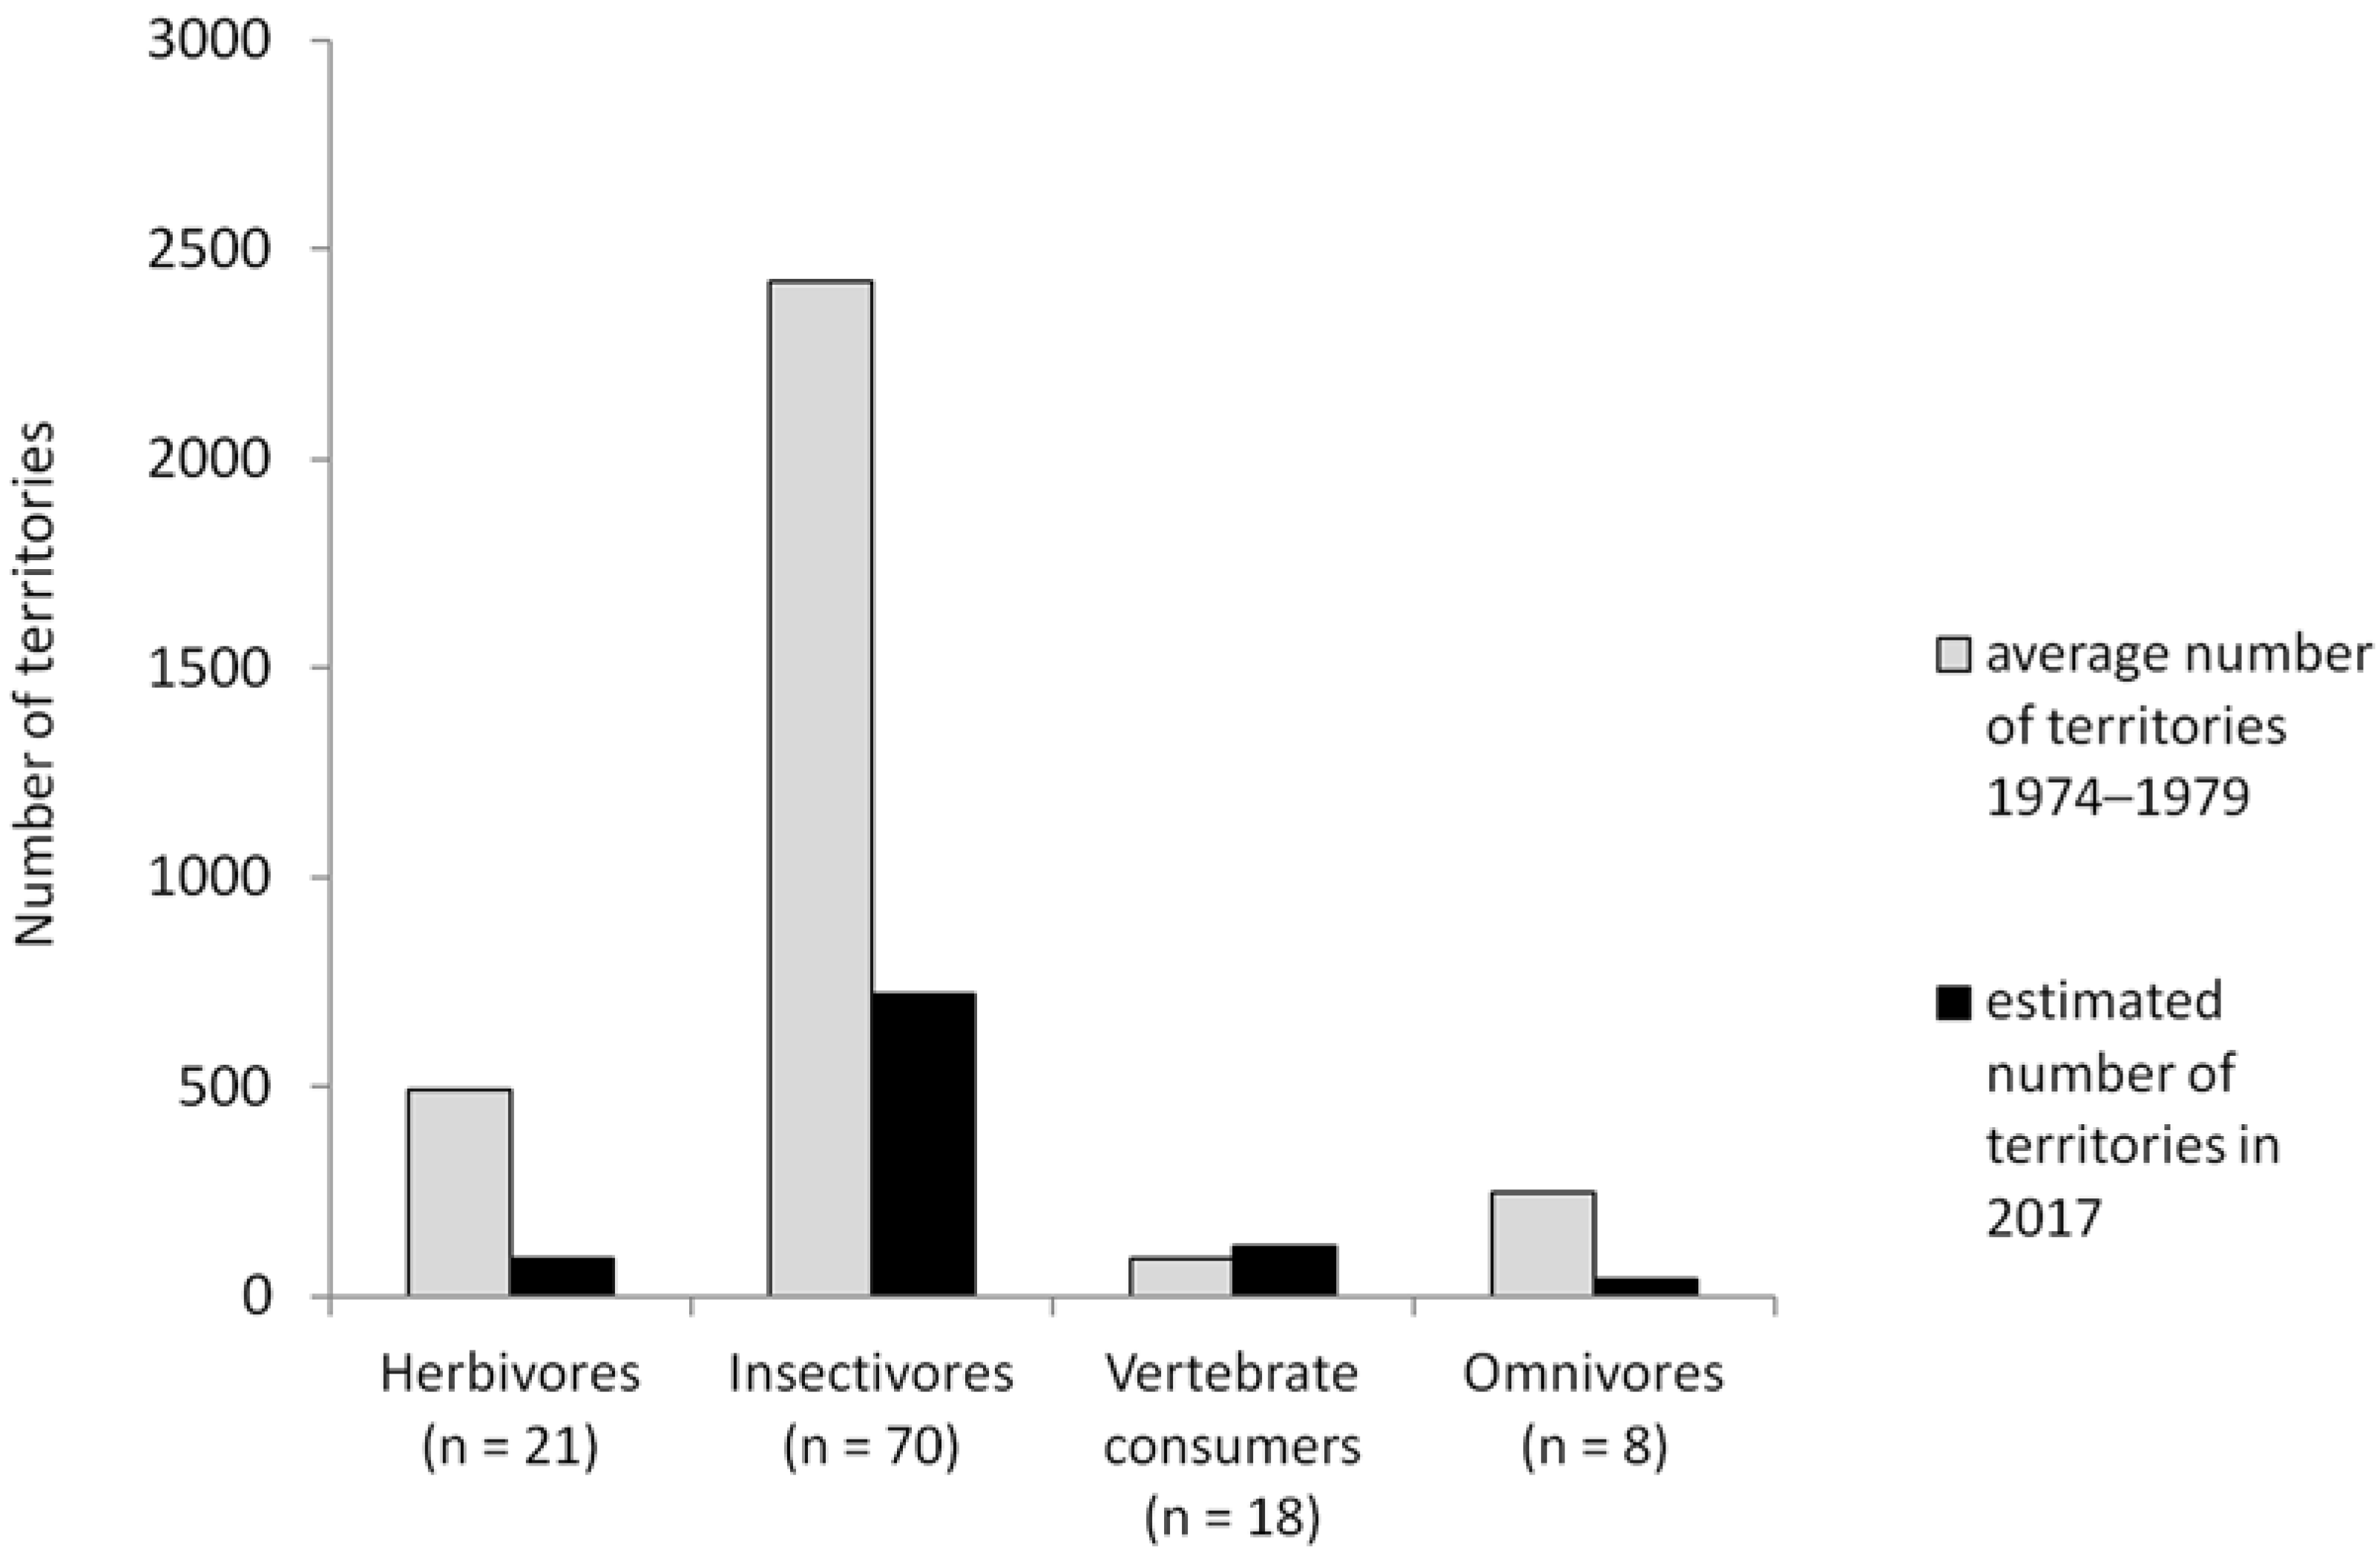
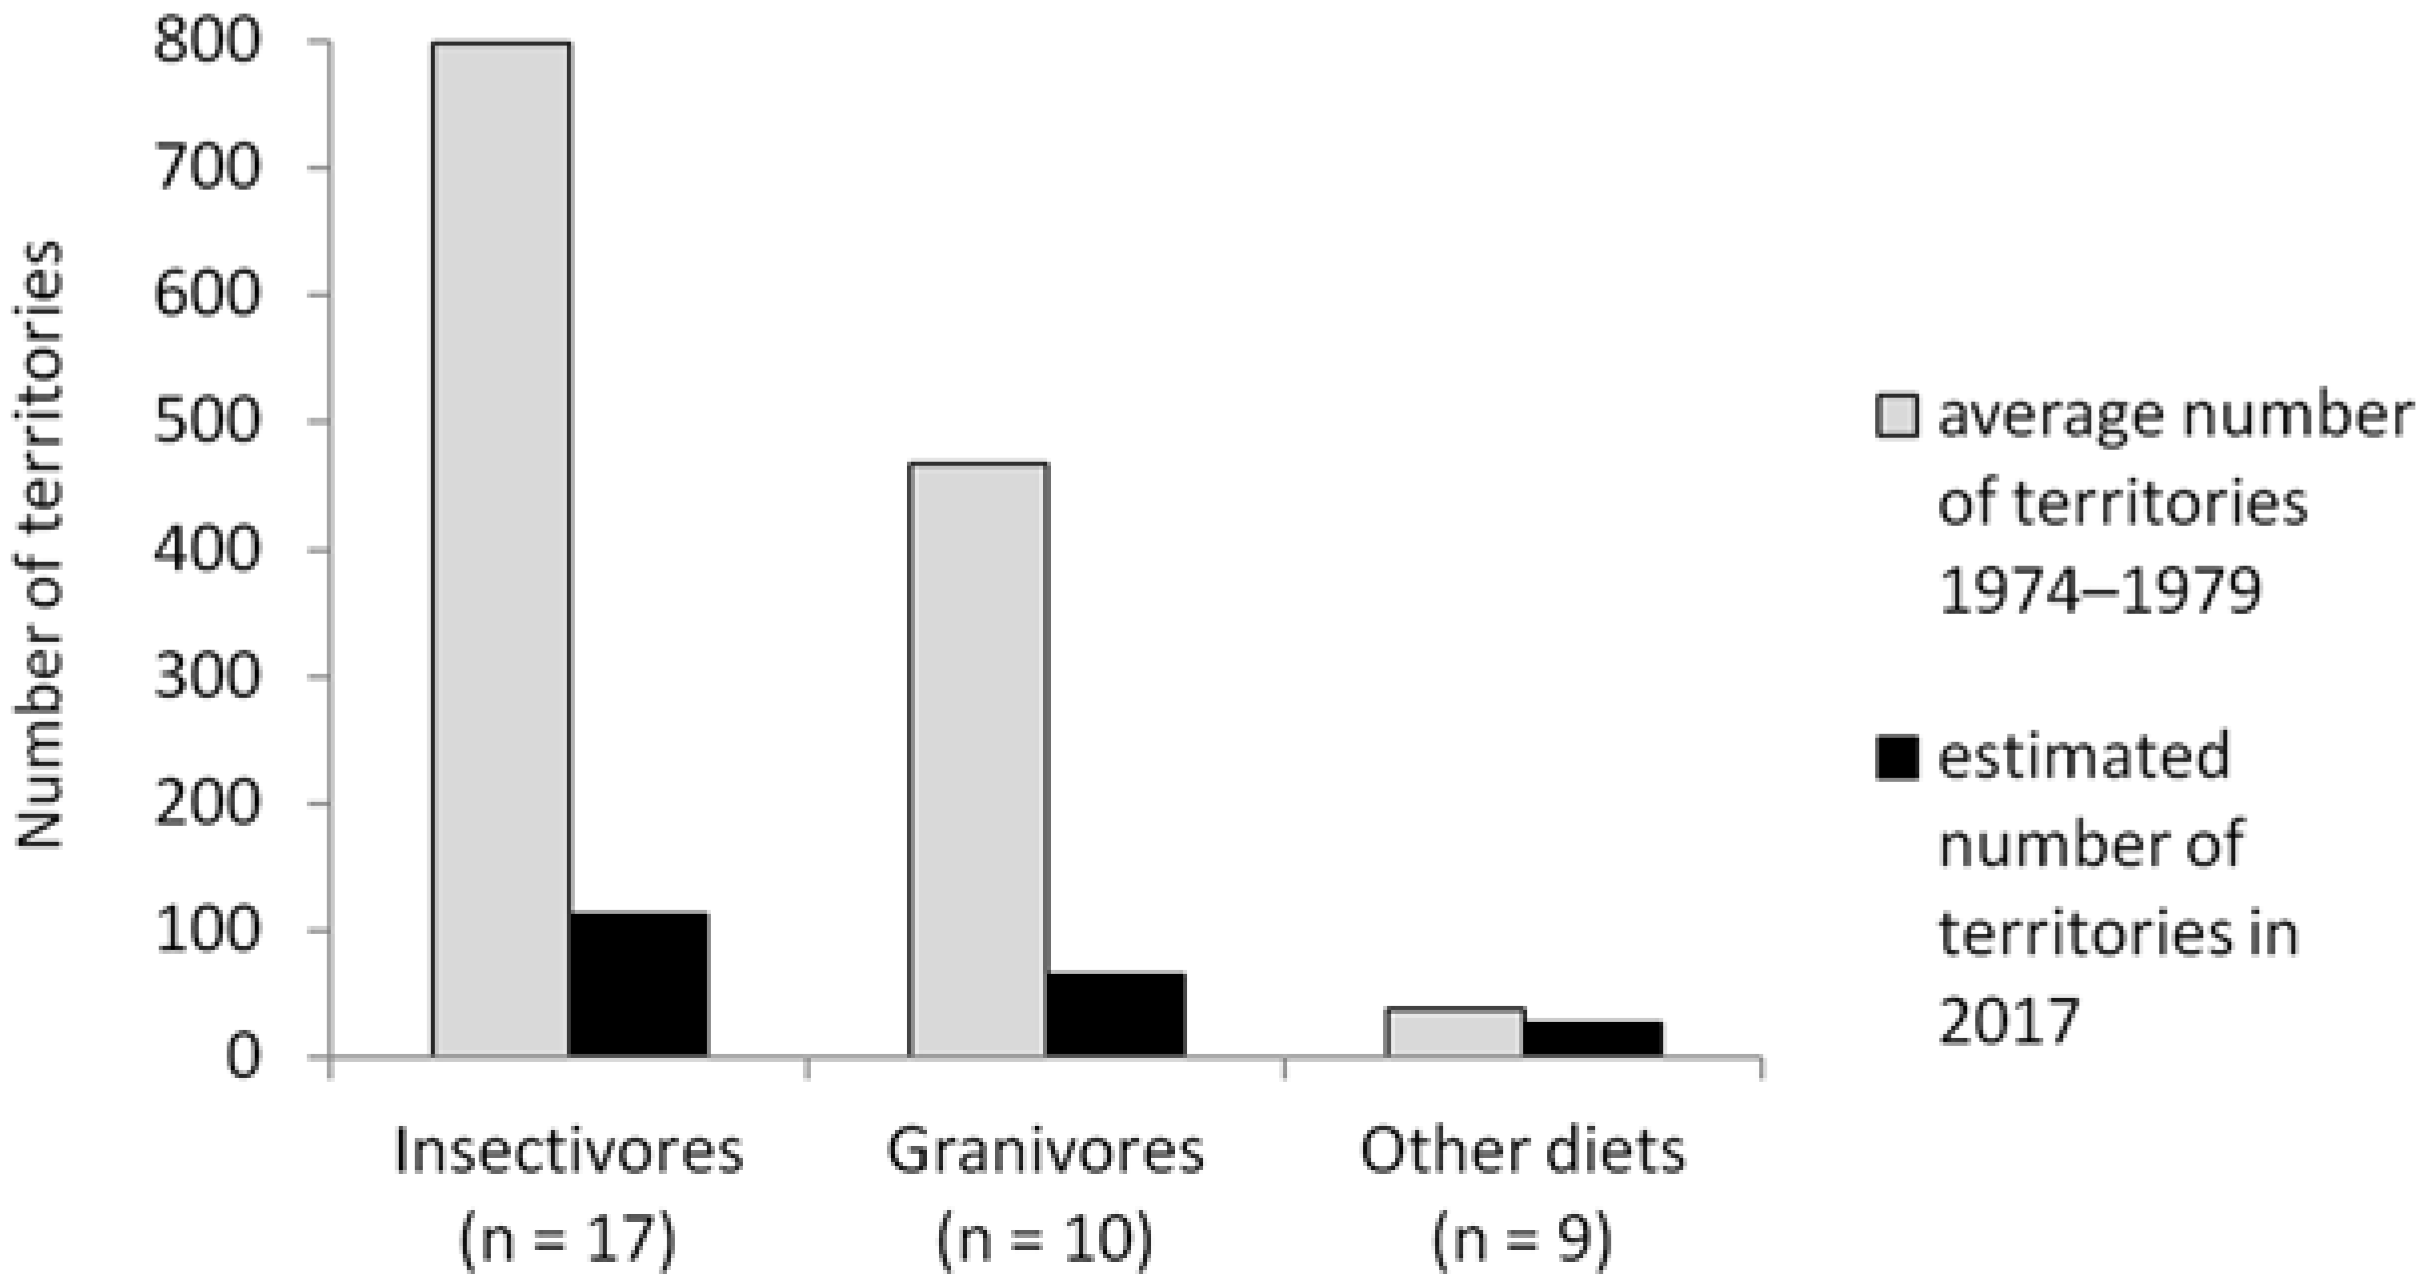
3.3. Population Trends in Relation to Food Availability

We analysed the population trends of species (Table 3) and changes in the overall number of territories (Figure 2) in the study area between the 1970s and 2017 in relation to food availability. The analysis was based on the main diet of adults and nestlings during the breeding period [8,16]. Species-specific trends and classification are presented in the supplementary material (see Supplementary Materials, Table S1).
The insectivores represented the majority of breeding birds in the study area. For 74% of these species, we found decreasing populations in the long-term trend (Table 3).
Regarding the overall number of territories across species within the reference period between the 1970s and 2017, we found sharp declines of about 70% among the insectivores. Also, the smaller groups of herbivores and omnivores showed clear declines, whereas the number of territories of vertebrate consumers increased (Figure 2).

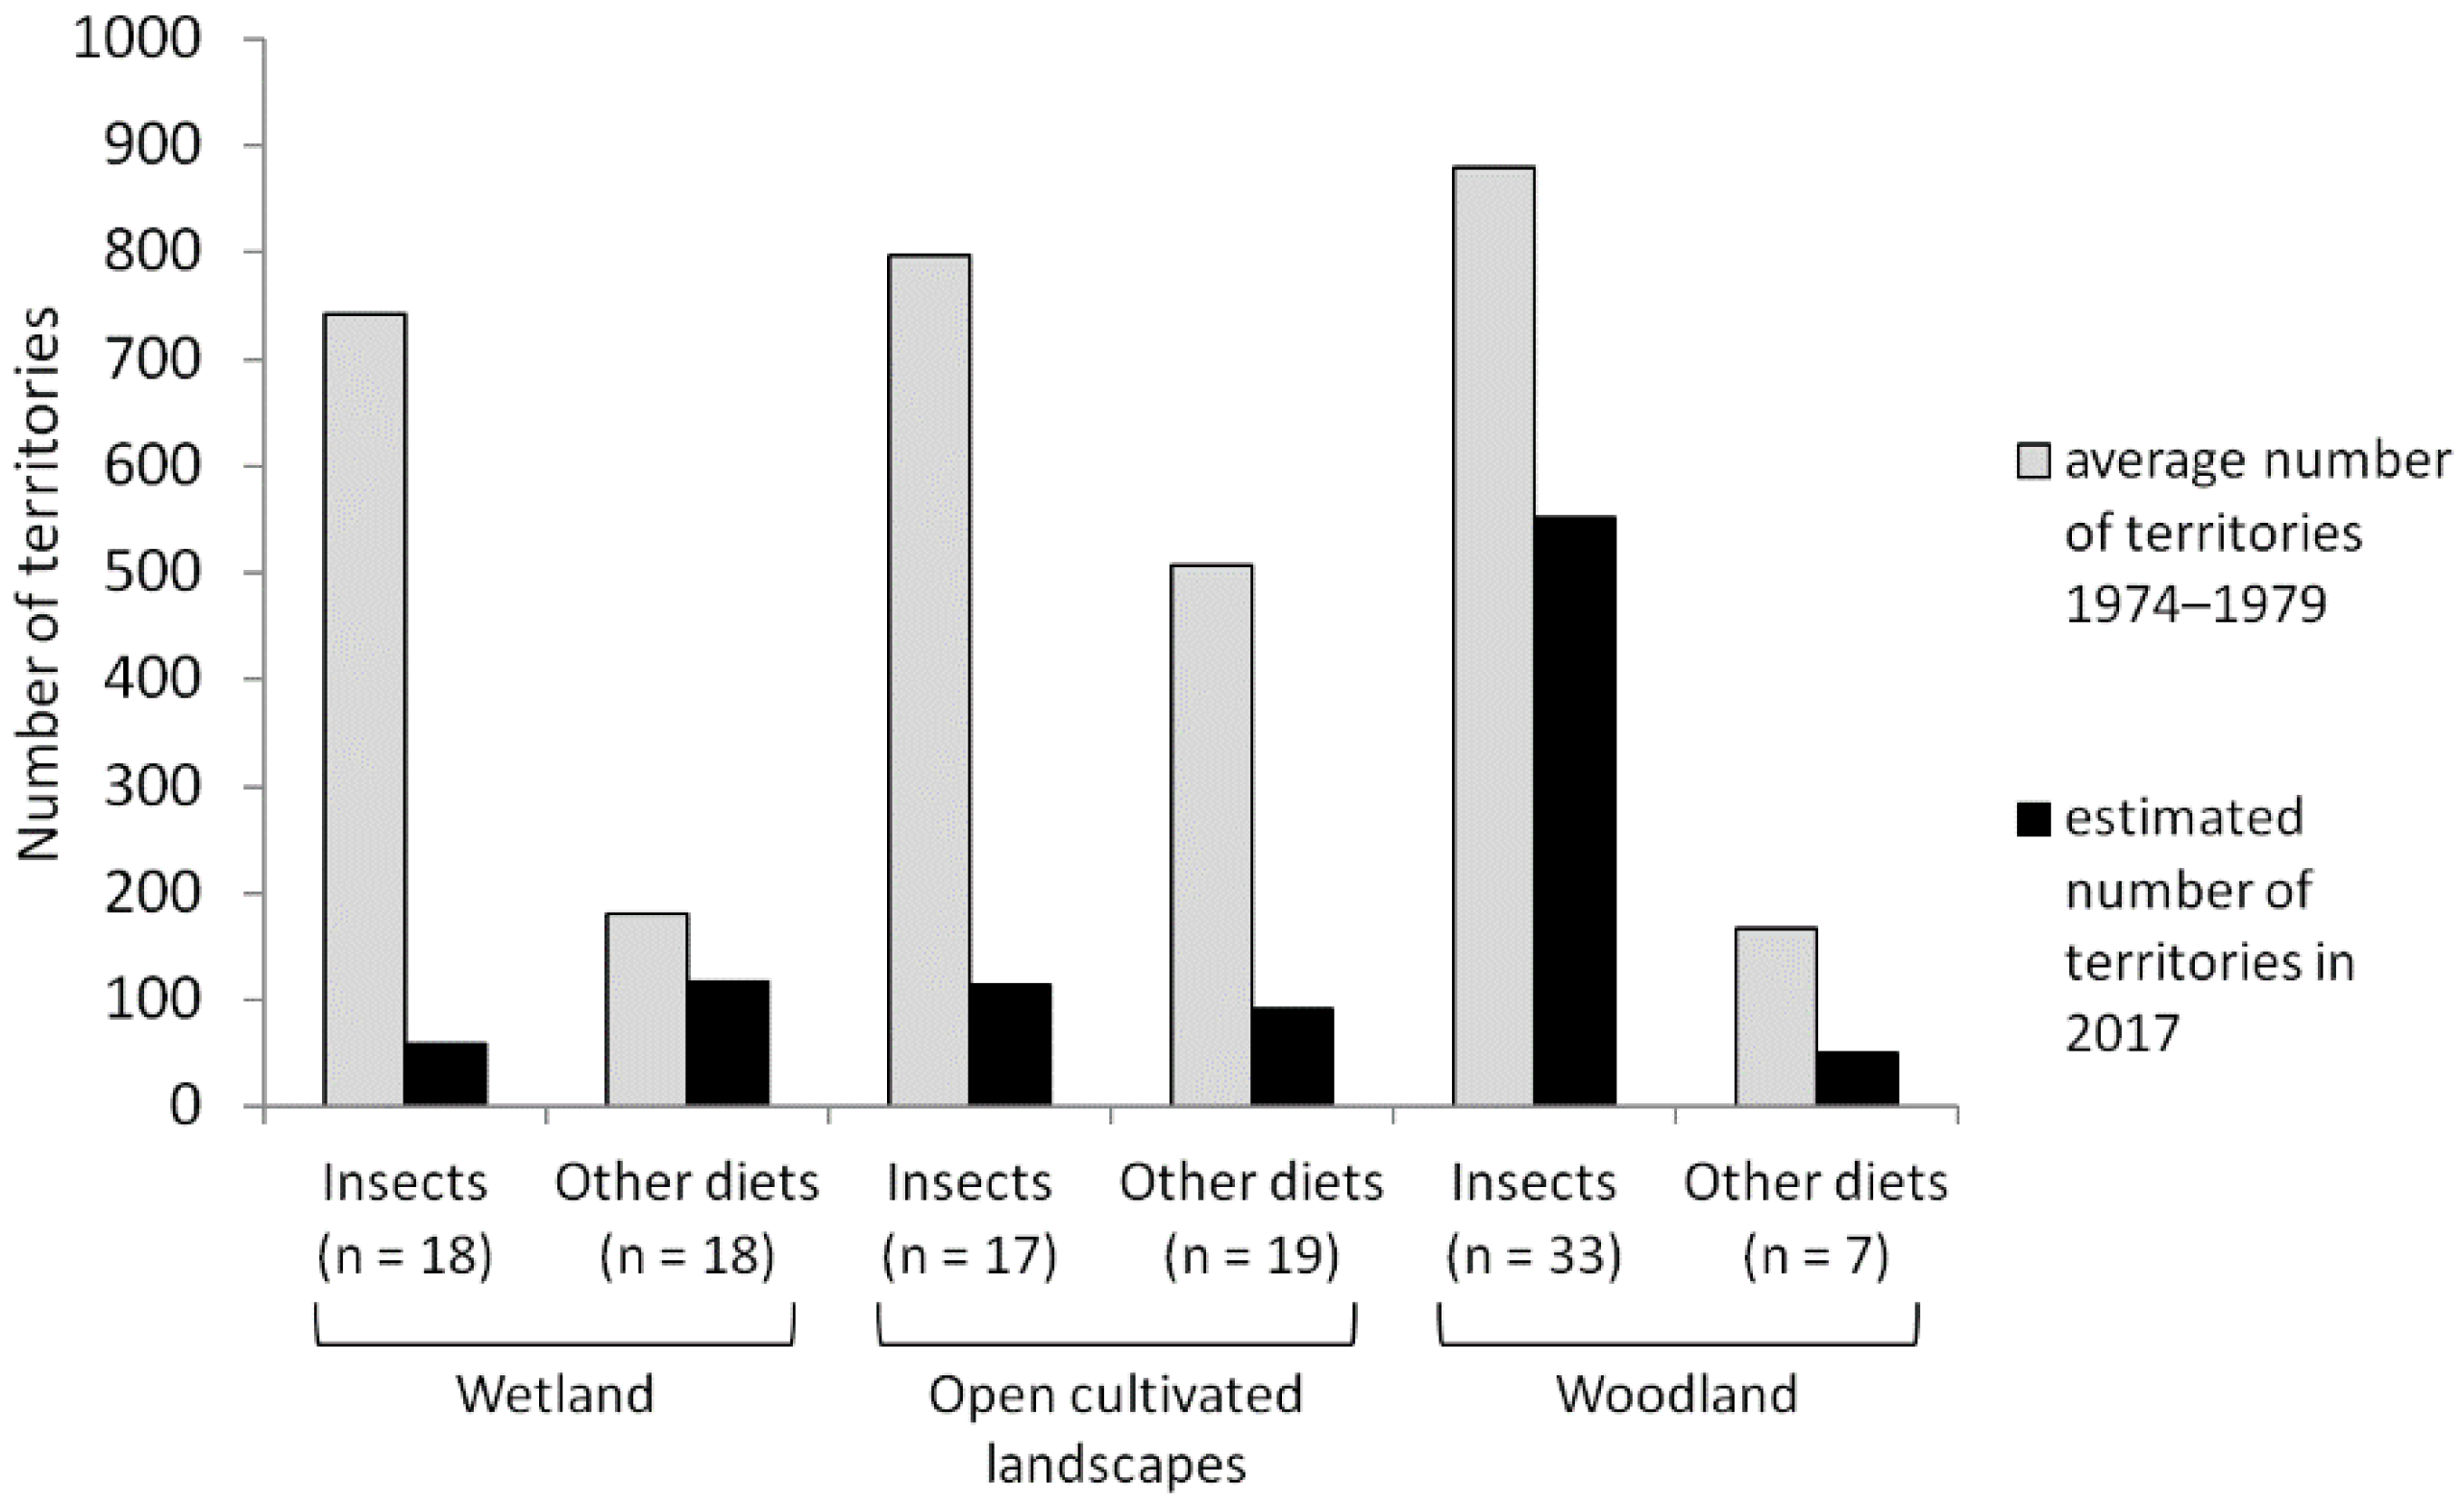
3.4. Population Trends in Relation to Habitat Utilisations

We further analysed the developments of the breeding bird populations grouped by habitat utilisation within the reference period. Species-specific trends and classification were derived from Table S1 (Supplementary Materials).
In general, breeding birds of open cultivated landscapes and wetland birds showed higher proportions of declining species at “Lampertheimer Altrhein” as compared to woodland birds in the long-term trend (Table 4).
For the changes in the number of territories across species, we compared the developments of mainly insectivorous birds and birds with other diets. As above (Section 3.3), species that were classified into two categories were considered for the evaluation of both groups (Figure 3). We found the strongest absolute declines for insectivorous birds breeding in wetland habitats and in open cultivated landscapes. Relative declines for insectivores and birds with other main diets were similar in the open cultivated landscapes (insectivores: −86%, others: −82%), whereas insectivorous wetland species declined much more steeply (−92%) than wetland birds feeding on other resources (−35%). In contrast, among woodland birds, we found a weaker relative decrease in the overall number of territories in the group of insectivores (insectivores: −37%, others: −70%).

4. Discussion

Our investigation revealed considerable changes in the breeding bird spectrum over four decades at “Lampertheimer Altrhein” with a nearly constant bird diversity but a strong overall loss in bird abundance as measured by total breeding territory number. Population trends in relation to food requirements revealed a sharp decline in insectivorous species at “Lampertheimer Altrhein” between the 1970s and 2017. Furthermore, we found strong decreases for insectivorous wetland species and for breeding birds of open cultivated landscapes.

4.1. Changes in the Breeding Bird Community

Within the reference period between the 1970s and 2017, there were considerable changes in the composition of the breeding bird community in the study area. Eleven species that did not breed at “Lampertheimer Altrhein” within the time period 1974–1979 were part of the breeding bird community in 2017, whereas 34 former breeding bird species present in 1974–1979 were no longer recorded. However, it must be considered that some species bred irregularly within the time period 1974–1979, while the current investigation shows the range of breeding birds in a single year. The total annual number of breeding birds decreased only slightly within the reference period.
The settlement of new species could have been caused by extensions of their natural range or supra-regional increasing populations. The new settlement of the Great Cormorant (Phalacrocorax carbo) at “Lampertheimer Altrhein” in 1985 [17], for example, could be associated with the clearly rising number of breeding pairs in central Europe in the 1980s. The resettlement of Stock Dove (Columba oenas) and Red-backed Shrike (Lanius collurio), which both bred in the area up to the 1950s, might also be caused by supra-regional increasing populations in the 1970s/80s [16]. In addition, new settlement of neozoa, such as Canada Goose (Branta canadensis) and Egyptian Goose (Alopochen aegyptiaca), reveals an anthropogenic influence on the range of breeding bird species in the study area.
The Shannon index, as a measure of bird diversity, remained nearly constant (Figure 4). This suggests that changes in the range of species within the last four decades had only minor effects on the diversity of the bird community. However, the Shannon index only takes into account the number of species and the relative abundance of the breeding birds in an area. For a complete assessment of the changes in the bird community at “Lampertheimer Altrhein”, it is also important to include the development of the absolute abundances of breeding birds.
The long-term trend revealed remarkable changes in the abundance for many species. In total, 70% of the breeding bird species had declining territory numbers in the study area (Table 2). Between the 1970s and 2017, the annual breeding population across species declined by more than 65% (Figure 4).
As changes in habitat composition are known to affect bird communities we compared maps from the 1970s [14] and 2012 [11]. This revealed only minor changes of habitat composition at “Lampertheimer Altrhein” over the last four decades. The transformation of some fields into extensively used grassland in the north of the study area and the afforestation of about 7 ha of former meadows (Table 5) were most notable. This indicates that other factors might be more important for the changing range of species.

4.2. Population Trends in Relation to Food Availability

Our analysis revealed strongly negative population developments of insectivorous breeding birds at “Lampertheimer Altrhein” between the 1970s and 2017 (Table 3, Figure 2). A decisive cause for declining populations of birds feeding on insects might be the loss of insect biomass due to agricultural intensification. Hallmann et al. [7] found a reduction of flying insect biomass by more than 75% in protected areas in western Germany within a 27-year period. As changes in landscape and climatic factors could not explain the observed declines, the authors suggested that agricultural intensification, including the use of pesticides and fertilisers, might be a plausible cause for the decreases in insect abundance. They further considered that the investigated losses in flying insect biomass can be regarded as representative for protected low-altitude areas in western Europe surrounded by human-dominated landscapes. However, we found a 70% decrease in the overall number of territories of insectivorous birds over four decades in a nature conservation area, which is also located in a strongly human-modified low-altitude landscape in the southwest of Germany. As birds feeding on insects represent the next highest trophic level, the declines of insectivore populations in our study area are most likely associated with a loss in total insect abundance.
Previous studies already found relationships between the application of agrochemicals and decreasing bird populations. Boatman et al. [18] showed, for example, indirect effects of pesticide use on the breeding success of the Corn Bunting (Emberiza calandra) and Yellowhammer (Emberiza citrinella). Jahn et al. [19] found additional indications for the indirect influence of plant protection products on farmland birds and assumed that further species might be affected negatively by pesticide use.
For specific bird species, an inverse relationship between food availability and territory size in line with the food value theory has been found [20,21,22]. Based on this assumption, a deteriorated food situation could have led to an increase in territory size among insectivorous birds in the study area, resulting in a lower total number of territories. However, the relationship between food availability and territory size often differs highly among species [22]. Thus, it is likely that other effects such as exclusive occupation of territories with sufficient food resources are involved.

4.3. Population Trends in Relation to Habitat Utilisations

Regarding habitat utilisations, we found higher proportions of declining species within the reference period for the breeding birds of wetland and open cultivated landscapes as compared to woodland birds (Table 4). The development of the overall number of territories revealed a similar pattern, but decreases for wetland species and birds of open cultivated landscapes were clearly stronger than for woodland species (Figure 3). However, differences were partially strong between insectivores and birds with other main diets (including herbivores, vertebrate consumers, and omnivores).
Among wetland birds, our analysis revealed considerably stronger relative declines of insectivorous species as compared to species feeding on other resources. This suggests that insectivores might suffer from a severe lack in food availability in this habitat in our study area. A study from the Netherlands [23] found lower abundances of macro-invertebrates in surface waters with high concentrations of the former commonly used neonicotinoid insecticide imidacloprid. Within the nature conservation area “Lampertheimer Altrhein”, there are about 100 ha of intensively used farmland without special restrictions on the usage of plant protection products, and further agricultural sites border the study site. As parts of the farmland are flooded at high water levels, it is likely that water bodies within the study area are also affected by agrochemicals. Negative impacts of pesticides and other agrochemicals on aquatic insects could therefore lead to a lack of food resources for insectivorous wetland birds. An additional factor might be lower average water levels in the study area [24] as compared with the 1970s, which could have negative impacts on wetland birds and aquatic invertebrates as a food source. It is further possible that mosquito control at “Lampertheimer Altrhein” with Bacillus thuringiensis israelensis [25] could lead to additional loss of food resources for insectivorous birds.
In the open cultivated landscapes, insectivores as well as birds with other main diets showed severe declines in populations (Figure 3). One factor with negative implications on farmland birds independent from their diet is disturbances during the breeding period due to usage of agricultural machines [26]. Previous studies showed that land use changes and the landscape setting have an influence on species richness and abundance of farmland birds [27,28]. However, within the last four decades there were only minor changes in habitat composition in the study area (Table 5). Land use in the open cultivated landscapes remained intensive for the farmland, and the meadows are still managed extensively [25]. Therefore, it is possible that the strong declines in breeding bird populations of cultivated landscapes might be associated with long-term effects of cultivation methods in the study area; for example, on food availability.
Another study from the Netherlands [29] showed, for example, significant declining populations of insectivorous birds in areas with strong application of the insecticide imidacloprid. The authors suggested that the use of this neonicotinoid could have indirect effects on populations of insectivorous farmland birds through depletion of their food resources. Other studies found further indications for indirect effects of pesticides on certain bird species [19,30]. The use of pesticides on farmland located in the study area and on bordering agricultural land could therefore be an important cause for the observed strong declines of insectivores in open cultivated landscapes.
A precise view on the farmland birds with other main diets revealed another group of breeding birds with strong declines in the open cultivated landscapes. Granivorous birds showed an equally strong relative decline in the overall number of breeding territories (−86%) in this habitat since the 1970s (Figure 5). By contrast, the vertebrate consumers and omnivores only declined by 30%. The decreasing granivorous populations might be caused by indirect effects of herbicides reducing food resources or through direct consumption of contaminated plant material [29].
Among woodland birds, population declines were not as steep as observed in the other habitats. Insectivores even revealed slighter decreases as compared with birds with other main diets. An important factor for this development might be the increase of deadwood due to reduction of forestry use of the woodland areas at “Lampertheimer Altrhein” since the 1970s [31]. In line with this, species that mainly feed on insects depending on deadwood, such as woodpeckers or the Eurasian Nuthatch (Sitta europaea), showed mainly positive long-term developments.

5. Conclusions

In this study, we show considerable changes in the range of breeding birds within four decades in a nature conservation area in southwest Germany. Within this reference period, 70% of the investigated species showed decreasing population trends, and the annual number of breeding territories across species declined by about 65%. We found strong losses in abundance for insectivorous wetland birds as well as for insectivorous and granivorous breeding birds of open cultivated landscapes, suggesting remarkable losses in food availability for these species as described in other studies [7]. As the study area even benefits from protection as a nature conservation area and EU bird reserve, our results illustrate the importance of the future challenge to preserve food resources, especially for insectivores.

Supplementary Materials

The following are available online at https://www.mdpi.com/1424-2818/10/3/97/s1, Figure S1: Species map for Great Spotted Woodpecker with single detections and defined territories; Figure S2: Species map for Bluethroat with single detections and defined territories; Figure S3: Species map for Eurasian Skylark with single detections and defined territories; Figure S4: Species map for Red-backed Shrike with single detections and defined territories; Table S1: Long-term (from 1974–1979 to 2017) and short-term (2003–2017) trends of breeding bird populations at “Lampertheimer Altrhein” (LA) in comparison with long-term (1985–2009) and short-term (1998–2009) trends for Germany [1] and long-term (1980–2011) and short-term (1990–2011) trends for Europe [2]. Every species is classified into categories of habitat use and food requirements. Species are sorted from negative to positive population developments in the long-term trend.

Author Contributions

Writing–original draft, F.S.; Writing–review & editing, M.W.

Funding

This research received no external funding.

Acknowledgements

We thank Proof-Reading-Service (Letchworth Garden City) for improving the English of our manuscript.

Conflicts of Interest

M.W. is Editor-in-Chief of DIVERSITY. Otherwise, the authors declare no conflict of interest.

References

  1. Butchart, S.H.; Walpole, M.; Collen, B.; van Strien, A.; Scharlemann, J.P.; Almond, R.E.; Baille, J.E.; Bomhard, B.; Brown, C.; Bruno, J.; et al. Global Biodiversity: Indicators of Recent Declines. Science 2010, 328, 1164–1168. [Google Scholar] [CrossRef] [PubMed]
  2. Rands, M.R.; Adams, W.M.; Bennun, L.; Butchart, S.H.; Clements, A.; Coomes, D.; Entwistle, A.; Hodge, I.; Kapos, V.; Scharlemann, J.P.; et al. Biodiversity conservation: Challenges beyond 2010. Science 2010, 329, 1298–1303. [Google Scholar] [CrossRef] [PubMed]
  3. Gamero, A.; Brotons, L.; Brunner, A.; Foppen, R.; Fornasari, L.; Gregory, R.D.; Herrando, S.; Hořák, D.; Jiguet, F.; Kmecl, P.; et al. Tracking progress toward EU biodiversity strategy targets: EU policy effects in preserving its common farmland birds. Conserv. Lett. 2017, 10, 394–401. [Google Scholar] [CrossRef]
  4. Santana, J.; Reino, L.; Stoate, C.; Borralho, R.; Carvalho, C.R.; Schindler, S.; Moreira, F.; Bugalho, M.N.; Ribeiro, P.F.; Santos, J.L.; et al. Mixed effects of long-term conservation investment in Natura 2000 farmland. Conserv. Lett. 2014, 7, 467–477. [Google Scholar] [CrossRef]
  5. Dirzo, R.; Young, H.S.; Galetti, M.; Ceballos, G.; Isaac, N.J.; Collen, B. Defaunation in the Anthropocene. Science 2014, 345, 401–406. [Google Scholar] [CrossRef] [PubMed] [Green Version]
  6. Brereton, T.M.; Botham, M.S.; Middlebrook, I.; Randle, Z.; Noble, D.; Roy, D.B. United Kingdom Butterfly Monitoring Scheme report for 2016; Centre for Ecology & Hydrology & Butterfly Conservation: Dorset, UK, 2017. [Google Scholar]
  7. Hallmann, C.A.; Sorg, M.; Jongejans, E.; Siepel, H.; Hofland, N.; Schwan, H.; Stenmans, W.; Müller, A.; Sumser, H.; Hörren, T.; et al. More than 75 percent decline over 27 years in total flying insect biomass in protected areas. PLoS ONE 2017, 12, e0185809. [Google Scholar] [CrossRef] [PubMed]
  8. Wahl, J.; Dröschmeister, R.; Gerlach, B.; Grüneberg, C.; Langgemach, T.; Trautmann, S.; Sudfeldt, C. Vögel in Deutschland 2014; Dachverband Deutscher Avifaunisten e.V., Bundesamt für Naturschutz, Länderarbeitsgemeinschaft der Vogelschutzwarten: Münster, Germany, 2015; ISBN 978-3-9815543-5-9. [Google Scholar]
  9. Südbeck, P.; Andretzke, H.; Fischer, S.; Gedeon, K.; Schikore, T.; Schröder, K.; Sudfeldt, C. Methodenstandards zur Erfassung der Brutvögel Deutschlands; Länderarbeitsgemeinschaft der Vogelschutzwarten und Dachverband Deutscher Avifaunisten e.V.: Radolfzell, Germany, 2005; ISBN 3-00-015261-X. [Google Scholar]
  10. Schwarz, J.; Flade, M. Ergebnisse des DDA-Monitoringprogramms. Teil 1: Bestandsänderungen von Vogelarten der Siedlungen seit 1989. Die Vogelwelt 2000, 121, 87–106. [Google Scholar]
  11. Eppler, G.; Petermann, P. Grunddatenerhebung für das EU-Vogelschutzgebiet “Lampertheimer Altrhein” (6316-401); Regierungspräsidium Darmstadt: Darmstadt, Germany, 2012. [Google Scholar]
  12. Petermann, P. Die Vogelwelt. In 75 Jahre Naturschutzgebiet “Lampertheimer Altrhein”. Geschichte, Lebensräume und Arten einer Landschaft am Rhein, 2nd ed.; Regierungspräsidium Darmstadt: Darmstadt, Germany, 2012; pp. 11–14. [Google Scholar]
  13. Hagemeijer, E.J.; Blair, M.J. The EBCC Atlas of European Breeding Birds: Their Distribution and Abundance; T & A.D. Poyser: London, UK, 1997. [Google Scholar]
  14. Handke, K.; Handke, U. Ergebnisse sechsjähriger Brutvogelbestandsaufnahmen im NSG “Lampertheimer Altrhein”, Kr. Bergstraße (1974–1979). Vogel Umw. 1982, 2, 75–124. [Google Scholar]
  15. Eppler, G. Arten der Vogelschutzrichtlinie. In Grunddatenerfassung zum FFH-Gebiet “Lampertheimer Altrhein” (6316-401); Regierungspräsidium Darmstadt: Darmstadt, Germany, 2003; pp. 35–54. [Google Scholar]
  16. Bauer, H.-G.; Bezzel, E.; Fiedler, W. Das Kompendium der Vögel Mitteleuropas, 2nd ed.; AULA-Verlag: Wiebelsheim, Germany, 2012; ISBN 978-3-89104-758-3. [Google Scholar]
  17. Siegel, H. Bemerkenswerte Brutzeitbeobachtungen in Hessen 1985. Kormoran-Phalocrocorax carbo. Vogel Umw. 1985, 3, 368. [Google Scholar]
  18. Boatman, N.D.; Brickle, N.W.; Hart, J.D.; Milsom, T.P.; Morris, A.J.; Murray, A.W.; Murray, K.A.; Robertson, P.A. Evidence for the indirect effects of pesticides on farmland birds. IBIS 2004, 146, 131–143. [Google Scholar] [CrossRef] [Green Version]
  19. Jahn, T.; Hötker, H.; Oppermann, R.; Bleil, R.; Vele, L. Protection of Biodiversity of Free Living Birds and Mammals in Respect of the Effects of Pesticides; Umweltbundesamt: Dessau-Roßlau, Germany, 2014. [Google Scholar]
  20. Rutschke, E. Zur Dynamik und Funktion von Vogelrevieren. Ann. Naturhist. Mus. Wien 1986, 88/89, 171–180. [Google Scholar]
  21. Stenger, J. Food habits and available food of ovenbirds in relation to territory size. Auk 1958, 75, 335–346. [Google Scholar]
  22. Adams, E.S. Approaches to the Study of Territory Size and Shape. Annu. Rev. Ecol. Syst. 2001, 32, 277–303. [Google Scholar] [CrossRef]
  23. Van Dijk, T.C.; van Staalduinen, M.A.; van der Sluijs, J.P. Macro-invertebrate decline in surface water polluted with imidacloprid. PLoS ONE 2013, 8, e62374. [Google Scholar] [CrossRef] [PubMed]
  24. Petermann, P. Das NSG Lampertheimer Altrhein-ein Jahr nach den Eingriffen in den Wasserhaushalt-eine erste Bilanz. Collurio 2015, 31, 1–21. [Google Scholar]
  25. Silber, A. Die Geschichte der Naturschutzgebietsverordnung. In 75 Jahre Naturschutzgebiet “Lampertheimer Altrhein”. Geschichte, Lebensräume und Arten einer Landschaft am Rhein, 2nd ed.; Regierungspräsidium Darmstadt: Darmstadt, Germany, 2012; pp. 8–9. [Google Scholar]
  26. Wink, M.; Dietzen, C.; Gießing, B. Allgemeine Ergebnisse zur Vogelverbreitung im Rheinland (Nordrhein). In Die Vögel des Rheinlandes (Nordrhein). Ein Atlas der Brut- und Wintervogelverbreitung 1990 bis 2000. Beiträge zur Avifauna Nordrhein-Westfalens; Wink, M., Dietzen, C., Gießing, B., Eds.; Romneya Verlag: Dossenheim, Germany, 2005; Volume 36, pp. 17–31. ISBN 3-931921-07-7. [Google Scholar]
  27. Wretenberg, J.; Pärt, T.; Berg, Å. Changes in local species richness of farmland birds in relation to land-use changes and landscape structure. Biol. Conserv. 2010, 143, 375–381. [Google Scholar] [CrossRef]
  28. Berg, A.; Wretenberg, J.; Zmihorski, M.; Hiron, M.; Pärt, T. Linking occurrence and changes in local abundance of farmland bird species to landscape composition and land-use changes. Agric. Ecosyst. Environ. 2015, 204, 1–7. [Google Scholar] [CrossRef] [Green Version]
  29. Hallmann, C.A.; Foppen, R.P.; van Turnhout, C.A.; de Kroon, H.; Jongejans, E. Declines in insectivorous birds are associated with high neonicotinoid concentrations. Nature 2014, 511, 341–343. [Google Scholar] [CrossRef] [PubMed]
  30. Campbell, L.H.; Avery, M.L.; Donald, P.; Evans, A.D.; Greem, R.E.; Wilson, J.D. A Review of the Indirect Effects of Pesticides on Birds; JNCC Report. No. 227; Joint Nature Conservation Committee: Peterborough, UK, 1997. [Google Scholar]
  31. Kluge, W. Die Waldbewirtschaftung. In 75 Jahre Naturschutzgebiet “Lampertheimer Altrhein”. Geschichte, Lebensräume und Arten einer Landschaft am Rhein, 2nd ed.; Regierungspräsidium Darmstadt: Darmstadt, Germany, 2012; pp. 18–20. [Google Scholar]
Figure 1. Location and boundaries of the study area “Lampertheimer Altrhein”. The red line marks the border of the nature conservation area; the yellow line marks the borders of the study site, which was divided into three subareas A, B, C. A 1 km distance bar is shown at the lower left side of the map.
Diversity 10 00097 g001
Figure 2. Number of territories across species at “Lampertheimer Altrhein” between 1974 and 1979 (average values) and in 2017 grouped by the main diet of adults and nestlings during the breeding period. The values for 2017 were extrapolated to the size of the study area in 1974–1979.
Diversity 10 00097 g002
Figure 3. Number of territories across species at “Lampertheimer Altrhein” between 1974 and 1979 (average values) and in 2017 grouped by habitat and main food source. The values for 2017 were extrapolated to the size of the study area in 1974–1979.
Diversity 10 00097 g003
Figure 4. Number of territories across species at “Lampertheimer Altrhein” and Shannon index between 1974 and 1979 (average values) and in 2017. The number of territories for 2017 was extrapolated to the size of the study area in 1974–1979.
Diversity 10 00097 g004
Figure 5. Number of territories across species for breeding birds of open cultivated landscapes at “Lampertheimer Altrhein” between 1974 and 1979 (average values) and in 2017 grouped by main diet. The category "Other diets" includes vertebrate consumers and omnivores. The values for 2017 were extrapolated to the size of the study area in 1974–1979.
Diversity 10 00097 g005
Table 1. List of breeding bird species at “Lampertheimer Altrhein” in 2017 including number of territories, abundance for the total study area, and abundance for suitable habitat. Species are sorted according to the systematic order of the IOC World Bird List.
Common Name
(IOC World Bird List) 1
Scientific Name
(IOC World Bird List) 1
Number of Confirmed TerritoriesAbundance
Total Study Area
(Territories/10 ha)
Abundance
Suitable Habitat
(Territories/10 ha)
Grey PartridgePerdix perdix10.020.15
Common PheasantPhasianus colchicus100.220.61
Canada GooseBranta canadensis10.020.15
Greylag GooseAnser anser20.040.31
Mute SwanCygnus olor50.110.76
Egyptian GooseAlopochen aegyptiaca50.110.76
GadwallMareca strepera10.020.15
MallardAnas platyrhynchos60.130.92
Common CuckooCuculus canorus70.160.31
Stock DoveColumba oenas40.090.28
Common Wood PigeonColumba palumbus170.381.07
European Turtle DoveStreptopelia turtur10.020.11
Eurasian CootFulica atra20.040.31
Great Crested GrebePodiceps cristatus4 0.090.61
Great CormorantPhalacrocorax carbo711.58-
Western Marsh HarrierCircus aeruginosus10.02-
Red KiteMilvus milvus10.02-
Black KiteMilvus migrans30.07-
Common BuzzardButeo buteo30.07-
Tawny OwlStrix aluco40.09-
Common KingfisherAlcedo atthis10.020.15
Middle Spotted WoodpeckerDendrocoptes medius50.110.54
Lesser Spotted WoodpeckerDryobates minor30.070.33
Great Spotted WoodpeckerDendrocopos major200.441.00
Black WoodpeckerDryocopus martius30.070.33
Grey-headed WoodpeckerPicus canus40.090.27
European Green WoodpeckerPicus viridis110.240.73
Common KestrelFalco tinnunculus20.04-
Eurasian HobbyFalco subbuteo10.02-
Eurasian Golden OrioleOriolus oriolus80.180.40
Red-backed ShrikeLanius collurio110.240.81
Eurasian JayGarrulus glandarius90.200.40
Carrion CrowCorvus corone20.040.22
Marsh TitPoecile palustris80.180.68
Eurasian Blue TitCyanistes caeruleus410.911.80
Great TitParus major611.363.07
Eurasian SkylarkAlauda arvensis80.180.81
Long-tailed TitAegithalos caudatus100.220.57
Common ChiffchaffPhylloscopus collybita420.931.85
Eurasian Reed WarblerAcrocephalus scirpaceus360.805.94
Icterine WarblerHippolais icterina30.070.28
Eurasian BlackcapSylvia atricapilla611.362.38
Garden WarblerSylvia borin100.220.44
Common WhitethroatSylvia communis100.220.39
Eurasian WrenTroglodytes troglodytes140.311.52
Eurasian NuthatchSitta europaea260.581.73
Eurasian TreecreeperCerthia familiaris20.040.22
Short-toed TreecreeperCerthia brachydactyla220.491.54
Common StarlingSturnus vulgaris230.511.14
Common BlackbirdTurdus merula190.421.12
Song ThrushTurdus philomelos160.361.63
Spotted FlycatcherMuscicapa striata90.200.45
European RobinErithacus rubecula90.200.98
BluethroatLuscinia svecica60.131.08
Common NightingaleLuscinia megarhynchos150.330.66
European Pied FlycatcherFicedula hypoleuca10.020.11
DunnockPrunella modularis50.110.22
Eurasian Tree SparrowPasser montanus90.200.83
Western Yellow WagtailMotacilla flava flava110.241.12
Common ChaffinchFringilla coelebs511.132.54
HawfinchCoccothraustes coccothraustes60.130.65
European GreenfinchChloris chloris10.020.11
European GoldfinchCarduelis carduelis60.130.30
European SerinSerinus serinus10.020.11
YellowhammerEmberiza citrinella200.440.78
Common Reed BuntingEmberiza schoeniclus30.070.54
1 Source: IOC World Bird List Version 7.3 (www.worldbirdnames.org).
Table 2. Comparison of the number of territories in 2017 with results of former investigations on breeding birds from 1974 to 1979 and in 2003 at “Lampertheimer Altrhein”. The long-term trend is based on the average number of territories between 1974 and 1979 [14]. The short-term trend is based on the number of territories in 2003 [15]. Species are sorted from negative to positive population developments in the long-term trend.
Common Name (IOC World Bird List) 1Scientific Name (IOC World Bird List) 1Investigation on Breeding Birds 1974–1979 (Number of Territories)Investigation on Selected Species 2003 (Number of Territories) Current Results 2017 (Number of Territories)Long-Term Trend (%)Short-Term Trend (%)
Range of the Number of TerritoriesAverage Number of Territories
Marsh WarblerAcrocephalus palustris110110n.r.0X
Willow WarblerPhylloscopus trochilus24–3932n.r.0X
Common MoorhenGallinula chloropus2–6031.2n.r.0X
FieldfareTurdus pilaris17–4025.7n.r.0X
Common RedstartPhoenicurus phoenicurus6–2414.160XX
Tree PipitAnthus trivialis11–1211.8n.r.0X
Grey HeronArdea cinerea0–279.2600XX
Willow TitPoecile montanus7–148.8n.r.0X
Little Owl Athene noctua8–98.410XX
Great Reed WarblerAcrocephalus arundinaceus5–128.300X
White WagtailMotacilla alba66n.r.0X
Common Grasshopper WarblerLocustella naevia1–15520XX
Water RailRallus aquaticus0–94.900X
Long-eared OwlAsio otus>3–5>4.320XX
Eurasian MagpiePica pica1–53n.r.0X
Little GrebeTachybaptus ruficollis0–52.800X
Common LinnetLinaria cannabina1–32.5n.r.0X
Little BitternIxobrychus minutus0–32.300X
Sedge WarblerAcrocephalus schoenobaenus1–51.9n.r.0X
Corn BuntingEmberiza calandra0–21.4n.r.0X
Eurasian Collared DoveStreptopelia decaocto1–21.2n.r.0X
Western JackdawColoeus monedula11n.r.0X
Northern LapwingVanellus vanellus0–31n.r.0X
Black-crowned Night HeronNycticorax nycticorax0–30.900X
Purple HeronArdea purpurea0–30.900X
Savi’s WarblerLocustella luscinioides0–50.8n.r.0X
Lesser WhitethroatSylvia curruca0–20.7n.r.0X
Wood WarblerPhylloscopus sibilatrix0–20.7n.r.0X
House SparrowPasser domesticus0–20.5n.r.0X
Little CrakePorzana parva0–20.5n.r.0X
Corn CrakeCrex crex0–20.4n.r.0X
Little Ringed PloverCharadrius dubius0–10.3n.r.0X
River WarblerLocustella fluviatilis0–20.3n.r.0X
GarganeySpatula querquedula0–10.200X
Swan GooseAnser cygnoides0010 X
Yellow-legged GullLarus michahellis0010 X
Common Reed BuntingEmberiza schoeniclusca. 250ca. 250n.r.3−99
Eurasian CootFulica atra2–10659.6n.r.2−97
Eurasian Tree SparrowPasser montanusca. 350ca. 350n.r.9−97
European Turtle DoveStreptopelia turtur29–4537.2111−97−91
European GreenfinchChloris chloris19–2723.3n.r.1−96
Great Crested GrebePodiceps cristatus4–7047.34–54−92−11
Eurasian Reed WarblerAcrocephalus scirpaceusca. 400ca. 400180–20036−91−81
Common StarlingSturnus vulgarisca. 220ca. 220n.r.23−90
Dunnock Prunella modularis46–5149n.r.5−90
Carrion CrowCorvus corone14–1916.5n.r.2−88
Common BlackbirdTurdus merula130130n.r.19−85
Eurasian WrenTroglodytes troglodytes64–7569.5n.r.14−80
Eurasian SkylarkAlauda arvensis38383–48−79+129
Common NightingaleLuscinia megarhynchos55–6659.3n.r.15−75
Grey PartridgePerdix perdix3–5421−75−50
Garden WarblerSylvia borin30–5138.7n.r.10−74
European RobinErithacus rubecula28–3732.8n.r.9−73
MallardAnas platyrhynchos16–3122.2n.r.6−73
BluethroatLuscinia svecica12–3120.621–306−71−76
European GoldfinchCarduelis carduelis16–2018n.r.6−67
Icterine WarblerHippolais icterina88113−63−73
Common Wood PigeonColumba palumbus3939n.r.17−56
Common CuckooCuculus canorus1515n.r.7−53
Common KestrelFalco tinnunculus3–54.1n.r.2−51
Eurasian Golden OrioleOriolus oriolus14–2016.3178−51−53
Song ThrushTurdus philomelos23–3929n.r.16−45
Eurasian BlackcapSylvia atricapilla95–120107.5n.r.61−43
Eurasian Blue TitCyanistes caeruleus7070n.r.41−41
Common ChiffchaffPhylloscopus collybita65–7570n.r.42−40
Lesser Spotted WoodpeckerDryobates minor3–74.62–33−35+20
Short-toed Tree creeperCerthia brachydactyla31–3533n.r.22−33
Great TitParus major9090n.r.61−32
Common WhitethroatSylvia communis1–2212.53910−20−74
Black KiteMilvus migrans2–53.711–153−18−77
Common ChaffinchFringilla coelebs48–5551.5n.r.51−1
Common BuzzardButeo buteo2–43n.r.3±0
Long-tailed TitAegithalos caudatus6–149.5n.r.10+5
Grey-headed WoodpeckerPicus canus2–53.50–14+14*
Tawny OwlStrix aluco2–43.234+25+33
YellowhammerEmberiza citrinella14–1615n.r.20+33
Spotted FlycatcherMuscicapa striata1–135.3n.r.9+70
Great Spotted WoodpeckerDendrocopos major1010n.r.20+100
Eurasian JayGarrulus glandarius4–54.3n.r.9+108
European Green WoodpeckerPicus viridis3–542–411+175+267
Eurasian NuthatchSitta europaea6–128.3n.r.26+212
Western Yellow WagtailMotacilla flava flava0–72.33–411+371+214
Common KingfisherAlcedo atthis0–10.211*±0
European Pied FlycatcherFicedula hypoleuca0–10.2n.r.1*
GadwallMareca strepera0–10.201*new
Western Marsh HarrierCircus aeruginosus0–10.301*new
Black WoodpeckerDryocopus martius1–21.31–23**
Middle Spotted WoodpeckerDendrocoptes medius1–21.54–55*+11
Mute SwanCygnus olor0–31.2n.r.5*
HawfinchCoccothraustes coccothraustes1–21.4n.r.6*
Canada GooseBranta canadensis0021new−50
Eurasian HobbyFalco subbuteo0011new±0
European SerinSerinus serinus00n.r.1new
Red KiteMilvus milvus00n.r.1new
Eurasian TreecreeperCerthia familiaris00n.r.2new
Greylag GooseAnser anser0012new+100
Stock DoveColumba oenas0024new+100
Egyptian GooseAlopochen aegyptiaca00n.r.5new
Marsh TitPoecile palustris00n.r.8new
Red-backed ShrikeLanius collurio00711new+57
Great CormorantPhalacrocorax carbo0024071new−70
Symbols and Abbreviations:1 Source: IOC World Bird List Version 7.3 (www.worldbirdnames.org); X former breeding bird species that were not recorded in 2017; ca. results based on sampling areas (1975–1979); new new breeding bird species as compared to the year 2003 or the time period 1974–1979; n.r. species was not recorded in the context of the investigation; * for species with small numbers of territories (≤2 territories) or irregular breeding occurrence within the time period 1974–1979, increasing numbers of territories led to less meaningful results.
Table 3. Long-term development of breeding bird species in relation to their food sources at “Lampertheimer Altrhein” (from 1974–1979 to 2017).
Food 1IncreaseConstantDecrease
Herbivores (n = 21)43%0%57%
Insectivores (n = 70)20%6%74%
Vertebrate consumers (n = 18)33%17%50%
Omnivores (n = 8)13%0%88%
1 Classification according to the main diet of adults and nestlings during the breeding period.
Table 4. Long-term development of breeding bird species depending on their habitat use at “Lampertheimer Altrhein” (from 1974–1979 to 2017).
HabitatIncreaseConstantDecrease
Wetland (n = 29)28%0%72%
Open cultivated landscapes (n = 27)22%11%67%
Woodland (n = 39)31%10%59%
Table 5. Habitat composition at “Lampertheimer Altrhein” between the 1970s [14] and 2012 [11].
Habitat TypeArea 1970s (ha)Area in 2012 (ha)
Floodplain forest 8592
Intensively used farmland12498
Extensively used meadows, grassland119135
Water bodies6565
Reed beds5356

