Case Report

Longitudinal Whole-Exome Sequencing of Cell-Free DNA Reveals Molecular Evolution and Heterogeneous Clinical Outcomes in PD-L1 Stratified Advanced NSCLC Adenocarcinoma Patients Treated with Atezolizumab


1
Cancer Genomics & Systems Biology Lab, University of Siena, 53100 Siena, Italy
2
Med Biotech Hub and Competence Centre, Department of Medical Biotechnologies, University of Siena, 53100 Siena, Italy
3
Department of Medical, Surgical and Neurological Sciences, University of Siena, 53100 Siena, Italy
4
Oncology Unit, Azienda Ospedaliero Universitaria Senese, 53100 Siena, Italy
5
Thoracic Surgery Unit, Azienda Ospedaliera Universitaria Senese, 53100 Siena, Italy
6
Bioengineering Laboratory, University of Siena, 53100 Siena, Italy
7
Department of Experimental and Clinical Medicine, University “Magna Graecia” of Catanzaro, Campus “S. Venuta”, Germaneto, 88100 Catanzaro, Italy
8
Clinical Pathology Unit, Azienda Ospedaliero-Universitaria Senese, 53100 Siena, Italy
9
Institute for Biomedical Technologies, National Research Council, Segrate, 20054 Milan, Italy
*
Author to whom correspondence should be addressed.
These authors contributed equally to this work.
Int. J. Mol. Sci. 2026, 27(7), 2947; https://doi.org/10.3390/ijms27072947
Submission received: 24 February 2026 / Revised: 16 March 2026 / Accepted: 19 March 2026 / Published: 24 March 2026
(This article belongs to the Special Issue New Advances in Cancer Genomics)

Abstract

Programmed death-ligand 1 (PD-L1) expression is routinely used to guide immune checkpoint inhibitor (ICI) therapy in advanced non-small cell lung cancer (NSCLC), yet clinical benefit remains heterogeneous even among PD-L1–high tumors. Liquid biopsy based on cell-free DNA (cfDNA) enables minimally invasive, real-time monitoring of tumor evolution. We report four cases of metastatic lung adenocarcinoma treated with atezolizumab, integrating longitudinal whole-exome sequencing (WES) of cfDNA with radiological assessment. Four patients with PD-L1–positive (≥60%) metastatic NSCLC received atezolizumab monotherapy. Serial cfDNA samples (1–3 per patient) were analyzed by high-depth WES. Distinct molecular trajectories paralleled divergent clinical outcomes. One patient achieved a complete molecular response, characterized by progressive clearance of KRAS, ATM, and NF1 mutant clones, which was concordant with radiological remission. A second patient showed an initial molecular response, followed by clonal rebound of TP53, NF1, and NOTCH2 mutant populations and the emergence of PTEN and KIF1A variants, suggesting clinical progression. Two patients exhibited primary resistance despite high PD-L1 expression, with persistent or expanding clones and early subclonal diversification; in one case, new EGFR and BRAF alterations emerged under treatment pressure. Notably, switching to platinum-based chemotherapy in a non-responder induced a measurable molecular response, highlighting discordance between PD-L1 status and immunotherapy efficacy. Longitudinal cfDNA WES captured dynamic clonal remodeling under immunotherapy and anticipated radiological outcomes. These findings underscore the clinical necessity of integrating dynamic molecular monitoring by liquid biopsy to overcome the limitations of static PD-L1 assessment, refine therapeutic stratification, and identify early resistance mechanisms in advanced NSCLC.

1. Introduction

Lung cancer (LC) develops from cells within the respiratory system, including the bronchi, bronchioles, and alveoli. It usually presents as a tumor mass that can obstruct airflow or cause bleeding in the lungs or bronchi. LC remains the leading cause of cancer-related deaths worldwide, with its high incidence and frequently poor prognosis posing a significant public health concern. Current estimates indicate that lung cancer is responsible for roughly 2.5 million new diagnoses and 1.8 million deaths each year, accounting for nearly 18% of global cancer fatalities [1,2]. The elevated mortality rate is largely due to late-stage detection and the aggressive behavior of the disease. Incidence is rising in industrialized countries, driven by risk factors such as smoking, exposure to hazardous substances like asbestos and radon, and environmental air pollution. Smoking has been extensively linked to lung cancer, with heavy smokers facing a 60-fold higher risk than non-smokers [3].
Non-Small Cell Lung Carcinoma (NSCLC) accounts for approximately 85% of cases [4]. Among its histological subtypes, adenocarcinoma is the most prevalent, often characterized by an aggressive clinical course and a frequent diagnosis at advanced stages. Genetic characterization of LC is increasingly guiding personalized treatment approaches, offering hope for improved survival and more effective therapies. The molecular landscape of LC is highly diverse, and understanding key genetic alterations is essential for developing individualized treatment plans. The most frequently implicated driver genes include EGFR, KRAS, ALK, BRAF, and ROS1 [5,6,7,8].
In addition to these main driver mutations, other emerging biomarkers are gaining clinical importance, including PD-L1, MET, RET, and NTRK alterations [9,10]. PD-L1, an immune checkpoint protein, allows tumors to evade immune surveillance; its overexpression can contribute to more aggressive disease and resistance to immunotherapy. However, PD-L1 expression is a snapshot of spatial and temporal expression that often fails to capture the tumor’s dynamic genomic landscape under therapeutic pressure.
Despite advances in targeted and immune-based therapies, early detection remains critical for improving outcomes. To capture this dynamic evolution, liquid biopsy has emerged as a pivotal tool for precision oncology. By analyzing cell-free DNA (cfDNA) and its tumor-derived component (ctDNA), it is possible to perform longitudinal monitoring via minimally invasive blood draws. This approach overcomes the limitations of static tissue biopsies, providing real-time insights into clonal evolution, treatment response, and the emergence of resistance mechanisms [11,12,13,14,15].
Here, we present four cases of advanced NSCLC adenocarcinoma with PD-L1 positivity, all treated with atezolizumab monotherapy. Despite their shared histological and therapeutic characteristics, these patients exhibited markedly divergent clinical trajectories. In this study, we used longitudinal whole-exome sequencing (WES) of cfDNA to decipher the molecular drift and clonal dynamics that underpin the heterogeneous clinical outcomes in a cohort of PD-L1-stratified NSCLC patients. Full methodological details are reported in the Supplementary Methods. The data are integrated with clinical assessment and imaging-based follow-up, highlighting the potential of cfDNA analysis to elucidate heterogeneity in treatment response in immunotherapy-treated lung cancer.

2. Case Presentation

Four patients (2 males and 2 females) diagnosed with advanced NSCLC adenocarcinoma were enrolled at the Oncology Unit of Azienda Ospedaliero-Universitaria Senese (AOUS). All patients exhibited PD-L1 expression levels >60% meeting the eligibility criteria for first-line atezolizumab monotherapy (Table 1).
At diagnosis (T0), peripheral blood samples were collected to perform cfDNA-based liquid biopsy, enabling baseline molecular characterization prior to treatment initiation. For longitudinal monitoring, serial blood samples were obtained at each follow-up time point to compare genomic profiles across multiple liquid biopsy assessments, along with the radiological images.
Notably, three distinct clinical response patterns to atezolizumab were observed among the patients. Despite shared PD-L1 positivity and identical treatment, the heterogeneous clinical and molecular trajectories revealed a profound decoupling between PD-L1 status and genomic evolution. These findings underscore the limitations of relying solely on PD-L1 expression as a predictive biomarker and emphasize the need for more refined, dynamic, and personalized molecular stratification strategies. The molecular profiles resulting from each cfDNA liquid biopsy for each patient are reported in the Supplementary Table S1.

2.1. First Case

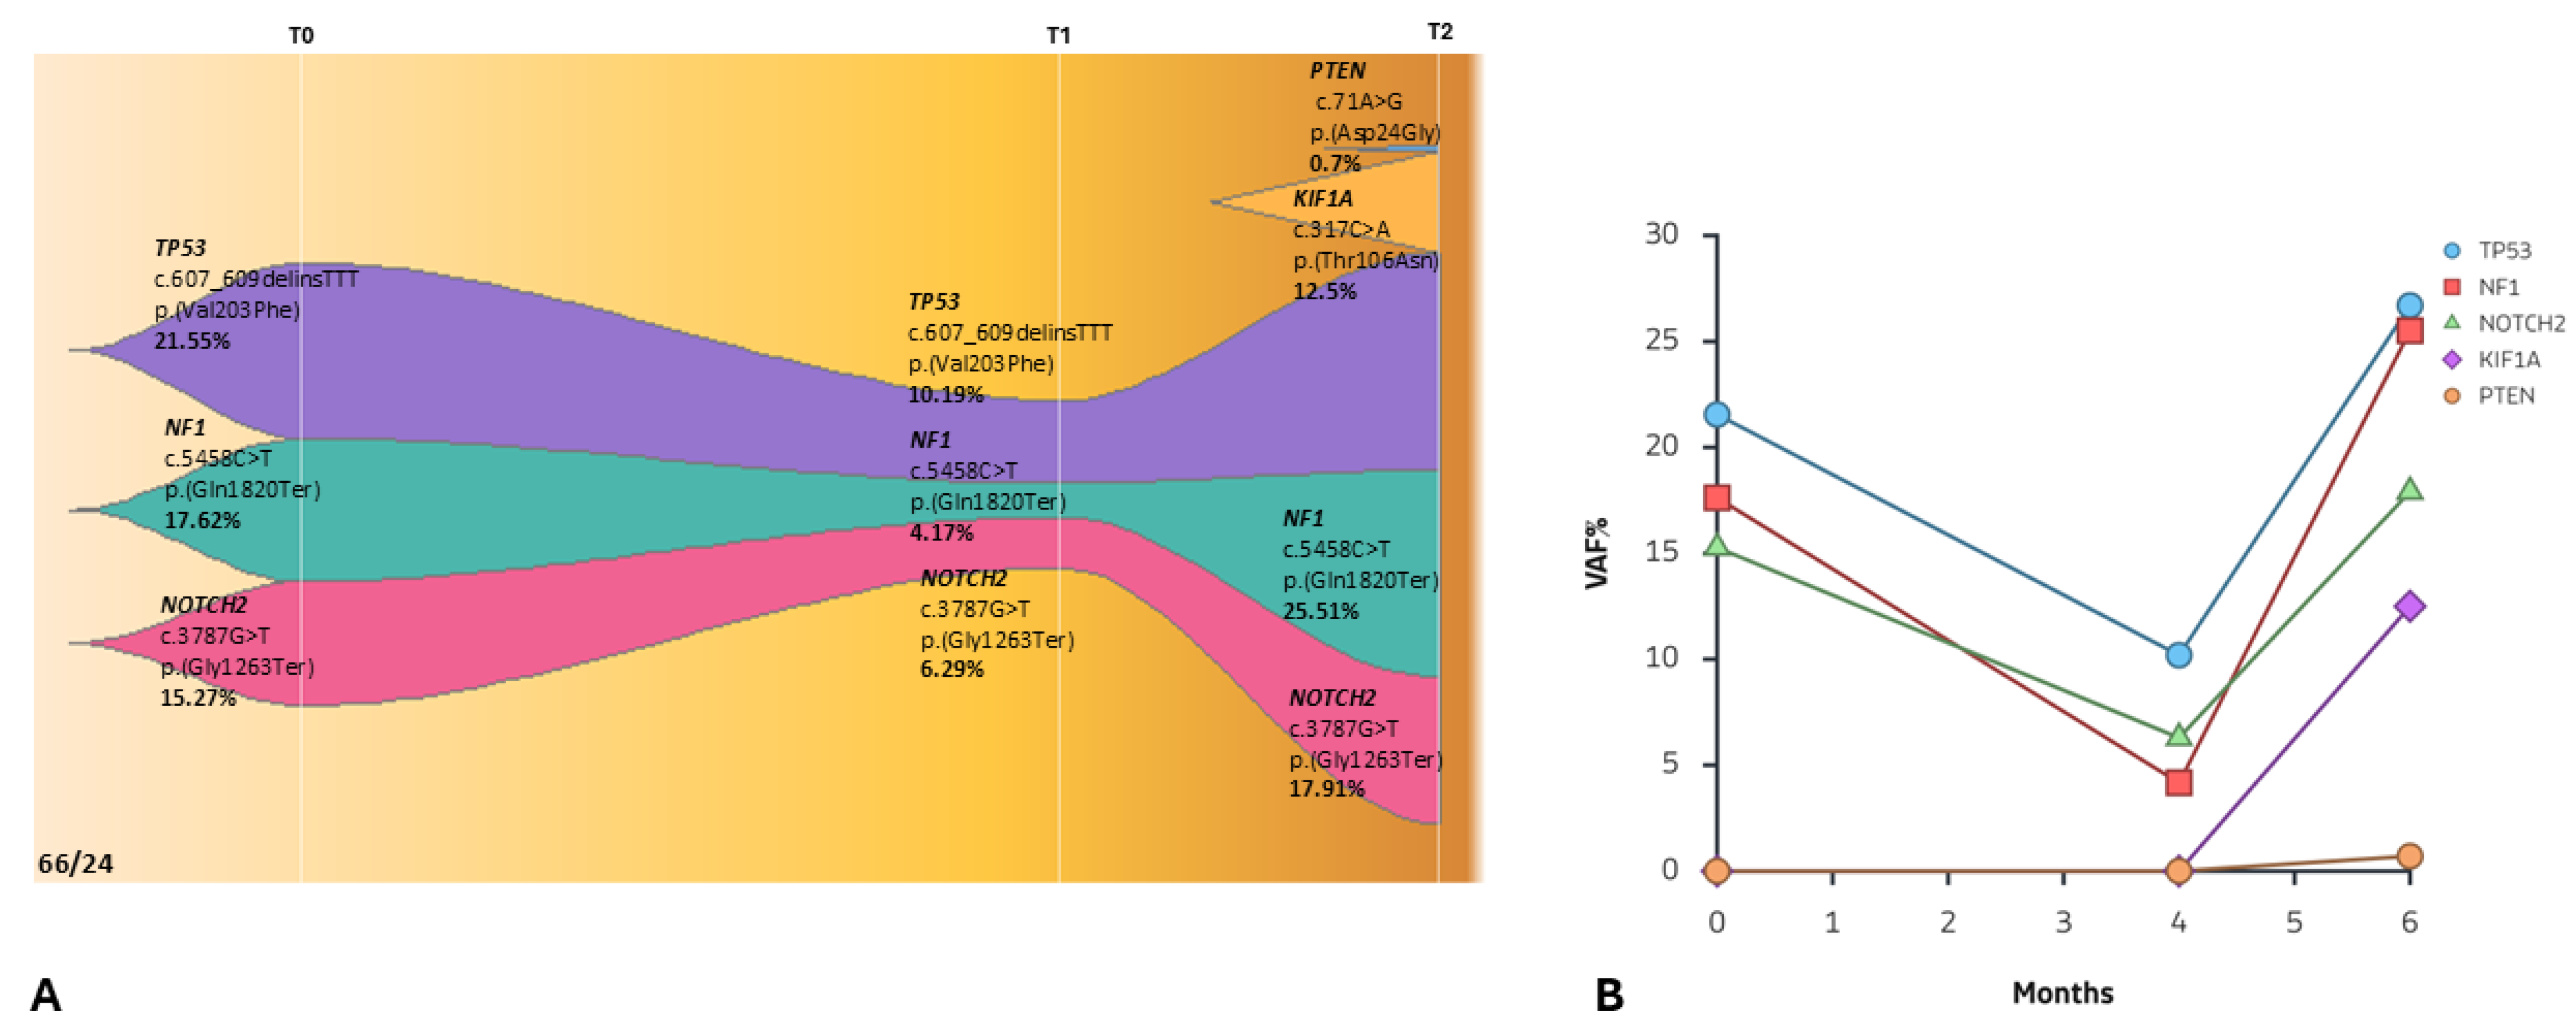
Patient 66/24 (Figure 1A), a 55-year-old female (PD-L1: 60%), underwent baseline high-depth cfDNA WES at diagnosis (T0). Molecular profiling identified three predominant expanded clones involving pathogenic variants in TP53 [c.607_609delinsTTT; p.(Val203Phe)], NF1 [c.5458C>T; p.(Gln1820Ter)], and NOTCH2 [c.3787G>T; p.(Gly1263Ter)], with variant allele frequencies (VAFs) of 21.55%, 17.62%, and 15.27%, respectively (Figure 2A,B).
The patient initiated first-line atezolizumab monotherapy. After four months of treatment (T1), a second cfDNA assessment demonstrated a marked reduction in the VAFs of the previously detected driver mutations, TP53 [c.607_609delinsTTT; p.(Val203Phe)], NF1 [c.5458C>T; p.(Gln1820Ter)], and NOTCH2 [c.3787G>T; p.(Gly1263Ter)], which decreased up to 10.19%, 4.17%, and 6.29%, respectively (Figure 2A,B). This molecular response paralleled radiological findings, demonstrating a significant reduction in tumor burden. However, at the subsequent follow-up two months later (T2), a third cfDNA analysis revealed clear molecular progression (Figure 2A).
Specifically, a rapid increase in the VAFs of the previously identified driver clones (TP53, NF1, and NOTCH2 reaching VAFs of 26.7%, 25.51%, and 17.91%) was observed, accompanied by the emergence of two novel variants in KIF1A [c.317C>A, p.(Thr106Asn), VAF = 12.50%] and in PTEN [c.71A>G, p.(Asp24Gly), VAF = 0.70%].
These findings were consistent with acquired resistance to atezolizumab and paralleled radiological evidence of disease progression (Figure 1B). At the second follow-up, cerebral metastasis was identified. Despite the therapeutic switch to carboplatin plus pemetrexed, the patient succumbed to the disease two months later.

2.2. Second Case

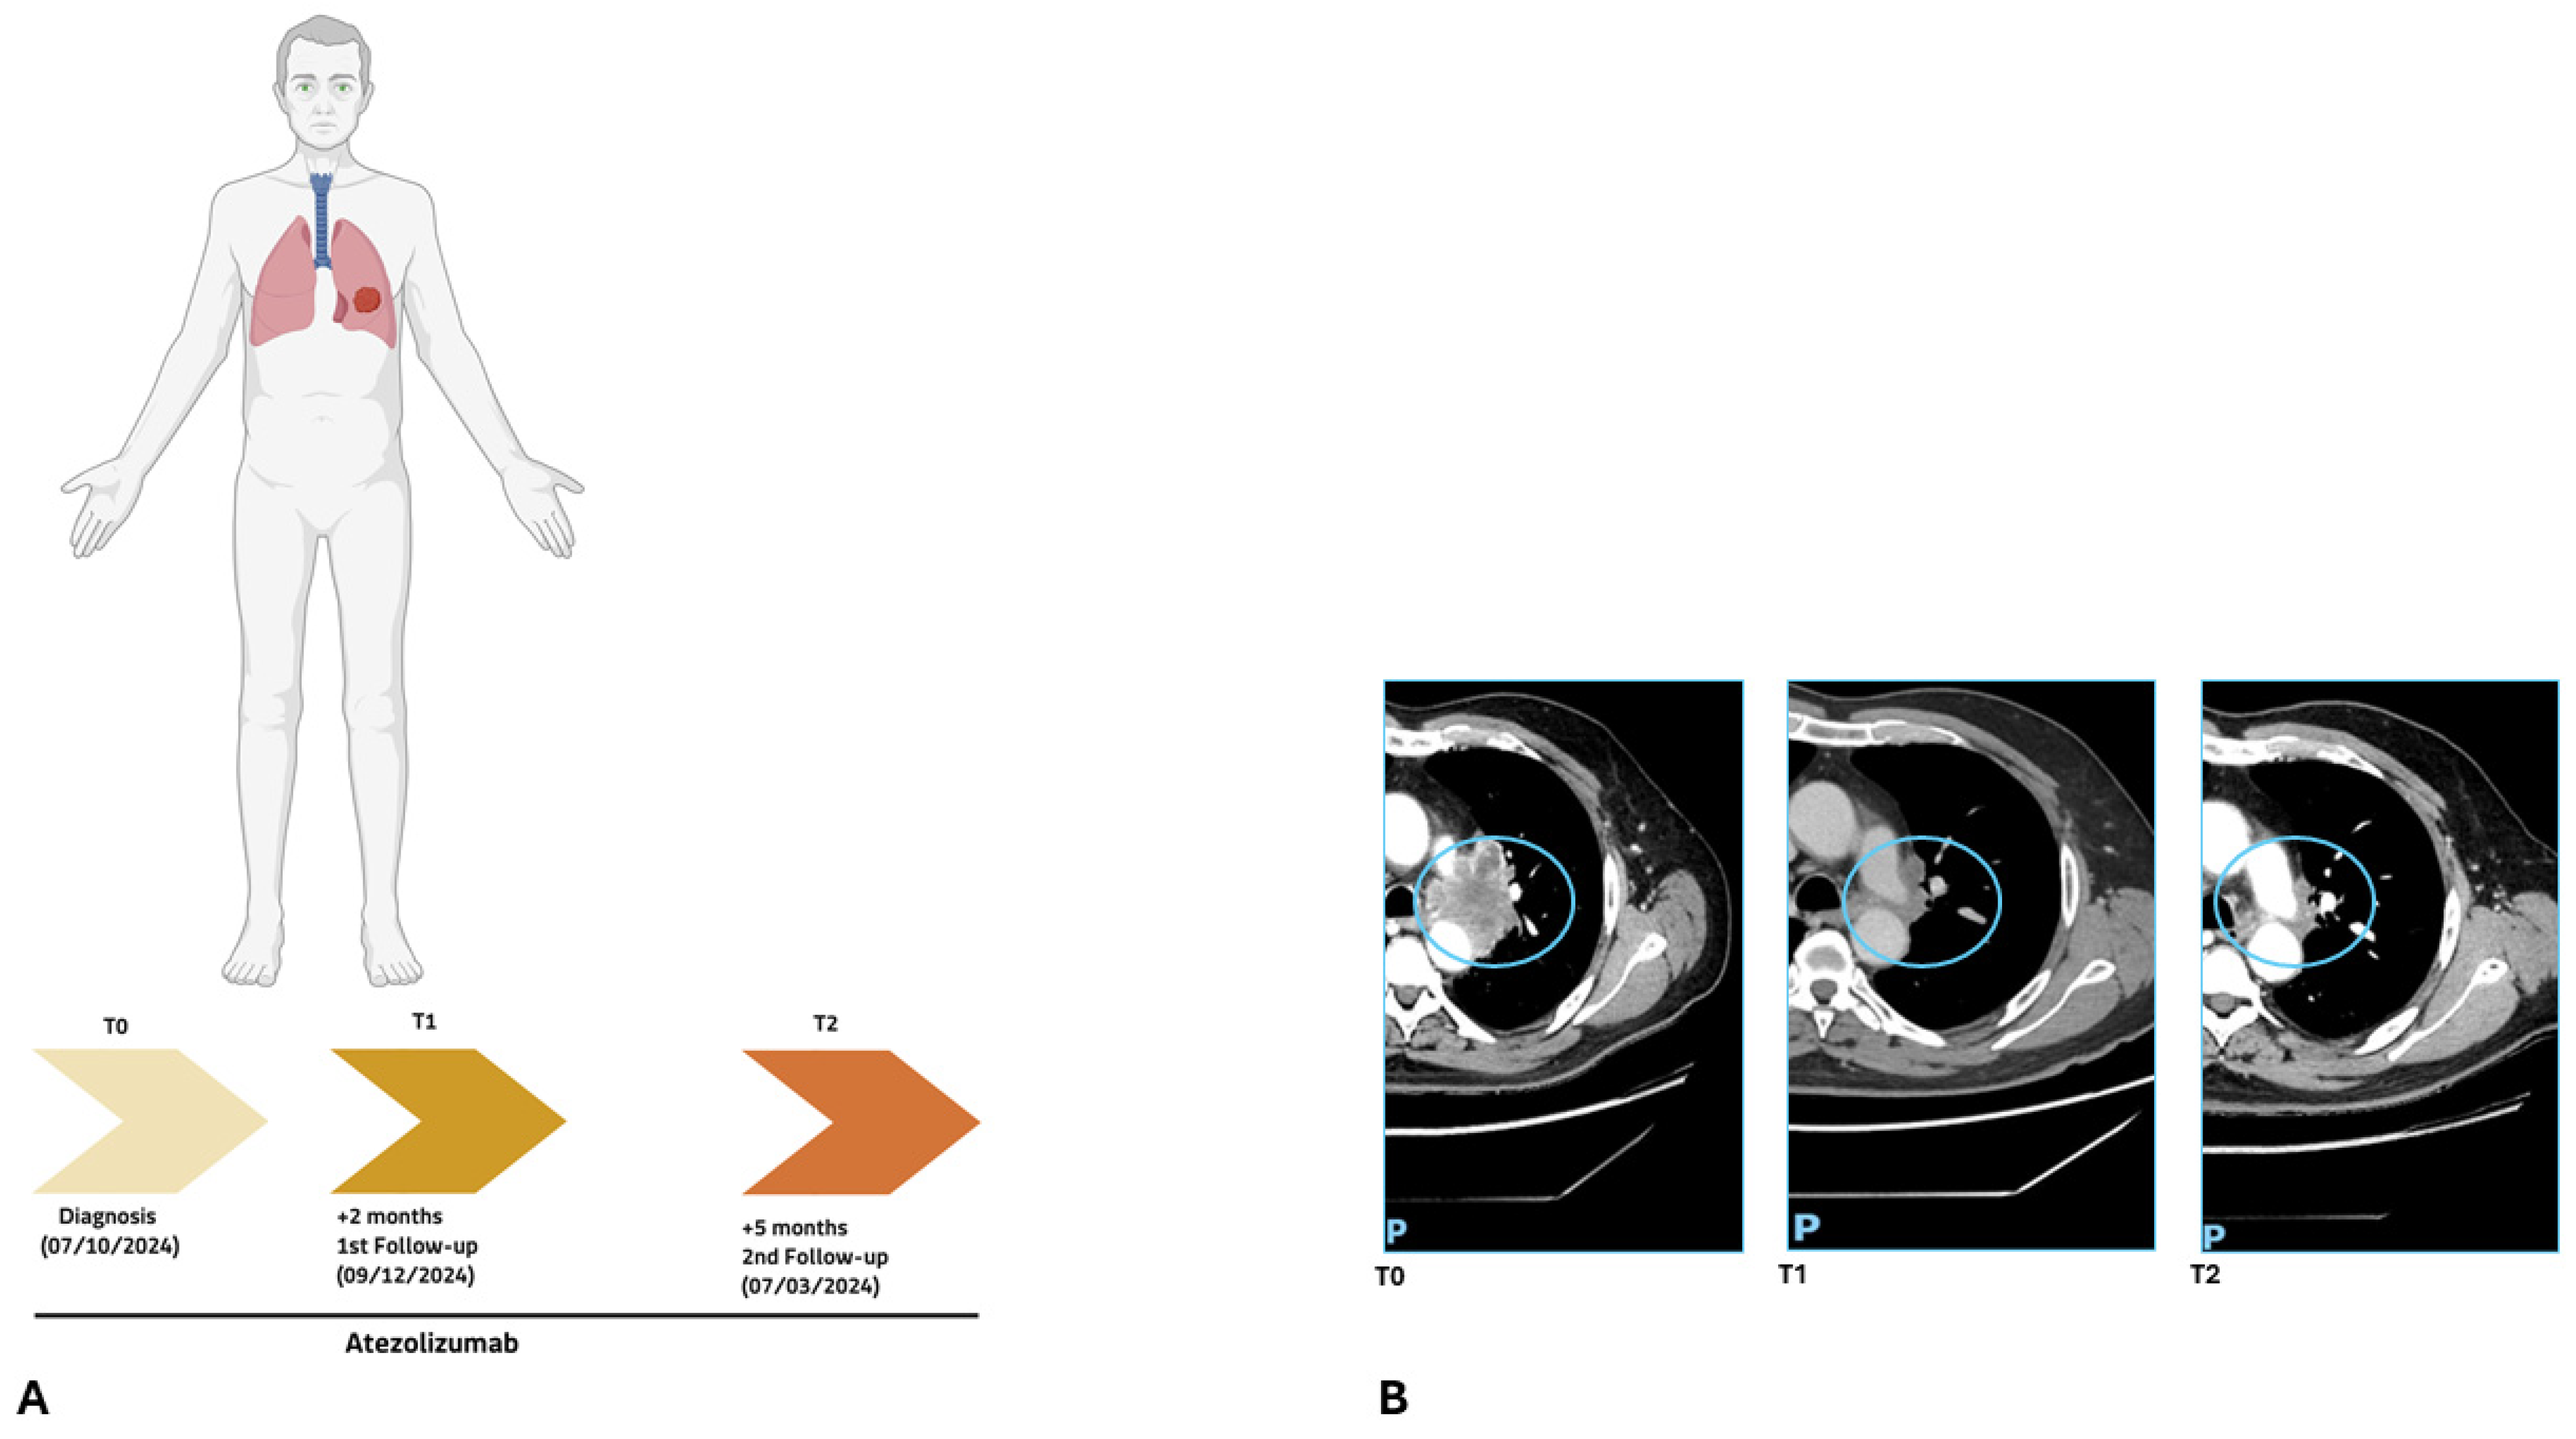
Patient 111/24, a 68-year-old male, presented with high PD-L1 expression (90%) and initiated first-line atezolizumab monotherapy (Figure 3A).
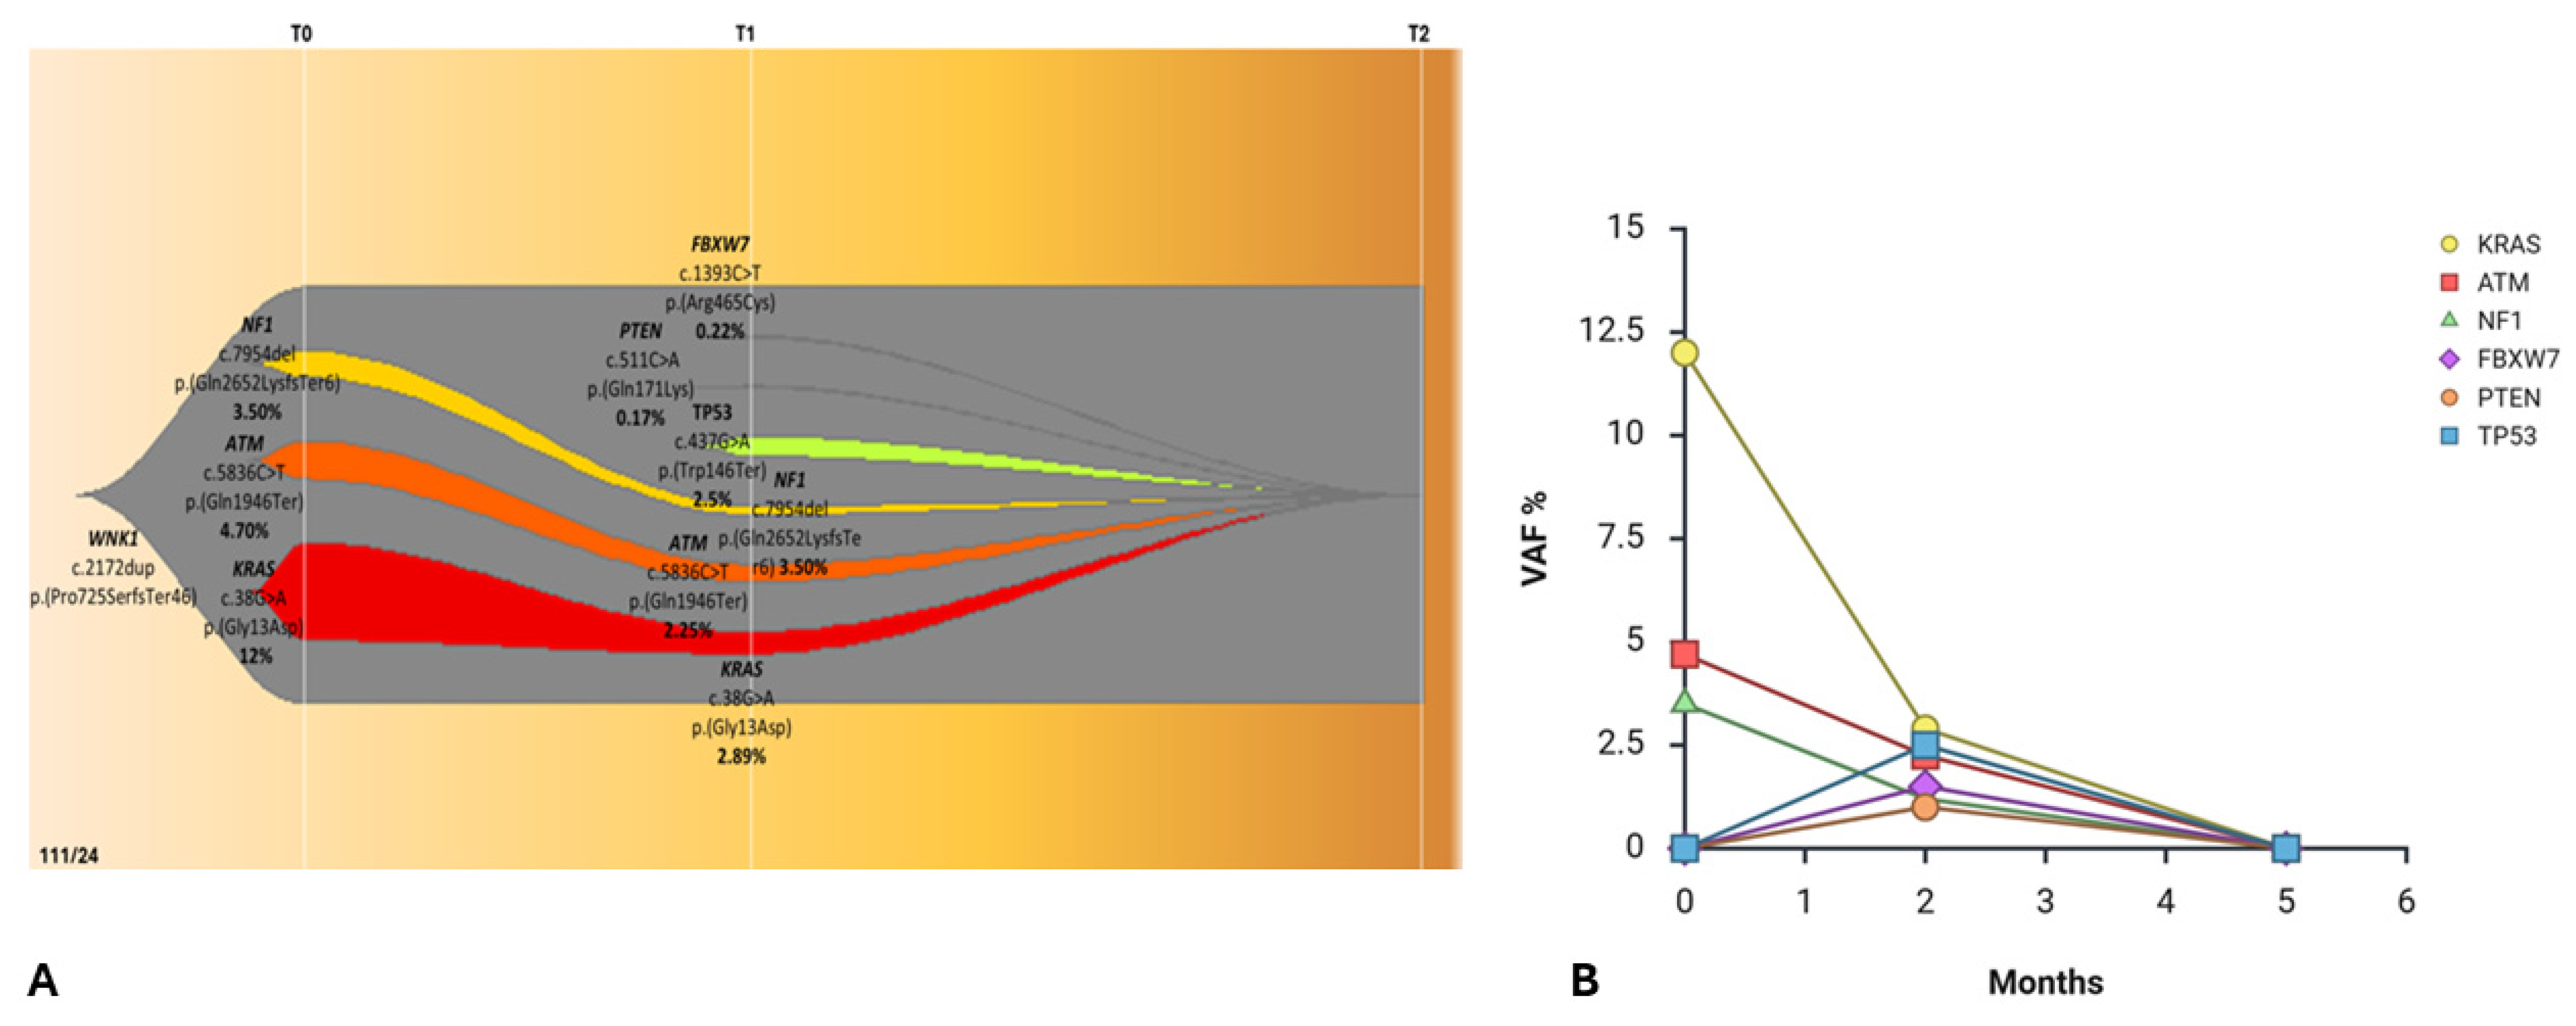
At baseline (T0), before treatment initiation, high-depth cfDNA whole-exome sequencing identified a heterozygous germline mutation in the WNK1 gene [WNK1, c.2172dup, p.(Pro725SerfsTer46)], on which three predominant expanding clones involving KRAS [c.38G>A, p.(Gly13Asp), VAF = 12%], ATM [c.5836C>T, p.(Gln1946Ter), VAF = 4.70%], and NF1 [c.7954del, p.(Gln2652LysfsTer6), VAF = 3.50%] were arising, consistent with the molecular landscape detected at diagnosis (Figure 4A). Notably, cfDNA analysis confirmed the KRAS mutation previously identified in the FFPE somatic DNA, with a VAF of 48%.
After two months of therapy (T1), cfDNA analysis demonstrated a substantial reduction in the VAFs (Figure 4B) of all previously identified driver mutations, indicating a marked molecular response to KRAS [c.38G>A, p.(Gly13Asp), VAF = 2.89%], ATM (c.5836C>T, p.(Gln1946Ter), VAF = 2.25%), and NF1 [c.7954del, p.(Gln2652LysfsTer6), VAF = 1.20%]. Concurrently, three novel low-frequency subclonal variants emerged [TP53 c.437G>A, p.(Trp146Ter), VAF = 2.5%; PTEN, c.511C>A, p.(Gln171Lys), VAF = 0.17%; FBXW7 c.1393C>T, p.(Arg465Cys), VAF = 0.22%] (Figure 4A), suggesting dynamic clonal remodeling under immunotherapeutic selective pressure.
At the third time point (T2), after five months of total treatment, cfDNA WES revealed complete molecular clearance of all previously detected clones, with no residual variants above the analytical threshold. This molecular complete remission was mirrored by radiological imaging, which documented progressive tumor shrinkage culminating in a disease-free status (Figure 3B).
Clonal dynamics across the three time points were visualized using an evolutionary fish plot (Figure 4A), clearly illustrating the contraction of dominant baseline clones (KRAS, ATM, NF1), the transient expansion of minor subclones (TP53, PTEN, FBXW7) at T1, and the eventual eradication of all detectable tumor-derived variants at T2. Imaging performed before T0 and after T1 and T2 was fully concordant with the molecular findings, further highlighting the capacity of longitudinal liquid biopsy to sensitively capture real-time tumor evolution and to anticipate clinical outcome, confirming durable responses to immunotherapy.
Notably, patient 111/24 was the only one in our cohort lacking TP53 mutations at baseline (T0). The subsequent emergence of a low-frequency TP53 variant at T1 [p.(Trp146Ter), VAF = 2.5%] was transient and successfully cleared by T2, coinciding with complete molecular clearance, contrasting with the persistent, high-VAF TP53 clones observed in the non-responding patients.

2.3. Third Case

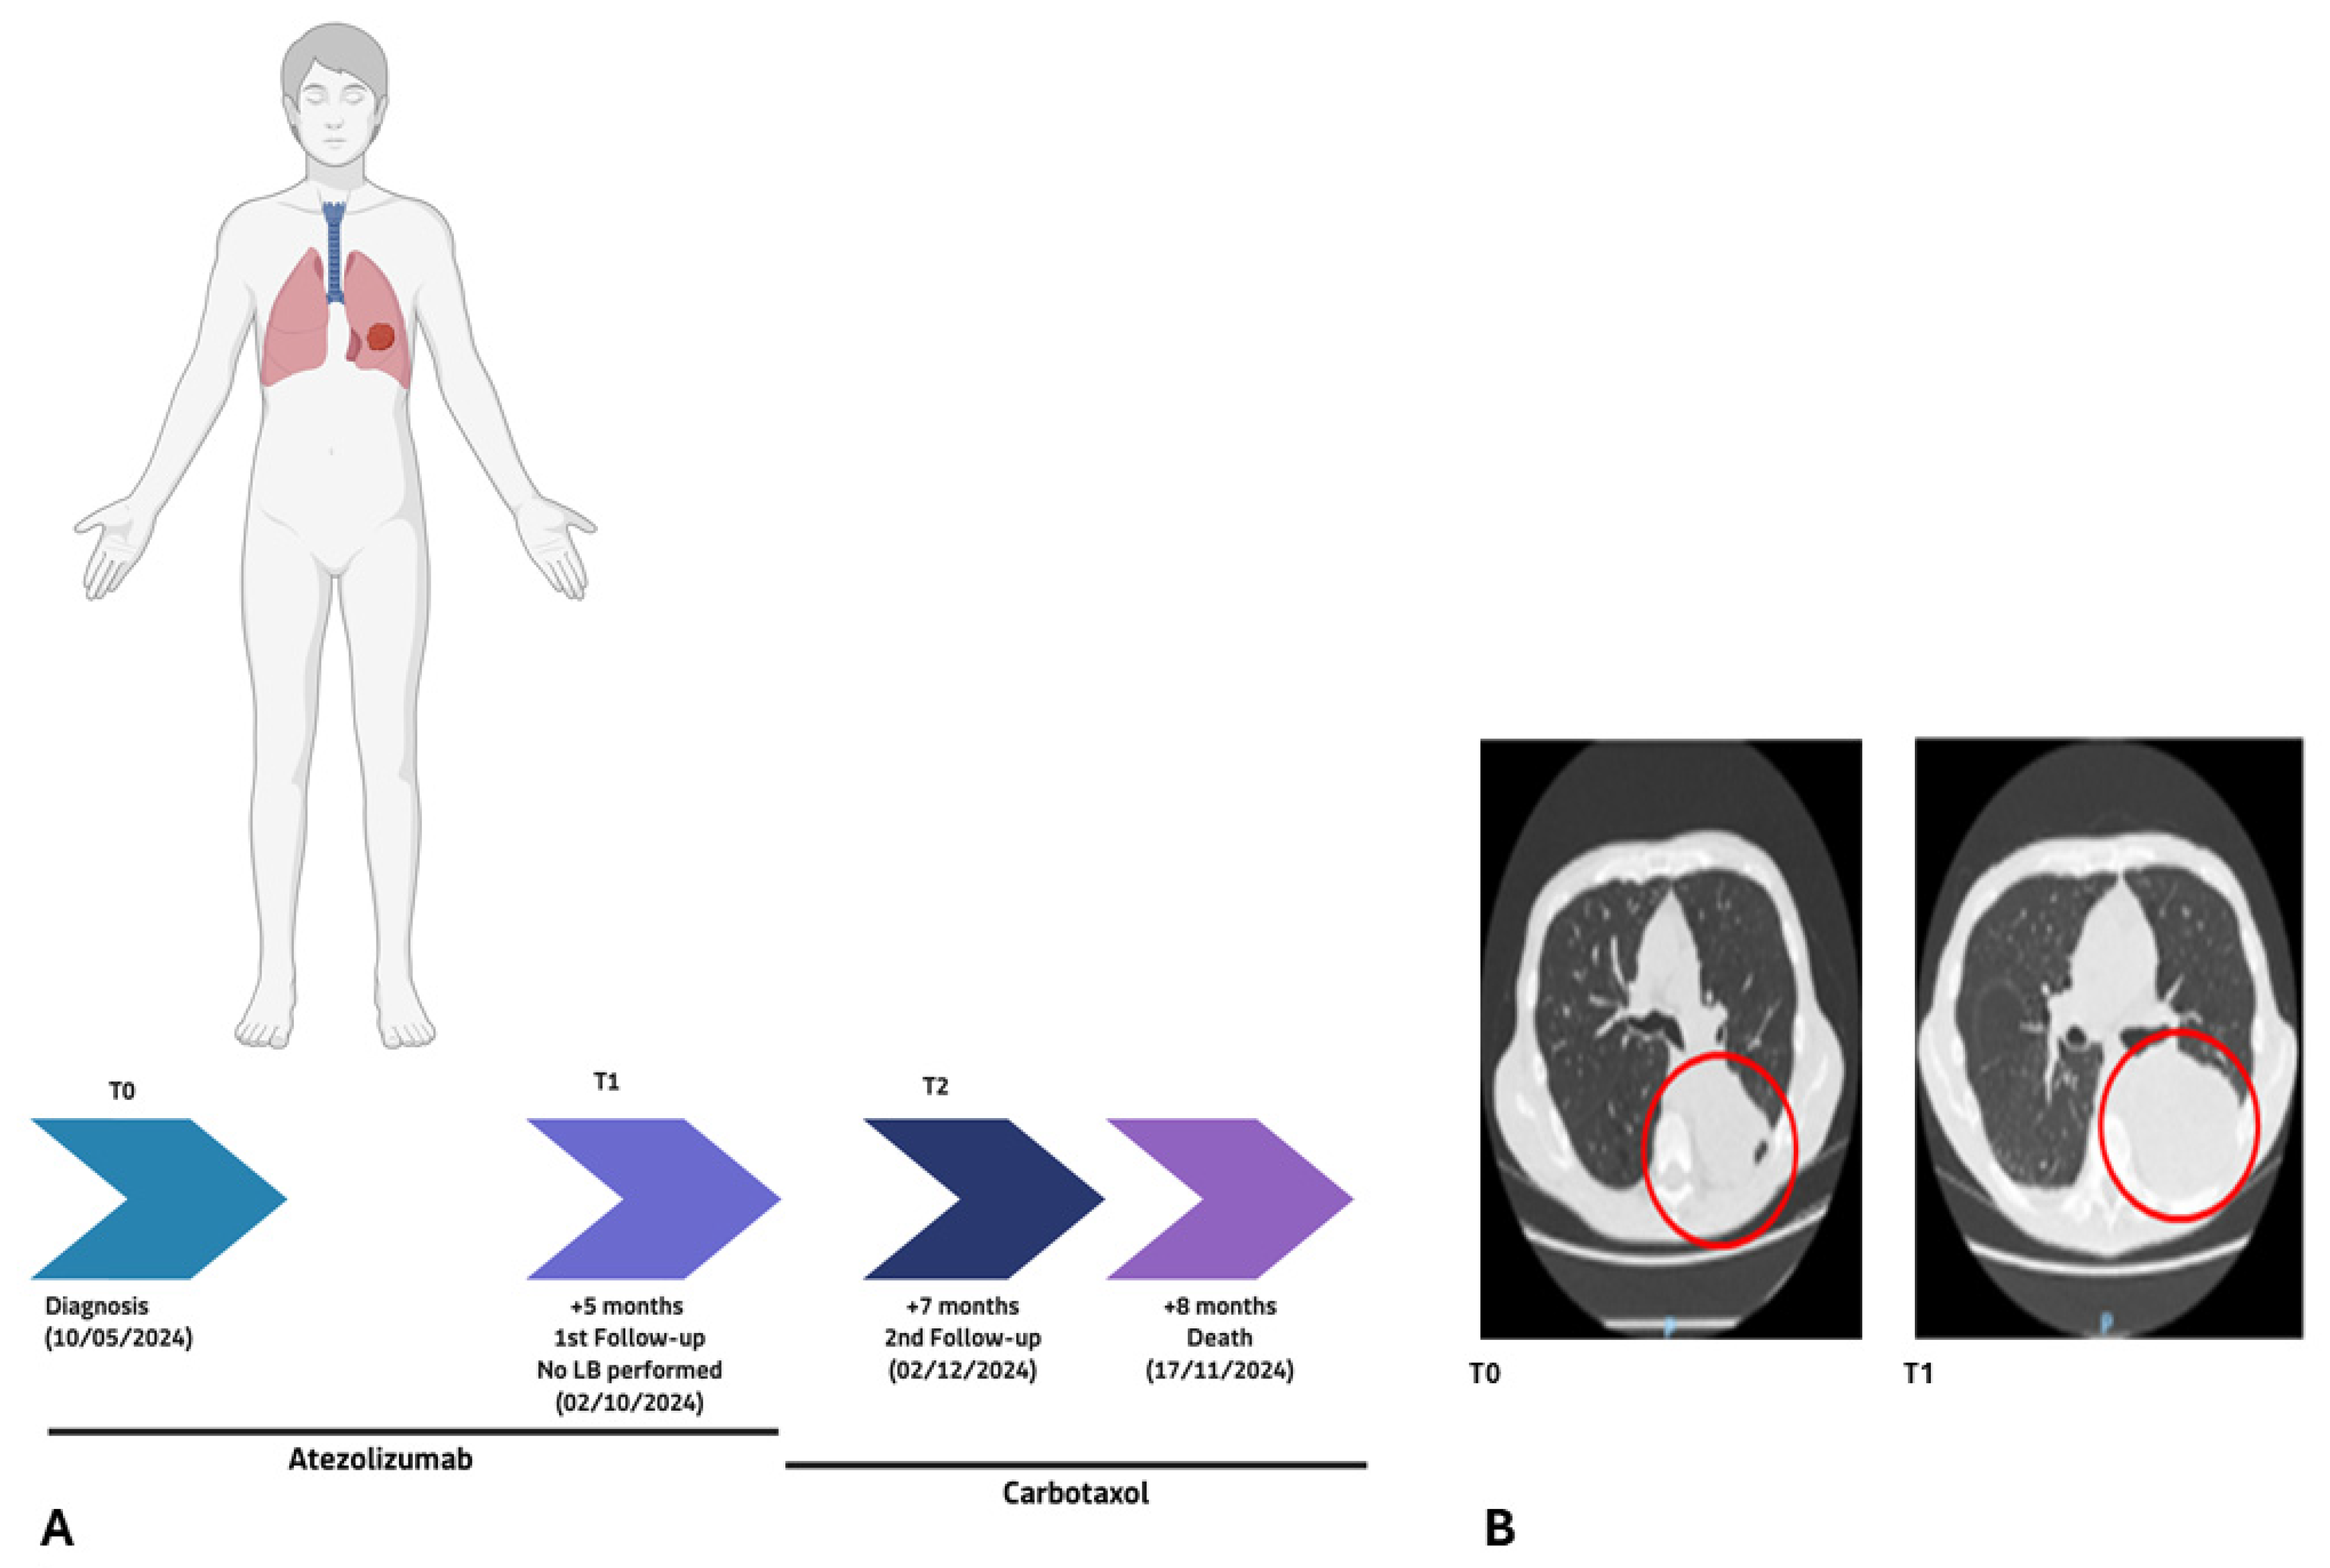
Patient 49/24 (male, 72 years old, PD-L1 90%) was initially treated with the immune checkpoint inhibitor atezolizumab (Figure 5A). Despite very high PD-L1 expression, which would normally predict a favorable response to immunotherapy, the patient showed no clinical or radiological benefit, as confirmed at the first follow-up (T1, Figure 5B).
Consequently, therapy was switched to carboplatin-paclitaxel (carbotaxol) chemotherapy, which achieved a molecular response (T2).
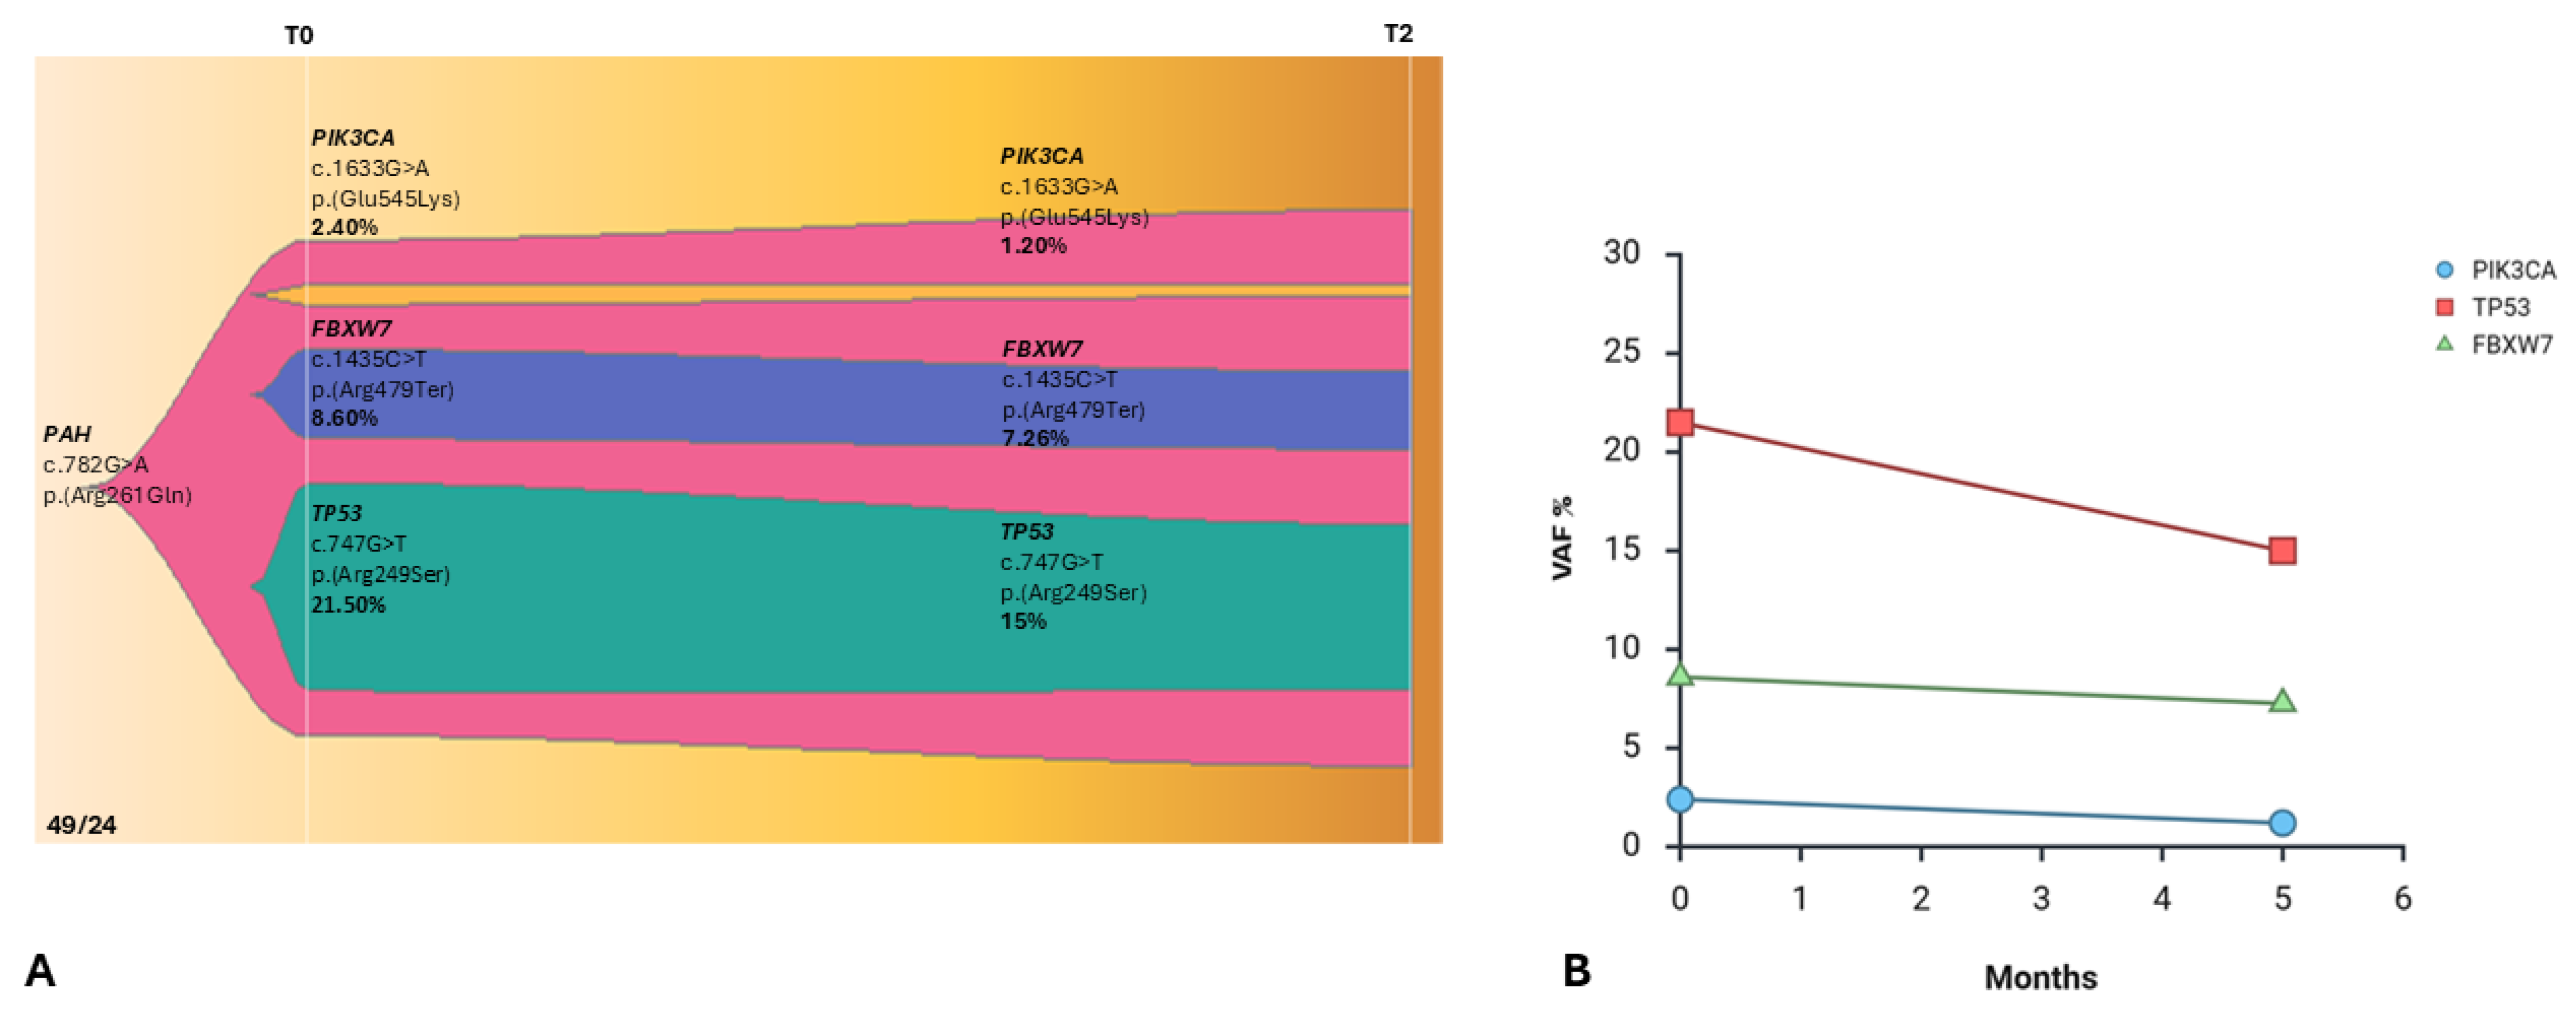
Genomic profiling through multi-point cfDNA WES revealed several variants that may help explain this unexpected lack of response to immunotherapy. Baseline cfDNA WES identified a high-VAF TP53 mutation [c.747G>T, p.(Arg249Ser), VAF = 21.50%], alongside pathogenic variants in PIK3CA [c.1633G>A, p.(Glu545Lys), VAF = 2.40%] and FBXW7 [c.1435C>T, p.(Arg479Ter), VAF = 8.60%]. At T2, following the therapeutic switch to carbotaxol chemotherapy, cfDNA analysis revealed an effective response in the previously identified clones, whose VAFs decreased to 15%, 1.20%, and 7.26%, respectively (Figure 6A,B). A germline mutation in the PAH gene, c.782G>A, p.(Arg261Gln), has been identified.
Longitudinal monitoring of cfDNA (Figure 6A) confirmed a decline in clonal burden of these variants after the switch to chemotherapy, highlighting the therapeutic efficacy of carbotaxol in this setting.

2.4. Fourth Case

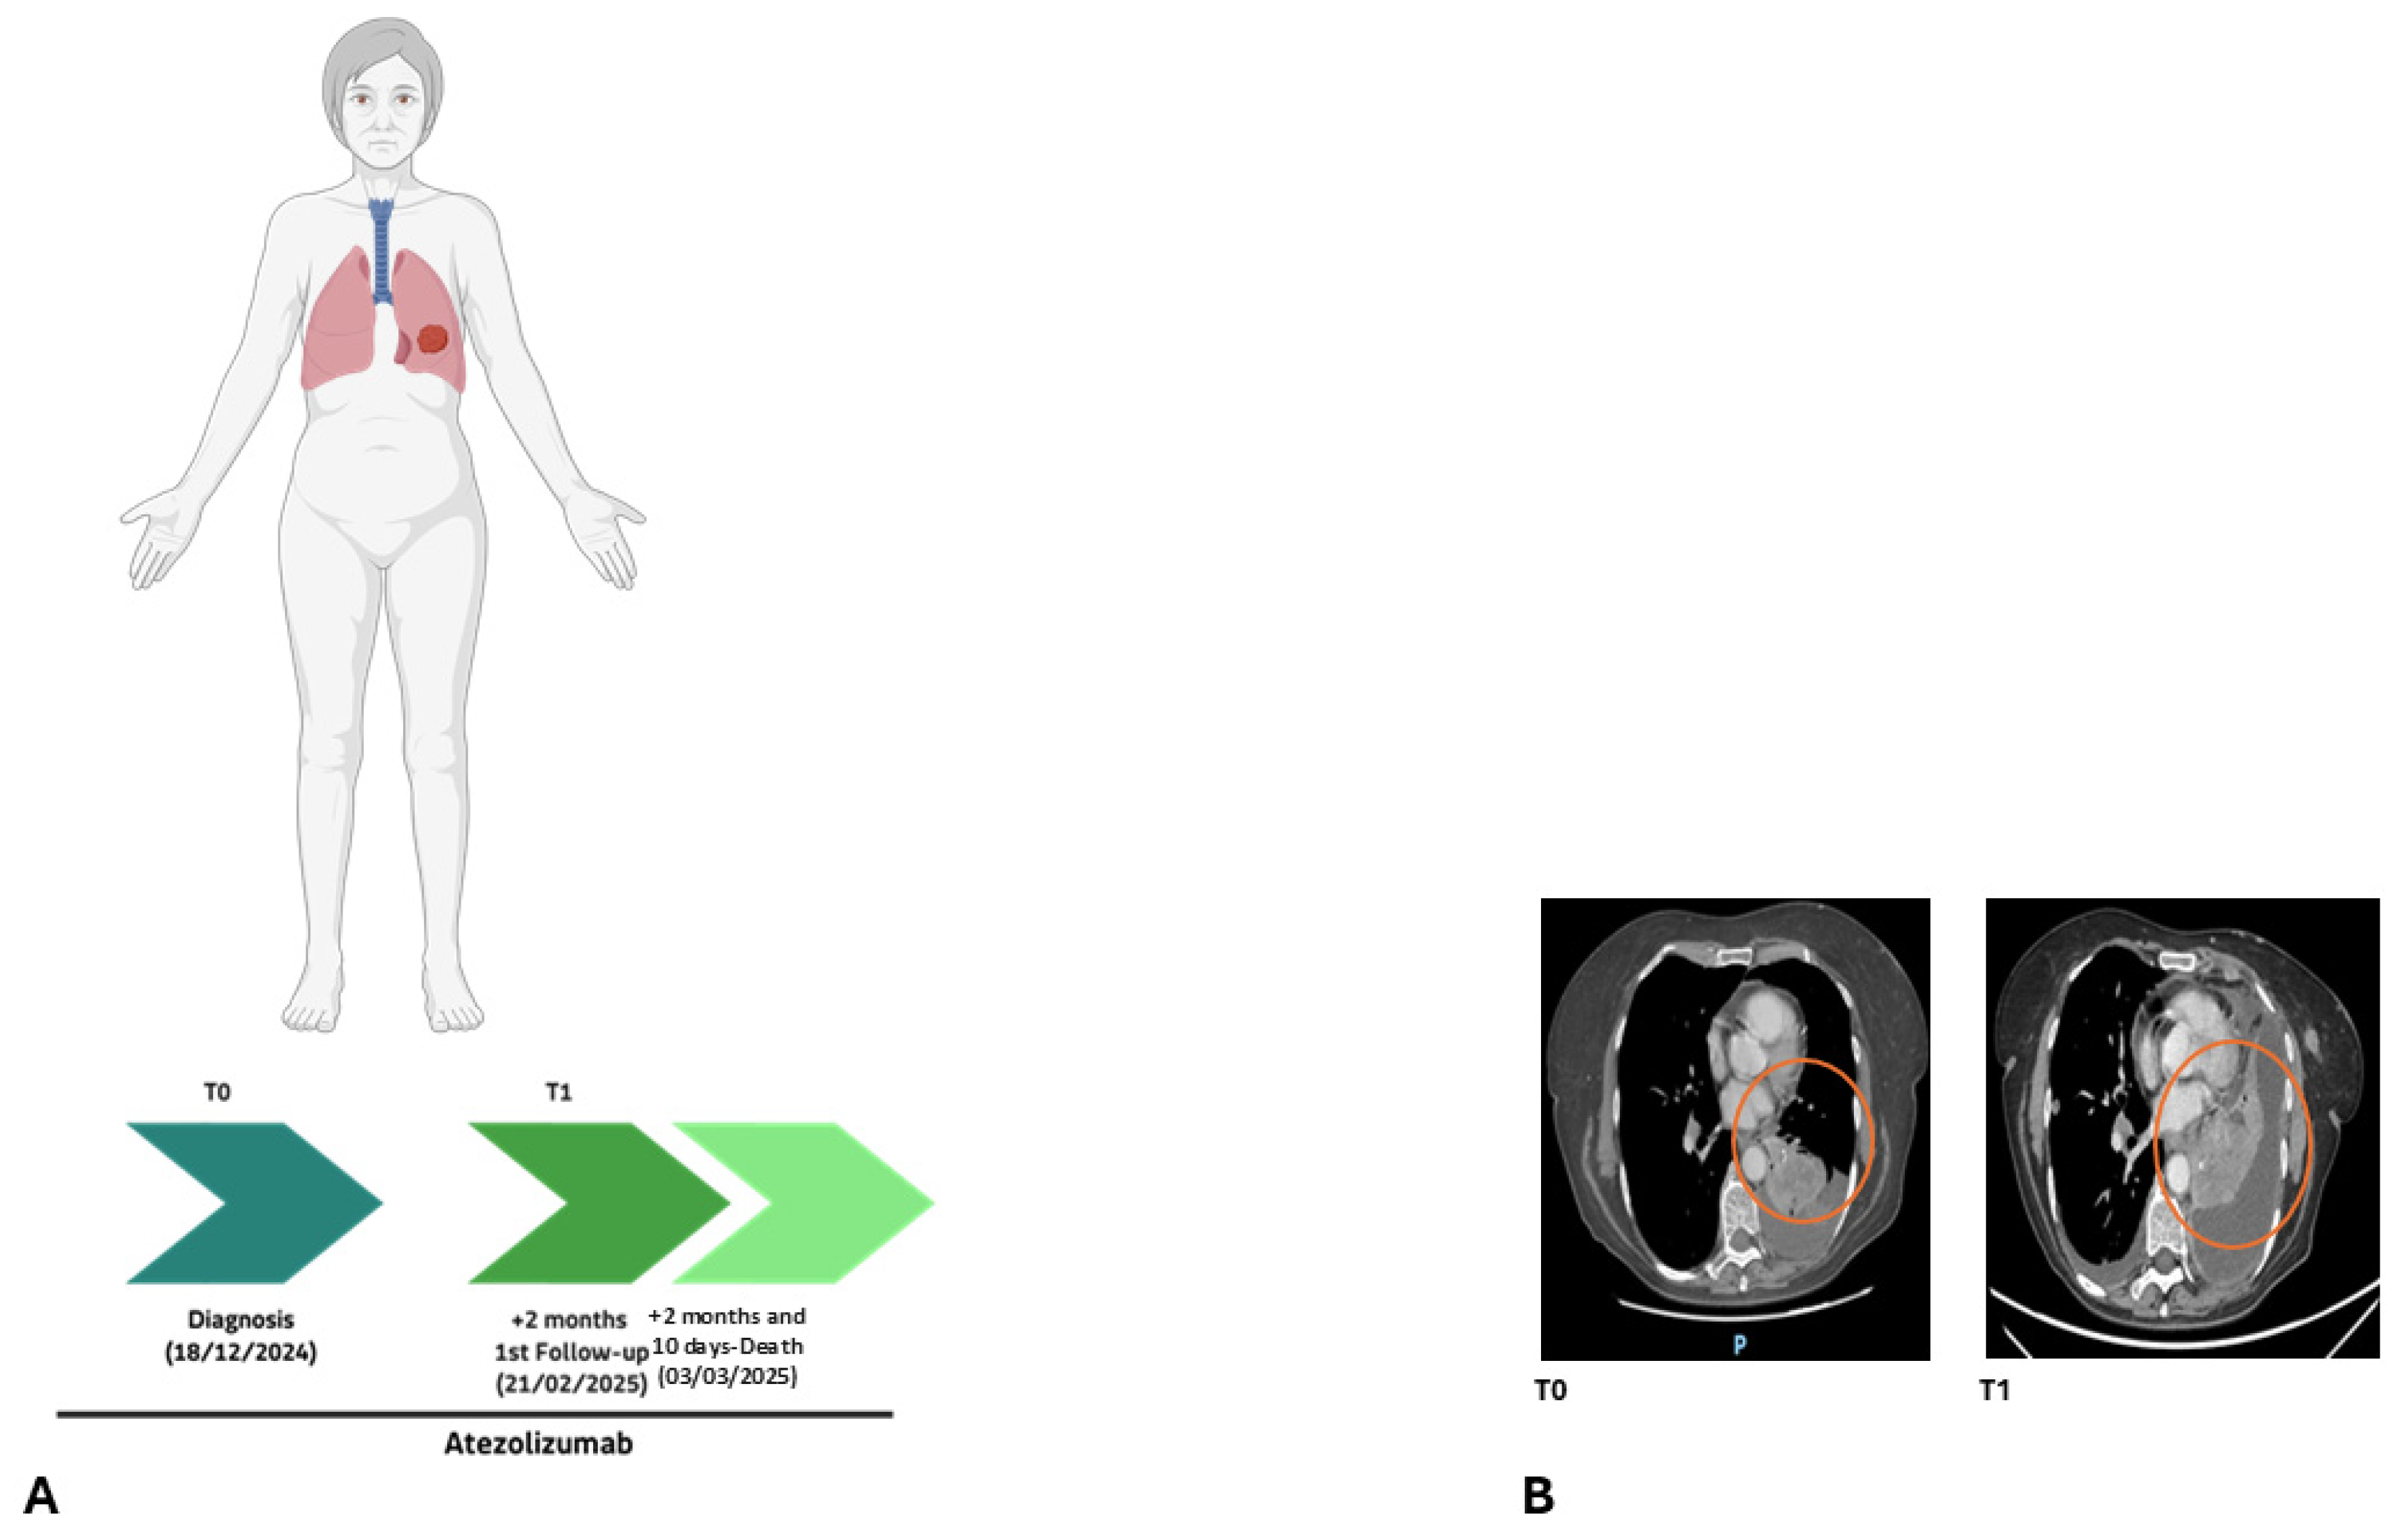
Comprehensive tumor molecular analysis was performed at baseline (T0) and after 2 months of treatment (T1) in patient 151/24, a 61-year-old female who was a PD-L1 high (90%) metastatic NSCLC non-responder to atezolizumab (Figure 7).
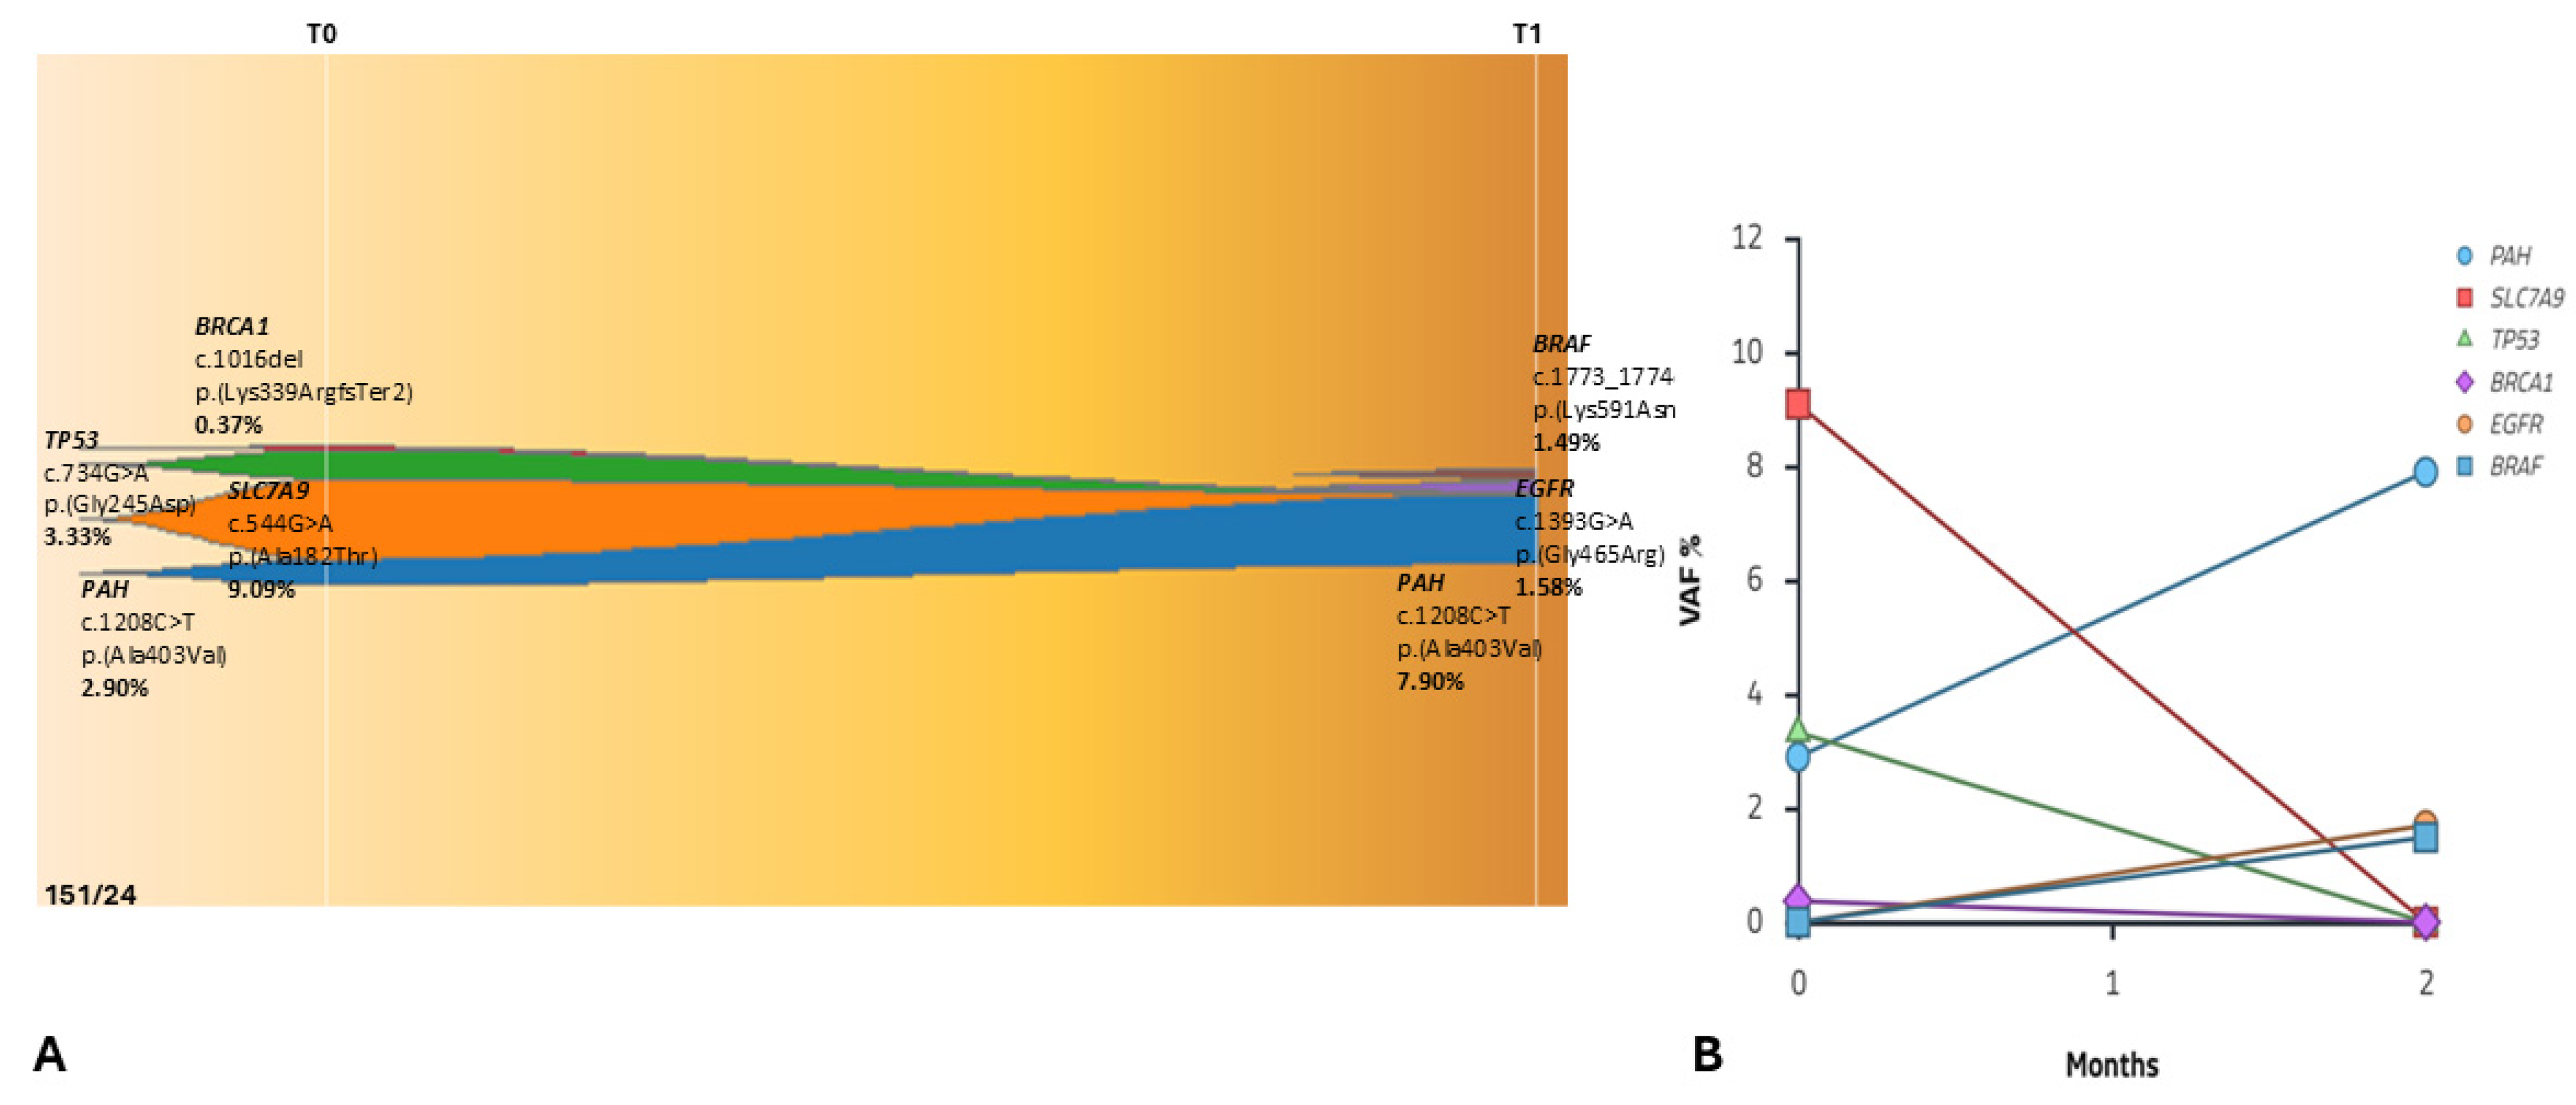
At baseline (T0), the molecular landscape was characterized by clonal variants, including alterations in PAH [c.1208C>T, p.(Ala403Val), 2.90%], SLC7A9 [c.544G>A, p.(Ala182Thr), 9.09%], TP53 [c.734G>A, (p.Gly245Asp), 3.33%], and BRCA1 [c.1016del, p.(Lys339ArgfsTer2), 0.37%] (Figure 8A).
At T1 (2 months later), despite immunotherapy exposure, the PAH variant also increased (7.90%). Notably, the genomic profile not only showed clonal persistence but also revealed early subclonal diversification. This was characterized by the emergence of novel alterations in EGFR (c.1393G>A, p.Gly465Arg; VAF = 1.58%) and BRAF (c.1773_1774del, p.Lys591AsnfsTer3; VAF = 1.49%), potentially reflecting early molecular evolution (Figure 8A,B).
Overall, the molecular profile demonstrates clonal persistence and expansion of pre-existing alterations rather than immune-mediated tumor clearance, with evidence of molecular progression. In this case, the liquid biopsy at T1 revealed an early molecular rebound of resistance clones. This molecular signal preceded the radiological documentation of progression (confirmed at T2, one month later, Figure 7B), illustrating a molecular lead time where the expansion of resistant clones was detectable in the cfDNA before becoming clinically evident on imaging.

3. Discussion

The longitudinal monitoring of cfDNA via high-depth WES in this case series provides critical insights into the evolutionary trajectories of metastatic lung adenocarcinoma under the selective pressure of immune checkpoint inhibitors (ICIs). Our findings underscore the clinical utility of liquid biopsy not only as a surrogate for tumor burden and evolution, but also as a highly sensitive tool for anticipating therapeutic resistance and molecular escape.
A central observation in our study is the correlation between VAF kinetics and clinical outcome. In Patient 111/24, the “molecular complete response”, characterized by the total clearance of KRAS, ATM, and NF1 clones, accurately mirrored the radiological achievement of a disease-free status. Notably, this early molecular clearance (detectable at T1-T2) suggests a potential indicator for sustained clinical benefit from atezolizumab. This patient harbored mutations in KRAS (p.Gly13Asp) and ATM (p.Gln1946Ter). Notably, the identified KRAS G13D mutation was successfully cleared during treatment, a finding of interest given that different KRAS substitutions can exhibit distinct biological behaviors and responses to immunotherapy compared to the more frequent G12C variant. In Patient 111/24, we observed a molecular complete response in the cfDNA compartment, characterized by the total clearance of previously detectable plasma variants (from 48% in tissue to 0% in cfDNA at T2). The ATM is involved in DNA damage repair (DDR) [16], likely increasing the Tumor Mutational Burden (TMB) and paradoxically priming the tumor for extreme sensitivity to checkpoint inhibitors like atezolizumab [17].
Conversely, Patient 66/24 illustrates the phenomenon of “molecular progression” preceding clinical decline. The rapid rebound of TP53, NF1, and NOTCH2 VAFs at T2, coupled with the appearance of novel subclonal variants in KIF1A and PTEN, indicates the onset of acquired resistance. In this case, the molecular rebound provided a critical lead time, identifying the therapeutic failure synchronously with the development of cerebral metastases. This reinforces the ability of cfDNA to bypass the blood–brain barrier and capture the spatial and temporal heterogeneity of metastatic disease that single-tissue biopsies often miss.
The emergence of PTEN variants at T1/T2 in patients who initially responded (66/24 and 111/24) represents a classic example of acquired resistance. PTEN loss increases the expression of immunosuppressive cytokines, allowing the tumor to evade immune surveillance [18,19,20].
Again, inactivating variants in the NF1 (Neurofibromin 1) gene, detected in both patients 66/24 (progression) and 111/24 (response), could act as a negative regulator of the RAS pathway. In Patient 66/24, the NF1 VAF rebound at T2 (25.51%) was an early indicator of therapeutic failure and MAPK pathway reactivation [21,22]. This patient was also mutated in the NOTCH2 gene (p.Gly1263Ter). NOTCH2 mutations can alter cellular differentiation and stemness [23]. The clonal dynamics of NOTCH2 perfectly mirrored the total tumor burden, confirming its utility as a monitoring marker.
However, there is a PD-L1 paradox. Our data highlight a significant clinical challenge: the poor correlation between high PD-L1 expression and durable ICI response in some patients. Despite PD-L1 levels ≥60%, patients 49/24 and 151/24 exhibited primary resistance to atezolizumab.
In patient 49/24, the presence of a PIK3CA (p.Glu545Lys) mutation and FBXW7 alterations may explain this lack of response. The role of the PI3K/AKT/mTOR pathway in fostering an immunosuppressive tumor microenvironment has been extensively documented [24,25]. Mutations in the PI3K/AKT/mTOR pathway are known to modulate the tumor microenvironment and are often associated with an “immune-cold” phenotype, potentially negating the benefits of high PD-L1 expression [26,27,28,29,30]. Indeed, the PIK3CA (p.Glu545Lys) is a gain-of-function mutation that modulates the tumor microenvironment by reducing T-lymphocyte infiltration and explaining the lack of response despite 90% PD-L1 expression [28]. Specifically, the activation of this pathway leads to the upregulation of immunosuppressive cytokines and the exclusion of CD8+ T-cells, providing a mechanistic explanation for the primary resistance observed in Patient 49/24. Interestingly, the switch to carboplatin-paclitaxel induced a significant molecular response, demonstrating the utility of cfDNA in monitoring chemotherapy efficacy and suggesting that in the presence of specific co-mutations, traditional chemotherapy may remain superior to immunotherapy.
The emergence of new mutations during treatment, such as EGFR and BRAF variants in patient 151/24, reflects the rapid adaptive evolution of the tumor genome.
In patient 151/24, the persistence of PAH and SLC7A9 clones despite ICI therapy suggests a biologically resistant backbone. The detection of subclonal EGFR and BRAF alterations at T1, although at low VAFs, points toward rapid adaptive evolution as a mechanism of immune evasion. The presence of mutations in PAH and BRCA1 in non-responding patients suggests a tumor microenvironment (TME) that is both metabolically and genetically hostile to T-cell activity [31,32]. While PAH is associated with hepatic metabolism, its alteration in lung cancer may indicate a significant metabolic reprogramming. In fact, PAH is responsible for the rate-limiting step in phenylalanine catabolism, and its dysfunction may lead to an accumulation of phenylalanine in the TME. The accumulation of phenylalanine or the dysregulation of its derivatives (such as tyrosine) can influence the synthesis of catecholamines and signaling molecules that modulate systemic and local inflammation [31,33,34]. In our data, the increase in PAH VAF during therapy, rising from 2.90% to 7.90%, suggests that this clone is not only resistant to atezolizumab but also possesses a selective advantage, serving as a marker of primary metabolic resistance. This ‘metabolic escape’ could create a hostile environment for immune cells, potentially explaining why these patients failed to respond despite high PD-L1 expression. Regarding the BRCA1 mutation, theoretically, BRCA1 defects should increase Tumor Mutational Burden (TMB) and, consequently, improve response to ICIs [35]. However, in Patient 151/24, the BRCA1 mutation was subclonal and persisted despite treatment, suggesting that when such mutations are subclonal or not accompanied by loss of heterozygosity (LOH), they may contribute to “chronic genomic instability” rather than an immune-priming phenotype [36,37]. Furthermore, the BRCA1 low VAF (0.37%) and the co-occurrence with TP53 could nullify any potential immunogenic benefit. This state continuously generates novel variants, as evidenced by the emergence of EGFR and BRAF at T1, without producing sufficiently potent neoantigens to trigger an effective immune response. This results in an intratumoral heterogeneity that ultimately stifles the efficacy of immunotherapy.
The identification of germline variants (WNK1 in patient 111/24 and PAH in patient 49/24) through WES adds another layer of complexity. While the specific role of these variants in lung cancer progression remains to be fully elucidated, the expansion of somatic “driver” clones (like KRAS) within a specific germline background may influence the overall fitness of the tumor and its interaction with the host immune system. However, due to their noncanonical role in NSCLC, their presence is reported for completeness of data due to incidental finding.
What we noticed in patients 49/24, 66/24 and 111/24 are the mutations in TP53 (p.Val203Phe, p.Arg249Ser, p.Gly245Asp). Indeed, while TP53 mutations are ubiquitous in NSCLC, their impact depends on their co-occurrence with other drivers. In non-responders, the persistence of high-VAF TP53 clones served as a marker of genomic instability and poor prognosis. Furthermore, the expansion of somatic drivers on specific germline backgrounds (WNK1 in patient 111/24, PAH in 49/24) adds a layer of complexity to tumor fitness and host immune interaction that warrants further investigation. The relationship between TP53 status and immunotherapy efficacy remains complex. Patient 111/24, the only complete responder, was also the only patient lacking TP53 mutations at diagnosis (T0). This contrasts with the non-responding cases, where the TP53 mutations are present at baseline, contributing to a primary resistance to immunotherapy. This aligns with emerging evidence suggesting that baseline TP53 mutations may act as a marker of higher genomic complexity and subclonal fitness, potentially hindering the efficacy of ICI monotherapy despite high PD-L1 expression. In our non-responders, the ‘TP53-mutant scaffold’ likely facilitated the rapid emergence of secondary escape mechanisms, such as PTEN or PIK3CA alterations. So, the baseline profile of cfDNA could be useful to identify patients suitable to benefit from monotherapy.
Finally, in patients 49/24 and 111/24, the FBXW7 gene is a critical tumor suppressor that targets oncoproteins for degradation. According to systematic evidence, FBXW7 deficiency stabilizes oncoproteins such as MYC and Cyclin E, which in turn orchestrate an ‘immune-cold’ environment characterized by impaired antigen presentation and reduced recruitment of tumor-infiltrating lymphocytes [25]. Loss-of-function mutations (such as p.Arg479Ter) promote cell cycle progression and are frequently associated with an “immune-cold” phenotype and poor ICI efficacy [38,39,40,41]. Our finding of FBXW7 mutations in non-responding patients aligns with these comprehensive reviews, suggesting that FBXW7 status could serve as a potential negative predictor for ICI monotherapy.
Despite the high-depth molecular resolution provided by our longitudinal WES approach, several limitations of this study must be acknowledged. First, the small cohort size (n = 4) precludes formal statistical validation and limits the generalizability of our findings regarding specific ‘molecular signatures’ of resistance, which remain hypothesis-generating. Furthermore, the absence of paired sequencing of peripheral blood mononuclear cells (PBMCs) represents a technical constraint, as we cannot definitively exclude the influence of Clonal Hematopoiesis of Indeterminate Potential (CHIP). In order to address this, we focused on variants with high VAF or those previously documented as somatic drivers in the patient’s tissue biopsy.
The study nevertheless demonstrated that the use of high-depth WES analysis compensates for these limitations by providing a high-resolution, unbiased view of clonal dynamics that targeted NGS panels might overlook. By capturing low-frequency subclonal shifts and metabolic markers like PAH, our approach demonstrates that even a small case series can reveal complex mechanisms of immune evasion and metabolic reprogramming that are otherwise invisible to routine clinical diagnostics.
Our observation that cfDNA kinetics reflect radiological response is consistent with larger-scale analyses, such as those by Gandara et al. and results from the POPLAR and OAK trials, which established that early changes in circulating tumor DNA correlate with overall survival and treatment efficacy in NSCLC patients treated with ICIs [42]. By utilizing WES instead of targeted panels, our case series extends these observations, suggesting that even subclonal shifts can provide early warnings of treatment failure.

4. Conclusions

This study illustrates how longitudinal, high-depth cfDNA WES can provide detailed insights into the evolutionary landscape of metastatic NSCLC compared to baseline tissue biopsy or PD-L1 immunohistochemistry alone. While the initial tissue biopsy was limited by a targeted gene panel, the use of WES on plasma samples allowed us to track a broader spectrum of clonal and subclonal shifts over time. This longitudinal approach offers a higher temporal resolution of the mutational landscape compared to a static, single-point tissue assessment, providing insights into the molecular shifts occurring under therapeutic pressure. Our findings provide preliminary evidence that supports the following observations:
While PD-L1 expression remains the standard biomarker for ICI eligibility, it failed to predict clinical benefit in 50% of our cohort. In contrast, early cfDNA detection, specifically the disappearance of previously identified plasma driver clones at T1, served as an indicator of therapeutic success in our responder. Conversely, VAF rebound or persistence consistently preceded radiological progression, offering a critical window for clinical intervention.
We identified TP53 mutations not merely as static markers of malignancy but as evolutionary transition variants. The persistence of high-VAF TP53 clones provides a permissive genomic scaffold that facilitates “molecular escape,” allowing the tumor to rapidly acquire secondary resistance mutations (e.g., PTEN, PIK3CA) under the selective pressure of immunotherapy.
The failure of ICI in patients with high PD-L1 was associated with a genomic dynamism driven by subclonal BRCA1 mutations and PAH-mediated metabolic reprogramming. These alterations create a tumor microenvironment that is both genetically heterogeneous and metabolically hostile to T-lymphocyte activity, effectively bypassing PD-L1 blockade.
In our cohort, the rapid molecular response observed after switching to platinum-based chemotherapy in patients with PIK3CA or FBXW7 co-mutations illustrates how longitudinal cfDNA monitoring may identify clones associated with a resistant phenotype early in the treatment course. While these findings are limited to individual cases, they align with broader evidence suggesting that activation of the PI3K pathway and loss of FBXW7 are recurrent features of immune evasion in NSCLC [24,41]. Our data supports the potential utility of cfDNA to monitor these high-risk molecular profiles early in the clinical course. This molecular compass could enable clinicians to pivot to chemotherapy or targeted agents months before radiological failure is documented.
In summary, integrating multi-point liquid biopsy into the clinical workflow offers a real-time map of the tumor’s life cycle. This approach allows for the identification of patients trapped in a biologically resistant phenotype, paving the way for more personalized and dynamic therapeutic strategies that move beyond the limitations of static biomarkers in metastatic lung adenocarcinoma.

Supplementary Materials

The following supporting information can be downloaded at: https://www.mdpi.com/article/10.3390/ijms27072947/s1.

Author Contributions

Conceptualization, M.P. and E.F.; methodology, V.B.S. and D.M.; software, T.R., V.B.S., M.P., D.R., A.B., N.V. and G.S.; formal analysis, V.B.S. and M.P.; investigation, V.B.S., M.P. and E.F., Resources, E.F.; patient’s data curation, I.M. and M.G.; writing—original draft preparation, V.B.S., M.P. and E.F.; Writing—review and editing, G.S., I.M., M.G., F.C. and F.M.; visualization, V.B.S.; supervision, M.P. and E.F.; All authors have read and agreed to the published version of the manuscript.

Funding

This research was funded by the EU within the “NextGenerationEU of Piano Nazionale di Ripresa e Resilienza (PNRR)—Missione 4 “Istruzione e Ricerca”—Componente 2—M4C2a Investimento 1.1, “Fondo per il Programma Nazionale di Ricerca e Progetti di Rilevante Interesse Nazionale (PRIN)”—PRIN 2022 PNRR—Project P2022NLEBP—CUP B53D23025110001 (E.F.) and CUP F53D2300093001 (G.S.); the funders had no role in the design or conduct of the study, in the collection, analysis or interpretation of the data, or in the preparation, review or approval of the manuscript.

Institutional Review Board Statement

The study was conducted in accordance with the Declaration of Helsinki, and approved by the Ethics Committee of Comitato Etico Regionale per la Sperimentazione Clinica della Regione Toscana, Sezione: AREA VASTA SUD EST (protocol code: BL-CMeMT, 20 July 2023) for studies involving biological samples from humans.

Informed Consent Statement

Written informed consent has been obtained from the patients to publish this paper.

Data Availability Statement

The raw data supporting the conclusions of this article will be made available by the authors on request.

Acknowledgments

The authors would like to sincerely thank all the nursing staff of the Medical Oncology Unit at the Azienda Ospedaliero-Universitaria Senese for their invaluable clinical support, dedication, and continuous assistance in patient management and sample collection. In particular, we would like to acknowledge Elena Galli, Paola Valerio, Francesca Bandini, Moncalieri Ndoja, Chiara Delle Fontane, Costanza Fabiani, and Immacolata Langela for their professionalism, compassionate care, and commitment, which were essential to the successful conduct of this study.

Conflicts of Interest

The authors declare no potential conflicts of interest.

Abbreviations

The following abbreviations are used in this manuscript:
ICIImmune Checkpoint Inhibitor
PD-L1Programmed Death-Ligand 1
NSCLCNon-Small Cell Lung Cancer
cfDNACell-free DNA
WESWhole-Exome Sequencing
LCLung Cancer
AOUSAzienda Ospedaliero-Universitaria Senese
FFPEFormalin-Fixed Paraffin-Embedded
ICI softwareIllumina Connected Insights software
MAFMinor Allele Frequency
VAFVariant Allele Frequency
DDRDNA Damage Repair
TMBTumor Mutational Burden

References

  1. Sung, H.; Ferlay, J.; Siegel, R.L.; Laversanne, M.; Soerjomataram, I.; Jemal, A.; Bray, F. Global Cancer Statistics 2020: GLOBOCAN Estimates of Incidence and Mortality Worldwide for 36 Cancers in 185 Countries. CA Cancer J. Clin. 2021, 71, 209–249. [Google Scholar] [CrossRef]
  2. Siegel, R.L.; Miller, K.D.; Jemal, A. Cancer statistics, 2020. CA Cancer J. Clin. 2020, 70, 7–30. [Google Scholar] [CrossRef]
  3. Wen, J.; Fu, J.H.; Zhang, W.; Guo, M. Lung carcinoma signaling pathways activated by smoking. Chin. J. Cancer 2011, 30, 551–558. [Google Scholar] [CrossRef]
  4. Semenova, E.A.; Nagel, R.; Berns, A. Origins, genetic landscape, and emerging therapies of small cell lung cancer. Genes Dev. 2015, 29, 1447–1462. [Google Scholar] [CrossRef]
  5. Calvayrac, O.; Pradines, A.; Pons, E.; Mazières, J.; Guibert, N. Molecular biomarkers for lung adenocarcinoma. Eur. Respir. J. 2017, 49, 1601734. [Google Scholar] [CrossRef]
  6. Shackelford, R.E.; Vora, M.; Mayhall, K.; Cotelingam, J. ALK-rearrangements and testing methods in non-small cell lung cancer: A review. Genes Cancer 2014, 5, 1–14. [Google Scholar] [CrossRef] [PubMed]
  7. Yan, N.; Guo, S.; Zhang, H.; Zhang, Z.; Shen, S.; Li, X. BRAF-Mutated Non-Small Cell Lung Cancer: Current Treatment Status and Future Perspective. Front. Oncol. 2022, 12, 863043. [Google Scholar] [CrossRef] [PubMed]
  8. Morris, T.A.; Khoo, C.; Solomon, B.J. Targeting ROS1 Rearrangements in Non-small Cell Lung Cancer: Crizotinib and Newer Generation Tyrosine Kinase Inhibitors. Drugs 2019, 79, 1277–1286. [Google Scholar] [CrossRef]
  9. Li, N.; Hou, X.; Huang, S.; Tai, R.; Lei, L.; Li, S.; Abuliz, A.; Wang, G.; Yang, S. Biomarkers related to immune checkpoint inhibitors therapy. Biomed. Pharmacother. 2022, 147, 112470. [Google Scholar] [CrossRef] [PubMed]
  10. Isla, D.; Lozano, M.D.; Paz-Ares, L.; Salas, C.; de Castro, J.; Conde, E.; Felip, E.; Gómez-Román, J.; Garrido, P.; Enguita, A.B. New update to the guidelines on testing predictive biomarkers in non-small-cell lung cancer: A National Consensus of the Spanish Society of Pathology and the Spanish Society of Medical Oncology. Clin. Transl. Oncol. 2023, 25, 1252–1267, Erratum in Clin. Transl. Oncol. 2023, 25, 1488. [Google Scholar] [CrossRef] [PubMed]
  11. Lim, M.; Kim, C.J.; Sunkara, V.; Kim, M.-H.; Cho, Y.-K. Liquid Biopsy in Lung Cancer: Clinical Applications of Circulating Biomarkers (CTCs and ctDNA). Micromachines 2018, 9, 100. [Google Scholar] [CrossRef]
  12. Luo, W.; Rao, M.; Qu, J.; Luo, D. Applications of liquid biopsy in lung cancer diagnosis, prognosis prediction, and disease monitoring. Am. J. Transl. Res. 2018, 10, 3911–3923. [Google Scholar]
  13. Miyanaga, A.; Masuda, M.; Yamada, T. Biomarkers of Lung Cancer: Liquid Biopsy Comes of Age. In Biomarkers in Cancer Therapy: Liquid Biopsy Comes of Age; Springer: Berlin/Heidelberg, Germany, 2019; pp. 105–113. [Google Scholar]
  14. Diaz, L.A., Jr.; Bardelli, A. Liquid biopsies: Genotyping circulating tumor DNA. J. Clin. Oncol. 2014, 32, 579–586. [Google Scholar] [CrossRef]
  15. Serio, V.B.; Rosati, D.; Maffeo, D.; Rina, A.; Ghisalberti, M.; Bellan, C.; Spiga, O.; Mari, F.; Palmieri, M.; Frullanti, E. The Personalized Inherited Signature Predisposing to Non-Small-Cell Lung Cancer in Non-Smokers. Cancers 2024, 16, 2887. [Google Scholar] [CrossRef]
  16. Phan, L.M.; Rezaeian, A.H. ATM: Main Features, Signaling Pathways, and Its Diverse Roles in DNA Damage Response, Tumor Suppression, and Cancer Development. Genes 2021, 12, 845. [Google Scholar] [CrossRef]
  17. Friedman, C.F.; Hainsworth, J.D.; Kurzrock, R.; Spigel, D.R.; Burris, H.A.; Sweeney, C.J.; Meric-Bernstam, F.; Wang, Y.; Levy, J.; Grindheim, J.; et al. Atezolizumab Treatment of Tumors with High Tumor Mutational Burden from MyPathway, a Multicenter, Open-Label, Phase IIa Multiple Basket Study. Cancer Discov. 2022, 12, 654–669. [Google Scholar] [CrossRef]
  18. Peng, W.; Chen, J.Q.; Liu, C.; Malu, S.; Creasy, C.; Tetzlaff, M.T.; Xu, C.; McKenzie, J.A.; Zhang, C.; Liang, X.; et al. Loss of PTEN Promotes Resistance to T Cell–Mediated Immunotherapy. Cancer Discov. 2016, 6, 202–216. [Google Scholar] [CrossRef]
  19. Vidotto, T.; Melo, C.M.; Castelli, E.; Koti, M.; Dos Reis, R.B.; Squire, J.A. Emerging role of PTEN loss in evasion of the immune response to tumours. Br. J. Cancer 2020, 122, 1732–1743. [Google Scholar] [CrossRef] [PubMed]
  20. Sahin, T.K.; Berghoff, A.S.; Ilhan-Mutlu, A.; Preusser, M.; Kiesel, B. The role of PTEN in the tumor microenvironment and its implications for immunotherapy. Nat. Rev. Clin. Oncol. 2021, 18, 535–536. [Google Scholar]
  21. Anastasaki, C.; Orozco, P.; Gutmann, D.H. RAS and beyond: The many faces of the neurofibromatosis type 1 protein. Dis. Model. Mech. 2022, 15, dmm049362. [Google Scholar] [CrossRef] [PubMed]
  22. Ratner, N.; Miller, S.J. A RASopathy gene commonly mutated in cancer: The neurofibromatosis type 1 tumour suppressor. Nat. Rev. Cancer 2015, 15, 290–301. [Google Scholar] [CrossRef] [PubMed]
  23. Huntzicker, E.G.; Hötzel, K.; Choy, L.; Che, L.; Ross, J.; Pau, G.; Sharma, N.; Siebel, C.W.; Chen, X.; French, D.M. Differential effects of targeting Notch receptors in a mouse model of liver cancer. Hepatology 2014, 61, 942–952. [Google Scholar] [CrossRef]
  24. Xing, L.; Xu, L.; Zhang, Y.; Che, Y.; Wang, M.; Shao, Y.; Qiu, D.; Yu, H.; Zhao, F.; Zhang, J. Recent Insight on Regulations of FBXW7 and Its Role in Immunotherapy. Front. Oncol. 2022, 12, 925041. [Google Scholar] [CrossRef] [PubMed]
  25. Zhong, L.; Zhang, Y.; Li, M.; Song, Y.; Liu, D.; Yang, X.; Yang, D.; Qu, H.; Lai, L.; Wang, Q.; et al. E3 ligase FBXW7 restricts M2-like tumor-associated macrophage polarization by targeting c-Myc. Aging 2020, 12, 24394–24423. [Google Scholar] [CrossRef]
  26. O’Donnell, J.S.; Teng, M.W.L.; Smyth, M.J. Cancer immunoediting and resistance to T cell-based immunotherapy. Nat. Rev. Clin. Oncol. 2019, 16, 151–167. [Google Scholar] [CrossRef]
  27. Lastwika, K.J.; Wilson, W.; Li, Q.K.; Norris, J.; Xu, H.; Ghazarian, S.R.; Kitagawa, H.; Kawabata, S.; Taube, J.M.; Yao, S.; et al. Control of PD-L1 Expression by Oncogenic Activation of the AKT–mTOR Pathway in Non–Small Cell Lung Cancer. Cancer Res. 2016, 76, 227–238. [Google Scholar] [CrossRef]
  28. Caforio, M.; de Billy, E.; De Angelis, B.; Iacovelli, S.; Quintarelli, C.; Paganelli, V.; Folgiero, V. PI3K/Akt Pathway: The Indestructible Role of a Vintage Target as a Support to the Most Recent Immunotherapeutic Approaches. Cancers 2021, 13, 4040. [Google Scholar] [CrossRef] [PubMed]
  29. Cartwright, D.; Kidd, A.C.; Ansel, S.; Ascierto, M.L.; Spiliopoulou, P. Oncogenic Signalling Pathways in Cancer Immunotherapy: Leader or Follower in This Delicate Dance? Int. J. Mol. Sci. 2025, 26, 4393. [Google Scholar] [CrossRef]
  30. Collins, N.B.; Al Abosy, R.; Miller, B.C.; Bi, K.; Zhao, Q.; Quigley, M.; Ishizuka, J.J.; Yates, K.B.; Pope, H.W.; Manguso, R.T.; et al. PI3K activation allows immune evasion by promoting an inhibitory myeloid tumor microenvironment. J. Immunother. Cancer 2022, 10, e003402. [Google Scholar] [CrossRef]
  31. Leone, R.D.; Powell, J.D. Metabolism of immune cells in cancer. Nat. Rev. Cancer 2020, 20, 516–531. [Google Scholar] [CrossRef]
  32. Samstein, R.M.; Lee, C.H.; Shoushtari, A.N.; Hellmann, M.D.; Shen, R.; Janjigian, Y.Y.; Barron, D.A.; Zehir, A.; Jordan, E.J.; Omuro, A.; et al. Tumor mutational load predicts survival after immunotherapy. Nat. Genet. 2019, 51, 202–206. [Google Scholar] [CrossRef] [PubMed]
  33. Schuck, P.F.; Malgarin, F.; Cararo, J.H.; Cardoso, F.; Streck, E.L.; Ferreira, G.C. Phenylketonuria Pathophysiology: On the Role of Metabolic Alterations. Aging Dis. 2015, 6, 390–399. [Google Scholar] [CrossRef]
  34. Vaupel, P.; Multhoff, G. Overcoming the Hostile Tumor Microenvironment: Obstacles to Successful Immunotherapy. Front. Oncol. 2021, 11, 683. [Google Scholar]
  35. Stover, D.G.; Parsons, H.A.; Ha, G.; Freeman, S.S.; Barry, W.T.; Guo, H.; Choudhury, A.D.; Gydush, G.; Reed, S.C.; Rhoades, J.; et al. Association of Cell-Free DNA Tumor Fraction and Somatic Copy Number Alterations with Survival in Metastatic Triple-Negative Breast Cancer. JAMA Oncol. 2018, 4, e173501. [Google Scholar] [CrossRef]
  36. McGranahan, N.; Furness, A.J.S.; Rosenthal, R.; Ramskov, S.; Lyngaa, R.; Saini, S.K.; Jamal-Hanjani, M.; Wilson, G.A.; Birkbak, N.J.; Hiley, C.T.; et al. Clonal neoantigens elicit T cell immunoreactivity and sensitivity to immune checkpoint blockade. Science 2016, 351, 1463–1469. [Google Scholar] [CrossRef]
  37. Vitale, I.; Shema, E.; Loi, S.; Galluzzi, L. Intratumoral heterogeneity in cancer progression and response to immunotherapy. Nat. Med. 2021, 27, 212–224. [Google Scholar] [CrossRef]
  38. Welcker, M.; Clurman, B.E. FBW7 ubiquitin ligase: A tumour suppressor at the crossroads of cell division, growth and differentiation. Nat. Rev. Cancer 2008, 8, 83–93. [Google Scholar] [CrossRef] [PubMed]
  39. Davis, R.J.; Welcker, M.; Clurman, B.E. Tumor Suppression by the Fbw7 Ubiquitin Ligase: Mechanisms and Opportunities. Cancer Cell 2014, 26, 455–464. [Google Scholar] [CrossRef] [PubMed]
  40. Yeh, C.H.; Bellon, M.; Nicot, C. The Fbxw7 Tumor Suppressor: Mechanisms and Opportunities for Therapeutics. Annu. Rev. Cancer Biol. 2018, 2, 263–281. [Google Scholar]
  41. Mao, J.H.; Kim, I.J.; Wu, D.; Climent, J.; Kang, H.C.; DelRosario, R.; Balmain, A. Fbxw7 targets mTOR for degradation and cooperates with PTEN in tumor suppression. Science 2008, 321, 1499–1502. [Google Scholar] [CrossRef]
  42. Gandara, D.R.; Paul, S.M.; Kowanetz, M.; Schleifman, E.; Zou, W.; Li, Y.; Rittmeyer, A.; Fehrenbacher, L.; Otto, G.; Malboeuf, C.; et al. Blood-based tumor mutational burden as a predictor of clinical benefit in non-small-cell lung cancer patients treated with atezolizumab. Nat. Med. 2018, 24, 1441–1448. [Google Scholar] [CrossRef] [PubMed]
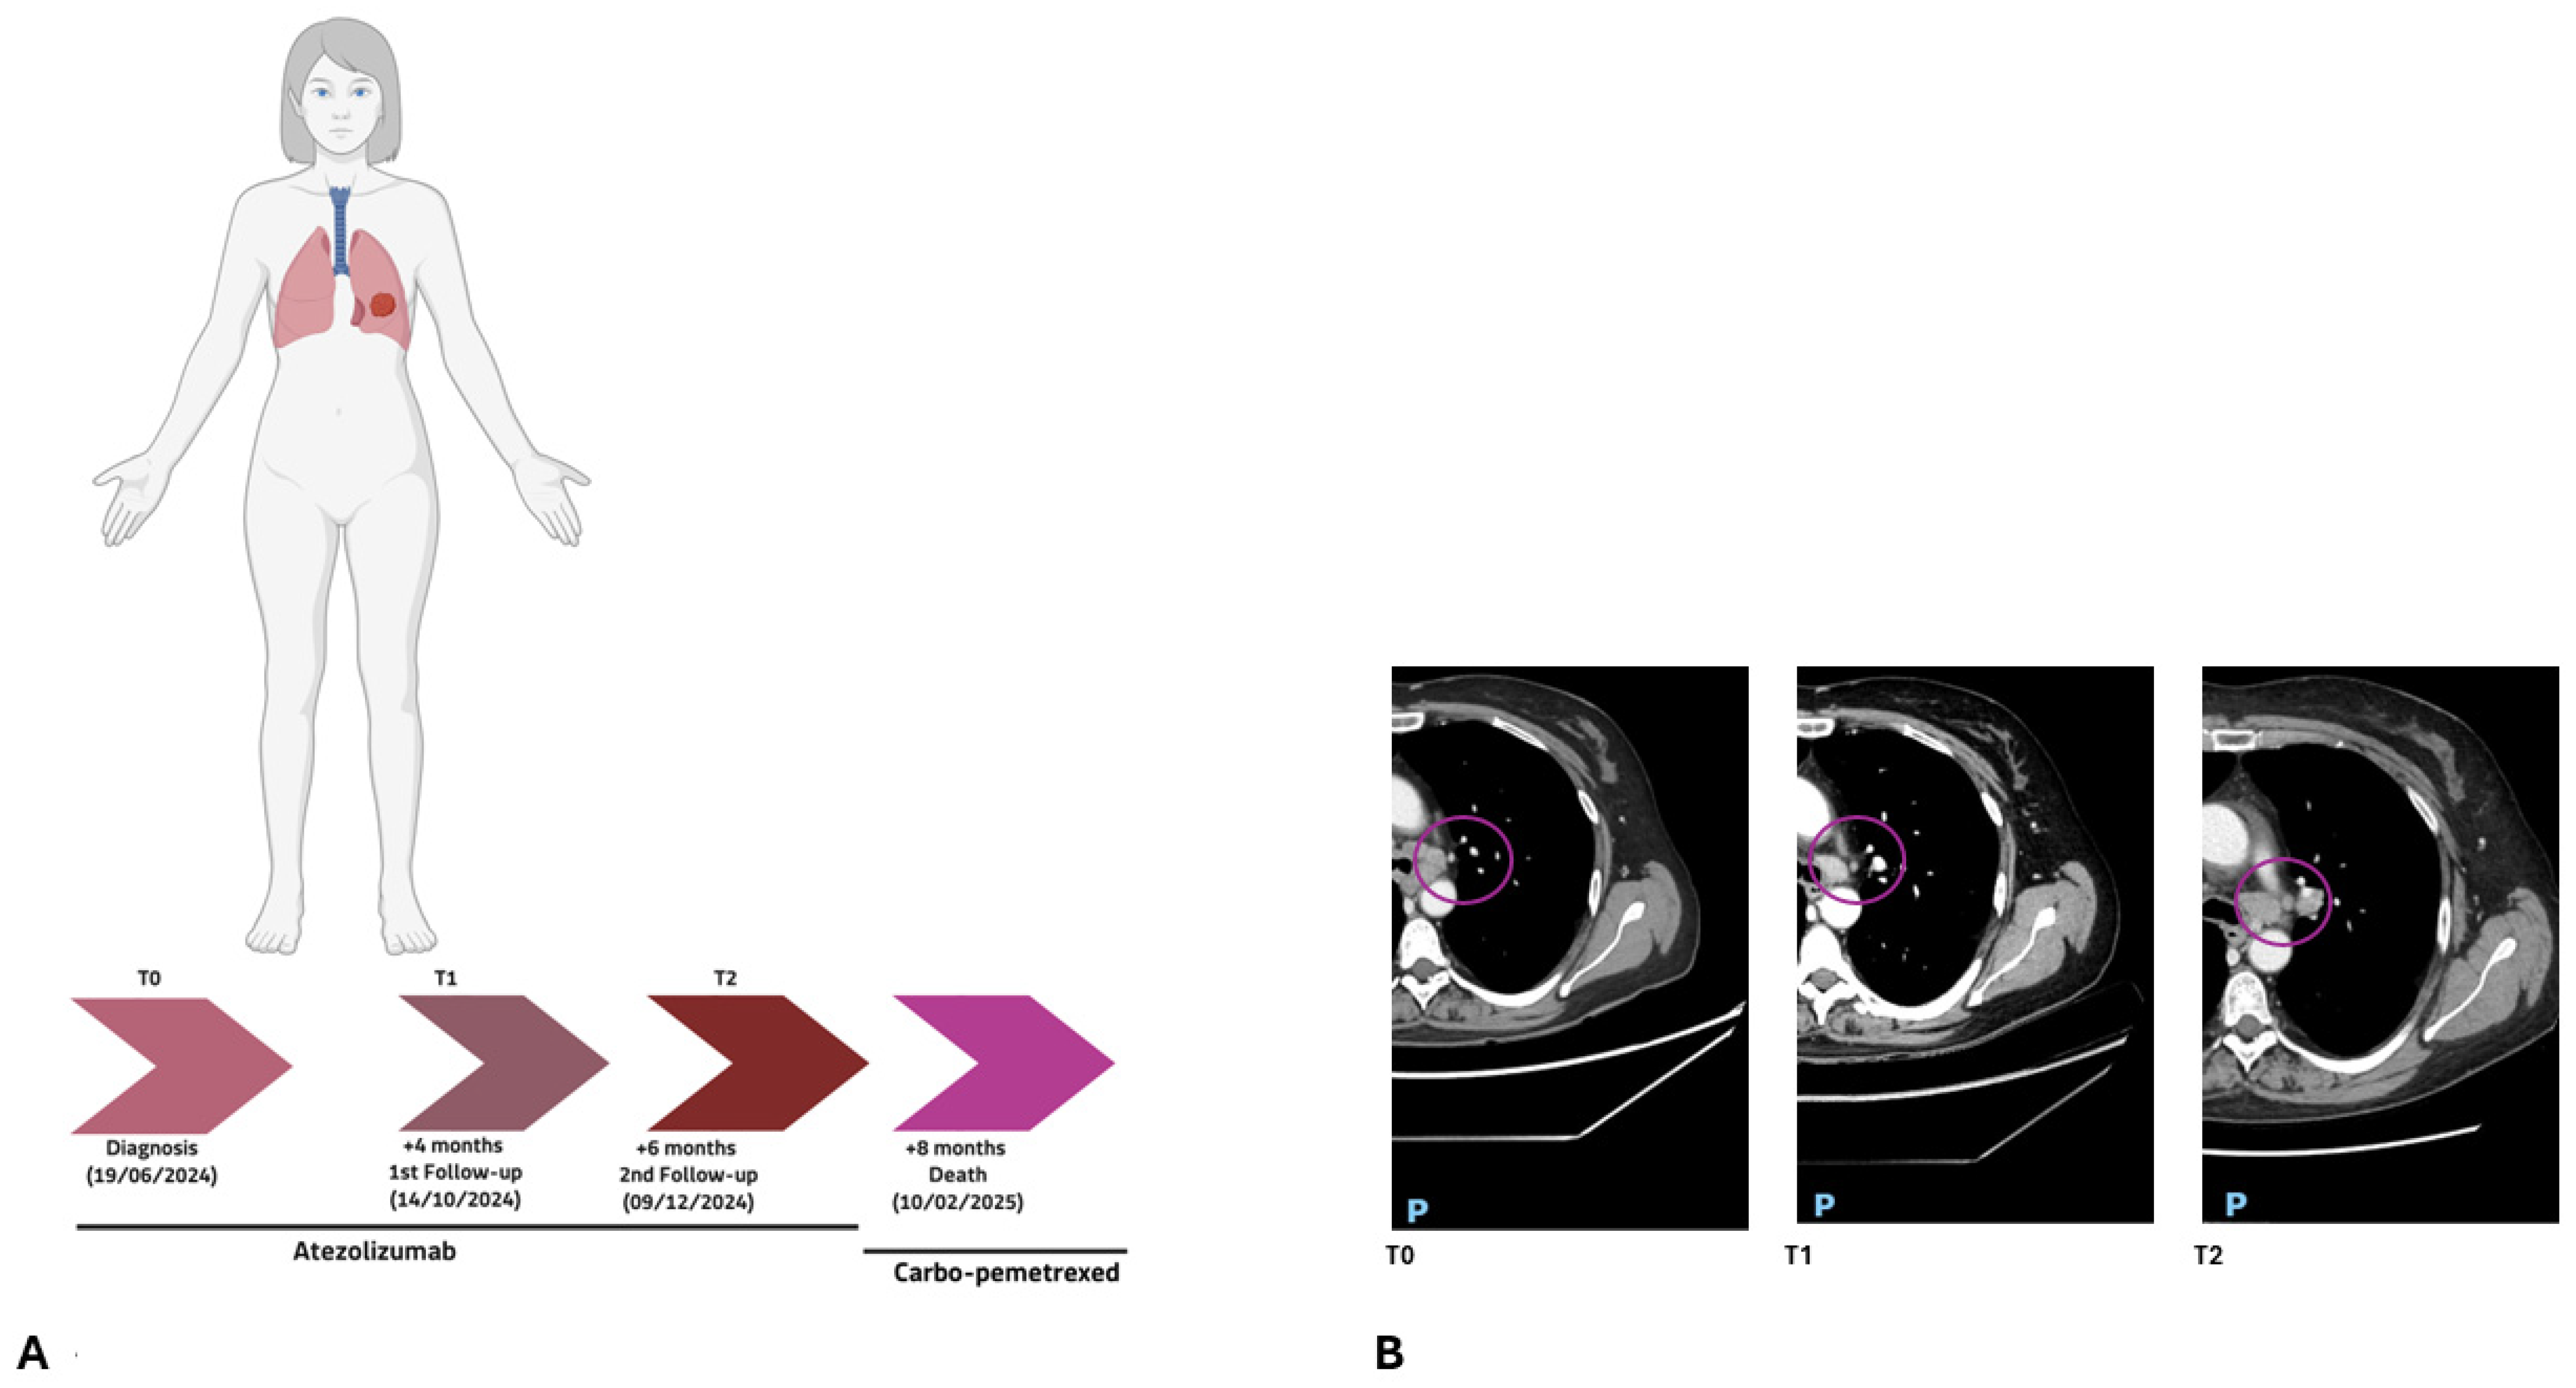
Figure 1. (A) 66/24 patient clinical timeline showing the NSCLC diagnosis, treatment with atezolizumab, and subsequent follow-ups. (B) CT scans at baseline (T0), first follow-up (T1), and second follow-up (T2), confirming a first response and subsequent lack of response to immunotherapy. The purple circle outlines the lung tumor mass. Anatomical orientations are indicated as P (posterior).
Ijms 27 02947 g001
Figure 2. (A) Longitudinal monitoring of patient 66/24 under atezolizumab treatment. At T0 (baseline), three different expanded clones have been identified. At the first follow-up (T1), 4 months after, the cfDNA analysis showed a decrease in their VAF. Subsequently, after 2 more months, the previous clones were expanded again, gaining two new mutated clones in the PTEN and KIF1A genes. A different color represents each clone. (Source: ChrisMiller fishplot-R) (B) Clonal evolution plot illustrating the variant allele frequencies (VAFs) of somatic clones detected during longitudinal cfDNA monitoring (T0, T1, T2) under atezolizumab treatment.
Ijms 27 02947 g002
Figure 3. (A) 111/24 patient clinical timeline showing the NSCLC diagnosis, treatment with atezolizumab, and subsequent follow-ups. (B) 111/24 Patient CT scans at baseline (T0), at first follow-up (T1), and at second follow-up (T2), confirming a response to immunotherapy. The light-blue circle outlines the lung tumor mass. Anatomical orientations are indicated as P (posterior).
Ijms 27 02947 g003
Figure 4. (A) 111/24 fishplot depicting the clonal architecture and dynamics inferred from the three-point liquid biopsy analysis. At the baseline (T0), three distinct expanded clones were identified. After 2 months (T1), cfDNA analysis showed a reduction in their VAFs, with the appearance of three new mutated clones in the FBXW7, PTEN and TP53 genes. Three months later, we observed a complete response to treatment with no detectable variants. A different color represents each clone. (Source: ChrisMiller fishplot-R). (B) Clonal evolution plot illustrating the variant allele frequencies (VAFs) of somatic clones detected during longitudinal cfDNA monitoring (T0, T1, T2) under atezolizumab treatment.
Ijms 27 02947 g004
Figure 5. (A) Timeline illustrating the clinical course of patient 49/24. (B) 49/24 patient CT scans at baseline (T0) and at first follow-up (T1), confirming a no-response to immunotherapy. The red circle outlines the lung tumor mass. Anatomical orientations are indicated as P (posterior).
Ijms 27 02947 g005
Figure 6. (A) Fishplot representation of clonal dynamics during treatment. Fishplot illustrating the temporal evolution of tumor clones in patient 49/24 across treatment timepoints. A different color represents each clone. (Source: ChrisMiller fishplot-R). (B) Variant allele frequency (VAF) dynamics of TP53, PIK3CA, and FBXW7 clones in longitudinal analysis of cfDNA.
Ijms 27 02947 g006
Figure 7. (A) Timeline illustrating the clinical course of Patient 151/24. (B) Patient 151/24 CT scans at baseline (T0) and at first follow-up (T1), confirming no-response to immunotherapy. The orange circle outlines the lung tumor mass, which was increasing in size. Anatomical orientations are indicated as P (posterior).
Ijms 27 02947 g007
Figure 8. (A) Fishplot illustrating the longitudinal clonal dynamics of Patient 151/24 during immunotherapy. At baseline (T0), the genomic landscape was characterized by clonal variants in PAH, SLC7A9, TP53, and BRCA1. At the first follow-up (T1, 2 months), despite ongoing immunotherapy, the PAH variant increased in allele frequency. Additionally, new low-frequency alterations emerged in EGFR and BRAF, suggesting early subclonal diversification under treatment pressure. A different color represents each clone. (Source: ChrisMiller fishplot-R). (B) Variant allele frequency (VAF) dynamics of PAH, SLC7A9, TP53, BRCA1, EGFR and BRAF clones. At T0, the genomic landscape was characterized by clonal variants in PAH (c.1208C>T), SLC7A9 (c.544G>A), TP53 (c.734G>A), and BRCA1 (c.1016del). At T1, an increase in the PAH variant VAF was observed. Additionally, novel subclonal alterations emerged in EGFR (c.1393G>A) and BRAF (c.1773_1774del).
Ijms 27 02947 g008
Table 1. Characteristics of metastatic NSCLC patients treated with first-line atezolizumab.
Patient IDAge at DiagnosisSexSmoking StatusHistology and Stage PD-L1 ExpressionInitial Systemic
Therapy
ResponseAliveAvailable LB TimepointsTissue Molecular Analysis
66/2455FCurrent SmokerMetastatic Adenocarcinoma60%Atezolizumab monotherapyResponse and resistanceNoT0, T1, T2ALK negative; EGFR negative
111/2468MCurrent SmokerMetastatic Adenocarcinoma90%Atezolizumab monotherapyResponderYesT0, T1, T2KRAS
(p.Gly13Asp)
48%
49/2472MCurrent SmokerMetastatic Adenocarcinoma90%Atezolizumab monotherapy, switched to carbotaxolNon-responderNoT0, T2NA
151/2469FFormer SmokerMetastatic Adenocarcinoma90%Atezolizumab monotherapy (later discontinued), switched to carbo + pemetrexedNon-responderNoT0, T1ERBB2
(p.Ile655Val)
24%
NA = Not Available.
Disclaimer/Publisher’s Note: The statements, opinions and data contained in all publications are solely those of the individual author(s) and contributor(s) and not of MDPI and/or the editor(s). MDPI and/or the editor(s) disclaim responsibility for any injury to people or property resulting from any ideas, methods, instructions or products referred to in the content.